
 Submit a Paper
 Propose a Special lssue
 Open Access
ARTICLE

Electric Vehicle Charging Load Optimization Strategy Based on Dynamic Time-of-Use Tariff
Key Laboratory of Smart Grid of Education Ministry, Tianjin University, Tianjin, 300072, China
* Corresponding Author: Yanbo Che. Email:
Energy Engineering 2024, 121(3), 603-618. https://doi.org/10.32604/ee.2023.044667
Received 05 August 2023; Accepted 10 October 2023; Issue published 27 February 2024
 View Full Text
 Download PDF
Abstract
Electric vehicle (EV) is an ideal solution to resolve the carbon emission issue and the fossil fuels scarcity problem in the future. However, a large number of EVs will be concentrated on charging during the valley hours leading to new load peaks under the guidance of static time-of-use tariff. Therefore, this paper proposes a dynamic time-of-use tariff mechanism, which redefines the peak and valley time periods according to the predicted loads using the fuzzy C-mean (FCM) clustering algorithm, and then dynamically adjusts the peak and valley tariffs according to the actual load of each time period. Based on the proposed tariff mechanism, an EV charging optimization model with the lowest cost to the users and the lowest variance of the grid-side load as the objective function is established. Then, a weight selection principle with an equal loss rate of the two objectives is proposed to transform the multi-objective optimization problem into a single-objective optimization problem. Finally, the EV charging load optimization model under three tariff strategies is set up and solved with the mathematical solver GROUBI. The results show that the EV charging load optimization strategy based on the dynamic time-of-use tariff can better balance the benefits between charging stations and users under different numbers and proportions of EVs connected to the grid, and can effectively reduce the grid load variance and improve the grid load curve.Keywords
In recent years, environmental issues have become increasingly prominent. According to the statistics, the transportation industry accounts for about 27% of total energy consumption, resulting in about 25% of the world’s carbon dioxide emissions [1]. As a kind of energy-saving and emission-reducing transportation, the electric vehicle industry is developing rapidly to help achieve carbon peaking and carbon neutrality goals [2]. However, the random connection of large-scale EVs to the grid may cause peak load growth of the system, thus affecting the safety and economic operation of the power system [3–5]. The EV charging tariff integrates each participant in the electricity market, guiding users to choose the right time period for charging through price signals, thus ensuring the overall balance of benefits [6]. Therefore, it is important to study and develop a reasonable charging tariff to effectively guide users’ charging behavior and reduce the negative impact of disorderly charging of EVs.
The role of static time-of-use tariffs and dynamic tariffs in guiding the behavior of electric vehicles has been studied [7]. In terms of static time-of-use tariff, reference [8] established a multi-objective optimal scheduling model for centralized charging of EVs based on static time-of-use tariff with minimization of charging cost and daily power loss, and maximization power delivery as objective functions; Reference [9] proposed a game-theoretical model based on a Stackelberg formulation to capture the interactions between the fleet operator and electric vehicle owners; Reference [10] proposed an EV online charging scheduling strategy, which could reduce charging cost and load peak. However, based on the static time-of-use tariff, when large-scale EVs are connected to the grid, the phenomenon of “peak to peak” may occur due to the mismatch between peak and valley tariffs and peak and valley loads, and what is worse, it may lead to the clustering effect of electric vehicles, which will generate new load peaks [11,12].
In terms of dynamic tariffs, scholars have researched the dynamic optimization of peak and valley periods and the dynamic adjustment of tariffs. Reference [13] integrated the charging navigation strategy of EVs and the optimal time-of-use pricing of charging stations into a Stackelberg game to maximize charging stations’ revenue; Reference [14] proposed an orderly charging approach based on the EVs’ optimal time-of-use pricing demand response, which utilized a fuzzy clustering approach to scientifically classify the load period; Reference [15] proposed a two-stage dynamic optimization strategy for time-of-use tariff, which divided peak and valley hours for each vehicle individually based on vehicle information; Reference [16] proposed a methodology for time-of-use tariff estimation to provide optimal demand-side management using EVs with big data technology. The above studies have proposed some dynamic optimization methods for peak and valley hours, but the charging tariff does not adjust to load changes, which may lead to the generation of new load peaks.
References [17,18] established a dynamic tariff adjustment model that divided the tariff into a fixed component and a variable component; Reference [19] divided dynamic pricing into punishment pricing and incentive pricing; Reference [20] established a quarter-hourly vehicle-to-grid dynamic time-sharing pricing model based on deep deterministic policy gradient reinforcement learning algorithm; Reference [21] provided a detailed introduction to a dynamic electricity pricing mechanism, but the calculation of the elasticity coefficient matrix is complex and difficult to implement in practical application. The above literature studied the dynamic tariff adjustment mechanism, but ignored the guiding effect of the peak and valley hours characteristics of the time-of-use tariff on the charging behavior of EVs, and lacked the theoretical derivation of the tariff adjustment mechanism and the basis for key parameter selection.
The paper is structured into five sections. The first section is the introduction. The dynamic time-of-use tariff model is first proposed in Section 2, including the background and meaning of the tariff mechanism, and gives the calculation method of relevant parameters through segmental linearization processing. Then, based on the tariff mechanism, an EV charging load optimization model is established in Section 3. The model takes the lowest user charging cost and the smallest variance of grid-side load as the objective functions, and a multi-objective function processing method based on the principle of minimizing the loss rate of both objectives’ interests is proposed to solve the model. In Section 4, the simulation results show that the tariff mechanism can effectively reduce the grid-side load variance and balance the interests between charging stations and users, achieving a win-win situation for the grid, charging stations, and users. Section 5 summarizes the conclusion and gives the future prospects.
2 Dynamic Time-of-Use Tariff Modeling
The static time-of-use tariff to guide the charging behavior of EVs may lead to a clustering effect when the tariff is low, which may result in a new load peak, namely the “anti-peak” phenomenon. Therefore, charging stations, as the price setters and suppliers of EV charging power, should develop a more reasonable tariff mechanism to better guide the charging behavior of EV users and balance the interests of users, charging stations, and the grid [22].
The dynamic time-of-use tariff includes two time scale implications: on the daily time scale, where peak and valley hours are matched to peak and valley loads; and on the minute time scale, where peak and valley tariffs are dynamically adjusted to real-time loads. Thus, the dynamic time-of-use tariff
The dynamic time-of-use tariff modeling steps: Firstly, the load information for peak and valley time division is obtained through load forecasting and data filtering; Then, the FCM algorithm is used to segment the tariff to obtain new peak and valley times; Finally, the relationship between the tariff and the load for each time period is linearized using Taylor expansions to form the final dynamic time-of-use tariff.
2.1 Dynamic Adjustment of Peak and Valley Times
Load prediction can be divided into long-term load prediction, medium-term load prediction, and short-term load prediction according to the length of prediction time, and the commonly used prediction algorithms can be divided into linear regression algorithm, time series analysis algorithm, exponential smoothing method, and artificial neural network method, etc. In this paper, the BP neural network method is used for the short-term load prediction [23], and the predicted load
The accuracy of peak-valley times division directly affects the effect of time-of-use tariff implementation. In this paper, the fuzzy C-mean clustering algorithm (FCM) [25] is used to divide the load
where:
where:
The process of FCM algorithm is as follows: ① Initialize the clustering center
2.2 Dynamic Adjustment of Peak and Valley Tariff
According to the clustering results in Section 2.1, the valley times
The dynamic time-of-use tariff
where:
In this paper,
where:
In summary, the dynamic time-of-use tariff is:
The dynamic time-of-use tariff can both guide the EVs charging load using peak and valley times and optimize the peak and valley times based on the results of load forecasting, so that the peak and valley tariffs correspond to the peak and valley times of the load. Moreover, there is a positive correlation between the tariff and the load at each time slot, which can be dynamically adjusted according to the actual load, thus better balancing the interests between the electricity consumers and the power suppliers.
3 Charging Load Optimization Modeling
Considering from the user side, the lowest user charging cost is the objective function, the smaller the user charging cost, the higher the user satisfaction and participation. The user charging cost is:
where:
Considering the grid side, the minimum load mean squared error is the objective function, and the smaller the load variance is, the smoother the grid operation is. The load variance is:
where:
According to the dynamic time-of-use tariff model presented in Section 2, the relationship between the tariff and EVs charging power should satisfy:
Considering the operating costs of charging stations and the acceptability of charging costs for users, the range of EV charging tariff is:
where:
3.2.2 Electric Vehicle Charging Demand Constraints
Considering from a long-term perspective, the daily charging demand of EVs is determined by the daily driving mileage, so the daily charging amount should satisfy:
where:
3.2.3 Electric Vehicle Charging Time Constraints
For different types of EVs, due to the different nature of work, travel habits and other factors, and thus their rechargeable time period is different, under the premise of meeting the charging needs of EVs:
where:
If an EV cannot meet the minimum daily charging demand during the rechargeable time period, it does not participate in charging optimization scheduling, i.e., it is always in charging mode during the rechargeable time period.
3.2.4 The Number of Charging Piles Constraints
The number of charging posts in charging stations is limited and it is difficult to satisfy all EVs charging at the same time, so the number of EVs charging at t-moment should satisfy:
where:
3.3 Multi-Objective Function Processing
The objective functions
where:
The values of objective functions
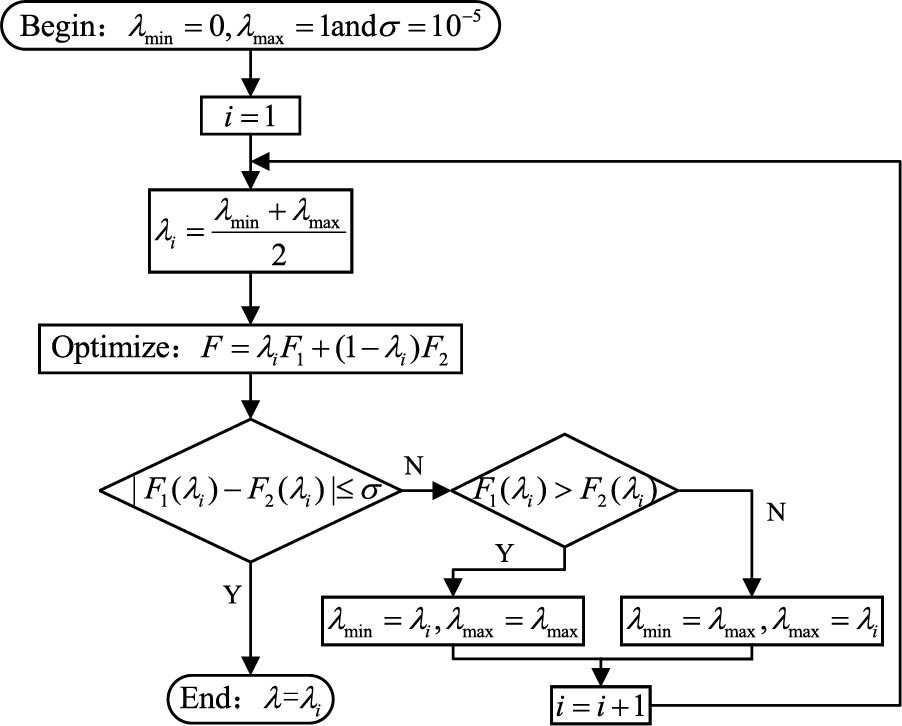
Figure 1: The method of finding the value of λ
As an example, the typical daily basic load, forecasted load, and filtered load of a region are shown in Fig. 2, and the static time-of-use tariff is shown in Table 1.
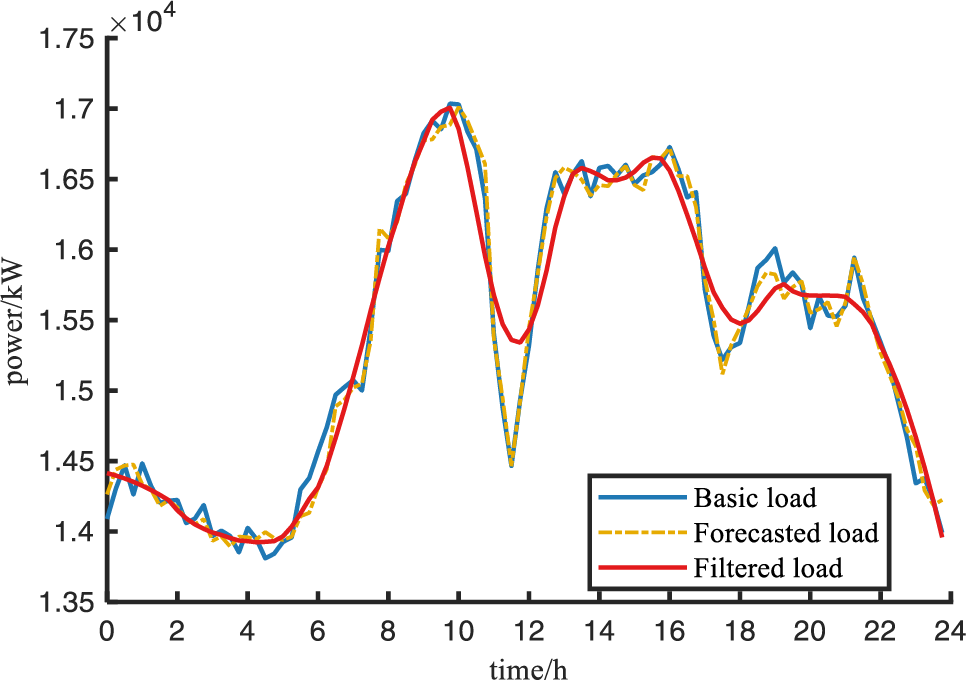
Figure 2: Basic load information

The minimum value of electric vehicle charging tariff is the baseline tariff in valley times,
Based on the base load and static time-of-use tariff of the region, the base load, base tariff and tariff adjustment factor of the dynamic time-of-use tariff were determined, and the results are shown in Table 2.

Assuming that the EVs can be divided into 3 groups after equivalence aggregation, the rechargeable time of each group is shown in Table 3 (1 means rechargeable, 0 means non-rechargeable). Group 1 represents the ‘early departure and late return type’; Group 2 represents the ‘normal work and rest type’; Group 3 represents the ‘night shift type’. According to the domestic electric vehicle sales data in 2022, the top three sales models are selected as the research objects, and the main parameters of the three groups of electric vehicles are shown in Table 4. The driving range of electric vehicles conforms to the log-normal distribution, and the probability density function of the daily driving range

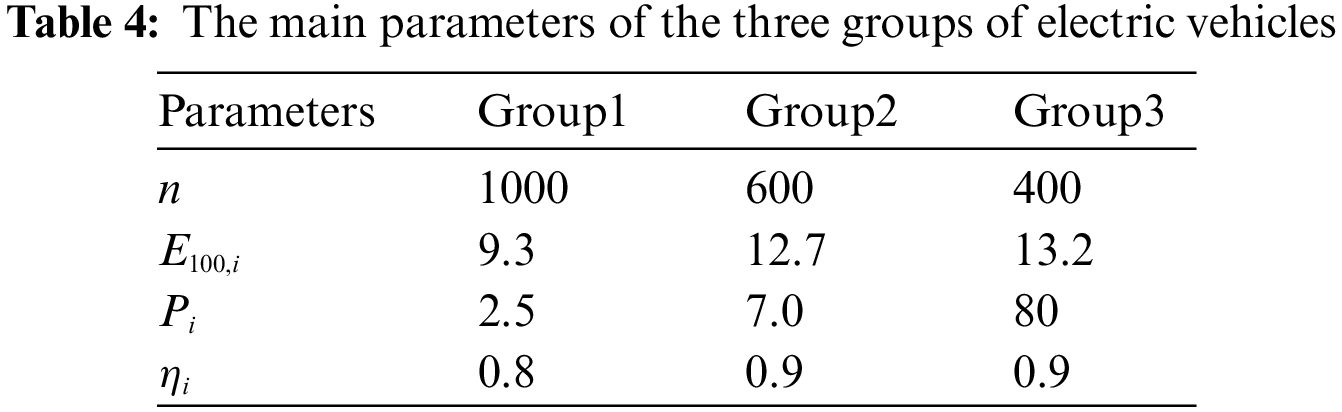
where:
Electric vehicles charging load optimization strategies based on three different tariffs:
Strategy 1: static time-of-use tariff;
Strategy 2: peak and valley time redistribution of time-of-use tariff;
Strategy 3: dynamic time-of-use tariff proposed in this paper.
According to the parameter settings in Section 3.1, the mathematical solver GUROBI is invoked to optimize the objective function F. The optimization results of EV charging load based on dynamic time-of-use tariff are obtained, and the charging load of EVs under different scenarios such as static time-of-use tariff based and peak and valley time redistribution of time-of-use tariff are analyzed and compared while ensuring the consistency of other simulation parameters. After superimposing the grid base load, the charging tariffs of EVs are shown in Fig. 3, and the changes of grid-side load curves under different scenarios are shown in Fig. 4.
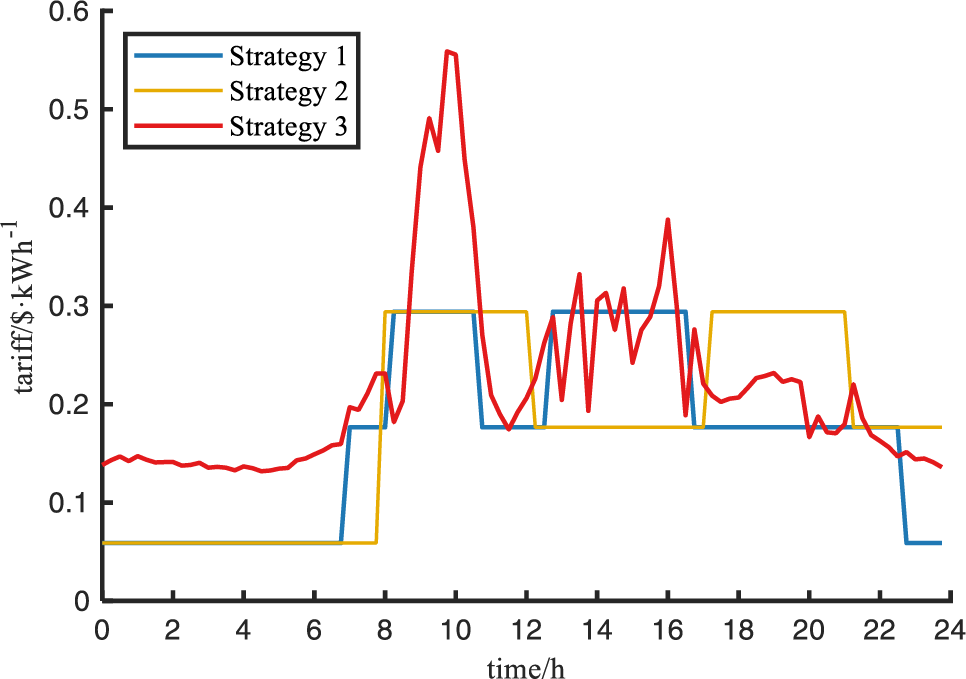
Figure 3: Electric vehicles charging tariffs
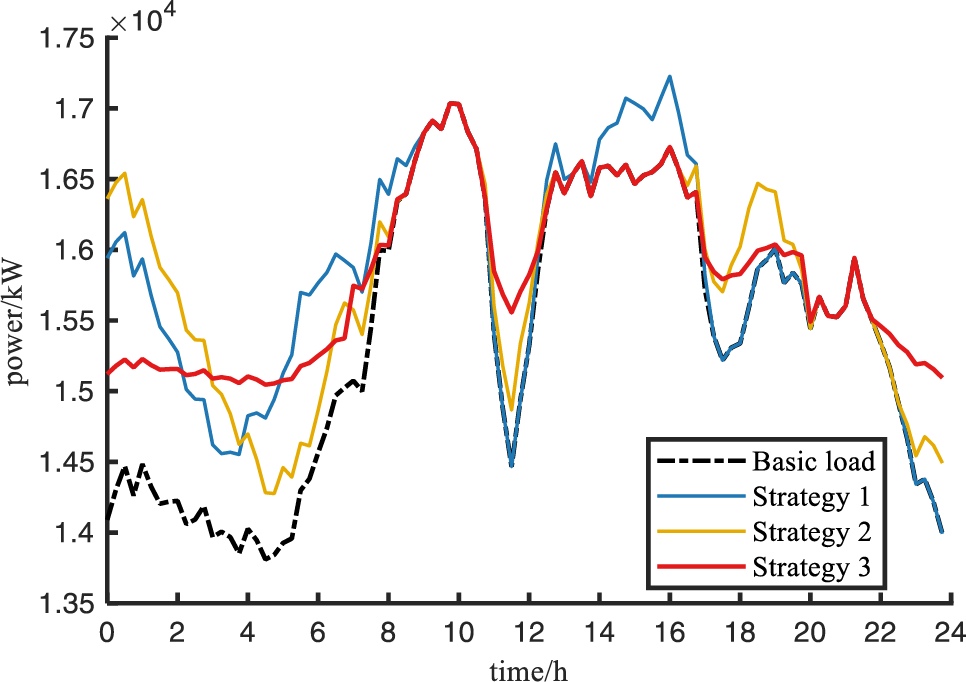
Figure 4: Load curves under different charging strategies
Under the charging mode based on Strategy 1, the peak and valley hours of the tariff do not exactly correspond to the peak and valley hours of the load, for example, during peak load hours (around 14:00–16:00), when the static time-of-use tariff is at the flat load tariff, while the load is at the peak hours, the tariff does not match the actual load, resulting in the phenomenon of “peak on peak”.
In the charging mode based on Strategy 2, the peak-valley hours of the tariff correspond to the peak-valley hours of the load, so there is no ‘peak on peak’ phenomenon. However, during the low tariff period (00:00–02:00), the phenomenon of “reverse peaking” occurs when EVs charging is concentrated.
Under the orderly charging mode based on Strategy 3, the peak and valley periods of the tariff correspond to the peak and valley periods of the load, and EVs are charged when the base load on the grid side is relatively low, which plays the role of “filling the valley” and can significantly improve the fluctuation of the load curve. Moreover, since the tariff of each period of the dynamic time-of-use tariff is positively correlated with the actual load, the tariff information can be used to prevent EVs charging at a certain period of time, thus avoiding the phenomenon of “anti-peak regulation”. As can be seen from Fig. 4, the dynamic time-of-use tariff is positively correlated with the actual load, and the EV charging tariff appropriately adjusts to the actual load on top of the base tariff, which corresponds to the peak and valley hours of the load and also increases the revenue of charging stations. For example, during the low base load hours (00:00–06:00), when a large number of electric vehicles choose to charge, the dynamic time-of-use tariff mechanism increases the charging station revenue by appropriately increasing the tariff according to the real-time load.
In order to quantitatively analyze the effectiveness of the dynamic time-of-use tariff pricing strategy in guiding and scheduling EV charging behavior, the charging station profits, user charging cost, and grid-side load variance under various charging modes were calculated, respectively, and the results are shown in Table 5.
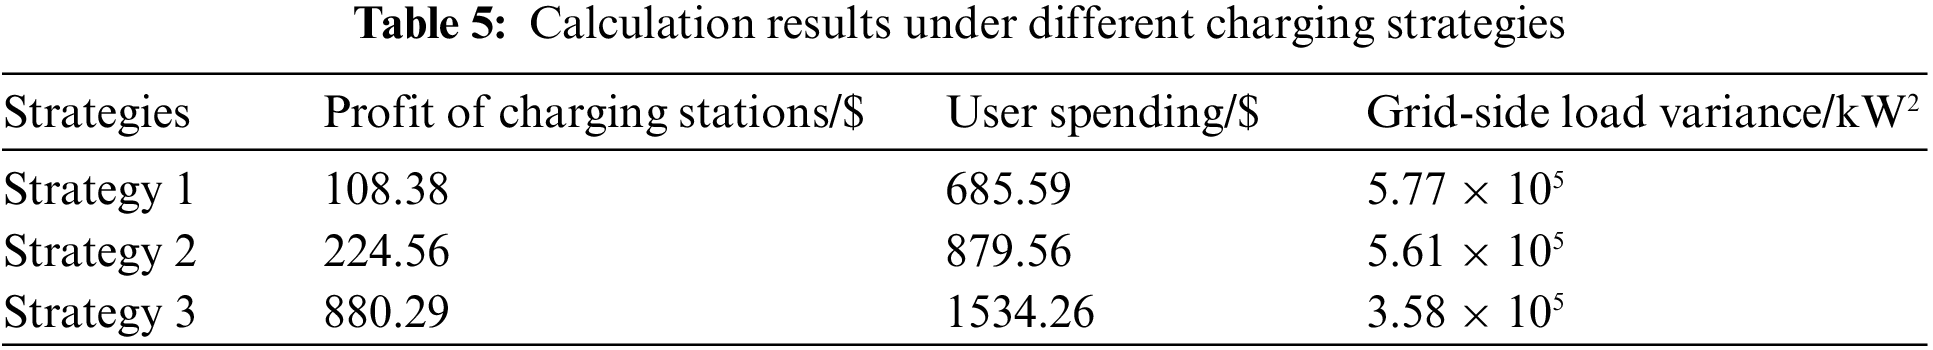
As can be seen from Table 5, in terms of users charging spending and profits of charging stations, when the charging tariff adopts Strategy 1 and Strategy 2, at this time, the user charging spending is cheap, but the profit of charging stations is very low, accounting for only 15.8% and 25.5% of the user spending. When charging optimization is based on dynamic time-of-use tariff strategy, the profit of charging station can be greatly improved, and the profit of charging station accounts for 57.4% of the user spending, which makes the increase of user charging spending smaller, but greatly increases the profit of charging station, so it can better balance the interests of both sides, and improve the enthusiasm and satisfaction of charging stations and users to participate in the optimal scheduling. In terms of improving the load fluctuation on the grid side, the dynamic time-of-use tariff strategy proposed in this paper can significantly improve the load fluctuation and reduce the load variance of the grid during the optimal scheduling of electric vehicles. Compared with Strategy 1 and Strategy 2, the charging strategy based on the dynamic time-sharing tariff can reduce the load variance of the grid to 62.0% and 63.8% of the original one, respectively, which improves the satisfaction of the grid side.
To verify the universality of the dynamic time-of-use tariff strategy proposed in this paper for guiding and scheduling the charging behavior of EVs, the optimal scheduling results under different numbers and ratios of EVs are studied separately, while ensuring the consistency of other simulation parameters.
4.3.1 Changing the Number of Electric Vehicles
Keeping the ratio of three types of EVs as 5:3:2 and changing the total number of EVs, set as 1000 and 4000, respectively, the comparison of optimization results based on different tariff strategies is shown in Fig. 5, and the calculation results of charging station profit, user spending and grid-side load variance are shown in Table 6.
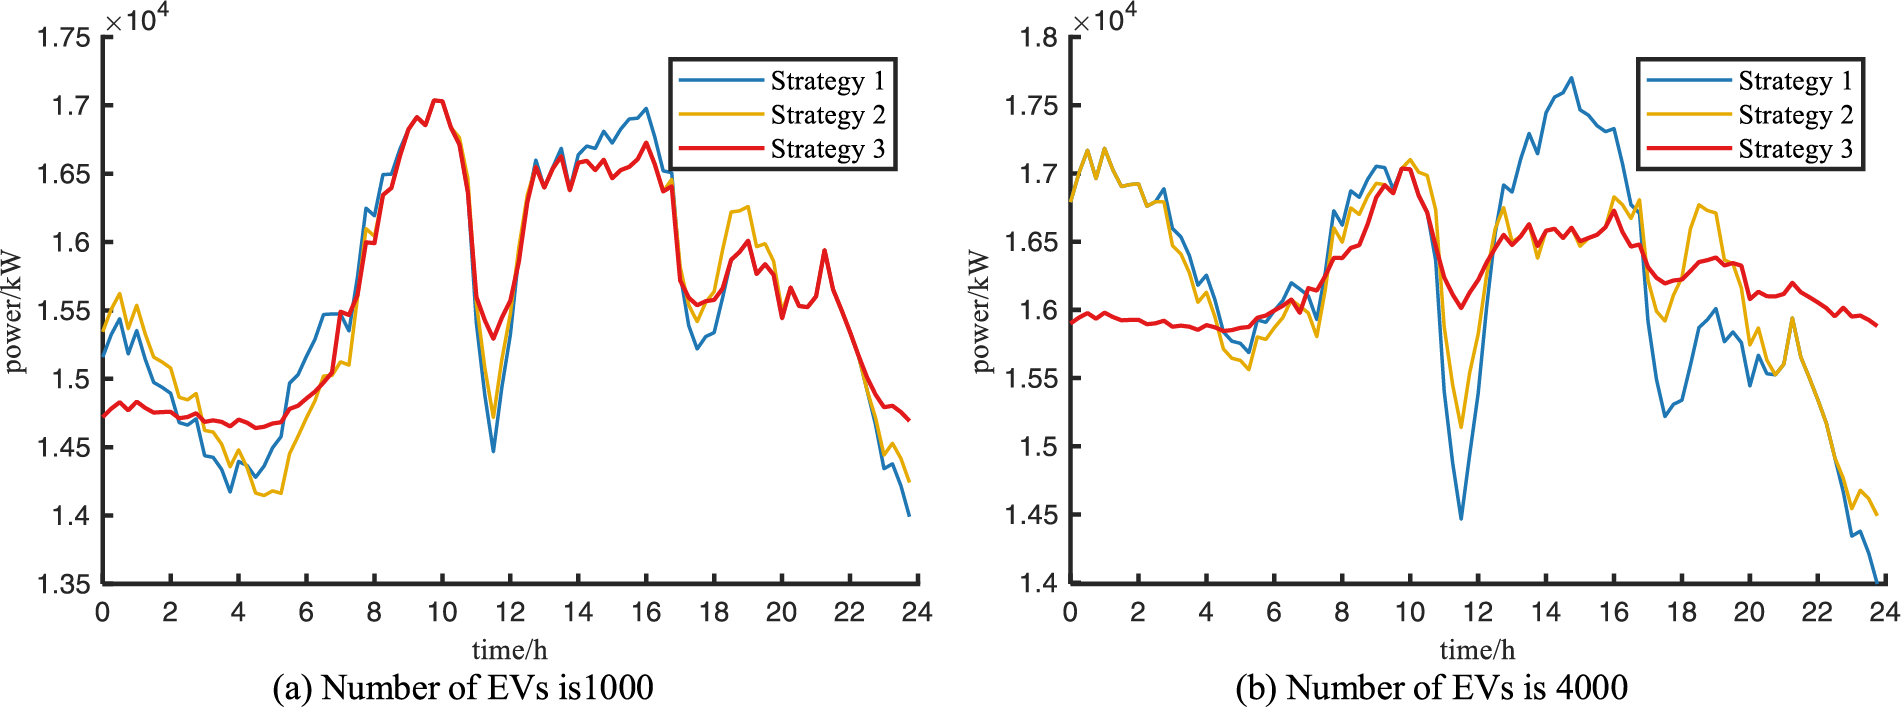
Figure 5: Load curves for changing the number of electric vehicles
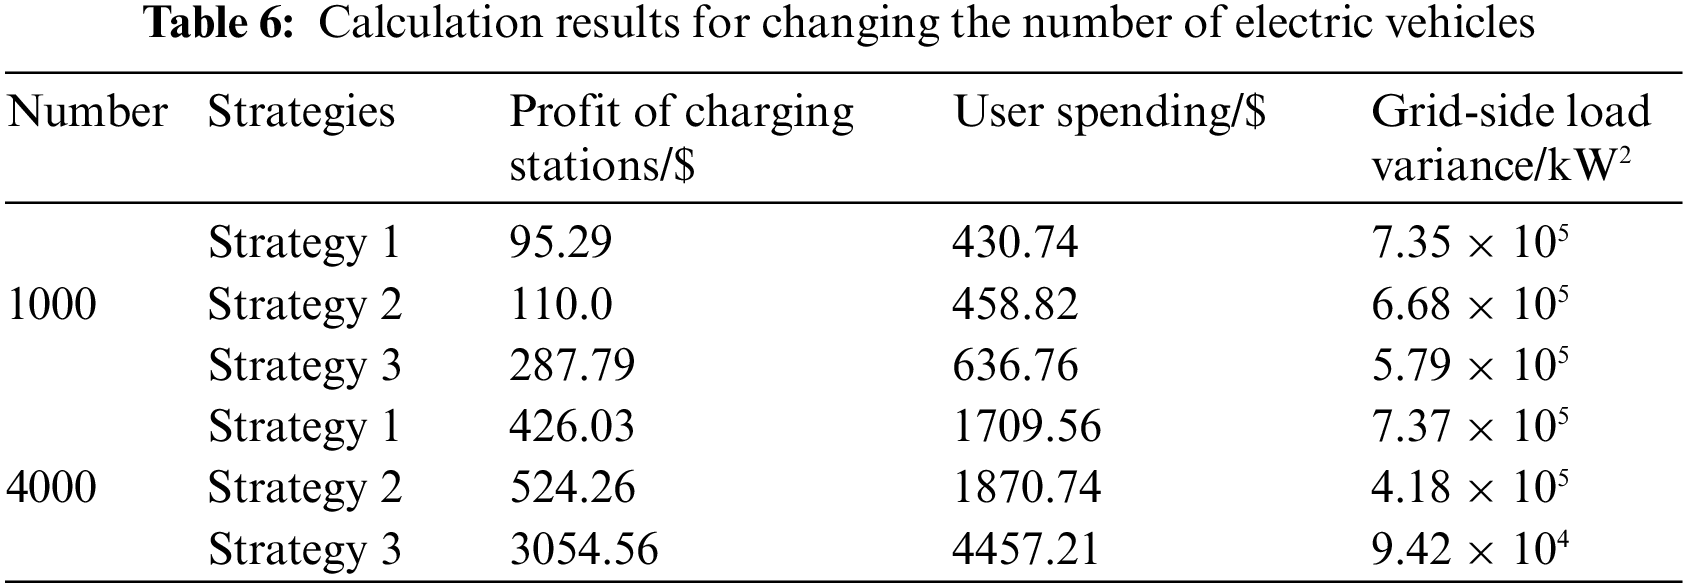
From the optimization results, it can be seen that in terms of user and charging station revenue, the dynamic time-of-use tariff is always able to balance the interests of charging stations, users and grid-side parties under different EVs quantities, and the proportion of charging stations profit to user spending is 45.2% and 68.5%, respectively. In terms of improving network-side load fluctuation, the dynamic time-of-use tariff has a significantly better effect on the charging load of different EVs than the peak-valley optimized tariff and static time-of-use tariff, and the dynamic time-of-use tariff has a more obvious effect on the charging load of EVs as the number of EVs increases, which is only 12.8% and 22.5% of the network-side variance under the static time-of-use tariff and peak-valley optimized tariff. The results show that the EV charging load optimization strategy based on dynamic time-of-use tariff is effective under different EV numbers.
4.3.2 Changing the Ratio of Electric Vehicles
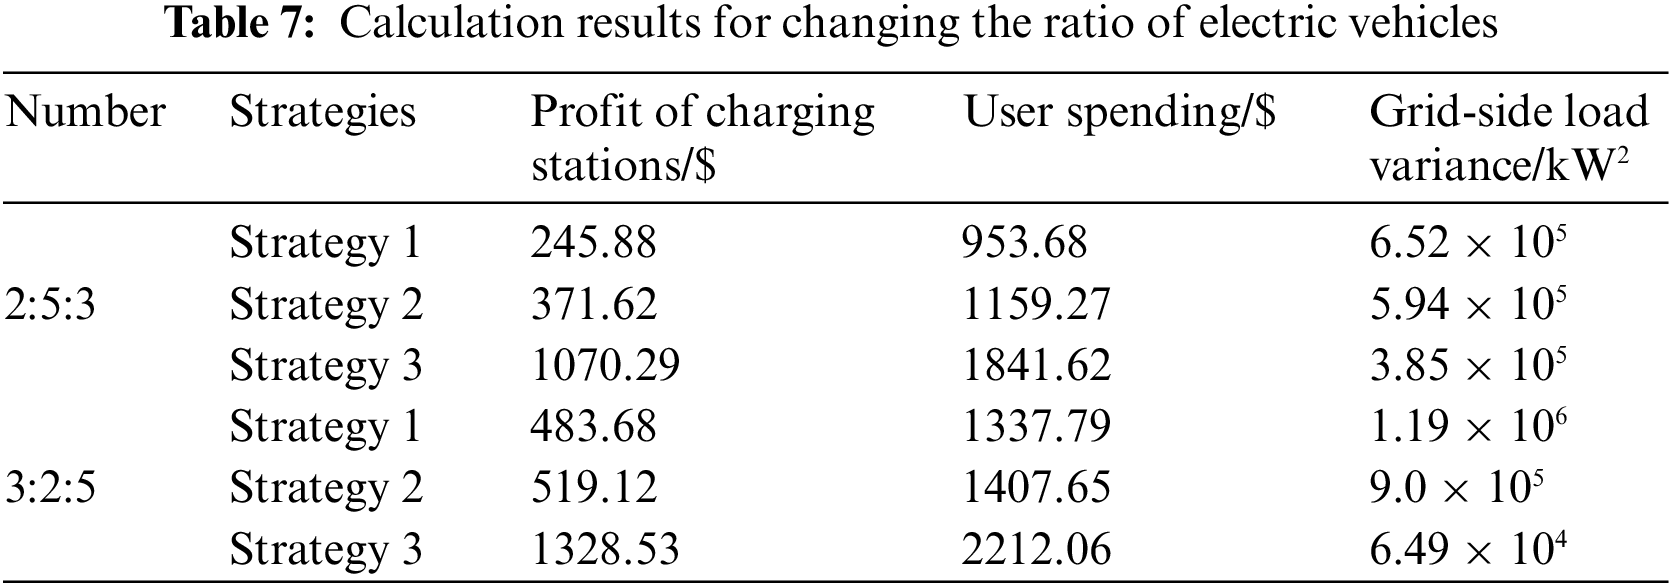
After ensuring that the total number of the three types of EVs is 2000 and changing the proportion of each type of EVs, which are set as 2:5:3 and 3:2:5, respectively, the comparison of optimization results is shown in Fig. 6, and the calculation results of charging station profit, user charging cost and grid-side load variance are shown in Table 7. Since different types of EVs have different charging demands, charging power and time periods available for charging, the final results change accordingly when the EV ratio changes. From the optimization results, it is clear that even when the proportion of EVs changes, the dynamic time-of-use tariff-based charging load optimization always improves the charging station revenue and keeps the charging station profit above 50% of the user spending; not only that, it also always keeps the grid-side variance minimal, which is the best for improving load fluctuation. The results show that the EV charging load optimization strategy based on dynamic time-of-use tariff is still effective under different EVs ratios.
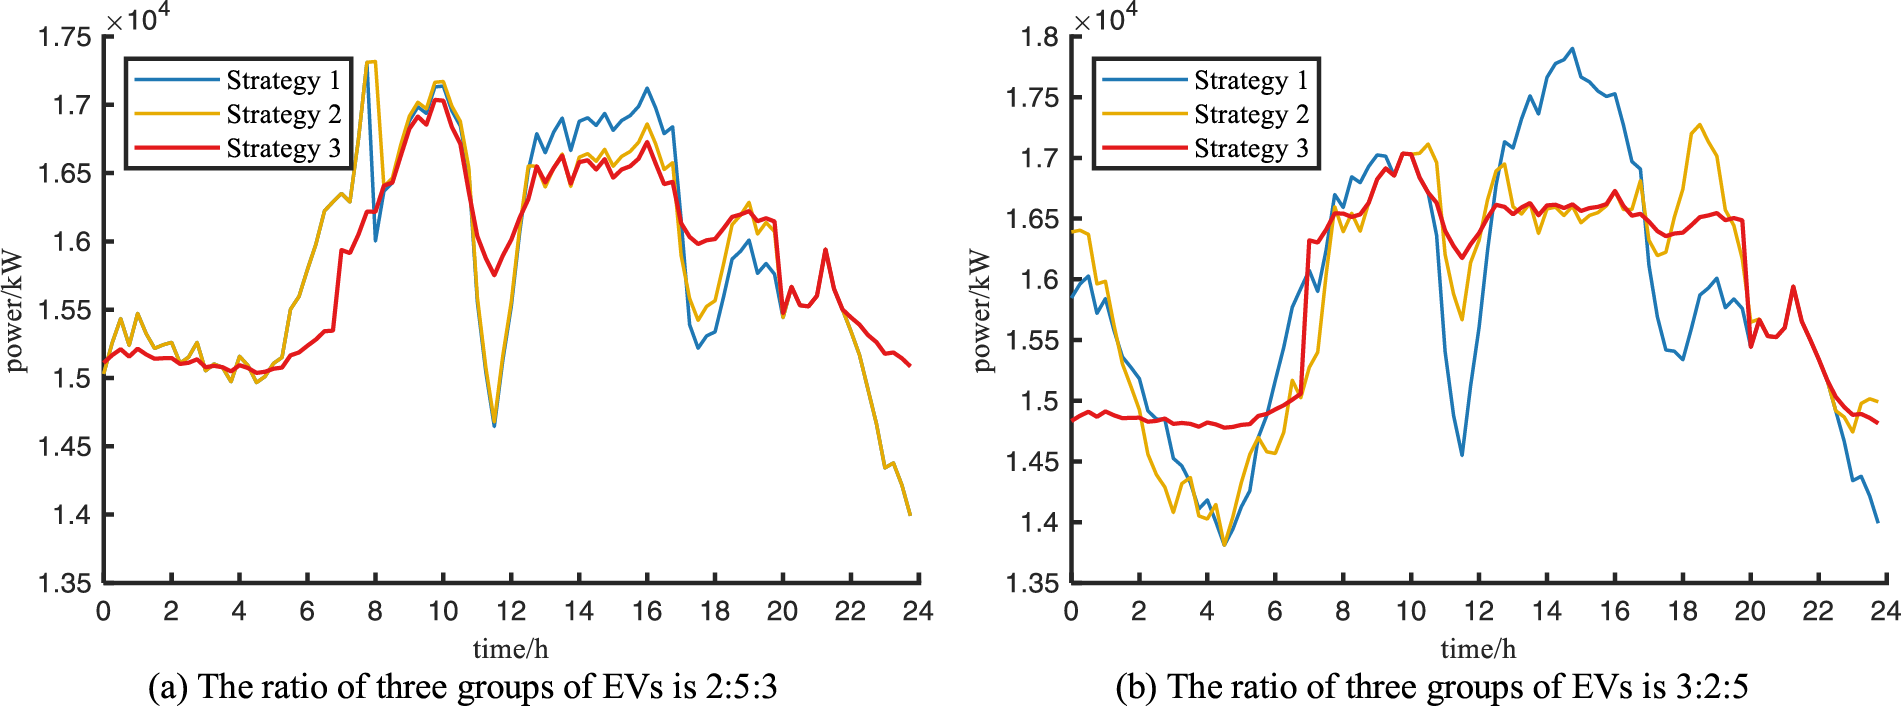
Figure 6: Load curves for changing the ratio of electric vehicles
To address the problem that the static time-of-use tariff cannot be dynamically adjusted with the actual operation status of the grid and is likely to cause new load peaks due to the concentrated charging of EVs in the valley hours, this paper proposes a dynamic time-of-use tariff pricing mechanism from the supply-side perspective, establishes a multi-objective charging load optimization model for EVs based on this mechanism, and proposes a multi-objective optimization problem processing method. Simulation of the algorithm verifies the effectiveness of the strategy, and the conclusions obtained are as follows:
(1) The dynamic time-of-use tariff proposed in this paper is regarded as a binary function of time and load, containing two meanings of daily time scale and minute time scale, which can dynamically adjust the peak and valley hours and change the tariff according to the real-time load, thus balancing the interests between charging stations, user side and grid side to achieve a win-win situation.
(2) In this paper, a multi-objective optimization problem processing method based on the principle of equal benefit loss rate of two objectives is proposed, which can convert a multi-objective optimization problem into a single-objective optimization problem. The dichotomy method is used to find the appropriate weights of the two objectives, so as to quickly find the benefit equilibrium point between the two objectives.
(3) The electric vehicle charging load optimization strategy based on dynamic time-of-use tariff can improve the profit of charging stations, reduce the user spending, and the grid-side load variance, thus achieving a win-win situation for all three parties. Moreover, it is still effective when the number and proportion of EVs change, and with the increase in the number of EVs, it is more effective in improving the load fluctuation of the power grid.
The EV charging tariff will affect users’ willingness to buy and drive, which will have an impact on carbon emissions. Therefore, the quantitative relationship between electricity price and carbon emission can be investigated in future research, and then carbon emission minimization (social benefit) can be used as another optimization objective.
Acknowledgement: This paper is supported by CHNG Science and Technology Project (HNKJ20-H54 Design and manufacture of adaptive, customised, localised autonomous controllable wind turbines, and remote sea power transmission technology).
Funding Statement: Key R&D Program of Tianjin, China (No. 20YFYSGX00060).
Author Contributions: The authors confirm contribution to the paper as follows: study conception and design: Shuwei Zhong; data collection: Shangyuan Zhang; analysis and interpretation of results: Shuwei Zhong, Yanbo Che; draft manuscript preparation: Shuwei Zhong, Shangyuan Zhang; check and revision: Yanbo Che. All authors reviewed the results and approved the final version of the manuscript.
Availability of Data and Materials: The data and materials that support the findings of this study are available from the first author, whose email is sw_zhong@tju.edu.cn, upon reasonable request.
Conflicts of Interest: The authors declare that they have no conflicts of interest to report regarding the present study.
References
1. Ajanovic, A., Haas, R. (2019). Economic and environmental prospects for battery electric and fuel cell vehicles: A review. Fuel Cells, 19(5), 515–529. [Google Scholar]
2. Ravi, S. S., Aziz, M. (2022). Utilization of electric vehicles for vehicle-to-grid services: Progress and perspectives. Energies, 15(2), 589. [Google Scholar]
3. Gan, L., Chen, X., Yu, K., Zheng, J., Du, W. (2020). A probabilistic evaluation method of household EVs dispatching potential considering users multiple travel needs. IEEE Transactions on Industry Applications, 56(5), 5858–5867. [Google Scholar]
4. Al-Ogaili, A. S., Juhana, T., Rahmat, N. A., Ramasamy, A. K., Marsadek, M. B. et al. (2019). Review on scheduling, clustering, and forecasting strategies for controlling electric vehicle charging: Challenges and recommendations. IEEE Access, 7(1), 128353–128371. [Google Scholar]
5. Shi, R., Li, S. (2019). Review on studies of V2G problem in electric vehicles. Proceedings of the CSU-EPSA, 31(6), 28–37. [Google Scholar]
6. Fan, Z. P., Cao, Y., Huang, C. Y., Li, Y. (2020). Pricing strategies of domestic and imported electric vehicle manufacturers and the design of government subsidy and tariff policies. Transportation Research Part E: Logistics and Transportation Review, 143, 102093. [Google Scholar]
7. Chen, Q., Folly, K. A. (2022). Application of artificial intelligence for EV charging and discharging scheduling and dynamic pricing: A review. Energies, 16(1), 146. [Google Scholar]
8. Islam, J. B. F., Rahman, M. T., Mokhlis, H., Othman, M., Izam, T. F. T. M. N. et al. (2020). Combined analytic hierarchy process and binary particle swarm optimization for multi objective plug-in electric vehicles charging coordination with time-of-use tariff. Turkish Journal of Electrical Engineering and Computer Sciences, 28(3), 1314–1330. [Google Scholar]
9. Vuelvas, J., Ruiz, F., Gruosso, G. (2021). A time-of-use pricing strategy for managing electric vehicle clusters. Sustainable Energy, Grids and Networks, 25, 100411. [Google Scholar]
10. Wu, W., Lin, Y., Liu, R., Li, Y., Zhang, Y. et al. (2022). Online EV charge scheduling based on time-of-use pricing and peak load minimization: Properties and efficient algorithms. IEEE Transactions on Intelligent Transportation Systems, 23(1), 572–586. [Google Scholar]
11. Zhang, J., Tang, Y., Chen, C., Xiang, L. (2014). Coordinated charging strategy for electric vehicles considering time-of-use price and peak-valley difference dynamic constraints. Power System and Clean Energy, 30(5), 79–84. [Google Scholar]
12. Cheng, S., Chen, Z., Xu, K., Kang, Z., Wei, Z. (2020). An orderly charging and discharging method for electric vehicles based on a cooperative game and dynamic time-of-use price. Energy Engineering, 118(5), 215–224. [Google Scholar]
13. Huang, J., Wang, X., Shao, C., Song, Z., Wang, Y. (2022). An improved charging navigation strategy of electric vehicles via optimal time-of-use pricing. Electric Power Systems Research, 210, 108077. [Google Scholar]
14. Goh, H. H., Zong, L., Zhang, D., Dai, W., Lim, C. S. et al. (2022). Orderly charging strategy based on optimal time of use price demand response of electric vehicles in distribution network. Energies, 15(5), 1869. [Google Scholar]
15. Zhang, L., Sun, C., Cai, G., Huang, N., Lv, L. (2022). Two-stage optimization strategy for coordinated charging and discharging of EVs based on PSO algorithm. Proceedings of the CSEE, 42(5), 1837–1852 (In Chinese). [Google Scholar]
16. Kaur, A. P., Singh, M. (2023). Time-of-use tariff rates estimation for optimal demand-side management using electric vehicles. Energy, 273, 127243. [Google Scholar]
17. Zhang, X., Liu, X., Yang, W., Wen, F., Meng, K. et al. (2018). A hierarchical scheduling strategy for electric vehicles under dynamic time-of-use tariff mechanism. Electric Power Construction, 39(12), 73–80. [Google Scholar]
18. Xie, H., Gao, S. (2023). Optimal scheduling of electric vehicles charging and discharging strategy based on real-time price considering multi-party interest. IEEJ Transactions on Electrical and Electronic Engineering, 18(7), 1111–1119. [Google Scholar]
19. Aung, N., Zhang, W., Sultan, K., Dhelim, S., Ai, Y. (2021). Dynamic traffic congestion pricing and electric vehicle charging management system for the internet of vehicles in smart cities. Digital Communications and Networks, 7(4), 492–504. [Google Scholar]
20. Liu, D., Wang, W., Wang, L., Jia, H., Shi, M. (2021). Dynamic pricing strategy of electric vehicle aggregators based on DDPG reinforcement learning algorithm. IEEE Access, 9, 21556–21566. [Google Scholar]
21. Yin, W., Wen, T., Zhang, C. (2023). Cooperative optimal scheduling strategy of electric vehicles based on dynamic electricity price mechanism. Energy, 263, 125627. [Google Scholar]
22. Lei, X., Yu, H., Shao, Z., Jian, L. (2023). Optimal bidding and coordinating strategy for maximal marginal revenue due to V2G operation: Distribution system operator as a key player in China’s uncertain electricity markets. Energy, 283, 128354. [Google Scholar]
23. Ahmad, N., Ghadi, Y., Adnan, M., Ali, M. (2022). Load forecasting techniques for power system: Research challenges and survey. IEEE Access, 10, 71054–71090. [Google Scholar]
24. Zhou, J., Shi, L. (2014). A method based on the Savitzky-Golay filter to deal with short-term load forecasting of impact load. Electrical Measurement Instrumentation, 51(14), 125–128. [Google Scholar]
25. Askari, S. (2021). Fuzzy C-means clustering algorithm for data with unequal cluster sizes and contaminated with noise and outliers: Review and development. Expert Systems with Applications, 165, 113856. [Google Scholar]
26. Yan, Z., Zhang, R., Dong, H., Ma, X., Li, S. (2018). Price and period research of electric vehicles charging and discharging based on demand response. Power System Protection and Control, 46(15), 16–22 (In Chinese). [Google Scholar]
Cite This Article
 Copyright © 2024 The Author(s). Published by Tech Science Press.
This work is licensed under a Creative Commons Attribution 4.0 International License , which permits unrestricted use, distribution, and reproduction in any medium, provided the original work is properly cited.
 Downloads
 Citation Tools