
 Submit a Paper
 Propose a Special lssue
 Open Access
ARTICLE

Research on the MPPT of Photovoltaic Power Generation Based on Improved WOA and P&O under Partial Shading Conditions
School of Electrical Engineering, Nantong University, Nantong, 226019, China
* Corresponding Author: Lei Zhang. Email:
Energy Engineering 2024, 121(4), 951-971. https://doi.org/10.32604/ee.2023.041433
Received 22 April 2023; Accepted 01 August 2023; Issue published 26 March 2024
 View Full Text
 Download PDF
Abstract
Partial shading conditions (PSCs) caused by uneven illumination become one of the most common problems in photovoltaic (PV) systems, which can make the PV power-voltage (P-V) characteristics curve show multi-peaks. Traditional maximum power point tracking (MPPT) methods have shortcomings in tracking to the global maximum power point (GMPP), resulting in a dramatic decrease in output power. In order to solve the above problems, intelligent algorithms are used in MPPT. However, the existing intelligent algorithms have some disadvantages, such as slow convergence speed and large search oscillation. Therefore, an improved whale algorithm (IWOA) combined with the P&O (IWOA-P&O) is proposed for the MPPT of PV power generation in this paper. Firstly, IWOA is used to track the range interval of the GMPP, and then P&O is used to accurately find the MPP in that interval. Compared with other algorithms, simulation results show that this method has an average tracking efficiency of 99.79% and an average tracking time of 0.16 s when tracking GMPP. Finally, experimental verification is conducted, and the results show that the proposed algorithm has better MPPT performance compared to popular particle swarm optimization (PSO) and PSO-P&O algorithms.Keywords
With the rapid consumption of traditional energy sources such as fossil fuels and the worsening of environmental pollution, the human living environment has been severely damaged. Governments around the world have called for the development and utilization of clean energy, so solar energy, as a clean and renewable energy source, has received widespread attention from people [1]. Building photovoltaic (PV) power generation systems by using PV cells and power electronic converters is a common way for people to utilize solar energy. Due to the influence of illumination, temperature, and other factors on the output current and voltage of PV cells, how to maximize the conversion of solar energy into electrical energy and improve the actual power generation efficiency has become a major challenge for PV power generation systems. Therefore, the study of maximum power point tracking (MPPT) has become an essential part of PV power generation [2,3]. Currently, traditional MPPT methods include Hill Climbing algorithm [4], Perturbation and Observation (P&O) [5,6], and Incremental Conductance (INC) [7]. P&O and INC are the most common and effective methods. P&O samples the output voltage or current of the PV array at regular intervals, and then applies a fixed disturbance step by comparing the current PV output power with the previous output power to track MPP, which has superior performance. INC applies the step according to the slope of the P-V curve. The slope is zero at the MPP, so it can help to determine when to complete MPPT. The main advantage of these methods is convenience in implementation, but they only apply to power-voltage (P-V) curves with only one peak. In actual situations, PV power generation is easy to be blocked by clouds, trees, etc., resulting in uneven illumination, that is partial shading condition (PSC). Thus, the P-V curve has multiple peaks, and traditional MPPT methods cannot distinguish the global maximum power point (GMPP) among the several peaks existing in the P-V curve under PSC [8], resulting in low system output power and increased power loss [9,10].
In order to track GMPP under PSCs, many researchers have proposed to apply intelligent algorithms to MPPT, the most common of which is particle swarm optimization (PSO) [11]. In [12], the fuzzy fokker planck solution was used to optimize search space, which reduced unnecessary search time. Javed et al. [13] utilized two parameters of PSO to control speed and search space, and consumed a maximum of 16 perturbations to locate GMPP. In reference [14], PSO was first used to search for the global optimum, and then fuzzy control was used to eliminate oscillation. Joisher et al. [15] proposed a differential evolution algorithm mixed with PSO, which initialized possible solutions after several iterations to reduce the probability of convergence to the local maximum power point (LMPP). In reference [16], the approximate optimal duty ratio was initialized by PSO to achieve the purpose of fast convergence. Harmini et al. [17] used an adaptive neuro fuzzy inference system to train and update data, which omitted the initialization of PSO. Gawande et al. [18] combined PSO and INC into a new control algorithm, which avoided the drawbacks of falling into LMPP. Makhloufi et al. [19] proposed a logarithmic PSO algorithm, which enhanced the reliability of system design by reducing control parameters and population size. Ibrahim et al. [20] improved the speed step function of PSO to constrain the maximum speed, which optimized the search space. In order to reduce the impact of random variables, Hu et al. [21] controled the direction of particle velocity to be the same as the convergence direction, so it avoided the divergence of particle trajectories which made the search process more effective and controllable. In addition, there are other algorithms. The cuckoo algorithm [22] was used to optimize controller parameters to reduce power oscillation. Millah et al. [23] proposed grey wolf optimization algorithm, which used weighted average value, pop-up behavior, and convergence factor to accelerate tracking speed. At the same time, researches on intelligent algorithms such as ant colony optimization algorithm [24], firefly optimization algorithm [25–28], and genetic algorithm [29–31] also further improve the efficiency of MPPT.
Although the above algorithms can realize MPPT, the principle is complex. Whale algorithm (WOA) is a new optimization algorithm proposed by Mirjalili et al. based on the behavior of whale prey hunting [32]. It can be used to search for the optimal target. Compared with other intelligent algorithms, it has high universality. When WOA is applied to MPPT, the parameter setting is less and the running speed is faster. However, WOA, like other intelligent algorithms, has some disadvantages, such as slow convergence speed and large search oscillation. Therefore, the paper proposes an improved whale algorithm (IWOA) combined with the P&O (IWOA-P&O). Firstly, the nonlinear convergence factor and weight factor are introduced to accelerate the tracking speed and enhance the global search ability, which makes the algorithm fast track to the range interval of the GMPP. Then, P&O is used to rapidly converge to the maximum power point (MPP). Finally, the restart mechanism is added to further enhance the tracking ability under varying illumination.
The structure of the paper is as follows. Section 2 introduces the basics of PV modeling, and demonstrates the effect of PSCs on the functionality of the PV array. IWOA-P&O algorithm and the corresponding MPPT process are presented in Section 3. Section 4 provides a thorough comparison of the proposed method with different algorithms. Section 5 provides experimental results. The paper is concluded in Section 6.
2 Output Characteristics of PV Array
The PV array is composed of multiple PV cells in series and parallel. The equivalent model of the PV cell is shown in Fig. 1. Iph is photogenic current; ID is diode current; Rp is the bypass resistance; RS is the internal series resistance; Upv is the PV output voltage; Ipv is the output current.
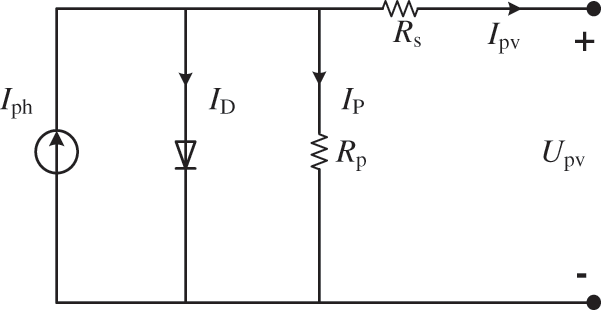
Figure 1: Equivalent model of photovoltaic cell
The output voltage-current characteristics of the PV cell can be expressed as:
where Io is the reverse saturation current; q is the electron charge; A is the diode ideal factor; K is the Boltzmann’s constant; T is the temperature.
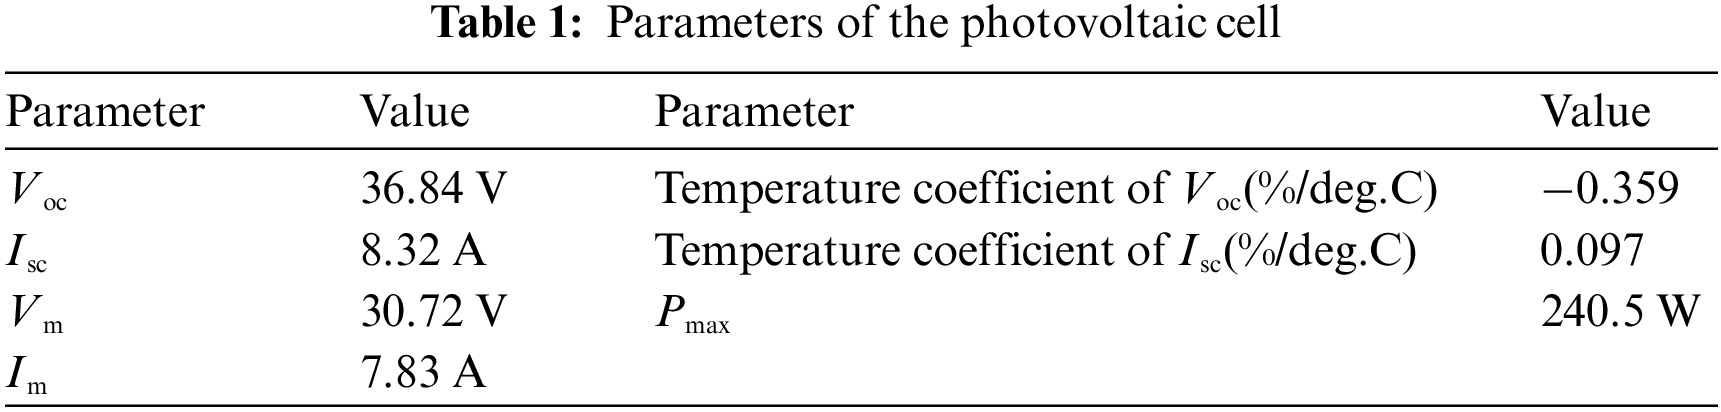
In this paper, the PV cell (A10J-M60-240) is used as the research object. The parameters of this PV cell under a standard environment (temperature is 25°C and irradiance is 1000 W/m2) are shown in Table 1. Voc is the open circuit voltage; Isc is the short circuit current; Vm is the voltage of MPP; Im is the current of MPP; Pmax is the maximum power.
Due to the wide distribution of PV arrays, in actual working conditions, haze, dust, trees, or buildings will lead to uneven illumination, resulting in PSC. The above three PV cells are connected in series into a PV array as the simulation model. PV array is shown in Fig. 2.
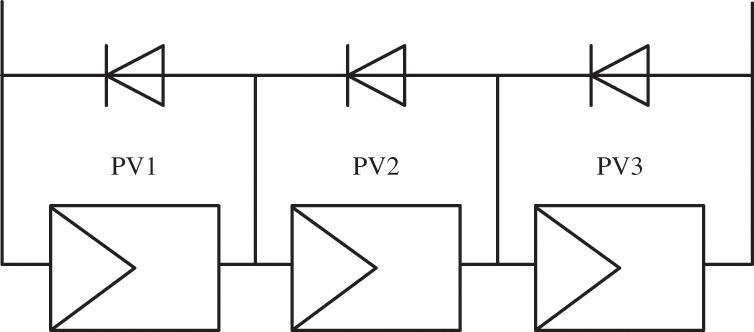
Figure 2: Structure of PV array
In order to fully demonstrate the influence of illumination on PV output, different irradiances are set. Detailed data on irradiances are shown in Table 2. S1, S2, and S3 respectively represent the solar irradiance on PV1, PV2, and PV3. The power-voltage (P-V) and current-voltage (I-V) curves under different PSCs are illustrated in Fig. 3.
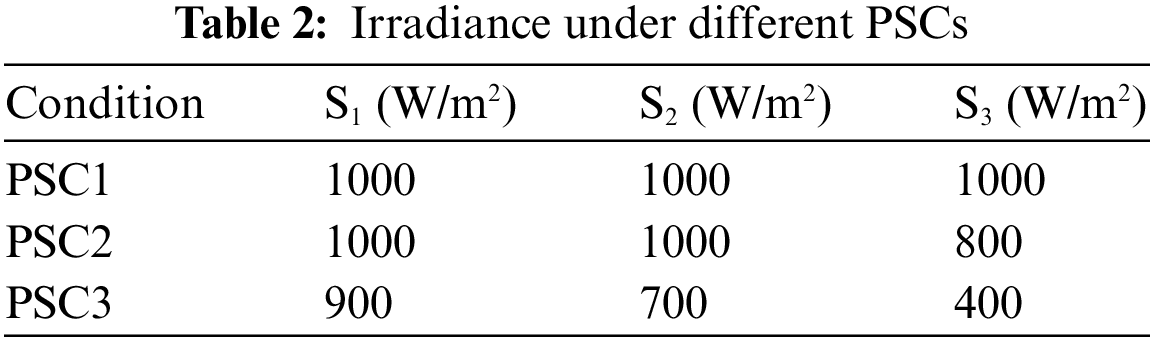
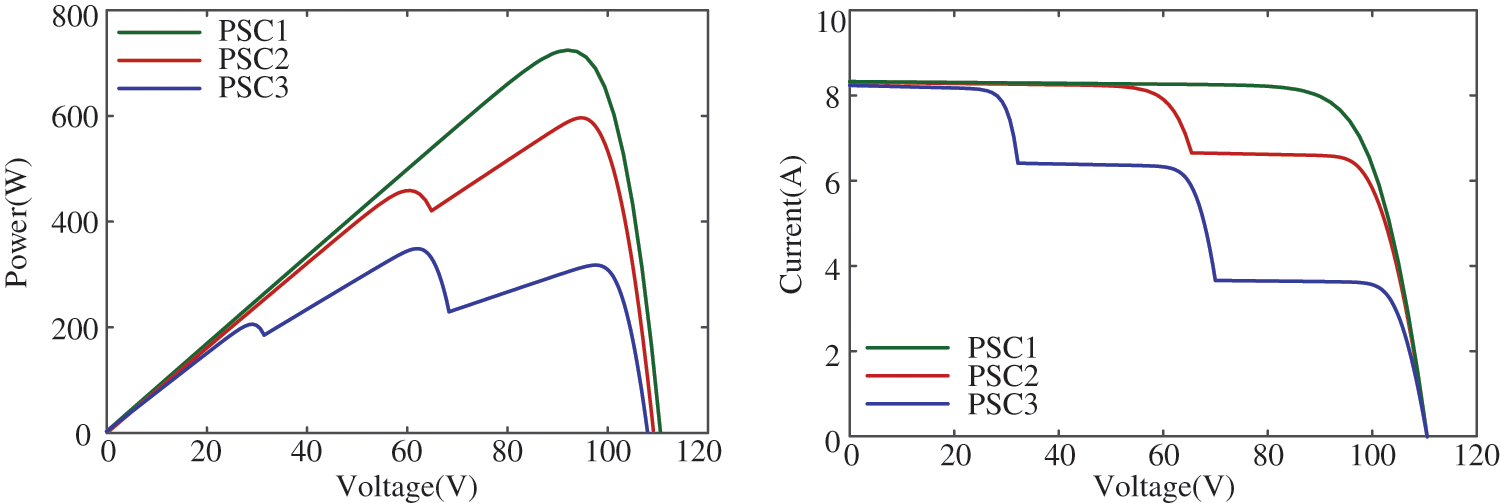
Figure 3: P-V and I-V characteristics curves under different PSCs
As is shown in Fig. 3, when the irradiance of three PV cells in the PV array is 1000 W/m2 (PSC1), the P-V curve of the PV array has only one peak, and the I-V curve is a single-knee shape. In the other two cases, the irradiance of the three PV cells in the array is uneven. In PSC2, three PV cells are exposed to two irradiances (1000 W/m2 for S1 and S2, 800 W/m2 for S3), and the P-V curve has two peaks, and the I-V curve turns into double-knee shape. In PSC3 (900 W/m2 for S1, 700 W/m2 for S2, 400 W/m2 for S3), the P-V curve has three peaks, and the I-V curve turns into three-knee shape.
When WOA is applied to the MPPT, the position of each whale corresponds to the output voltage. The minimum voltage of the PV array corresponds to the lower bound of the whale’s hunting range, and the maximum voltage corresponds to the upper bound of the whale’s hunting range. The whales in the search range will change their positions according to equations until the position of MPP is found, and then the search will stop after the voltage is output. It consists of three modes: encircling prey, bubble-net hunting technique, and random searching for prey [33].
During this phase, the position of the whale corresponding to the voltage will locally move according to the following equation:
where, D is the distance between the current individual and the optimal individual.
where, r1 and r2 are random parameters in [0,1]; Tmax is the maximum number of iterations.
3.1.2 Bubble-Net Hunting Technique
At this stage, the position of the whale corresponding to the voltage moves in a spiral toward the optimal value. The equation for updating the position is as follows:
where, b represents the coefficient constant, and l is the random quantity between [-1, 1].
3.1.3 Random Searching for Prey
The mathematical model of this stage is as follows:
where, Xrand(t) represents the position of random individuals in the current whale population. According to the difference of A in equation, there are two cases. If |A| ≥ 1, the position of the whale is randomly selected, and the position corresponding to voltage globally moves according to Eqs. (6) and (7). Otherwise, the algorithm enters the phase of encircling prey again.
The P&O algorithm is a traditional MPPT algorithm. The principle of the P&O is to compare P (k) (power after disturbance) with P (k−1) (power before disturbance) by continuously applying a constant step-size perturbation to the voltage. Therefore, if P (k) > P (k−1), the direction of perturbation is correct. Otherwise, if P (k) < P (k−1), the algorithm adjusts the direction of perturbation, and finally finds the peak point through regular perturbation. Detailed steps of the P&O are shown in Fig. 4.
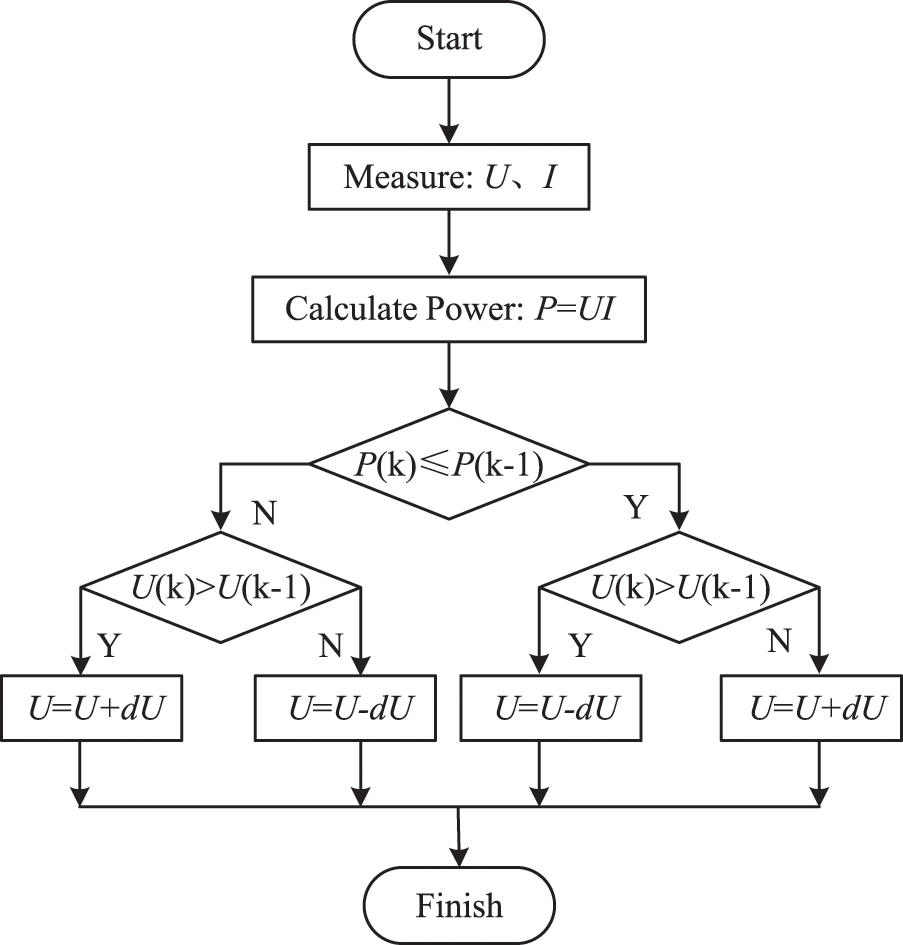
Figure 4: Flow chart of P&O
In the actual function optimization, the change rate of a needs to be changed in real time, but the linearly changing parameter a cannot meet the requirements. Therefore, the convergence factor a1 and the weight factor ω of nonlinear change are introduced in this paper. The equations are as follows:
By using Eqs. (8) and (9), A is updated to A1, and Eqs. (3), (5) and (7) are updated as follows:
The variable A has the greatest influence on whale search, which determines the accuracy of the WOA global search and local search. In the mathematical model of the WOA, when |A| > 1, the whale population expands its search range and begins to search for the optimal value. The algorithm focuses on accuracy within the global range. When |A| < 1, the whale population searches within a small solution range to complete convergence of the optimal value. The algorithm focuses on precision within the local range. The variable A is determined by the parameter a. When the value of the parameter a changes from 2 to 0, the value of A varies within the [−a, a]. As is shown in Fig. 5, it can be seen that the parameter a of WOA decreases linearly from 2 to 0. In multimodal function optimization problems, it is difficult to ensure the accuracy of the search by the linearly changing parameter a because of the arbitrary shape of the multimodal function and the uncertainty of the iterative convergence process. Therefore, a1 with nonlinear change is adopted. According to Fig. 5, the value of the parameter a1 in IWOA has a significant rate of change in the early stages of iteration, resulting in the algorithm having the largest search range and changing the search step size within a larger range. The IWOA ensures global search ability while also considering search speed. The value of the parameter a1 decreases rapidly with the number of iterations in the later stage, and the search range of IWOA becomes smaller. Whale individuals converge around the optimal value. Finally, the IWOA obtains the optimal value with a small range of fluctuations.
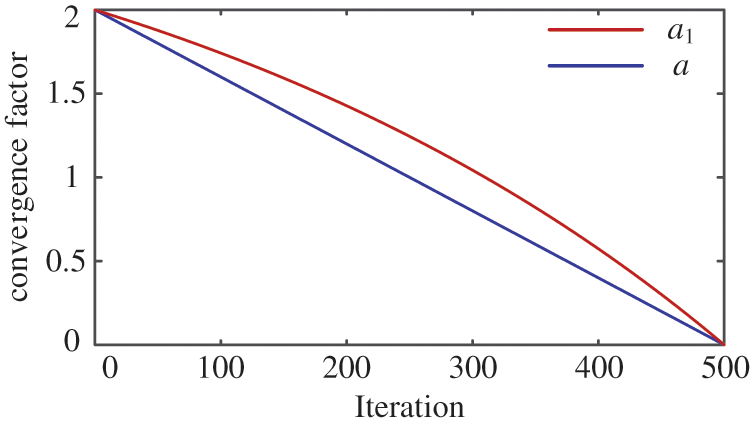
Figure 5: Convergence factor iteration curve
At the end of the algorithm, the variance of the position (corresponding to voltage) of the whale population and setting the variance threshold are used to determine whether the whale is close to the maximum power point (MPP). When the variance of the location of the the whale population is less than variance threshold, the whale is located near the MPP. The threshold affects the tracking performance of the algorithm. If the threshold is too large, the algorithm will prematurely converge to other local maximum power point (LMPP), resulting in the algorithm tracking the wrong value. Otherwise, if the threshold is too small, the number of iterations will increase and the rate of convergence will decrease. Finally, the voltage corresponding to the position of the optimal whale is taken as the initial point of P&O to finely track the MPP of the PV array. The discriminant near the MPP is as follows:
where, σ2 is the variance of the position of whale population. N is the number of whales. Ui is the voltage corresponding to the position of the ith whale.
If the external illumination changes, the MPP of the PV array will change. At this point, the algorithm needs to be restarted to track the MPP of the PV array in real time. The restart condition is as follows:
where, ∆P represents the change rate of the power at this moment compared with the power at the previous moment. P represents the current output power.
The specific MPPT process of IWOA-P&O is as follows:
(1) Firstly, the maximum iteration number Tmax, the population number N, the random positions of whales (voltage), the variance threshold f and other parameters are initialized.
(2) Secondly, the voltage and current of PV array are collected, and the power calculation formula is set as the objective function. The MPP is the target that the whale finally seeks.
(3) Then the convergence factor a1 and the control parameter A1 are updated according to Eqs. (8) and (9), respectively. Then, based on the probability P, the movement mode of the whale is determined. The voltages corresponding to all whale positions are updated according to Eqs. (11)–(13).
(4) At the same time, the output power corresponding to each whale position is calculated, and the optimal individual power is taken as the historical global optimal value. If the current population optimum value is greater than the historical global optimal value, the current population optimum is regarded as the new optimum, and the historical global optimum is updated. Otherwise, the historical optimal value is retained, and then the voltage corresponding to the position of the whale is updated continuously.
(5) On this basis, when Eq. (14) is satisfied or the maximum number of iterations is reached, it means that the whale is close to the MPP.
(6) Then the voltage corresponding to the position of the optimal individual in the whale population is taken as the initial point of P&O, and the P&O is carried out in a small step size until the steady state is reached.
(7) Finally, if Eq. (15) is satisfied, the system conditions will change, and the algorithm needs to be restarted. Otherwise, the system reaches the steady state and outputs maximum power. The flow chart of the MPPT method based on the IWOA-P&O is shown in Fig. 6.
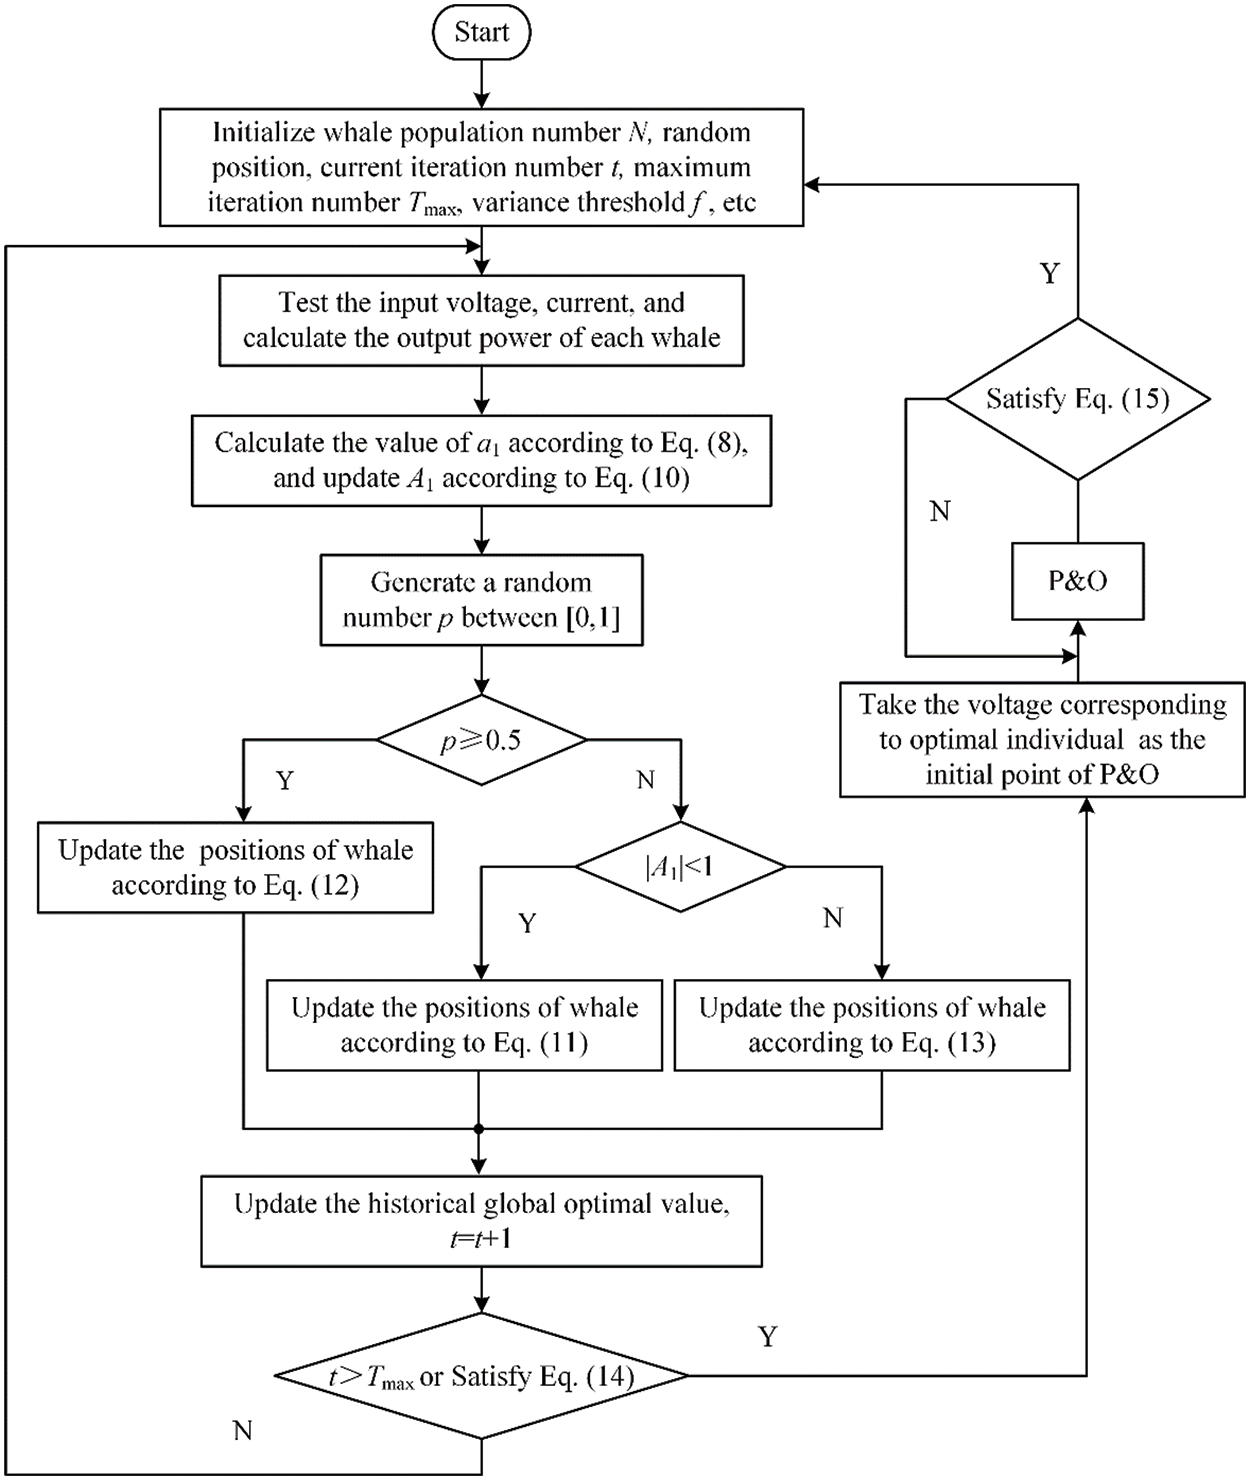
Figure 6: MPPT process of IWOA-P&O
In order to verify the superiority of the IWOA-P&O proposed in this paper, three PV cells (A10J-M60-240) combined with Boost circuits are used for simulation experiments. The photovoltaic (PV) power generation system is set up as shown in Fig. 7. PV cells are connected in series after being connected in parallel with the bypass diode. Filter capacitance C1 is 200 uF; The busbar capacitance C2 is 180 uF; The inductance L is 2 mH; The load resistance R is 340 Ω; The switching frequency is 100 kHz. Finally, IWOA-P&O is compared with P&O, PSO, WOA, and PSO-P&O. Four cases under different PSCs are simulated. PSC1: The illuminations received by the three PV cells are 1000, 1000, and 1000 W/m2, respectively. PSC2: The illuminations received by the three PV cells are 1000, 1000, and 800 W/m2, respectively. PSC3: The illuminations received by the three PV cells are 900, 700, and 400 W/m2, respectively. PSC4: The illuminations received by the three PV cells are 500, 300, and 100 W/m2, respectively. The power-voltage (P-V) curves of four cases are shown in Fig. 8.
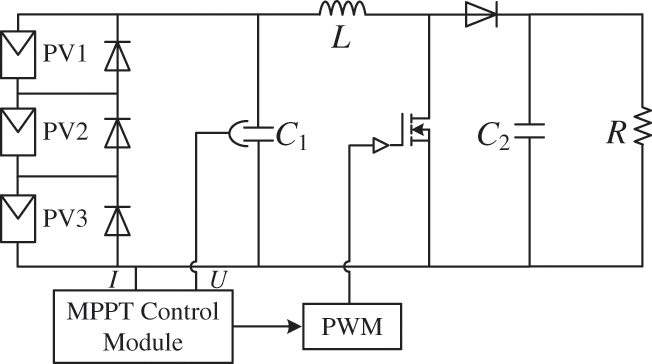
Figure 7: Photovoltaic power generation system
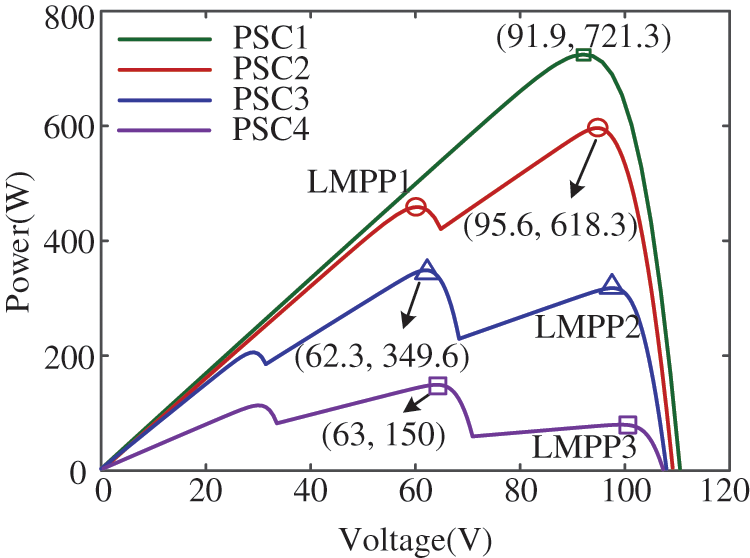
Figure 8: The P-V curves of the PV array under partial shading conditions
Simulations are performed under static PSCs. The MPPT results of different algorithms under PSC1 are shown in Fig. 9. Under PSC1, the maximum power is 721.3 W, and the P-V characteristic curve shows only one peak. The power achieved by the WOA, PSO, P&O, PSO-P&O, and IWOA-P&O is 720, 720, 721, 721, and 721 W, with an efficiency of 99.82%, 99.82%, 99.96%, 99.96%, and 99.96%, respectively. The tracking time is 0.23, 0.3, 0.2, 0.11 and 0.1 s for the WOA, PSO, P&O, PSO-P&O, and IWOA-P&O, respectively. The tracking time of IWOA-P&O is reduced by approximately 67% compared to the PSO. During the search, the power fluctuation of IWOA-P&O is smaller than that of WOA and PSO. All five algorithms successfully track the maximum power point.

Figure 9: Simulation results under PSC1: (a) PV power (b) PV voltage
The MPPT results of different algorithms under PSC2 are shown in Fig. 10. Under PSC2, the maximum power is 618.3 W and the P-V characteristic curve shows two peaks. Instead of finding the global maximum power point (GMPP), P&O only finds the second peak value (LMPP1), which is trapped in the LMPP. The tracking time of P&O is 0.19 s. The output power of P&O is 474.5 W, which is 143.8 W away from GMPP, and the tracking efficiency is only 76.74%. The tracking time of WOA algorithm is 0.29 s, and the output power is 563.4 W. Due to its weak local search ability, the search accuracy is low, and the tracking efficiency is only 91.12%. The IWOA-P&O algorithm proposed in this paper uses the convergence factor and weight factor to strengthen the global search ability and improve the convergence speed. In the later stage, the P&O with a small step size is used to improve the search accuracy. So IWOA-P&O only needs 0.18 s to track the GMPP, and the output power is 618 W, achieving tracking efficiency of 99.95%. Compared with PSO and PSO-P&O, IWOA-P&O reduced tracking time by 55% and 14%, respectively.
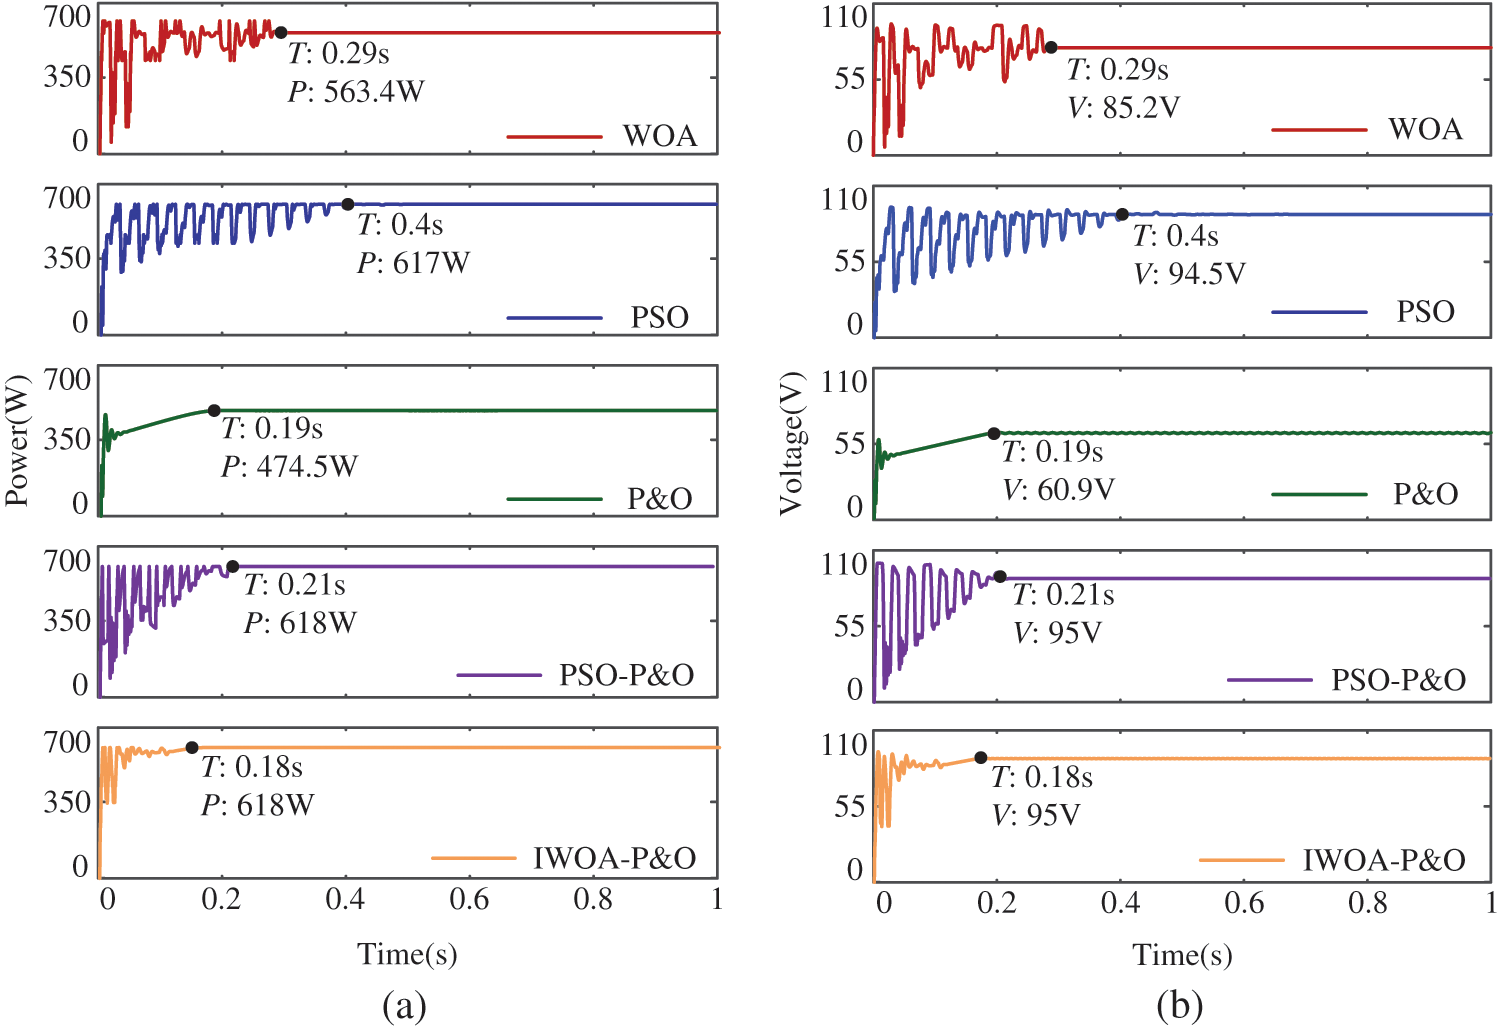
Figure 10: Simulation results under PSC2: (a) PV power (b) PV voltage
The MPPT results of different algorithms under PSC3 are shown in Fig. 11. Under PSC3, the maximum power at this time is 349.6 W, and the P-V characteristic curve shows three peaks. Compared with WOA and PSO, P&O takes less time to track the maximum power point, but it is trapped in local optimal (LMPP2), with tracking an efficiency of 90.96% and higher power loss. The WOA, PSO, PSO-P&O, and IWOA-P&O successfully track the MPP, and the efficiencies are 99.54%, 98.68% 99.54%, and 99.91%, respectively. The power fluctuation of IWOA-P&O is smaller than that of PSO and WOA. In terms of tracking time, the IWOA-P&O algorithm improves about 50%, 63%, and 36% compared with WOA, PSO, and PSO-P&O, respectively.
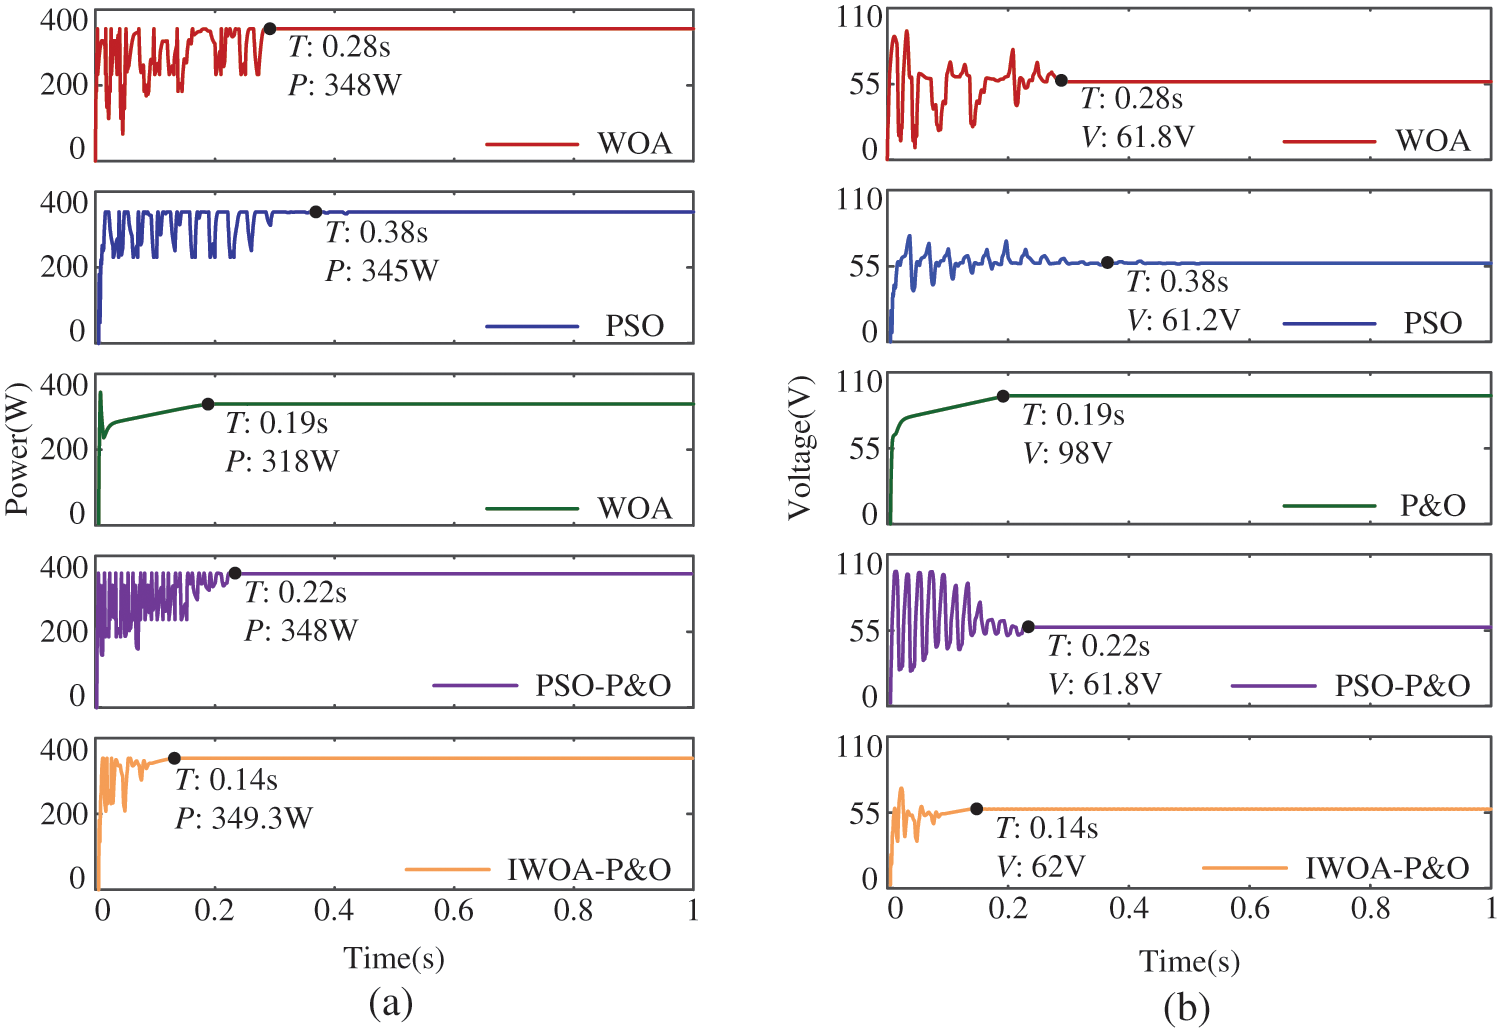
Figure 11: Simulation results under PSC3: (a) PV power (b) PV voltage
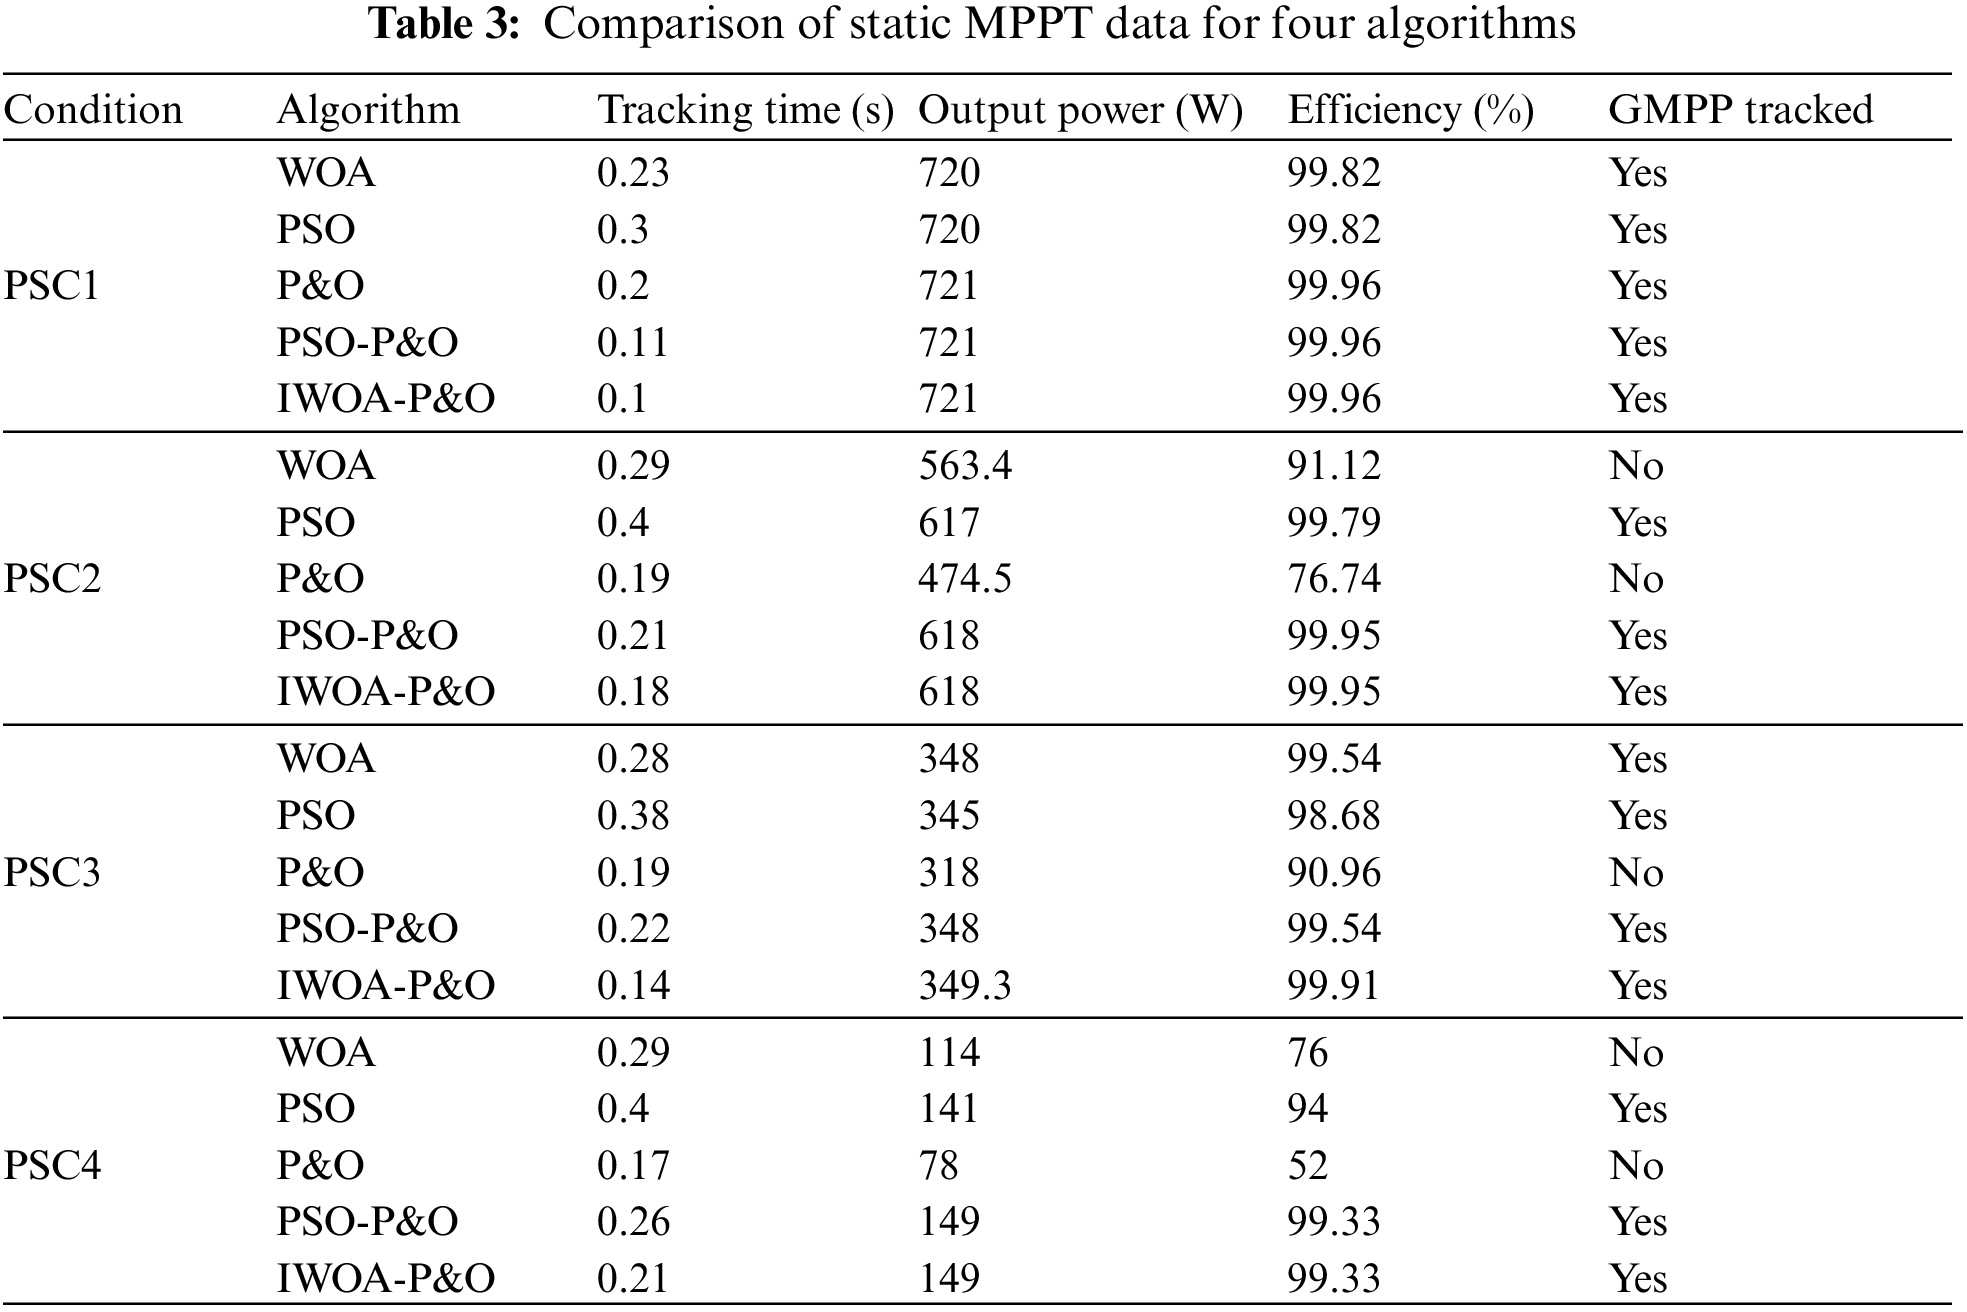
The MPPT results of different algorithms under PSC4 are shown in Fig. 12. Under PSC4, the maximum power at this time is 150 W, and the P-V characteristic curve shows three peaks. P&O converges quickly but it is trapped in the local optimal value (LMPP3), resulting in significant power loss. The WOA algorithm converges too early, resulting in low search efficiency, which is only 76%. Compared with WOA, the efficiency of IWOA-P&O increases by approximately 23%. The MPPT time of the PSO algorithm is 0.4 s. However, the IWOA-P&O algorithm only takes 0.21 s to search for the MPP. Compared with PSO-P&O, IWOA-P&O improves the speed of MPPT by 19%. Therefore, despite the harsh illumination environment, the MPPT performance of the proposed method is still superior. Finally, the simulation data of WOA, PSO, P&O, PSO-P&O, and IWOA-P&O under PSC1, PSC2, PSC3, and PSC4 are shown in Table 3.
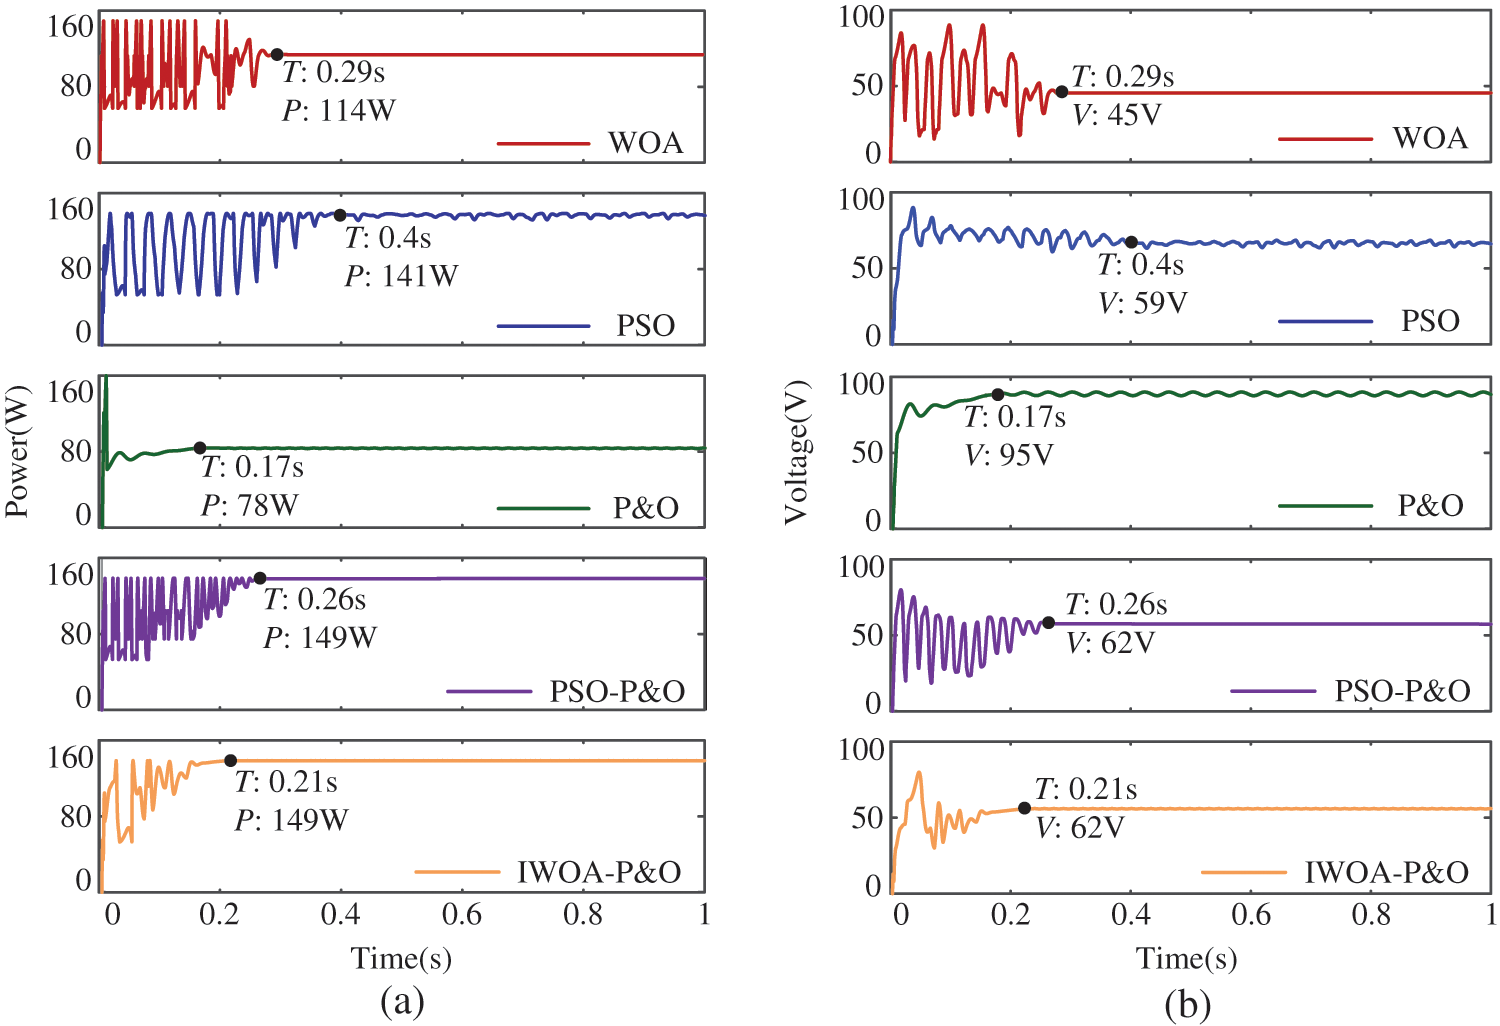
Figure 12: Simulation results under PSC4: (a) PV power (b) PV voltage
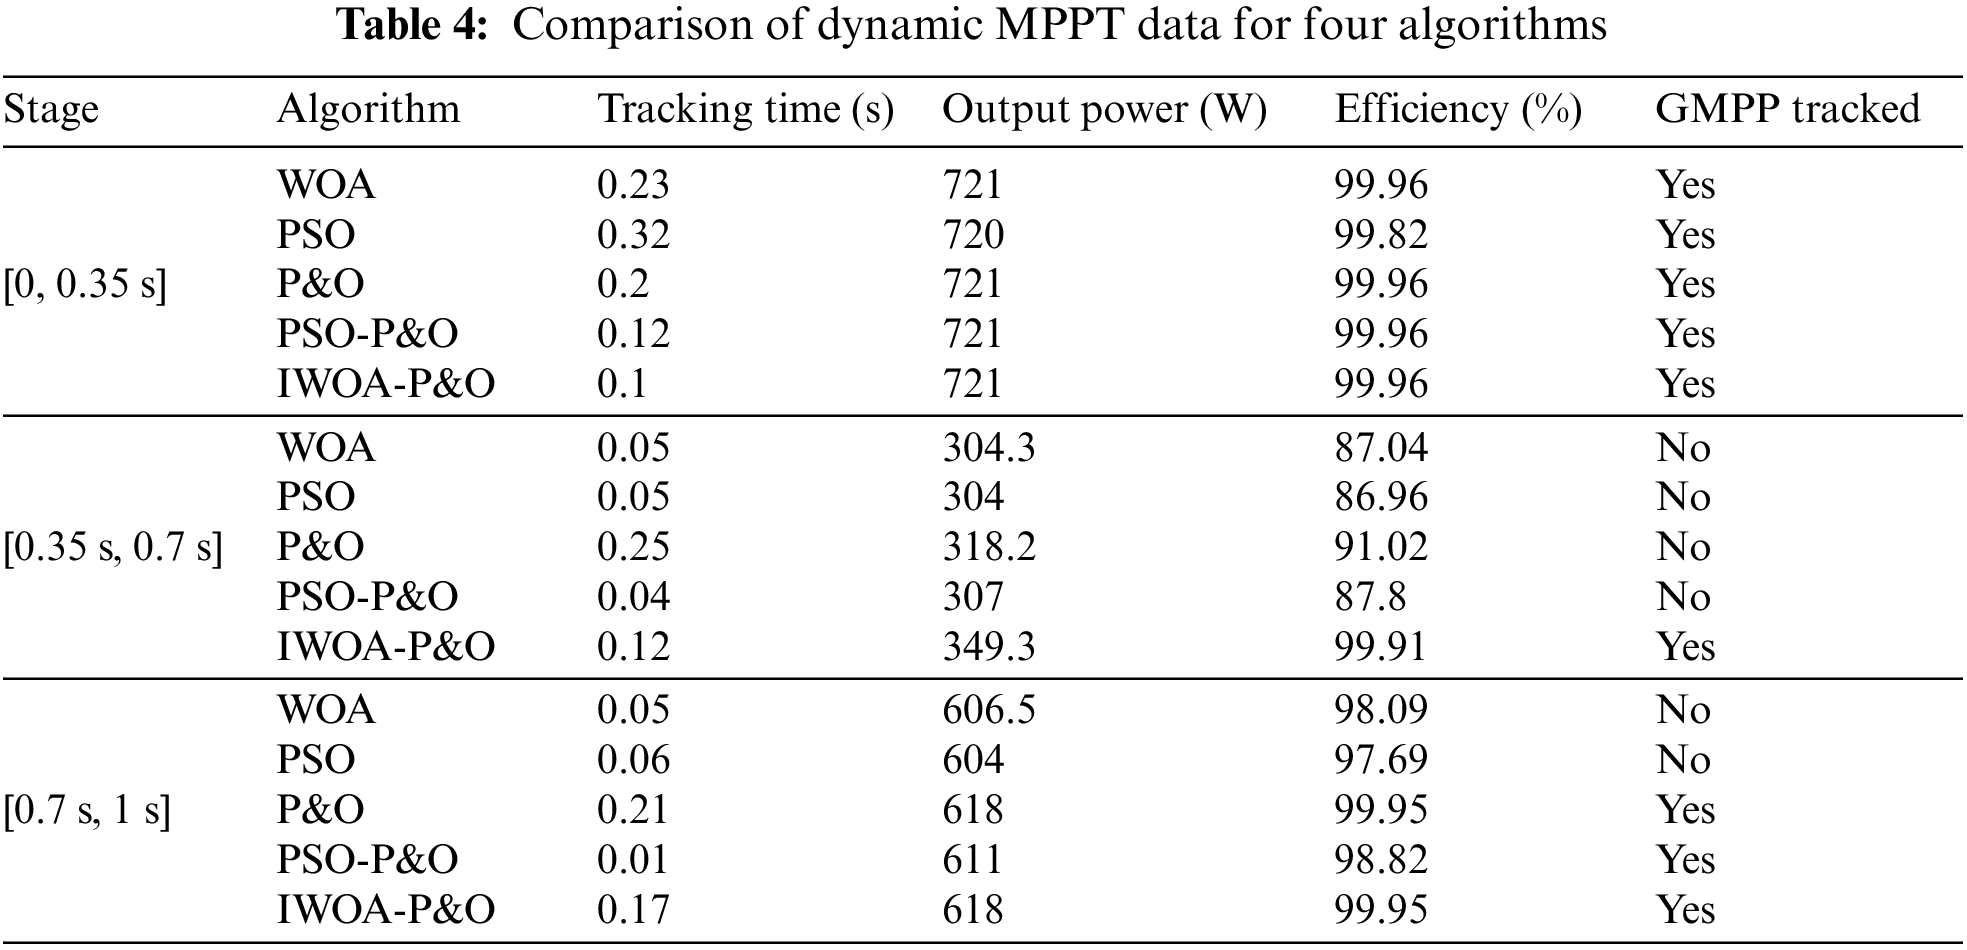
The superiority of IWOA-P&O algorithm has been verified under static PSCs. However, in the real world, illumination is not invariable and will change with time. For this reason, a variation of PSC is performed which is changed at 0.35 and 0.7 s in the order of PSC1-PSC3-PSC2. The P-V curve changes from a single peak to a triple peak and then to a double peak.
The MPPT results of WOA, PSO, P&O, and IWOA-P&O algorithms are shown in Fig. 13. Within [0, 0.35 s], there is only one peak of the P-V curve, so all the five algorithms successfully track the MPP. However, WOA, PSO, P&O, and PSO-P&O have a long convergence time, and WOA and PSO have a large power fluctuation in the tracking process. It is clear that the tracking time of the IWOA-P&O algorithm is reduced by over 50%. At 0.35 s, the illumination changes, and then the P-V curve has three peaks in [0.35 s, 0.7 s]. P&O is trapped in local optima (LMPP2) with an efficiency of only 91.02%. Due to the lack of restart function, WOA, PSO, and PSO-P&O locate near LMPP2 and the voltage remains unchanged. The output power is about 305 W, the tracking efficiency is about 87%, and the power loss is large. Instead, IWOA-P&O is restarted and it takes 0.12 s to track to the GMPP successfully. At 0.7 s, the illumination changes again, and the P-V curve has two peaks in [0.7 s, 1 s]. Because the MPP happens to be in the same voltage region as LMPP2, P&O successfully tracks the MPP. The output power of WOA, PSO, and PSO-P&O are 606.5, 604, and 611 W, respectively, and the tracking efficiency are 98.09%, 97.69%, and 98.82%, respectively, with great power fluctuation. The tracking efficiency of IWOA-P&O reached 99.95%. As can be observed through the simulation results, it is easy for P&O to fall into LMPP under PSCs, resulting in high power loss. WOA, PSO, and PSO-P&O algorithms are similar. The power fluctuates greatly in the search process, and there is no restart function. The IWOA-P&O proposed in this paper has higher tracking efficiency, faster convergence, less power loss, and can also restart search in the case of illumination variation. Specific data are shown in Table 4.
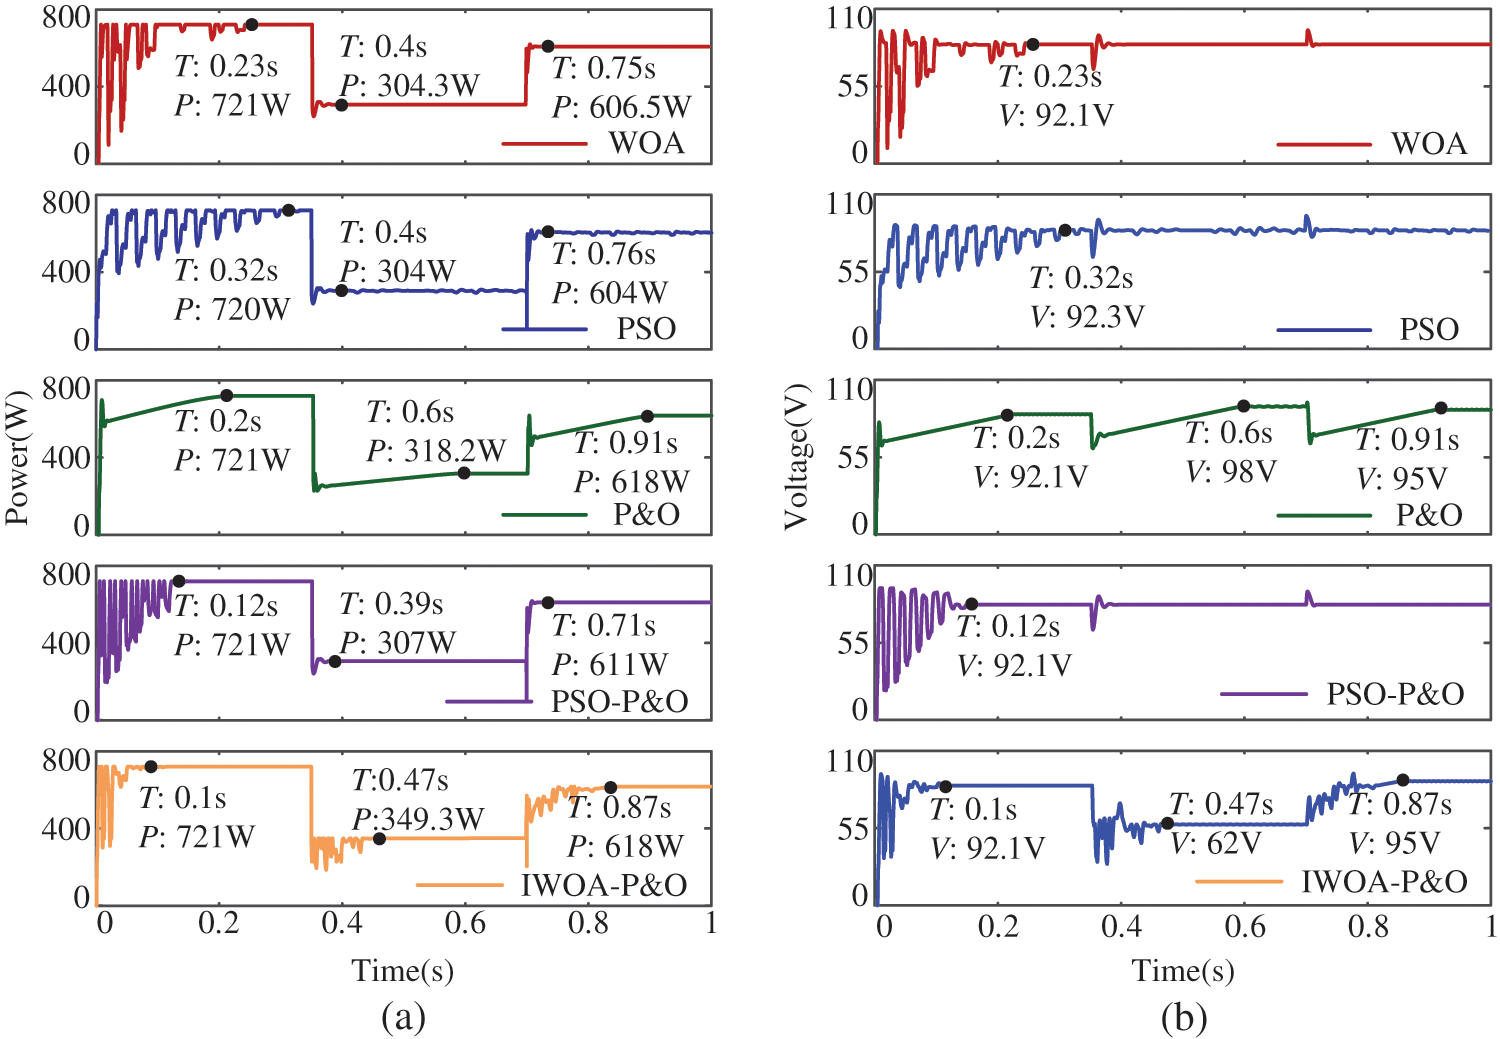
Figure 13: Simulation results for the changing partial shading: (a) PV power (b) PV voltage
4.4 Multiple Photovoltaic Cells
To verify the MPPT performance of the proposed method in series and parallel connection of multiple photoelectric cells, nine PV cells are connected, as shown in Fig. 14a. The illumination received by PV1, PV2 and PV3 is 1000 W/m2. The illumination received by PV4, PV5 and PV6 is 800 W/m2. The illumination received by PV7, PV8 and PV9 is 600 W/m2. The P-V curve of the PV array is shown in Fig. 14b. It has three peaks with a maximum power of 1374 W. The simulation results of IWOA-P&O are shown in Fig. 15. IWOA-P&O successfully tracks the MPP. The tracking time is 0.2 s and efficiency is 99.93%. Although the structure of the PV array has changed, IWOA-P&O still has excellent MPPT performance.

Figure 14: Structure and P-V curve of PV array
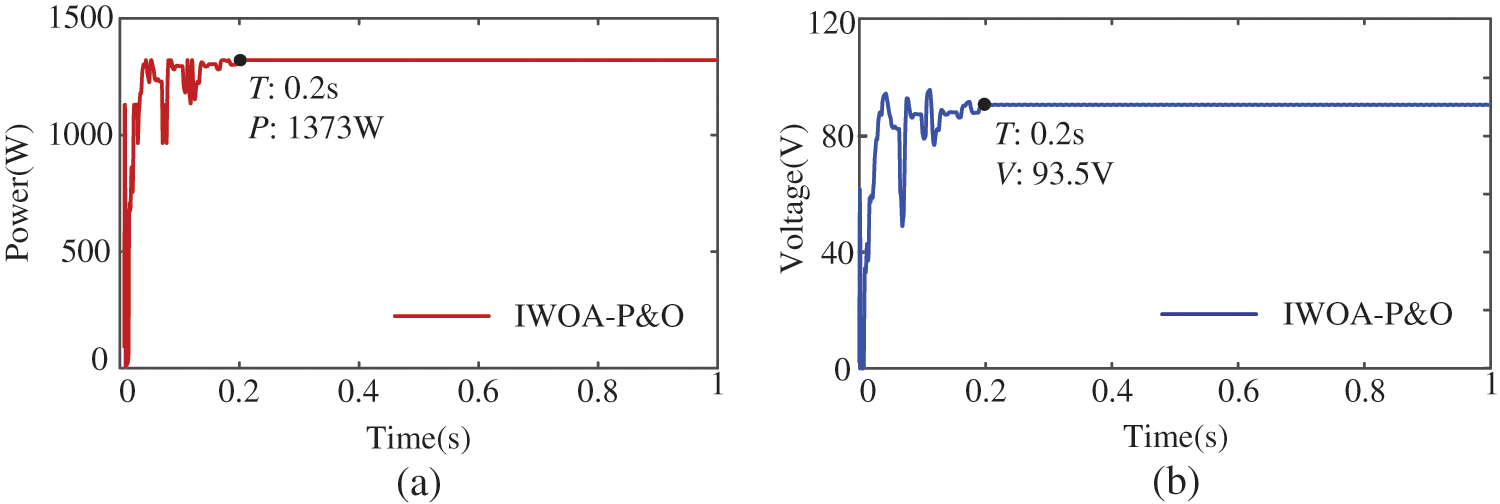
Figure 15: Simulation results: (a) PV power (b) PV voltage
4.5 Continuously Changing Irradiance and Temperature
The continuously varying irradiance and temperature are simulated to verify the MPPT performance of the proposed method. As shown in Fig. 16a, the irradiance decreases continuously from 1000 W/m2 at 0.2 s and reaches the lowest point of 600 W/m2 at 0.4 s. Then irradiance rises and returns to 1000 W/m2 at 0.9 s. The theoretical MPP of the PV array and results of IWOA-P&O MPPT are shown in Fig. 16b. IWOA-P&O tracks the maximum power of 721 W at 0.12 s when irradiance remains constant. Irradiance changes continuously within [0.2 s, 0.9 s], and the theoretical MPP also changes continuously. Because the change of the power is continuous, the IWOA-P&O algorithm utilizes the characteristics of P&O to track the MPP in real time. IWOA-P&O successfully follows the MPP of 429 W at 0.4 s and returns to the initial MPP at 0.9 s. Similarly, for the continuously changing temperature, IWOA-P&O can still track the maximum power in real time. As shown in Fig. 17, the temperature continuously decreases from 45°C at 0.2 s and reaches its lowest point of 5°C at 0.4 s. Then it rises and returns to 45°C at 0.9 s. IWOA-P&O successfully tracks the maximum power of 679 W at 0.11 s. Then IWOA-P&O follows the change of the MPP and tracks to the MPP of 774 W at 0.4 s. Finally, it returns to the initial power point at 0.9 s. Therefore, regardless of continuously changing irradiance or temperature, the MPPT performance of the proposed method is still very superior.
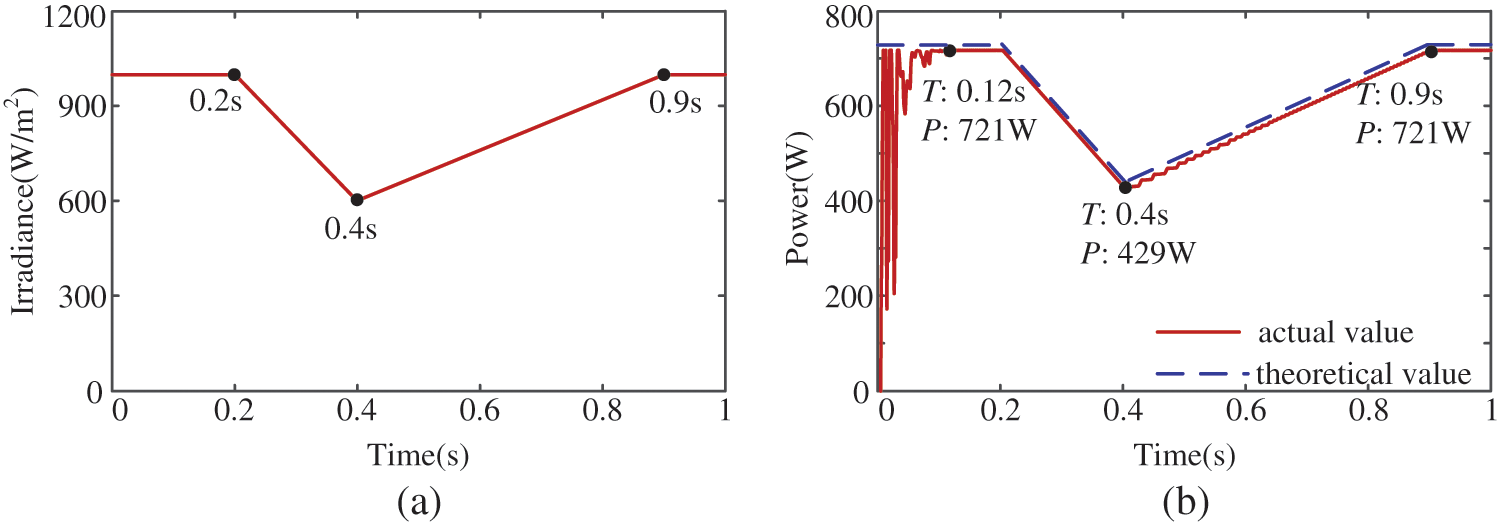
Figure 16: Simulation results under continuously changing irradiance
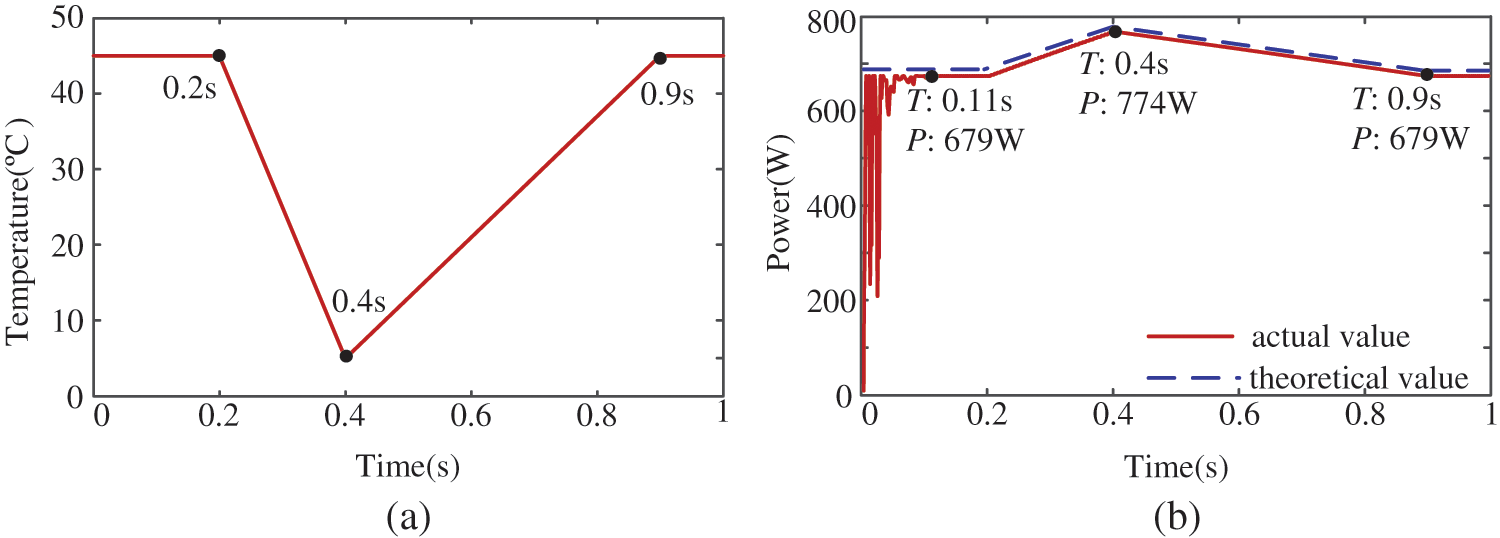
Figure 17: Simulation results under continuously changing temperature
In addition, in order to verify the MPPT performance of the proposed method, the simulation results of the dynamic process under continuously changing PSCs are shown in Fig. 18. The PV power-voltage characteristics curve under PSC3 and PSC4 are shown in Fig. 18a. In Fig. 18b, within [0, 0.2 s], the PV array is under PSC3, and the theoretical maximum power is 349.6 W. The IWOA-P&O algorithm proposed in this paper successfully tracks the MPP in 0.14 s. After 0.8 s, the PV array is under PSC4, and the theoretical maximum power is 150 W. Within [0.2 s 0.8 s], PSC3 begins to slowly change towards PSC4. At the same time, the theoretical MPP of the PV array changes with the PSC. The proposed IWOA-P&O algorithm still successfully tracks to the MPP and has good performance during the change of PSCs.
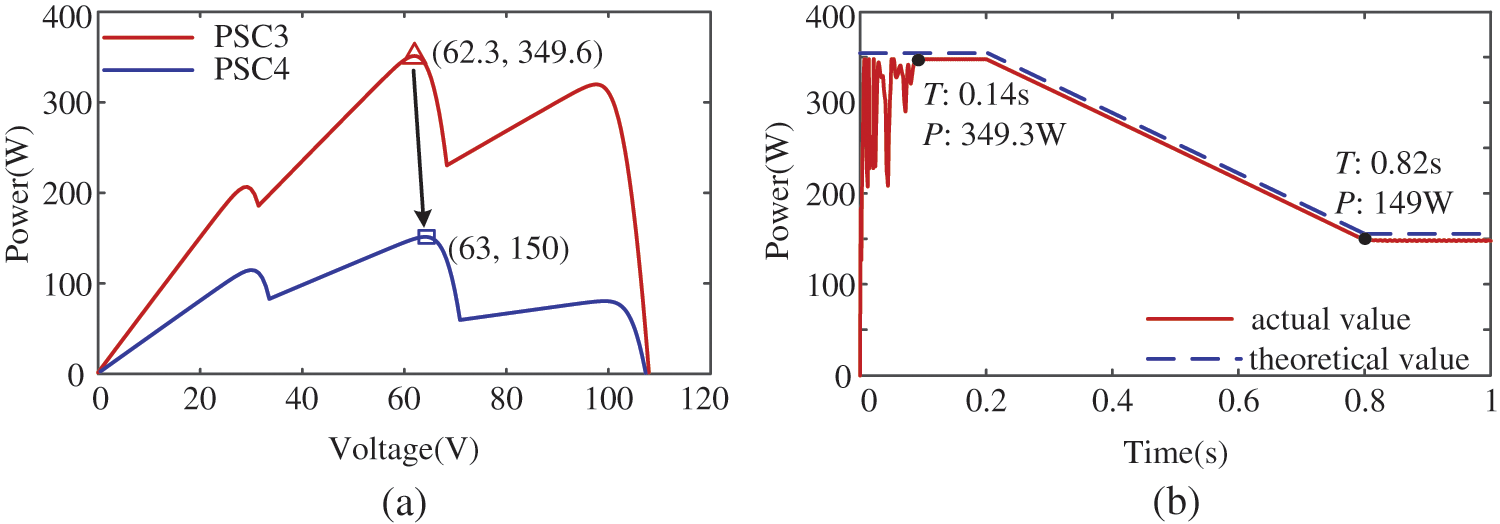
Figure 18: Simulation results under continuously changing PSCs
To validate the proposed MPPT method, a boost circuit experimental platform is built in the lab. The photo of the platform is shown in Fig. 19. The experimental platform mainly consists of the PV simulator, the boost circuit, the control board, the gate driver circuit board, the differential transceiver board, voltage probe, current probe and the oscilloscope. The PV simulator is used to simulate the output of single or multiple peaks under different illuminations. The control board is used to execute the MPPT algorithm. The differential transceiver board and the gate driver board are used to provide sufficient driving capability. Finally, the output curves are monitored by the voltage probe, current probe and oscilloscope.
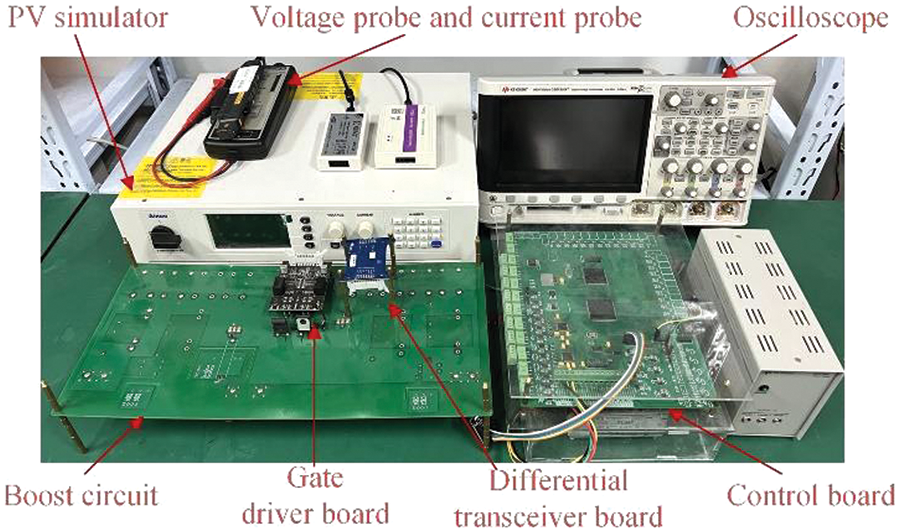
Figure 19: Experimental platform
Three different P-V curves are set up in the experiment to validate different algorithms, which are shown in Fig. 20. In csae1, the P-V curve has only one peak, with a maximum power of 130 W. In case2, the P-V curve has two peaks, with a maximum power of 120 W. In case3, the P-V curve has three peaks, with a maximum power of 110 W. The experimental results in case1 are shown in Fig. 21. The pink and blue lines represent the output power and the voltage of the PV array, respectively. The MPPT algorithm is executed after the end of soft start. The PSO algorithm completes the tracking process in 7 s, with an efficiency of 95.38%. The MPPT time of the PSO-P&O algorithm is 4.8 s, and its efficiency is only 93.08%. However, the IWOA-P&O only takes 2.8 s to track to the MPP. Compared with PSO-P&O, its efficiency of MPPT improves by 5.38%. In case1, IWOA-P&O has a 60% improvement in tracking speed compared to the PSO algorithm. Similarly, in case2 and case3, the MPPT performance of the proposed method is still very superior. As is shown in Fig. 22, the tracking efficiency of the proposed method is 97.5%, which is still the highest among the three algorithms. Compared with the PSO-P&O, the power oscillation of the proposed algorithm is also smaller because it adopts a small step size in the later stage. In case3, compared to the PSO, the proposed method improves tracking speed by nearly 74%, which is shown in Fig. 23. Therefore, whether it has single peak, two peaks, or three peaks, the MPPT performance of the proposed method is the best among the three algorithms.

Figure 20: P-V curves for three cases
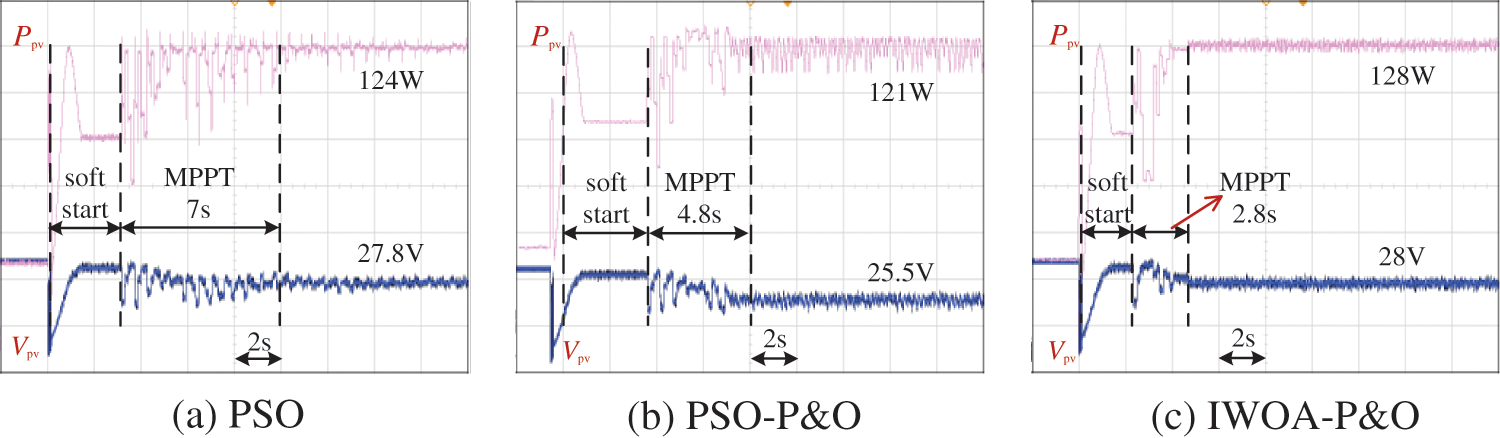
Figure 21: Experimental results of PSO, PSO-P&O and IWOA-P&O algorithms in case1
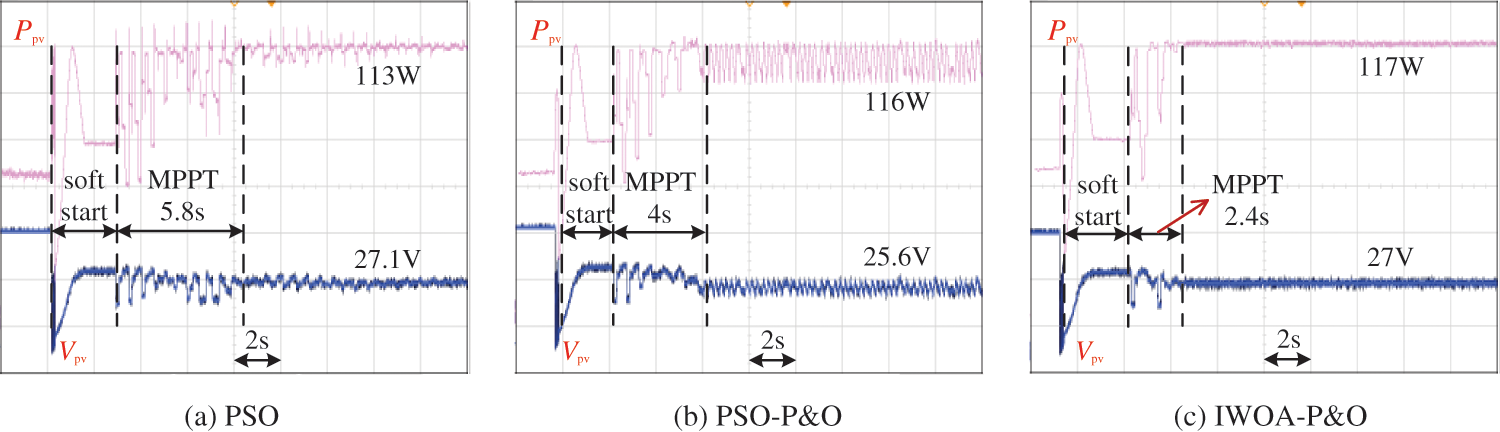
Figure 22: Experimental results of PSO, PSO-P&O and IWOA-P&O algorithms in case2
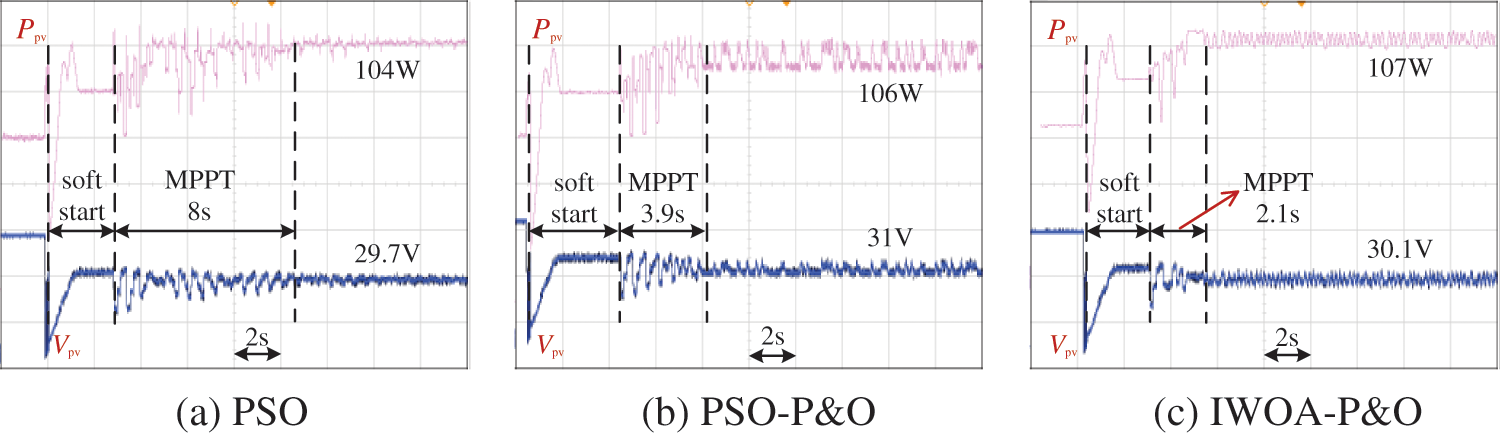
Figure 23: Experimental results of PSO, PSO-P&O and IWOA-P&O algorithms in case3
Aiming at the multi-peak characteristics of PV systems under PSCs, IWOA-P&O is proposed in this paper to realize MPPT. The convergence factor and weight factor are introduced in IWOA-P&O, and combined with P&O of strong local search ability, so the convergence accuracy and speed of MPPT can be effectively improved. The simulations of the PV power generation system are built in MATLAB/Simulink. Simulation results show that Compared with WOA, PSO, P&O, and PSO-P&O, the convergence time of IWOA-P&O is all within 0.21 s, the average convergence time is reduced by more than 50%, and the average efficiency of MPPT reaches 99.79%. In addition, in the case of illumination variation, IWOA-P&O can restart, the convergence speed is faster, and the tracking efficiency is higher. Finally, experimental verification is conducted. Experimental results show that the proposed method is feasible, avoids the disadvantage of falling into the LMPP, reduces power loss, and has good stability.
Acknowledgement: The authors would like to express their gratitude to the reviewers and the editor.
Funding Statement: This work was supported in part by the Natural Science Foundation of Jiangsu Province under Grant BK20200969 (L. Z., URL: http://std.jiangsu.gov.cn/), and in part by Basic Science (Natural Science) Research Project of Colleges and Universities in Jiangsu Province under Grant 22KJB470025 (L. R., URL: http://jyt.jiangsu.gov.cn/), and in part by Social People’s Livelihood Technology Plan General Project of Nantong under Grant MS12021015 (L. Q., URL: http://kjj.nantong.gov.cn/).
Author Contributions: The authors confirm contribution to the paper as follows: study conception and design: Jian Zhong, Lei Zhang, Ling Qin; data collection: Ling Qin; analysis and interpretation of results: Jian Zhong, Lei Zhang; draft manuscript preparation: Jian Zhong. All authors reviewed the results and approved the final version of the manuscript.
Availability of Data and Materials: Data supporting this study are included within the article.
Conflicts of Interest: The authors declare that they have no conflicts of interest to report regarding the present study.
References
1. Sawant, D. S., Rao, Y. S., Sawant, R. R. (2022). Analysis of maximum power point tracking system using P&O and INC method. International Conference on Smart Generation Computing, Communication and Networking (SMART GENCON), pp. 1–6. Bangalore, India. [Google Scholar]
2. Alshareef, M. J. (2022). An effective falcon optimization algorithm based MPPT under partial shaded photovoltaic systems. IEEE Access, 10, 131345–131360. [Google Scholar]
3. Riquelme-Dominguez, J. M., Martinez, S. (2022). Systematic evaluation of photovoltaic MPPT algorithms using state-space models under different dynamic test procedures. IEEE Access, 10, 45772–45783. [Google Scholar]
4. Jately, V., Azzopardi, B., Joshi, J., Sharma, A., Arora, S. (2021). Experimental analysis of hill-climbing MPPT algorithms under low irradiance levels. Renewable and Sustainable Energy Reviews, 150, 111467. [Google Scholar]
5. Zhao, S. Q., Xiao, H., Liu, Z. B., Zhu, Z. J. (2020). Maximum power point tracking of photovoltaics under local shading based on CSA-IP&O. Power System Protection and Control, 48(5), 26–32. [Google Scholar]
6. Bhattacharyya, S., Samanta, S., Mishra, S. (2020). Steady output and fast tracking MPPT (SOFT-MPPT) for P&O and INC algorithms. IEEE Transactions on Sustainable Energy, 12(1), 293–302. [Google Scholar]
7. Alam, M. N., Ifty, M. H., Nobi, R., Hossain, S., Al Rajin, M. A. (2022). Design and development of battery integrated PV system using MPPT. International Conference on Electrical and Computer Engineering (ICECE), pp. 156–159. Dhaka, Bangladesh. [Google Scholar]
8. Celikel, R., Yilmaz, M., Gundogdu, A. (2022). A voltage scanning-based MPPT method for PV power systems under complex partial shading conditions. Renewable Energy, 184(4), 361–373. [Google Scholar]
9. Kouchaki, A., Eskandari, A., Milimonfared, J., Aghaei, M. (2023). An adaptive technique of MPPT for PV array under partial and dynamic shading conditions. Power Electronics, Drive Systems, and Technologies Conference (PEDSTC), pp. 1–6. Babol, Iran. [Google Scholar]
10. Morales, R. H., Rohten, J. A., Garbarino, M. N., Muñoz, J. A., Silva, J. J. et al. (2022). A novel global maximum power point tracking method based on measurement cells. IEEE Access, 10, 97481–97494. [Google Scholar]
11. Jiang, P., Luan, Y. J., Zhang, W., Tian, J., Dai, J. C. (2021). A study of multi-peak MPPT based on improved PSO under partial shading. Journal of Solar Energy, 42(8), 140–145. [Google Scholar]
12. Ballaji, A., Dash, R., Subburaj, V., Kalvakurthi, J. R., Swain, D. et al. (2022). Design & development of MPPT using PSO with predefined search space based on fuzzy fokker planck solution. IEEE Access, 10, 80764–80783. [Google Scholar]
13. Javed, S., Ishaque, K., Siddique, S. A., Salam, Z. (2021). A simple yet fully adaptive PSO algorithm for global peak tracking of photovoltaic array under partial shading conditions. IEEE Transactions on Industrial Electronics, 69(6), 5922–5930. [Google Scholar]
14. Farh, H. M., Eltamaly, A. M., Othman, M. F. (2018). Hybrid PSO-FLC for dynamic global peak extraction of the partially shaded photovoltaic system. PLoS One, 13(11), e0206171. [Google Scholar] [PubMed]
15. Joisher, M., Singh, D., Taheri, S., Espinoza-Trejo, D. R., Pouresmaeil, E. et al. (2020). A hybrid evolutionary-based MPPT for photovoltaic systems under partial shading conditions. IEEE Access, 8, 38481–38492. [Google Scholar]
16. Eltamaly, A. M., Al-Saud, M. S., Abokhalil, A. G., Farh, H. M. (2020). Simulation and experimental validation of fast adaptive particle swarm optimization strategy for photovoltaic global peak tracker under dynamic partial shading. Renewable and Sustainable Energy Reviews, 124, 109719. [Google Scholar]
17. Harmini, Ashari, M. (2022). Optimalization of ANFIS-PSO algorithm based on MPPT control for PV system under rapidly changing weather condition. IEEE International Conference in Power Engineering Application (ICPEA), pp. 1–6. Shah Alam, Malaysia. [Google Scholar]
18. Gawande, M. K., Ghulaxe, S. G., Mahatme, T. R., Salvi, A. S., Bagewadi, M. D. (2021). Modern approach for hybridization of PSO-INC MPPT methods for efficient solar power tracking. Global Conference for Advancement in Technology (GCAT), pp. 1–6. Bangalore, India. [Google Scholar]
19. Makhloufi, S., Mekhilef, S. (2022). Logarithmic PSO-based global/local maximum power point tracker for partially shaded photovoltaic systems. IEEE Journal of Emerging and Selected Topics in Power Electronics, 10(1), 375–386. [Google Scholar]
20. Ibrahim, A. W., Shafik, M. B., Ding, M., Sarhan, M. A., Fang, Z. J. et al. (2020). PV maximum power-point tracking using modified particle swarm optimization under partial shading conditions. Chinese Journal of Electrical Engineering, 6(4), 106–121. [Google Scholar]
21. Hu, K., Cao, S., Li, W., Zhu, F. (2019). An improved particle swarm optimization algorithm suitable for photovoltaic power tracking under partial shading conditions. IEEE Access, 7, 143217–143232. [Google Scholar]
22. Zand, S. J., Mobayen, S., Gul, H. Z., Molashahi, H., Nasiri, M. et al. (2022). Optimized fuzzy controller based on cuckoo optimization algorithm for maximum power-point tracking of photovoltaic systems. IEEE Access, 10, 71699–71716. [Google Scholar]
23. Millah, I. S., Chang, P. C., Teshome, D. F., Subroto, R. K., Lian, K. L. et al. (2022). An enhanced grey wolf optimization algorithm for photovoltaic maximum power point tracking control under partial shading conditions. IEEE Open Journal of the Industrial Electronics Society, 3, 392–408. [Google Scholar]
24. Bhukya, L., Nandiraju, S. (2020). A novel photovoltaic maximum power point tracking technique based on grasshopper optimized fuzzy logic approach. International Journal of Hydrogen Energy, 45(16), 9416–9427. [Google Scholar]
25. Huang, Y. P., Huang, M. Y., Ye, C. E. (2020). A fusion firefly algorithm with simplified propagation for photovoltaic MPPT under partial shading conditions. IEEE Transactions on Sustainable Energy, 11(4), 2641–2652. [Google Scholar]
26. Suyanto, S., Mohammad, L., Setiadi, I. C., Roekmono, R. (2019). Analysis and evaluation performance of MPPT algorithms: Perturb & observe (P&Ofirefly, and flower pollination (FPA) in smart microgrid solar panel systems. International Conference on Technologies and Policies in Electric Power & Energy, pp. 1–6. Yogyakarta, Indonesia, IEEE. [Google Scholar]
27. Farajdadian, S., Hosseini, S. H. (2019). Design of an optimal fuzzy controller to obtain maximum power in solar power generation system. Solar Energy, 182, 161–178. [Google Scholar]
28. Teshome, D. F., Lee, C. H., Lin, Y. W., Lian, K. L. (2016). A modified firefly algorithm for photovoltaic maximum power point tracking control under partial shading. IEEE Journal of Emerging and Selected Topics in Power Electronics, 5(2), 661–671. [Google Scholar]
29. Hassan, A., Bass, O., Masoum, M. A. (2023). An improved genetic algorithm based fractional open circuit voltage MPPT for solar PV systems. Energy Reports, 9, 1535–1548. [Google Scholar]
30. Zhang, Y., Wang, Y. J., Zhang, Y., Yu, T. (2022). Photovoltaic fuzzy logical control MPPT based on adaptive genetic simulated annealing algorithm-optimized BP neural network. Processes, 10(7), 1411. [Google Scholar]
31. Mohammed, S. S., Devaraj, D., Ahamed, T. I. (2021). GA-optimized fuzzy-based MPPT technique for abruptly varying environmental conditions. Journal of the Institution of Engineers (IndiaSeries B, 102, 497–508. [Google Scholar]
32. Mirjalili, S., Lewis, A. (2016). The whale optimization algorithm. Advances in Engineering Software, 95, 51–67. [Google Scholar]
33. GU, W. (2020). An improved whale optimization algorithm with cultural mechanism for high-dimensional global optimization problems. IEEE International Conference on Information Technology, Big Data and Artificial Intelligence (ICIBA), pp. 1282–1286. Chongqing, China. [Google Scholar]
Cite This Article
 Copyright © 2024 The Author(s). Published by Tech Science Press.
This work is licensed under a Creative Commons Attribution 4.0 International License , which permits unrestricted use, distribution, and reproduction in any medium, provided the original work is properly cited.
 Downloads
 Citation Tools