
 Submit a Paper
 Propose a Special lssue
 Open Access
ARTICLE

Weather-Driven Solar Power Forecasting Using D-Informer: Enhancing Predictions with Climate Variables
1 School of Electrical Engineering, Northeast Electric Power University, Jilin, 132013, China
2 Shenzhen Institute of Advanced Technology, Chinese Academy of Sciences, Shenzhen, 518055, China
* Corresponding Author: Zhao An. Email:
Energy Engineering 2024, 121(5), 1245-1261. https://doi.org/10.32604/ee.2024.046644
Received 09 October 2023; Accepted 29 December 2023; Issue published 30 April 2024
 View Full Text
 Download PDF
Abstract
Precise forecasting of solar power is crucial for the development of sustainable energy systems. Contemporary forecasting approaches often fail to adequately consider the crucial role of weather factors in photovoltaic (PV) power generation and encounter issues such as gradient explosion or disappearance when dealing with extensive time-series data. To overcome these challenges, this research presents a cutting-edge, multi-stage forecasting method called D-Informer. This method skillfully merges the differential transformation algorithm with the Informer model, leveraging a detailed array of meteorological variables and historical PV power generation records. The D-Informer model exhibits remarkable superiority over competing models across multiple performance metrics, achieving on average a 67.64% reduction in mean squared error (MSE), a 49.58% decrease in mean absolute error (MAE), and a 43.43% reduction in root mean square error (RMSE). Moreover, it attained an R² value as high as 0.9917 during the winter season, highlighting its precision and dependability. This significant advancement can be primarily attributed to the incorporation of a multi-head self-attention mechanism, which greatly enhances the model’s ability to identify complex interactions among diverse input variables, and the inclusion of weather variables, enriching the model’s input data and strengthening its predictive accuracy in time series analysis. Additionally, the experimental results confirm the effectiveness of the proposed approach.Graphic Abstract
Keywords
Photovoltaic (PV) power generation is a pivotal component in the suite of modern green energy solutions, with its undeniable significance. The world is currently facing a gradual decline in fossil fuel reserves, compounded by increasing concerns over environmental pollution, prompting a worldwide shift towards sustainable and clean energy sources [1–3]. In this evolving energy landscape, PV power generation has gained prominence due to its eco-friendly characteristics, renewable nature, and low carbon emissions, positioning itself as a key element in the global energy transition. However, challenges such as the variability in PV power output and the difficulties in achieving accurate forecasting continue to pose significant obstacles to the widespread adoption of PV technology. Consequently, developing more accurate and reliable methods for forecasting PV power generation is critically important. This is not only essential for the continued expansion of the PV industry but also for addressing the broader energy challenges faced globally [4].
In the energy field, artificial intelligence methods have been widely used in various scenarios, such as design optimization, dispatching, and load forecasting. These approaches have yielded impressive outcomes in their respective applications [5–7]. In areas like electricity market trading, grid dispatching, and energy management, accurate forecasting is a crucial tool for operators and decision-makers, enabling more efficient and dependable operations. Historically, traditional methodologies for predicting PV power generation have predominantly employed statistical and empirical models, including Autoregressive (AR), Moving Average (MA), and Autoregressive Moving Average (ARMA) models, among others. In addition, machine learning techniques such as Support Vector Machines (SVM), Random Forests (RF), and Decision Trees (DT) have been extensively utilized [8–12]. However, considering the complex interaction between various climatic elements and system parameters affecting PV power generation, these traditional methods frequently struggle in the face of rapidly changing and nonlinear weather conditions. This leads to forecasting results that are often not as precise as desired [13,14].
Addressing these challenges, researchers have delved into understanding the influence of climatic factors on the efficiency and output of PV power generation [15]. Solar radiation, being the primary energy source for PV systems, significantly affects panel efficiency through its intensity and incidence angle. Additionally, under overcast or hazy conditions, diffuse radiation plays a role in PV power generation [16,17]. Temperature also emerges as a pivotal factor. While higher temperatures may increase solar radiation intensity, they can simultaneously decrease the efficiency of PV cells. Other meteorological conditions like cloudiness, precipitation, and snow also considerably impact PV power generation [18]. For example, cloud cover can reduce solar radiation intensity, and rainy or snowy conditions can either block sunlight or reduce panel efficiency [19]. Gaining a comprehensive understanding of these weather impacts is crucial for enhancing forecast accuracy [20]. Although the integration of weather variables can enhance the precision of PV power generation forecasts, traditional machine learning techniques face challenges in handling high-dimensional, non-linear, and long-term dependency data [21]. The emergence of deep learning technologies presents new opportunities to overcome these limitations [22].
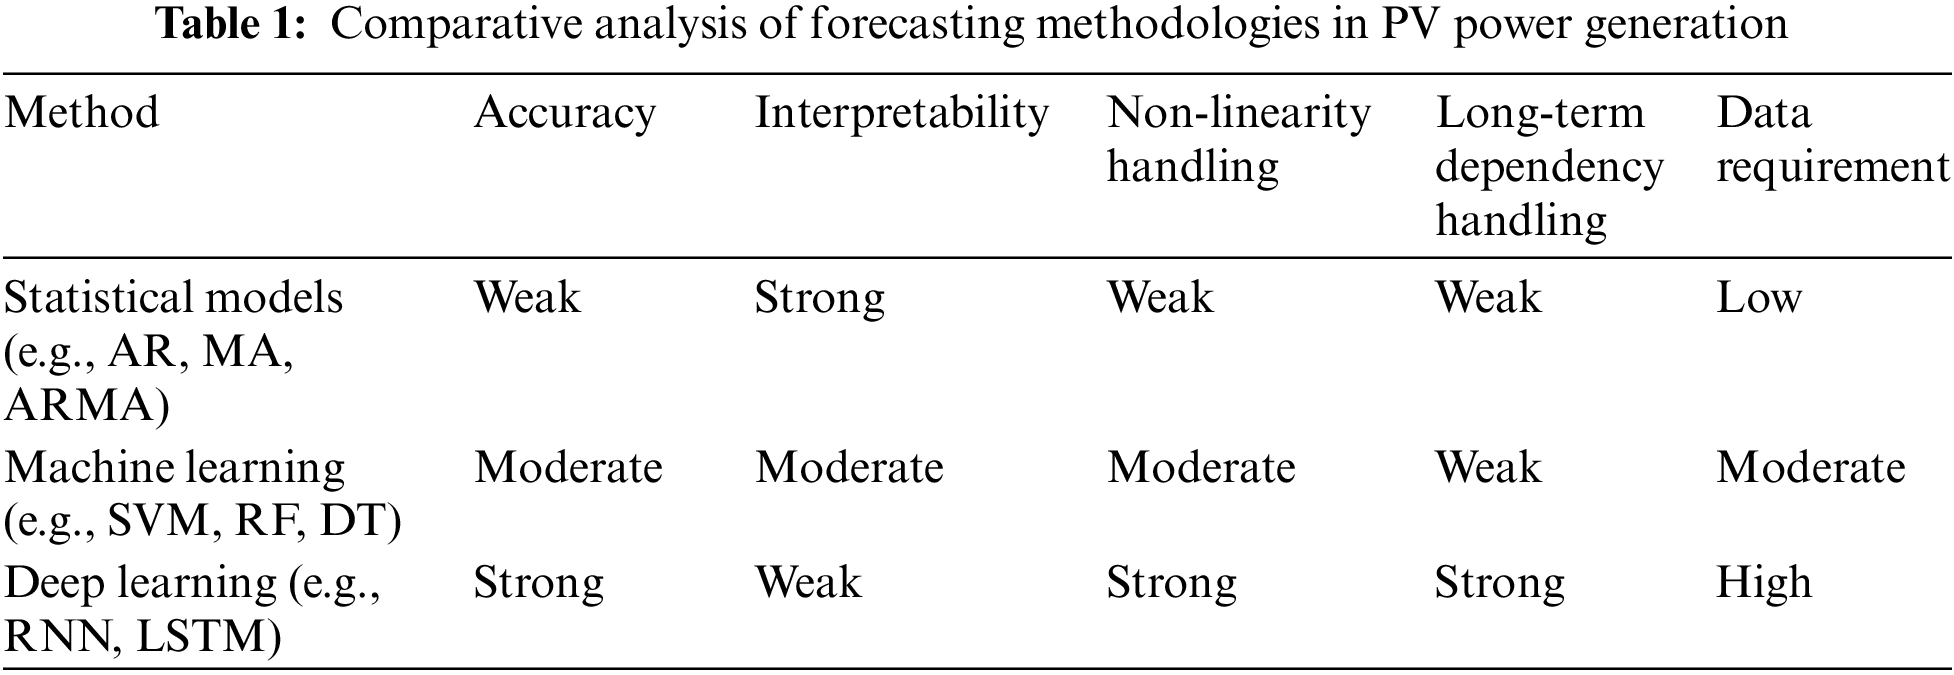
Deep learning technologies are capable of handling large amounts of data and automatically extracting useful features from them, offering new possibilities for forecasting PV power generation. Time series prediction models such as Recurrent Neural Networks (RNN), Long Short-Term Memory Networks (LSTM), and Gated Recurrent Units (GRU) have achieved notable results in PV power generation forecasting [23–26]. These models can capture the long-term dependencies and complex patterns in time series data, thereby enhancing forecasting accuracy. Nonetheless, although deep learning models have achieved certain milestones in PV power forecasting, a plethora of challenges persists [27–29]. Typically, these models demand a considerable volume of labeled data, and there is notable room for improvement in terms of model interpretability and explainability [30–33]. Table 1 provides a detailed comparative analysis of these forecasting methodologies in PV power generation.
This paper presents D-Informer, a new PV power generation forecasting method driven by weather conditions, enhancing the accuracy of PV power forecasts by integrating weather variables with differential algorithms. Initially, multi-dimensional input data is provided to the model using weather data such as temperature, radiation values, and scatter values, along with historical PV power generation data. Subsequently, the PV data undergo differential transformation to enhance data stability and are then input into a deep learning prediction model together with the weather data. Finally, the model, equipped with multi-head attention mechanisms, outputs the PV power forecasting results. Experiments demonstrate that D-Informer significantly outperforms other time series forecasting models across various performance metrics. Notably, D-Informer’s R² value reaches an almost perfect 0.9917 in winter, further substantiating the method’s accuracy and reliability in predicting PV power generation.
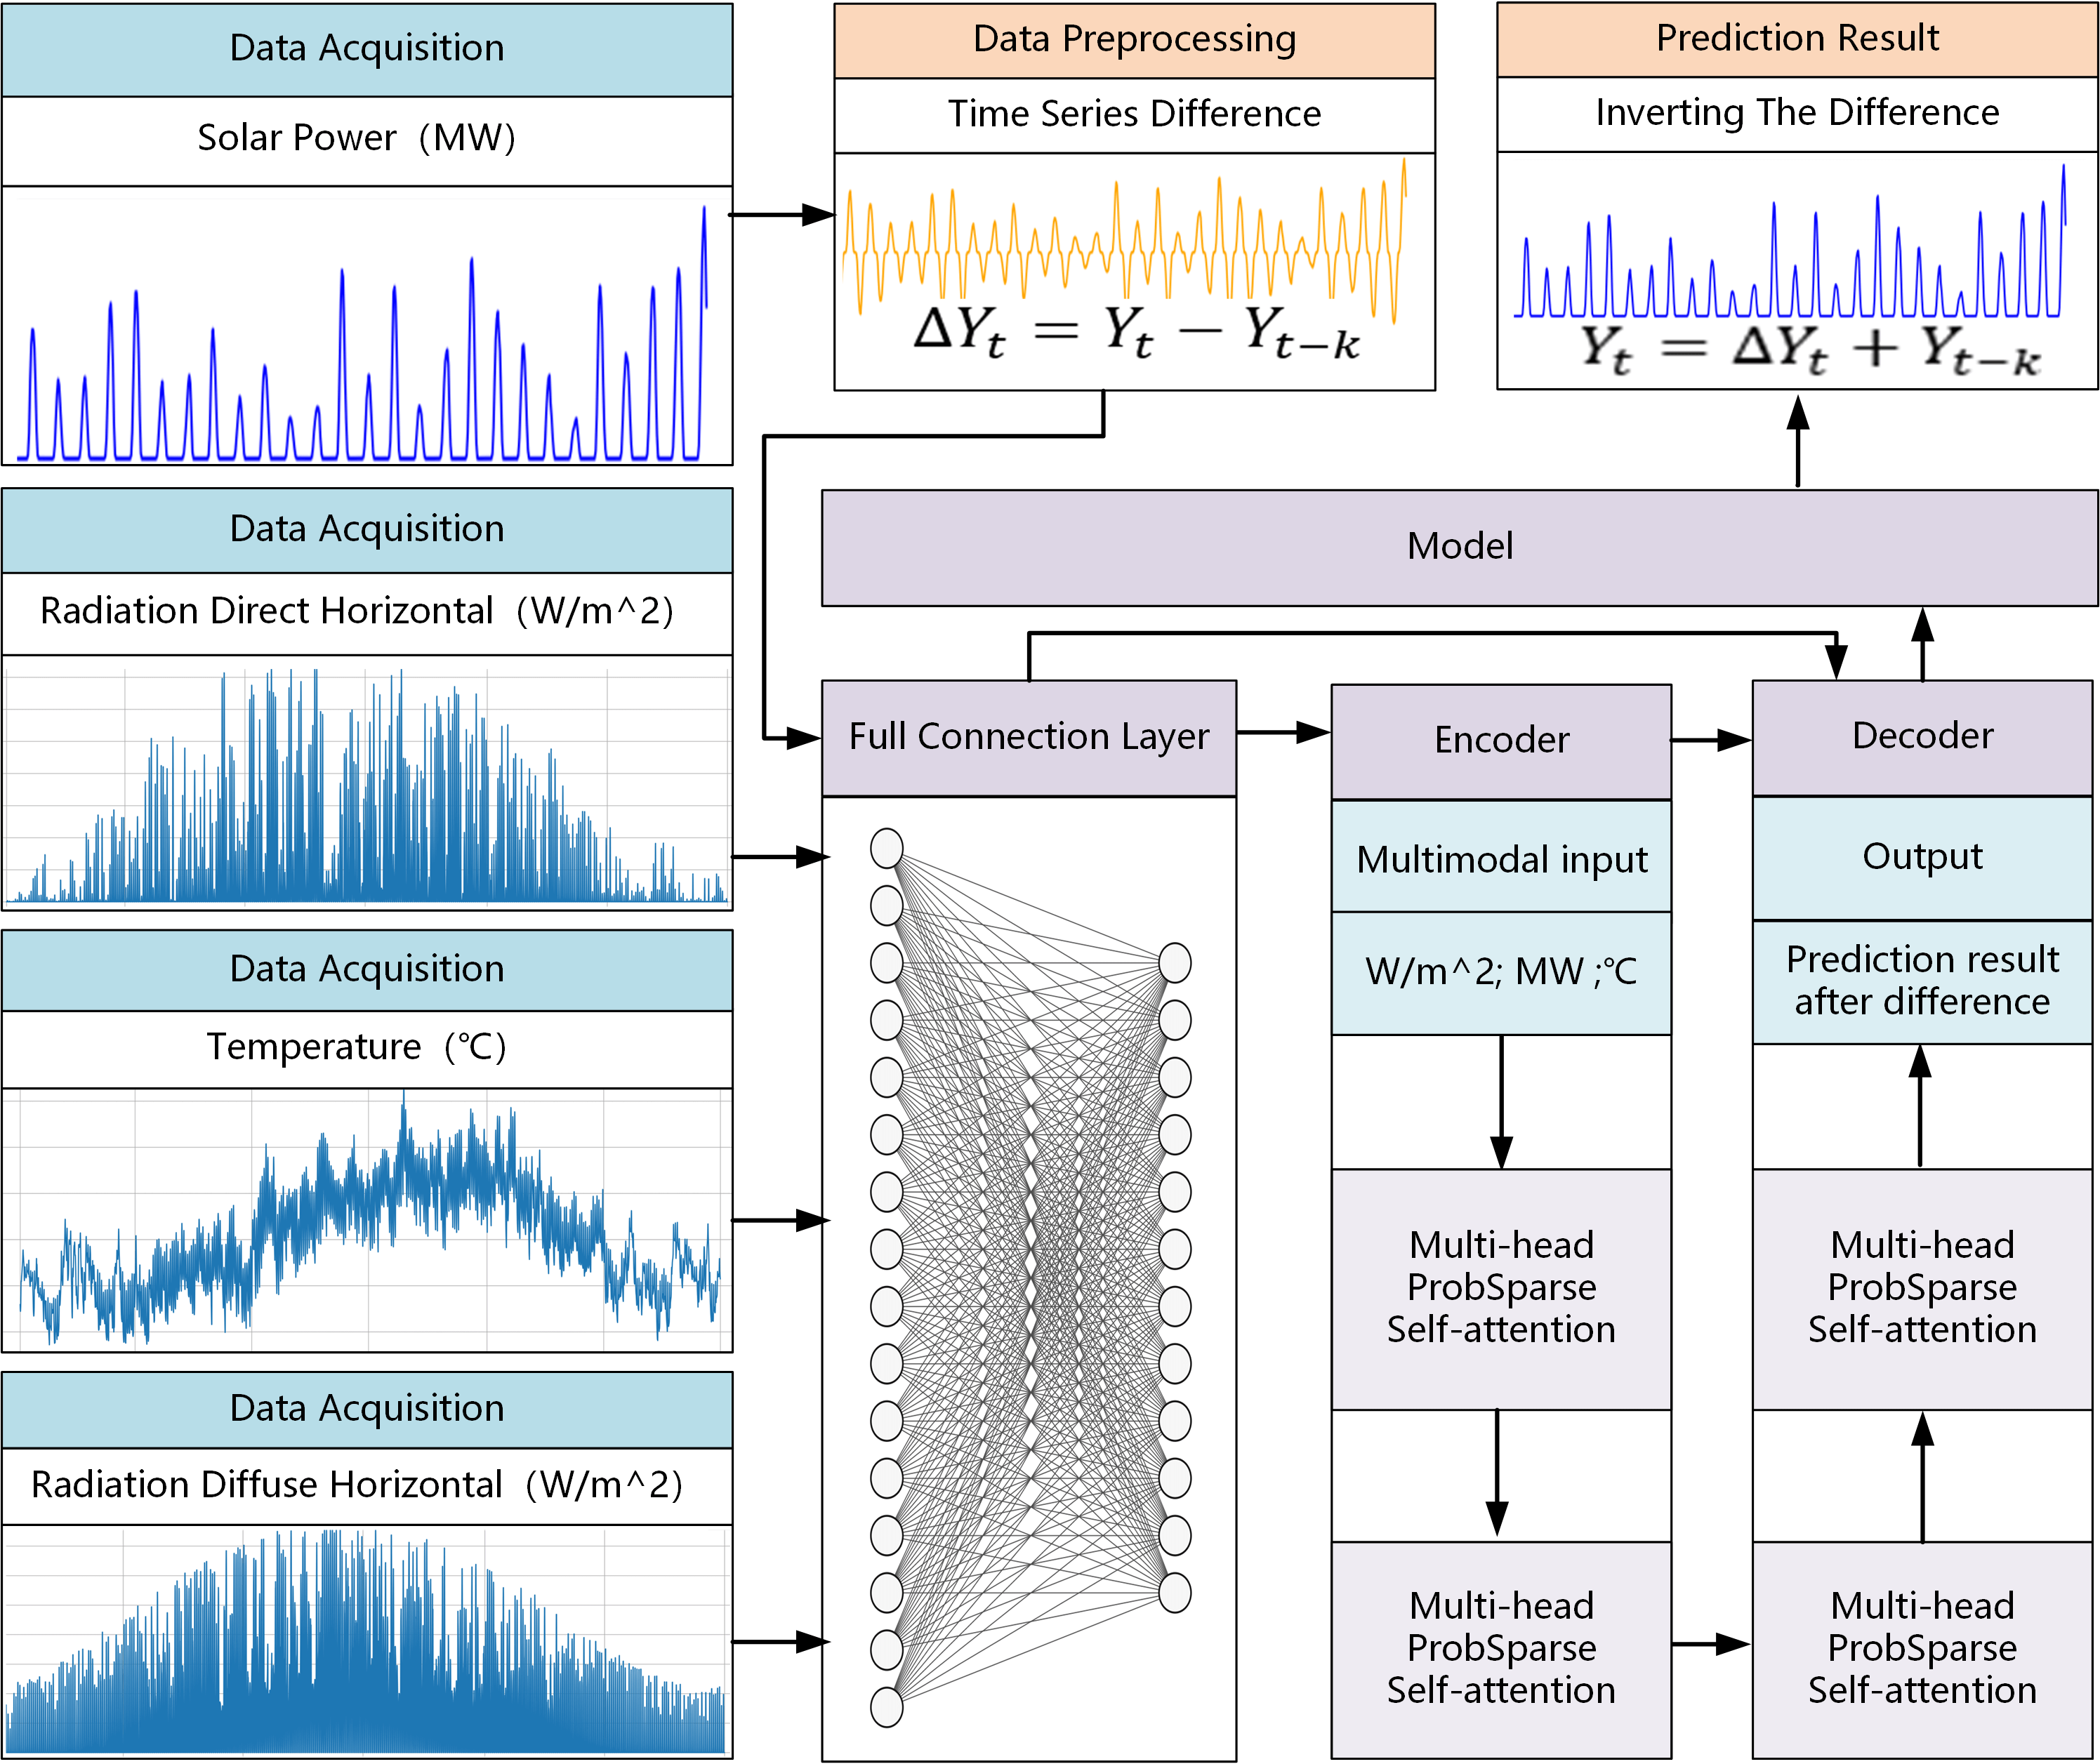
This section chiefly outlines the multi-stage forecasting framework being proposed. The overarching goal of this framework is to attain precise PV power generation forecasting by integrating inputs from weather variables and employing deep learning methodologies. Initially, the historical PV power data undergo a differencing transformation to remove any linear trends and instabilities, thereby establishing a more stable foundation for further analysis. Following this, the altered data, combined with temperature, direct horizontal radiation, and diffuse horizontal radiation, are input into a fully connected neural network to extract pertinent features. This phase is crucial for identifying the intrinsic connections between PV data and weather variables, yielding enriched features for subsequent time series prediction. The D-Informer model, equipped with multi-head attention mechanisms, is then utilized for forecasting the time series. After forecasting, the predicted outcomes are converted back to the original PV power generation scale using an inverse differencing transformation. The entire procedure is illustrated in Fig. 1. The different stages of the modeling mechanism are described in detail as follows:
• Data Preprocessing: During the initial phase, historical PV power generation data undergoes a differencing transformation. This method is adept at mitigating data non-stationarity and removing any linear trends, thereby establishing a more stable basis for the subsequent processing and analytical stages.
• Fully Connected Layer: In this phase, the transformed PV data is merged with three key weather variables–temperature, direct horizontal radiation, and diffuse horizontal radiation–to create a comprehensive multi-dimensional input feature matrix. This matrix is then processed through a fully connected neural network for extracting features. The primary aim of this network is to uncover and elucidate the hidden relationships between PV data and weather variables, furnishing a rich feature set for the ensuing prediction task.
• Prediction Model: At this phase, the D-Informer’s network architecture is utilized for forecasting time series using the consolidated features. Equipped with a multi-head attention mechanism and an encoder-decoder structure, D-Informer excels at identifying long-term dependencies and intricate patterns within the time series data. Upon completion of the training, applying the model to the test data yields the D-Informer’s predictions.
• Result Generation: The final stage involves applying an inverse differencing transformation to the D-Informer’s predictions, restoring them to the original PV power generation scale. This transformation effectively reverses the initial differencing process, converting the forecasted results back to their original data scale, thereby rendering the predictions practically applicable and insightful.
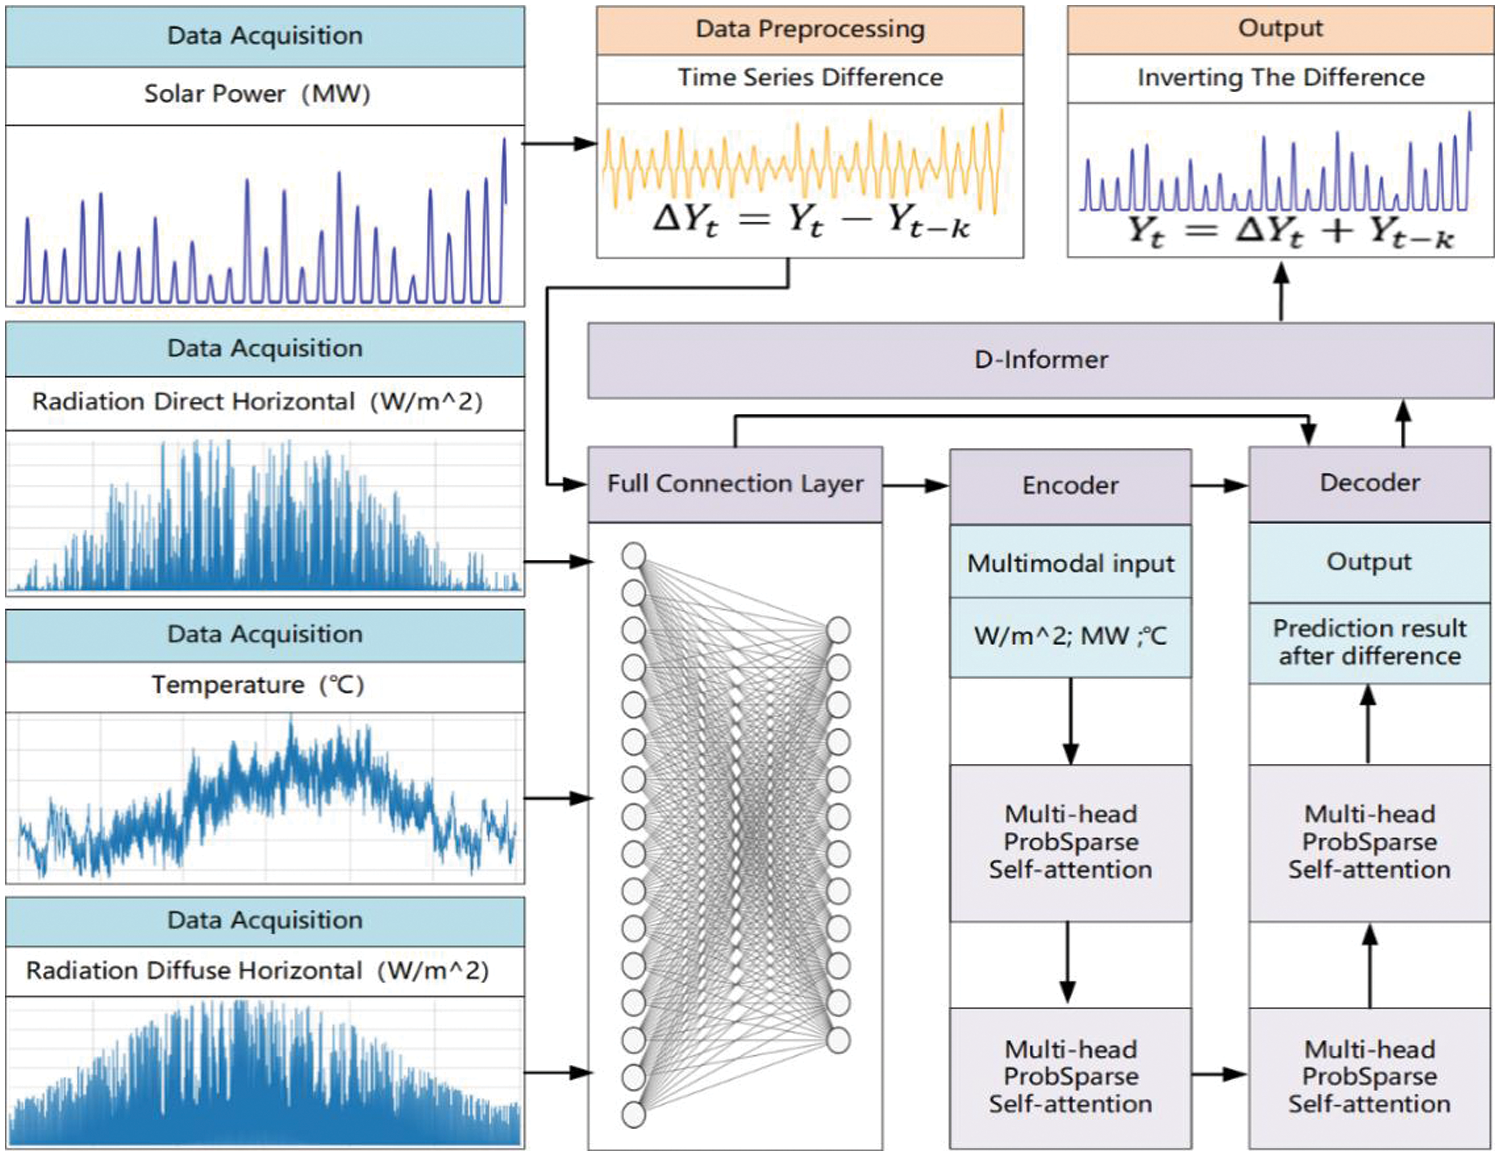
Figure 1: The framework of D-Informer
2.1 Differencing Transformation and Inverse Differencing Transformation
Differencing transformation, a widely used data preprocessing method, is mainly applied to remove non-stationarity from time series data, thus establishing a stable data foundation for further analysis and forecasting. As sunrise and sunset times vary over time, nighttime PV power data, even though it does not generate electricity, aids the model in better understanding and learning the daily cyclical patterns of PV power. Therefore, in this paper, we apply a differencing transformation to transform the PV data accordingly. Given a time series
where,
The window size of the differencing transformation is an important parameter, which needs to be selected based on the specific characteristics of the data. In this study, we compared the effects of different window sizes through experiments, as shown in Fig. 2. It can be observed that differencing windows directly correlated with complete days, such as 24, 48, and 72 h, possess a higher number of zeros. This could be attributed to the fact that solar power generation is zero during certain fixed periods of the day, such as at night. When employing these differencing windows corresponding to complete days, these inherent zeros might be emphasized or repeated. Conversely, the “intermediate” windows that do not directly correspond to complete days, such as 12, 36, and 60 h, exhibit fewer zeros. These windows might more effectively capture the variations and non-daily patterns in the data, leading to fewer zeros.
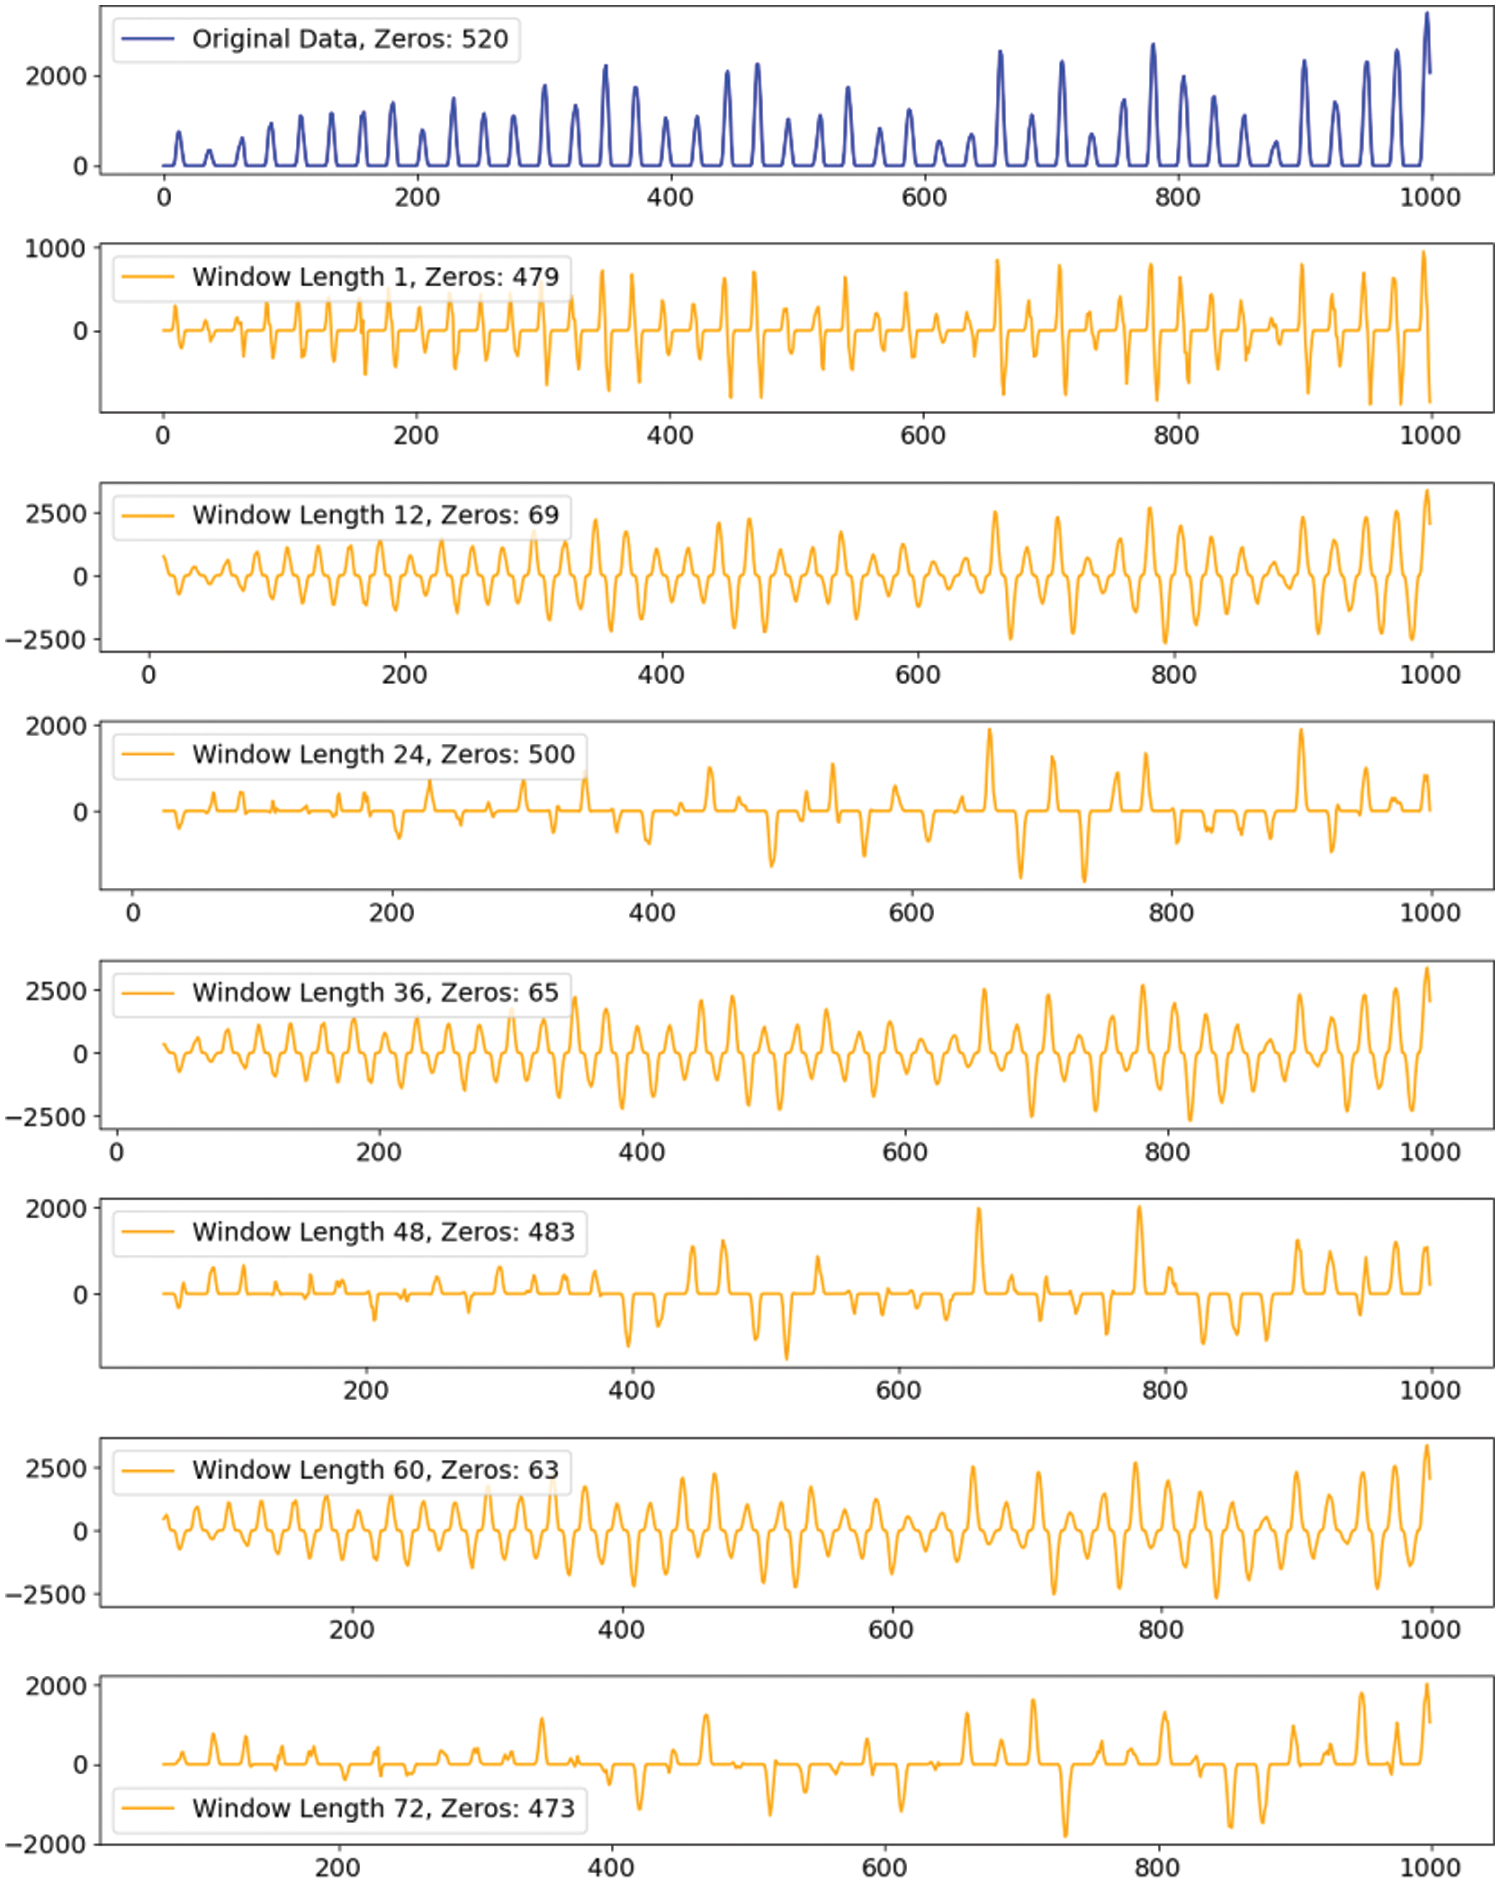
Figure 2: Comparative analysis of PV data differenced over multiple window lengths
Based on previous observations, it becomes clear that choosing “intermediate” differencing windows, not precisely matching full-day cycles, may offer advantages in certain contexts. For this research, we opted for a 36-h differencing window. Spanning a one-and-a-half-day period, this window appears to be more adept at capturing the transition between night and day, as well as the variances over consecutive days. The goal of this method is to reduce the number of zeros and maintain the essential structure and details in the data, ultimately improving the accuracy of the forecasts. The inverse differencing transformation is the reverse operation of the differencing transformation, used to restore the differenced data to its original scale. Given the differenced series
By doing so, the forecasted outcomes from the model are converted back to their original scale, making the interpretation and further analysis of these results more straightforward. The following subsection will offer an in-depth explanation of the integration process of weather data with PV data, along with details on the structure and functionality of the fully connected neural network.
2.2 Data Integration and Fully Connected Neural Network
This subsection delves into the three key climate variables impacting solar power generation: temperature, direct horizontal radiation, and diffuse horizontal radiation, as well as the fusion method of integrating weather data and PV data as inputs to the model. The climate data from Great Britain (GB) spanning the years 2016 to 2019 is illustrated in Figs. 3–5 [34].
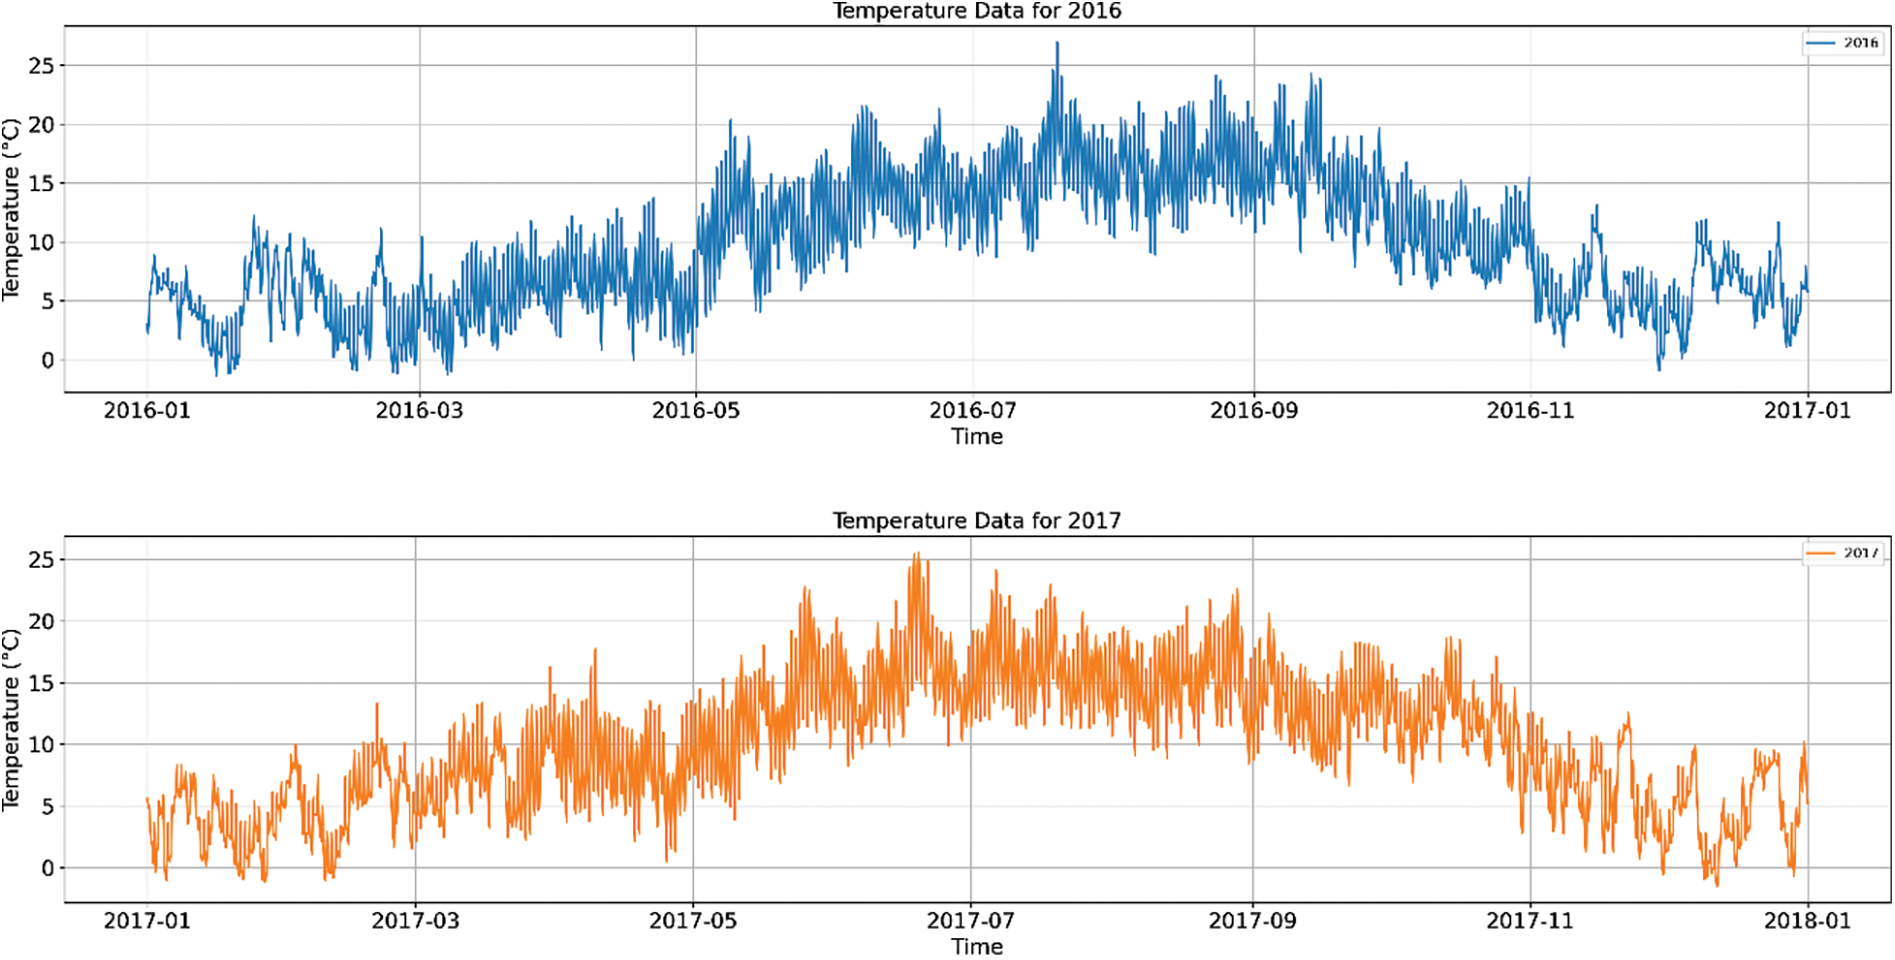
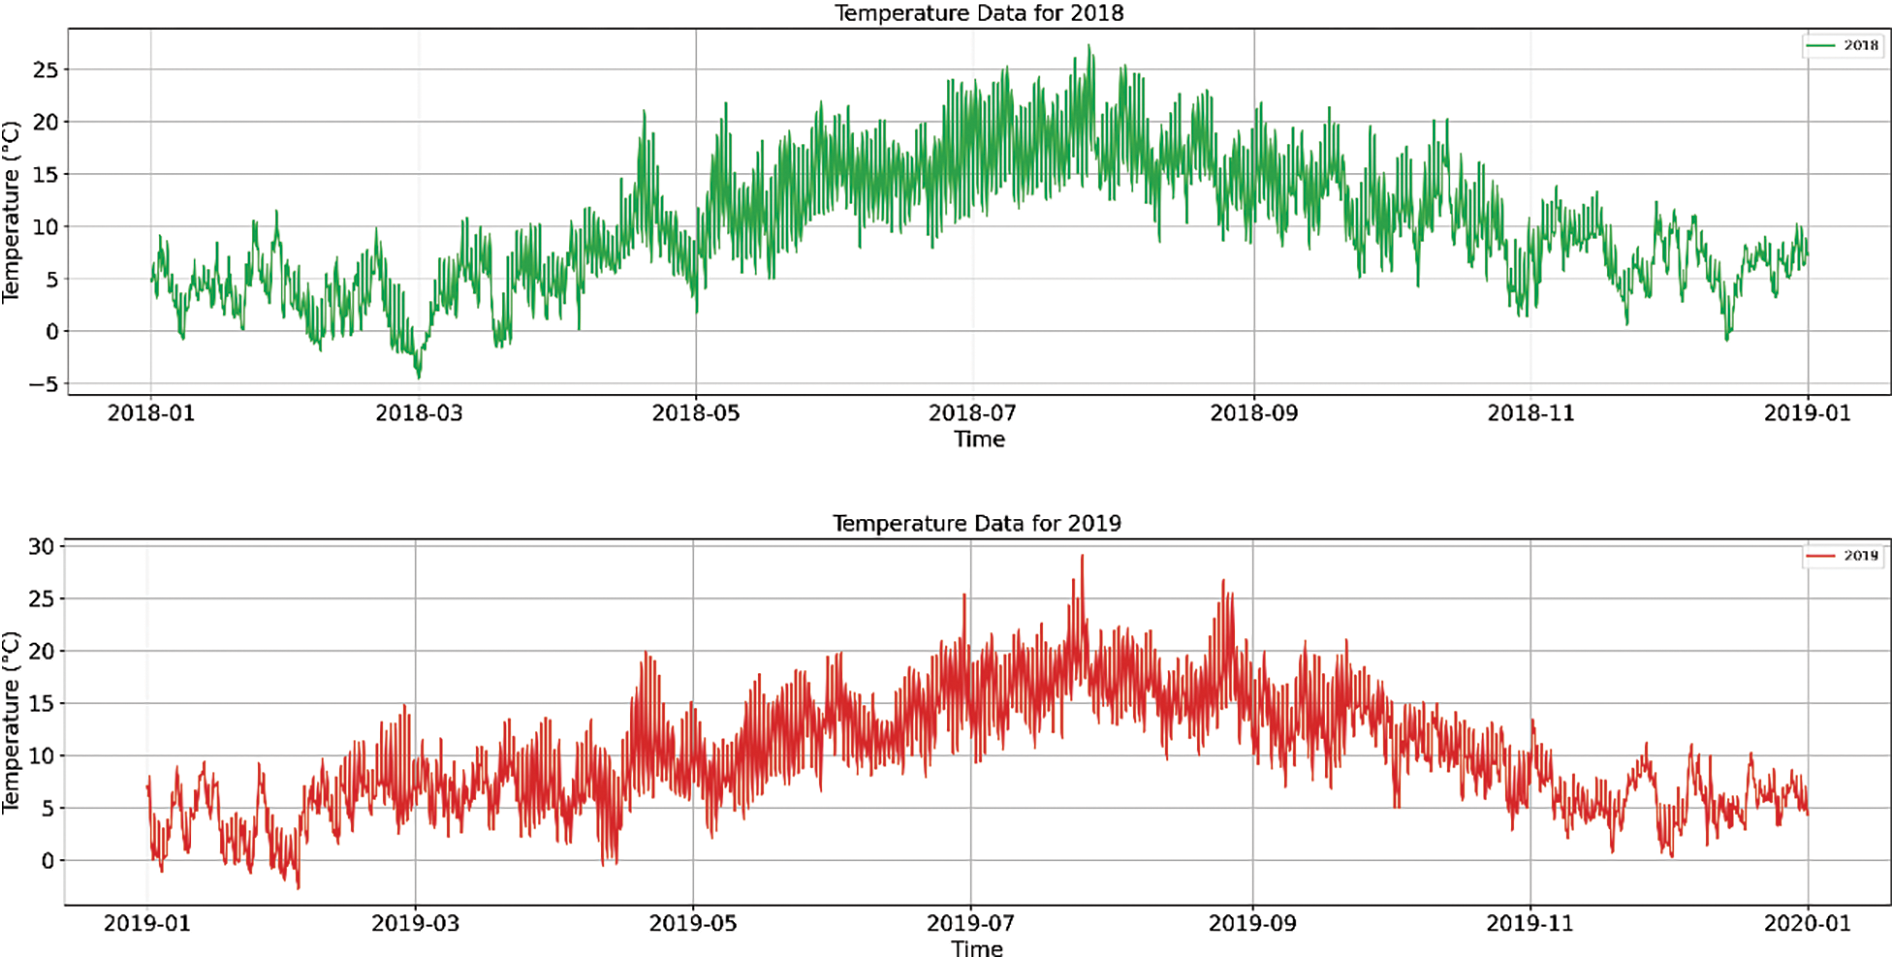
Figure 3: GB temperature for 2016 to 2019
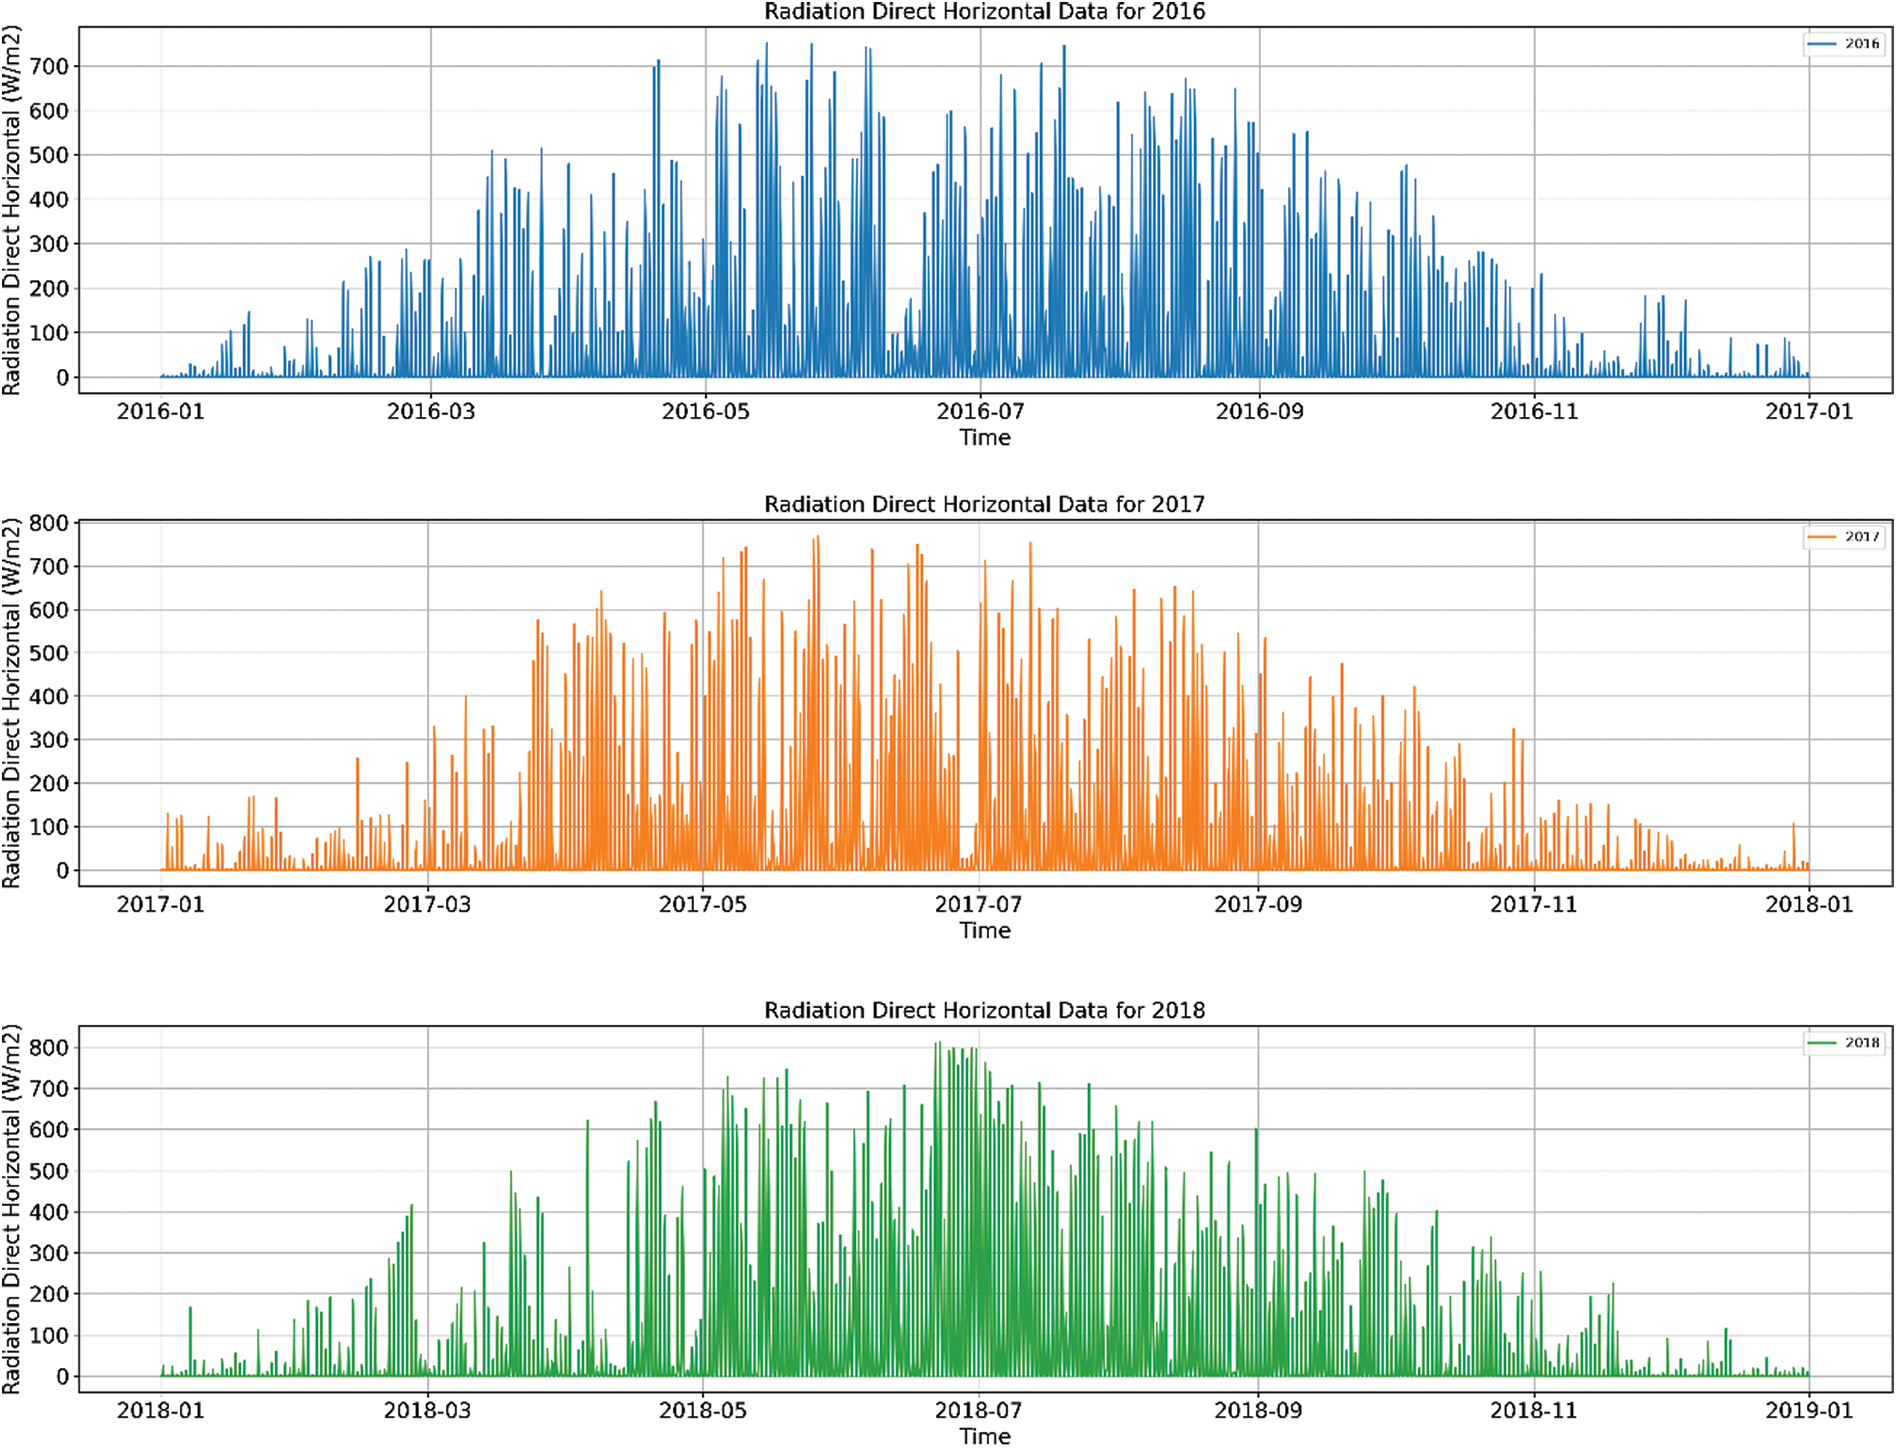
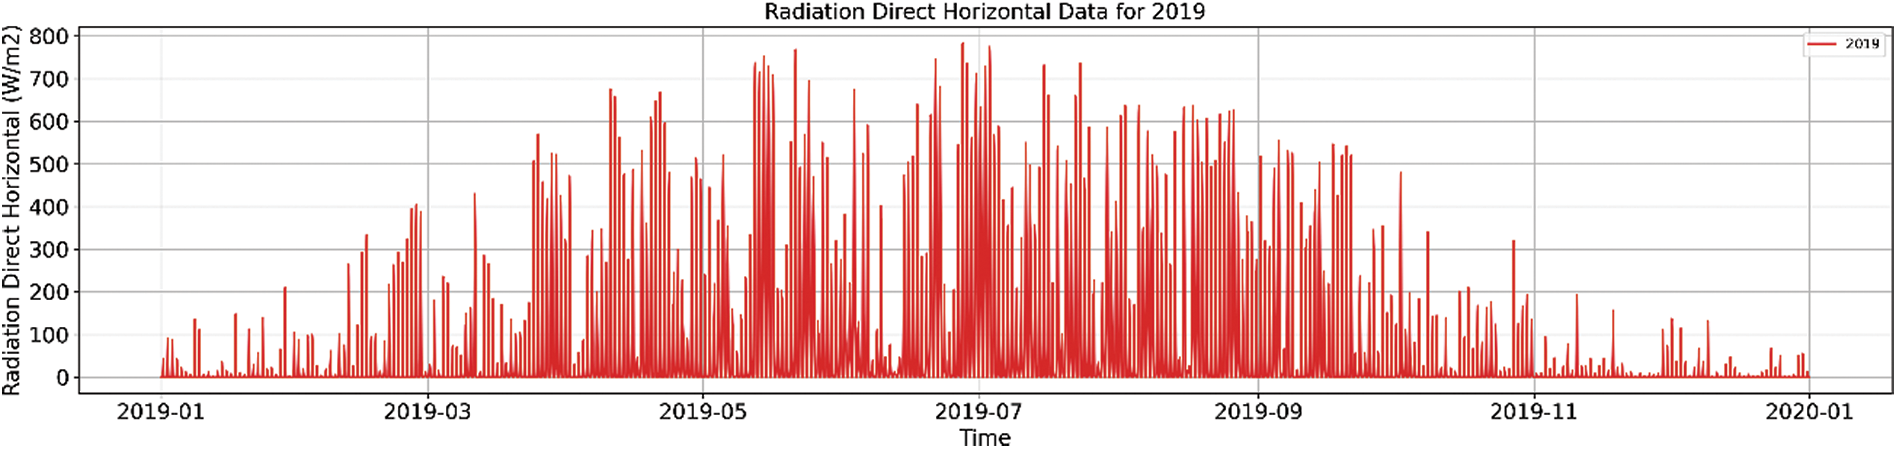
Figure 4: GB direct horizontal radiation for 2016 to 2019
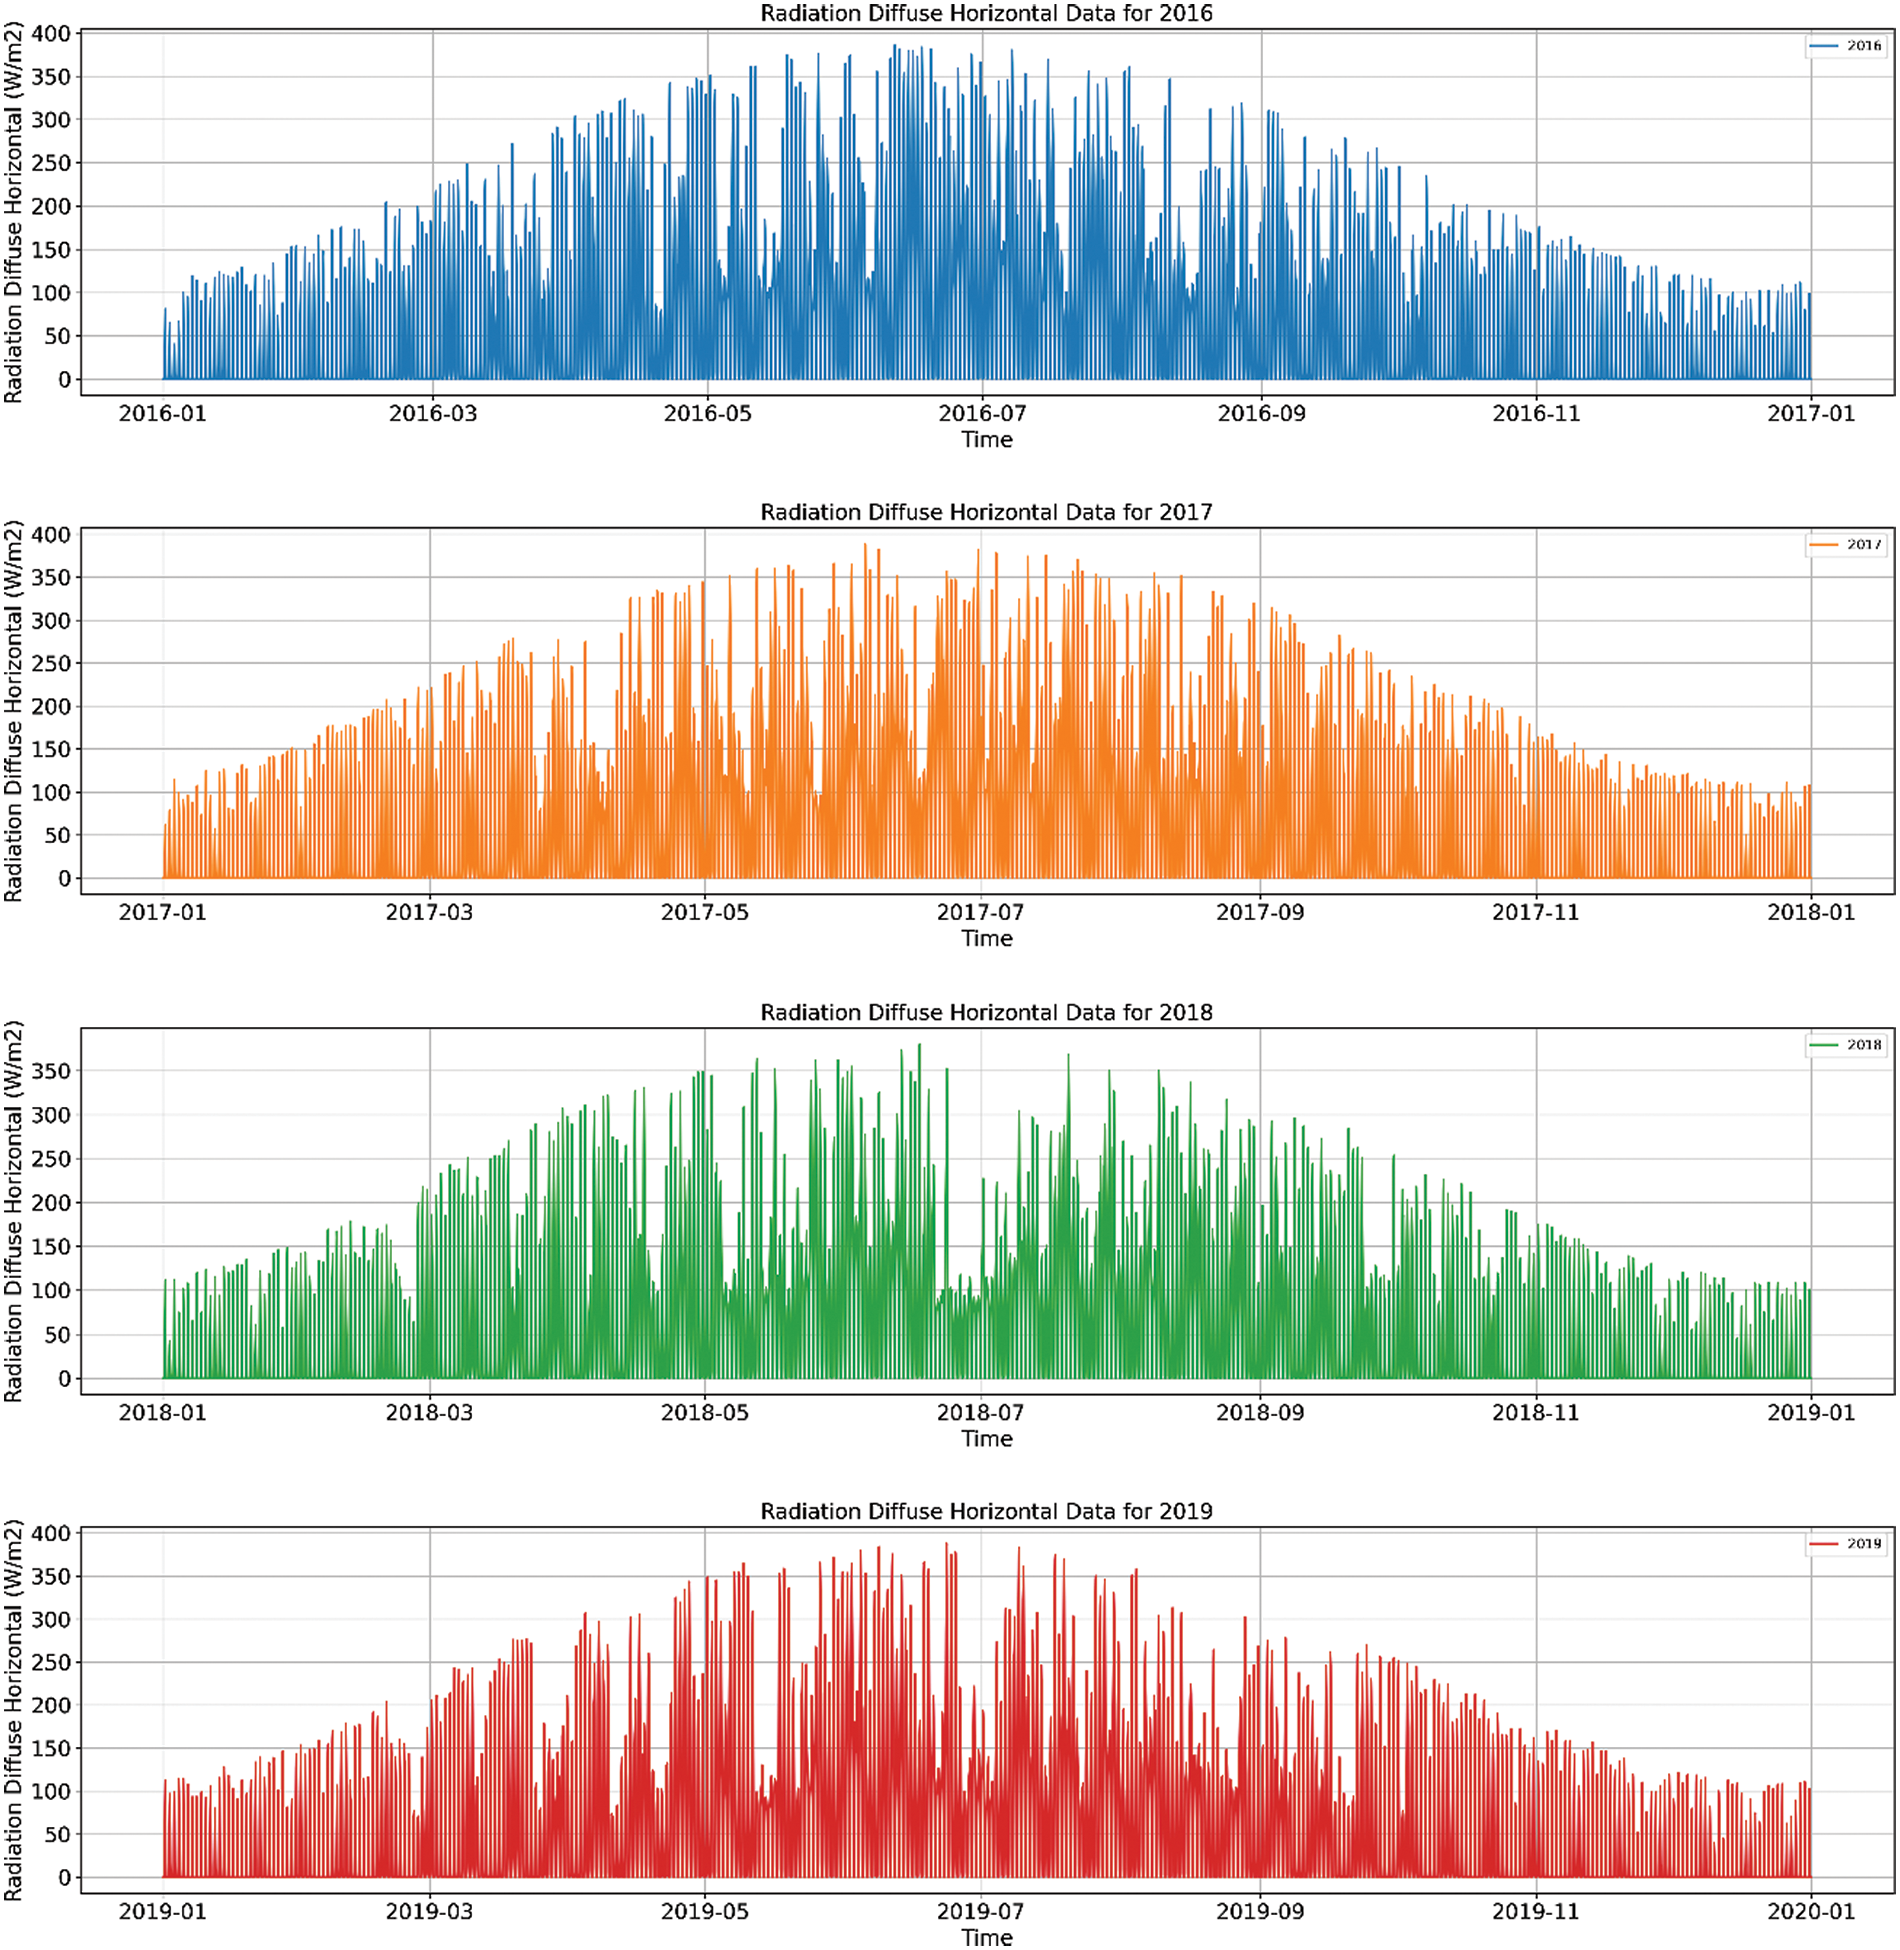
Figure 5: GB diffuse horizontal radiation for 2016 to 2019
In Fig. 3, the distribution of temperature data exhibits certain seasonal variations, for instance, the temperature reaches its annual peak in summer, at about 29.11°C, and declines to its lowest in winter, at about −4.52°C. Such temperature fluctuations may impact the efficiency of photovoltaic panels, where efficiency typically decreases as temperature rises.
Fig. 4 illustrates the distribution and variations of direct solar radiation. It can be observed that during the sun-rich summer months, the direct solar radiation reaches its maximum value, about 811.63 W/m², while it declines to its lowest value, about 0 W/m², during the more cloudy and rainy winter months. Typically, as direct solar radiation is more concentrated and intense compared to scattered radiation, its contribution to solar power generation is quite significant.
Fig. 5 displays the variation of scattered radiation throughout the year, where in certain months, the scattered radiation reaches its peak value of approximately 388.45 W/m², while in other months, it diminishes to its minimum value of about 0 W/m². Scattered radiation can also provide energy to solar panels, and thus, it is considered one of the input conditions for PV power generation.
The data integration approach used in this research utilizes an architecture based on fully connected layers. This method linearly amalgamates input features using a weight matrix, followed by the introduction of non-linearity through an activation function. This process is designed to learn and extract crucial features from the input data effectively. In the proposed framework, a window length of 36 h is initially selected to apply the differencing transformation to historical PV data. This transformed data is then combined with temperature, direct horizontal radiation, and diffuse horizontal radiation to form a multi-dimensional input feature matrix. This matrix is fed into a fully connected neural network to extract potential correlations and useful features between PV data and weather variables. The output from this fully connected layer then becomes the input for the Informer network that follows, offering a comprehensive array of features for effective time series forecasting.
2.3 Multi-Head Attention Mechanism Prediction Model
The Informer is an innovative deep-learning model, uniquely tailored to tackle challenges in forecasting long-sequence time series. As depicted in Fig. 1, its primary architecture encompasses an encoder, a decoder, and a self-attention mechanism. The encoder’s role is to process the input data and discern its inherent representation, whereas the decoder is tasked with producing predictions derived from the encoder’s output. During sequence processing, the multi-head self-attention mechanism concentrates on distinct segments of the sequence and assigns varying levels of importance, effectively identifying long-term relationships and intricate patterns in the time series. In this research, it plays a crucial role in managing multiple weather data inputs. This approach significantly improves the extraction of key features, leading to enhanced precision in predictions.
The structure of the dual-head self-attention module is depicted in Fig. 6, where each input
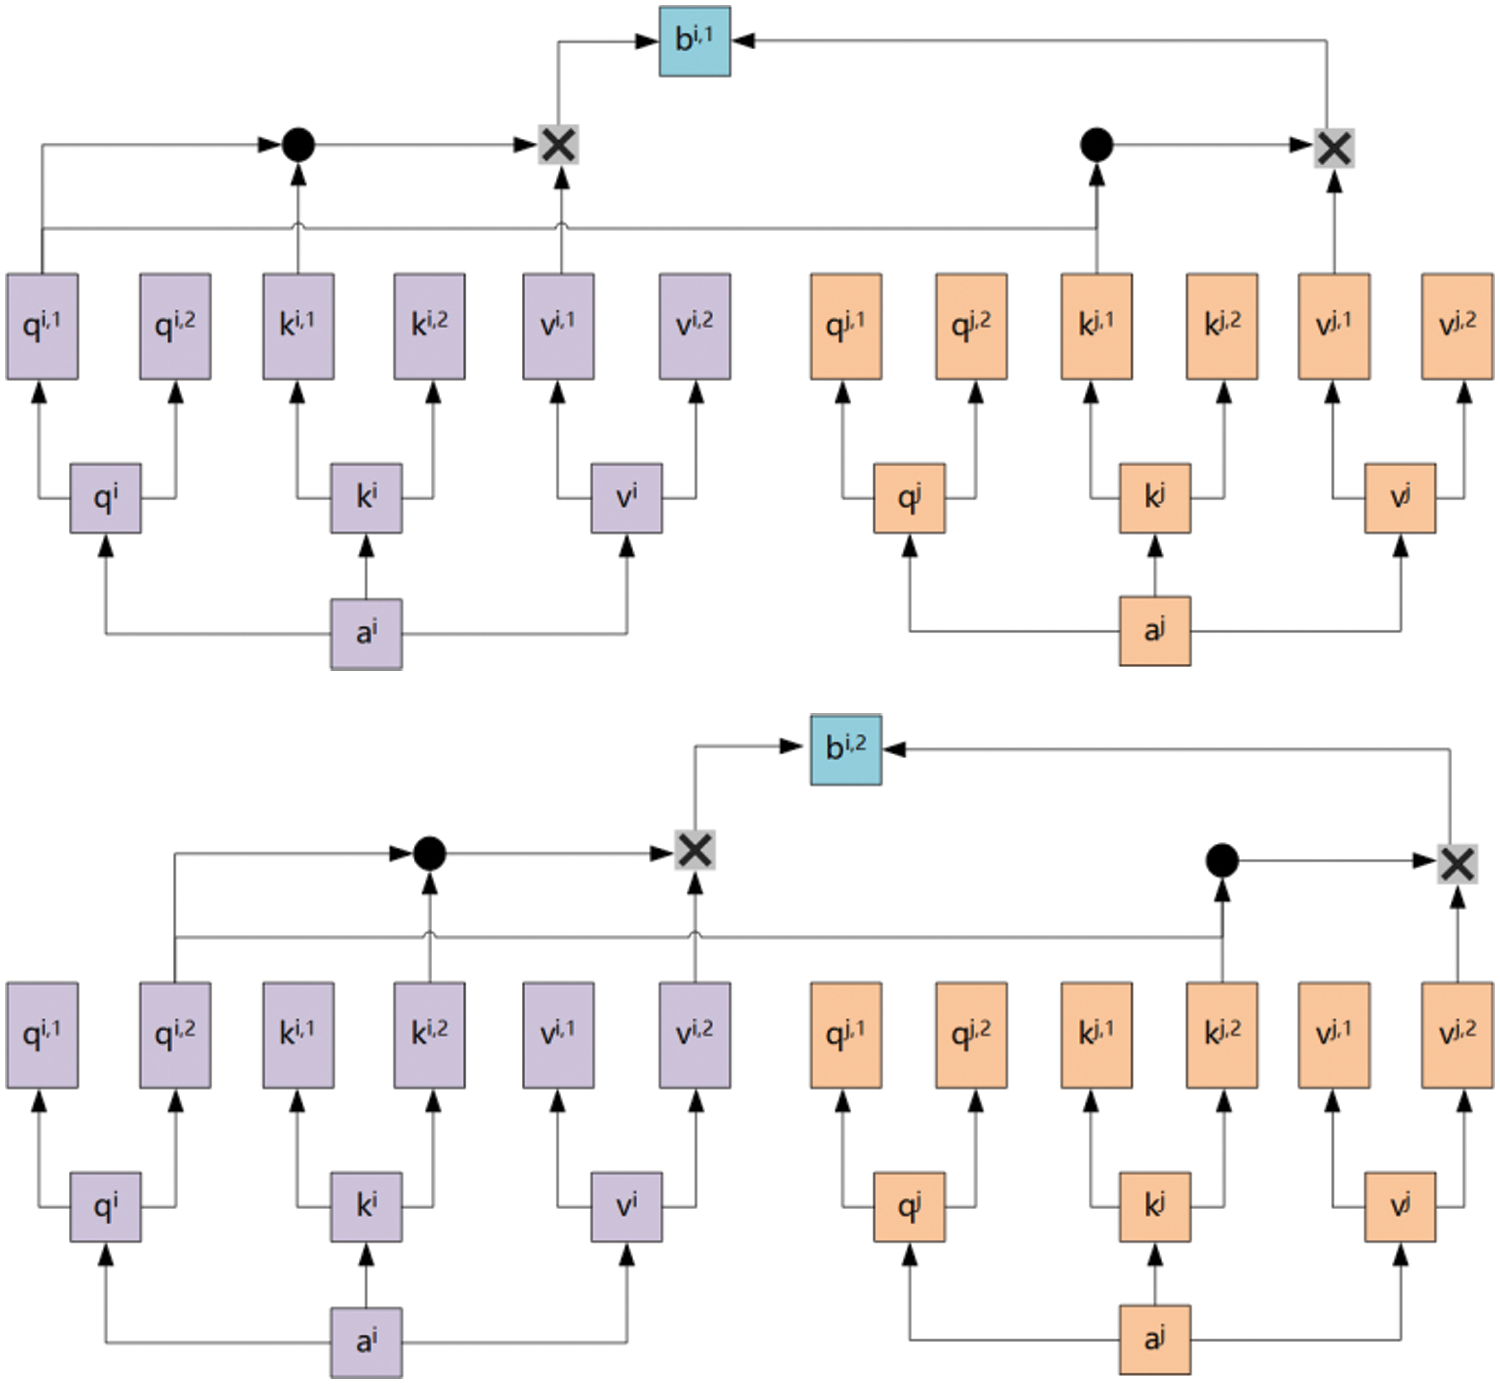
Figure 6: Dual-head self-attention module
Consequently, this arrangement allows the model to delve into two varied types of relevance among the inputs. Each head can hone in on different patterns or relationships, thereby garnering a richer set of information. For example, while one head may be tuned to short-term dependencies, the other might be attuned to long-term dependencies.
When calculating the attention scores, the
Upon traversing the dual-head self-attention mechanism, each input position
Through the linear transformation, the model melds the insights from the two heads, achieving a consolidated output
This section showcases the efficacy of the proposed method in forecasting PV power generation. It includes an overview of the dataset used in the experiment, an exhibition and evaluation of the results predicted by the D-Informer model, and a comparative analysis with other models to substantiate the effectiveness and benefits of the proposed approach.
Data originates from the PV power generation statistics in Great Britain, spanning from January 2016 to December 2019 [34]. The PV power generation data is measured on an hourly basis but with a sampling interval of 30 min. As depicted in Fig. 7, the general trend in PV power generation reveals notable seasonal variations. In the summer months, power generation is anticipated to hit its annual peak, owing to the increased sunlight intensity and extended daylight hours. In contrast, the winter months see a decline in power generation, a trend attributed to the reduced sunlight and briefer periods of daylight. The corresponding climate data can be observed in Figs. 3–5.
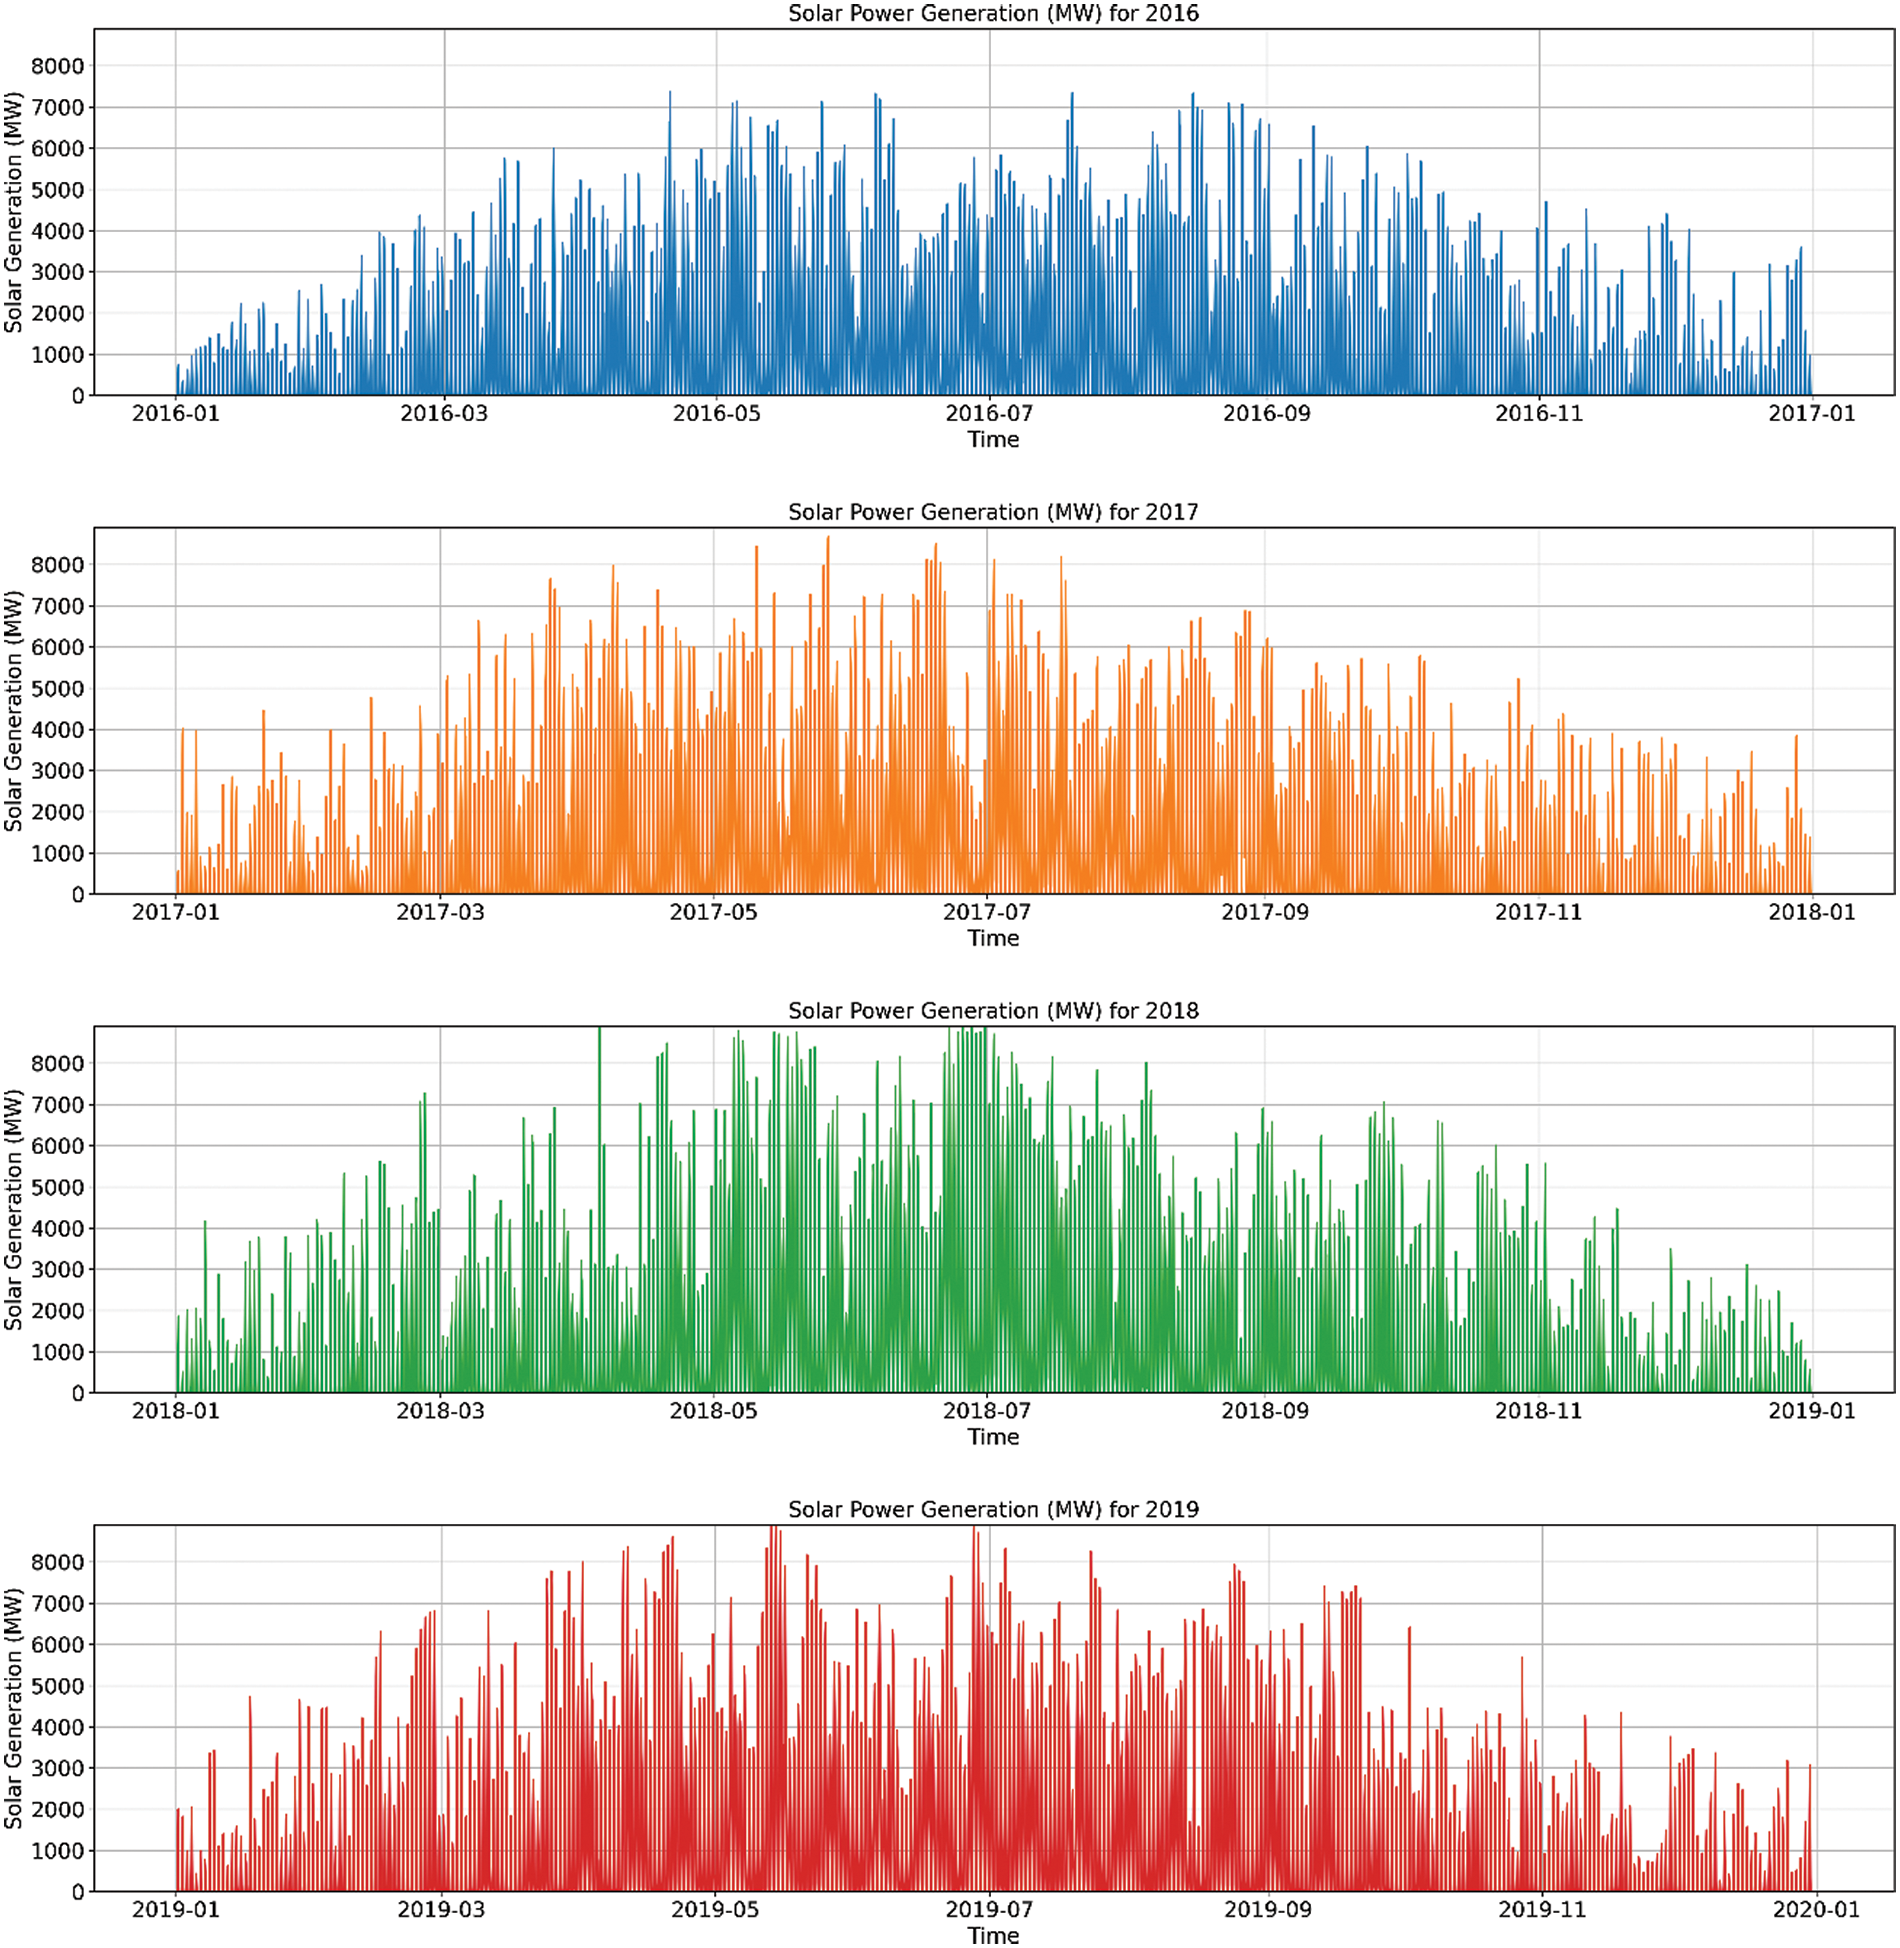
Figure 7: PV power generation in the GB for 2016 to 2019
3.2 Model Training and Forecasting Results
For this experiment, given the distinct seasonal patterns observed in the PV data, we divided the four-year dataset into four separate seasons. Additionally, we adopted a division approach for each season’s data, splitting it into training and test sets in a 7:3 ratio. Each season encompasses 91 days, generating 48 data points daily, which accumulates to 4368 data points for each season. Out of these, 3058 data points are allocated for training purposes, while the remaining 1310 are employed for testing. The training set was used for model training and parameter optimization, and the test set was utilized for the final evaluation of the model. The predictive results obtained from various models are illustrated in Fig. 8.
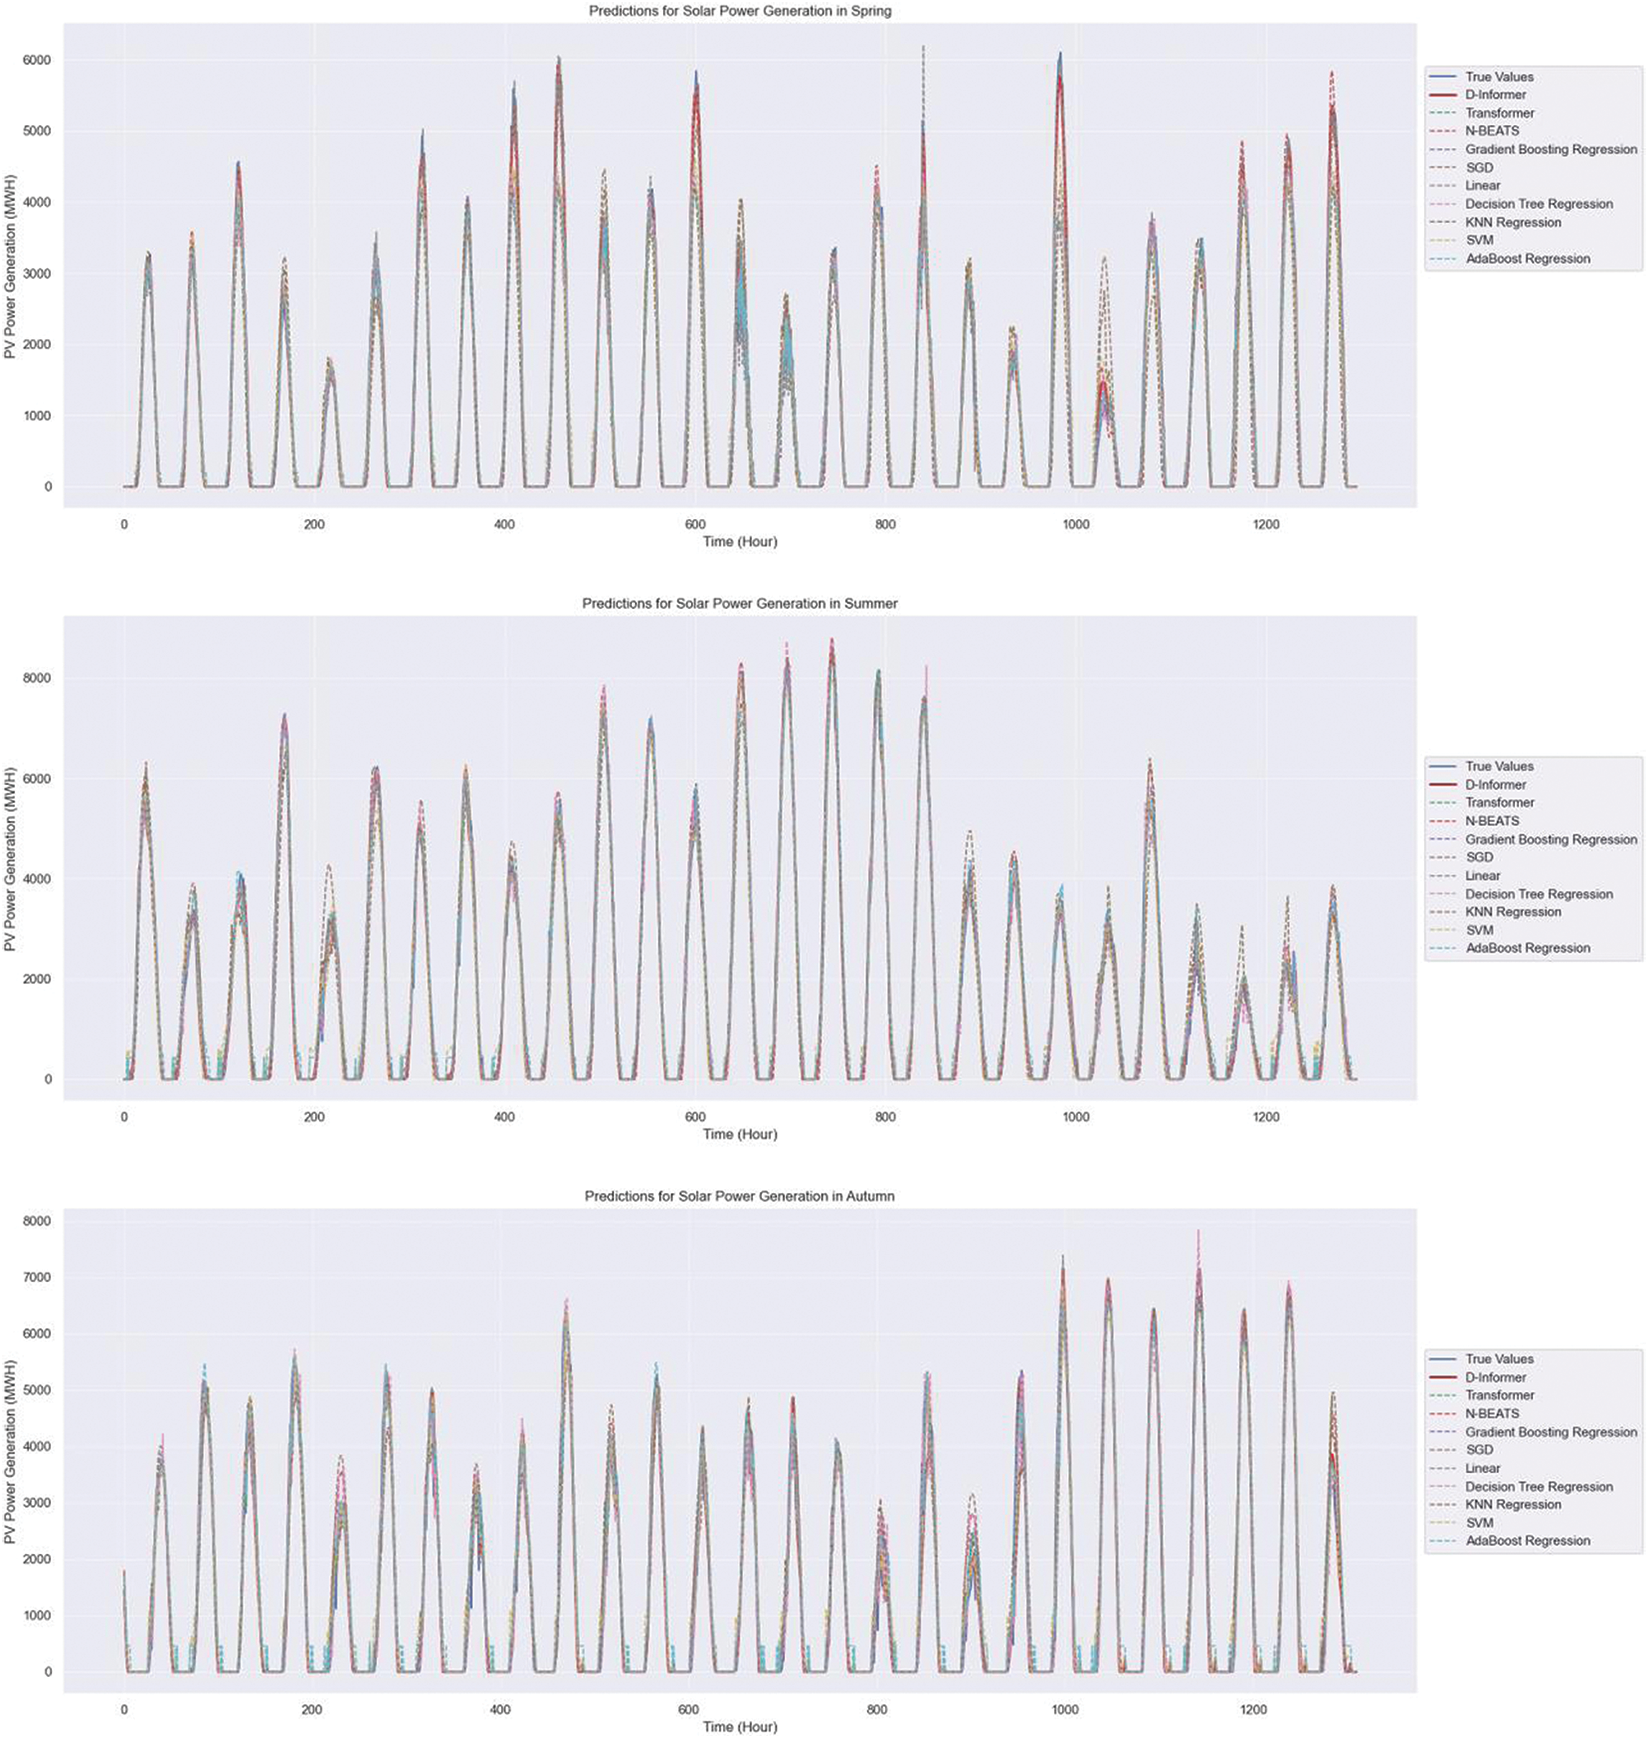
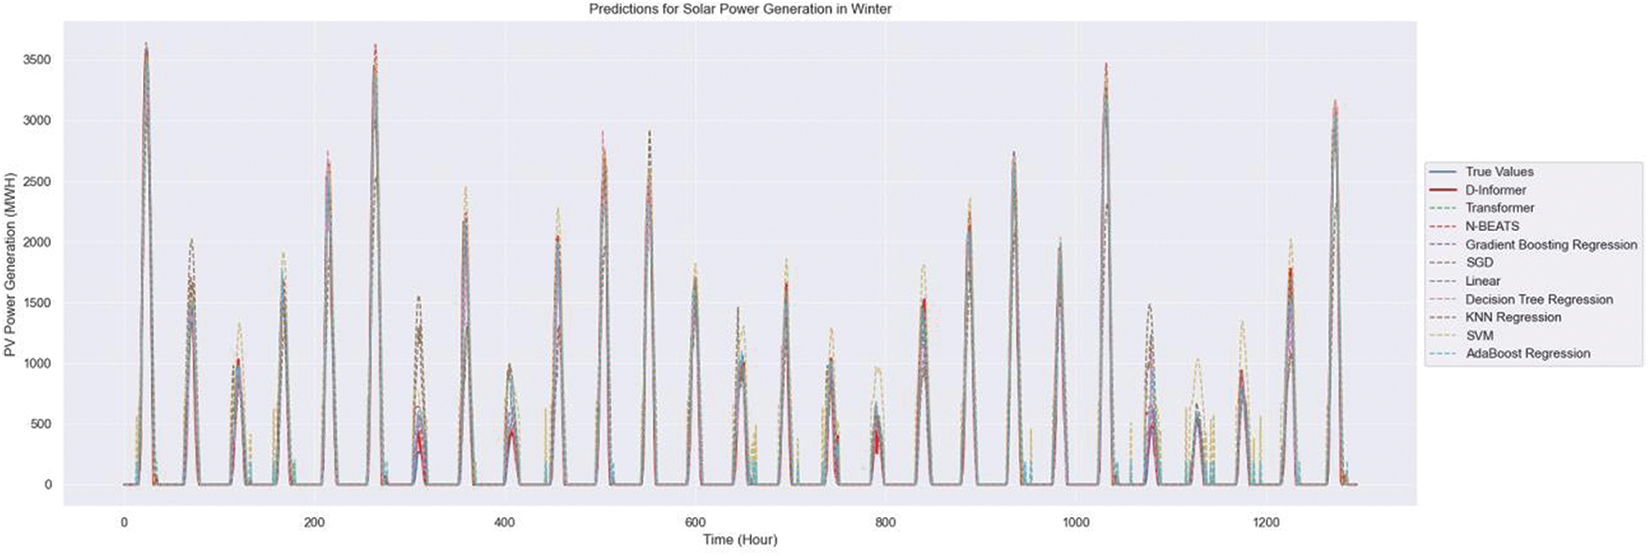
Figure 8: PV power forecasting results for four seasons with various models
This approach of segmenting the data seasonally and using distinct training and test sets allows us to effectively assess the generalizability and sensitivity of the models to different seasonal variations in PV power generation, providing a comprehensive evaluation of their performance.
In the experiment, each graph line represents the predicted electrical output for an entire season, demonstrating how closely each model’s predictions align with the actual PV power generation values. The D-Informer model, in particular, exhibits exceptional accuracy, closely matching the actual power generation across all seasons and showing superior predictive proficiency compared to other models.
The radar chart depicted in Fig. 9 further elucidates the predictive efficacy of the D-Informer model. This chart effectively showcases the performance of various models across four evaluation metrics, with the D-Informer model (represented by the red line) demonstrating outstanding predictive performance.
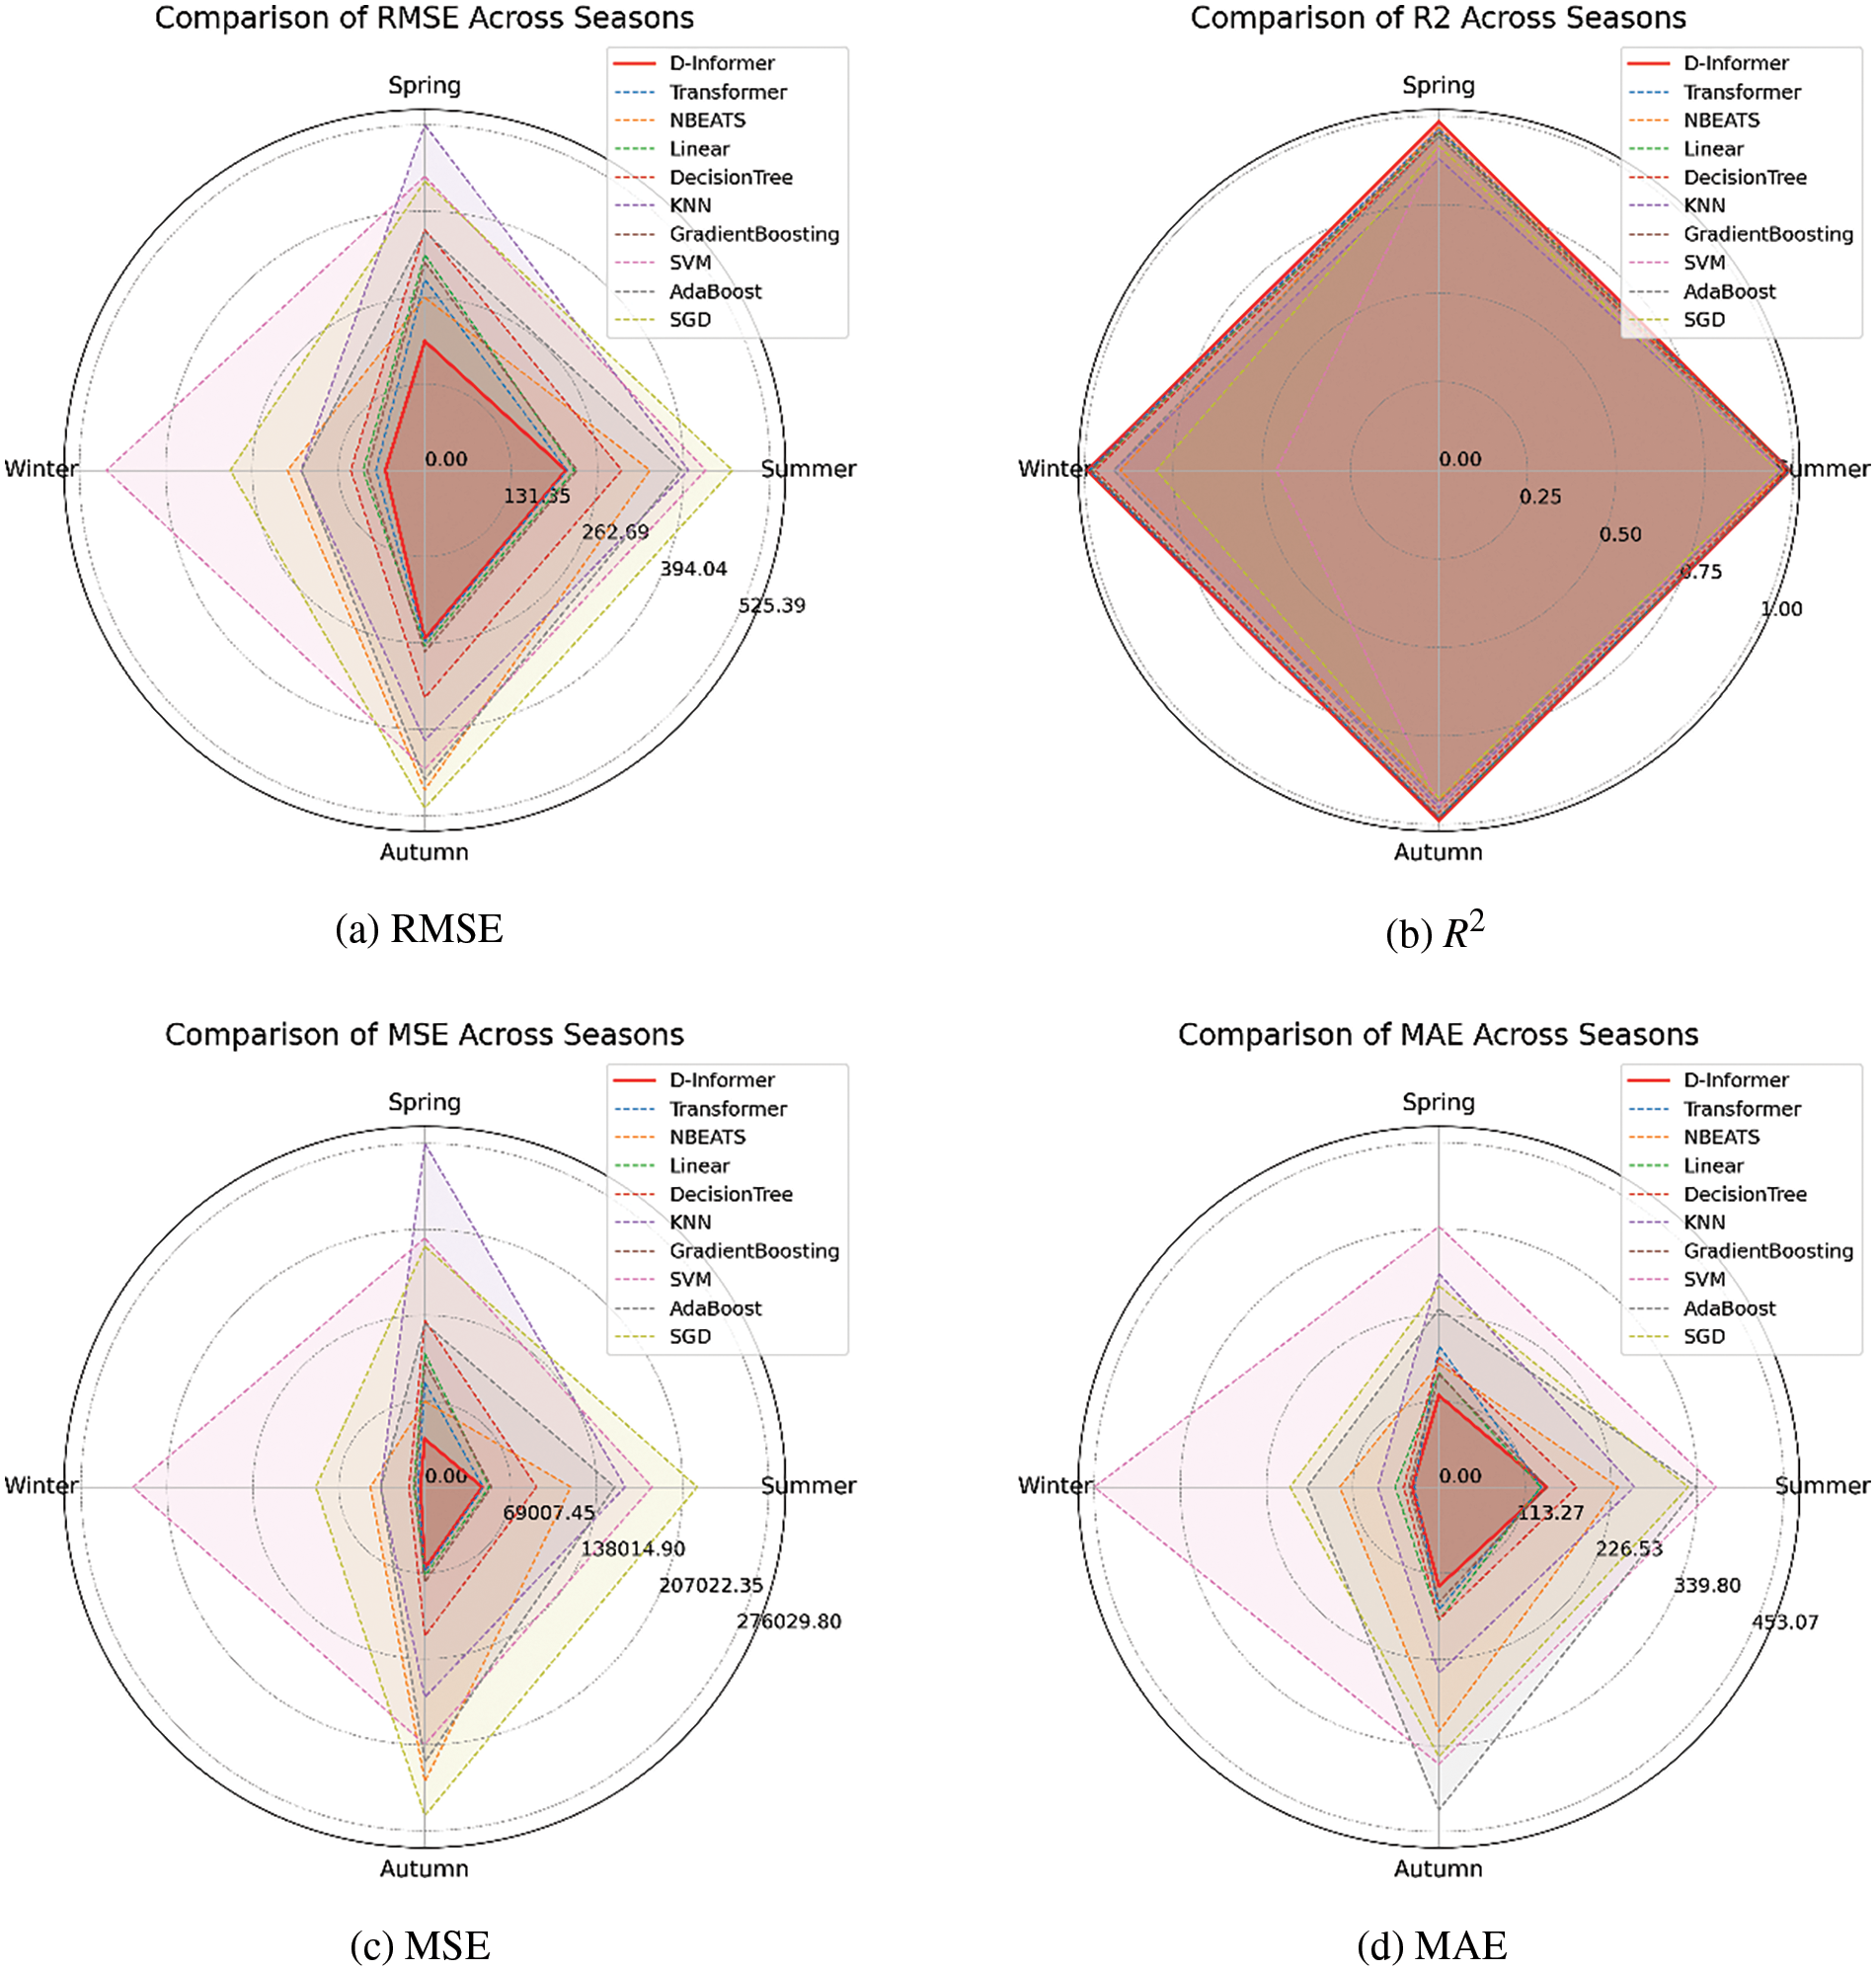
Figure 9: Evaluation index radar map of PV power generation forecasting results for four seasons
In this study, the radar chart encompasses data from all four seasons, with each season corresponding to an axis on the chart. The performance of an individual model across these seasons is visually represented by connecting the points on the four axes, thereby illustrating the model’s seasonal performance. For metrics like Mean Square Error (MSE), Root Mean Square Error (RMSE), and Mean Absolute Error (MAE), a smaller area of the quadrilateral on the chart indicates better predictive accuracy of the model, with the axis corresponding to the smallest internal angle indicating the best seasonal prediction. Conversely, for the
For the D-Informer model, the average
This paper utilizes detailed meteorological data and PV power generation records, encompassing various seasons and climatic conditions, to ensure the comprehensiveness and reliability of the research results. By integrating the differential transformation algorithm with the multi-head self-attention mechanism, the model effectively reduces data non-stationarity and enhances its capability to recognize complex patterns. Experiments demonstrate that the proposed model has a distinct advantage over others in all evaluation metrics, especially in winter, further affirming the model’s effectiveness.
Although the D-Informer model exhibits high accuracy, its complexity could present challenges in computational resources and time, especially when applied to datasets with a broader range of weather data. Future research could focus on optimizing the model to improve its efficiency. Additionally, considering the extension of the D-Informer model’s application to other renewable energy sources, such as wind or hydroelectric power, could be a fruitful area for future exploration.
In the current study, we conduct a detailed analysis based on meteorological data and historical PV power generation data and propose a novel PV power forecasting model named D-Informer, integrating a differential algorithm and a multi-head attention mechanism. The specific conclusions are summarized as follows:
1. The dataset used in this study includes detailed meteorological parameters and PV power generation records, covering various seasons and climate conditions, ensuring the comprehensiveness and reliability of the research results.
2. The D-Informer model combines the differential transformation algorithm and the multi-head self-attention mechanism. The differential transformation reduces the non-stationarity and seasonal effects of the data. The introduction of the multi-head self-attention mechanism enables the model to analyze input data from multiple perspectives, enhancing its ability to recognize complex patterns in the data. This approach uncovers more intricate features, thereby improving the stability of PV power generation forecasts.
3. By employing various predictive evaluation metrics and comparing different models, it is evident that the proposed D-Informer model demonstrates significant superiority across all evaluation metrics compared to other models. Specifically, it achieves an average improvement of 67.64% in mean squared error, 49.58% in mean absolute error, and 43.43% in root mean square error. Moreover, the
Acknowledgement: None.
Funding Statement: This research is supported by the “Nanling Team Project” of Shaoguan City. This work is supported by the Shenzhen Science and Technology Plan, Sustainable Development Technology Special Project (Dual-Carbon Special Project), Research and Development of Intelligent Virtual Power Plant Technology (KCXST20221021111402006), and the Science and Technology project of Tianjin, China (No. 22YFYSHZ00330).
Author Contributions: The authors confirm contribution to the paper as follows: study conception and design: C.M., R.H.; data collection: Z.A.; analysis and interpretation of results: C.M., R.H., T.H.; draft manuscript preparation: C.M., R.H. All authors reviewed the results and approved the final version of the manuscript.
Availability of Data and Materials: The data used in this paper are from the Open Power System Data platform at https://data.open-power-system-data.org/.
Conflicts of Interest: The authors declare that they have no conflicts of interest to report regarding the present study.
References
1. Wang, W., Yang, D., Hong, T., Kleissl, J. (2022). An archived dataset from the ECMWF ensemble prediction system for probabilistic solar power forecasting. Solar Energy, 248, 64–75. [Google Scholar]
2. Zheng, J., Du, J., Wang, B., Klemeš, J. J., Liao, Q. et al. (2023). A hybrid framework for forecasting power generation of multiple renewable energy sources. Renewable and Sustainable Energy Reviews, 172, 113046. [Google Scholar]
3. Tawn, R., Browell, J. (2022). A review of very short-term wind and solar power forecasting. Renewable and Sustainable Energy Reviews, 153, 111758. [Google Scholar]
4. Hu, H., Wang, L., Lv, S. X. (2020). Forecasting energy consumption and wind power generation using deep echo state network. Renewable Energy, 154, 598–613. [Google Scholar]
5. Sharadga, H., Hajimirza, S., Balog, R. S. (2020). Time series forecasting of solar power generation for large-scale photovoltaic plants. Renewable Energy, 150, 797–807. [Google Scholar]
6. Zhang, L., Hu, T., Zhang, L., Yang, Z., McLoone, S. et al. (2023). A novel dynamic opposite learning enhanced Jaya optimization method for high efficiency plate-fin heat exchanger design optimization. Engineering Applications of Artificial Intelligence, 119, 105778. [Google Scholar]
7. Yang, D., Li, W., Yagli, G. M., Srinivasan, D. (2021). Operational solar forecasting for grid integration: Standards, challenges, and outlook. Solar Energy, 224, 930–937. [Google Scholar]
8. Qin, J., Jiang, H., Lu, N., Yao, L., Zhou, C. (2022). Enhancing solar PV output forecast by integrating ground and satellite observations with deep learning. Renewable and Sustainable Energy Reviews, 167, 112680. [Google Scholar]
9. Eşlik, A. H., Akarslan, E., Hocaoğlu, F. O. (2022). Short-term solar radiation forecasting with a novel image processing-based deep learning approach. Renewable Energy, 200, 1490–1505. [Google Scholar]
10. Khalil, M., McGough, A. S., Pourmirza, Z., Pazhoohesh, M., Walker, S. (2022). Machine learning, deep learning and statistical analysis for forecasting building energy consumption—A systematic review. Engineering Applications of Artificial Intelligence, 115, 105287. [Google Scholar]
11. Bendaoud, N. M. M., Farah, N., Ahmed, S. B. (2022). Applying load profiles propagation to machine learning based electrical energy forecasting. Electric Power Systems Research, 203, 107635. [Google Scholar]
12. Vennila, C., Titus, A., Sudha, T. S., Sreenivasulu, U., Reddy, N. P. R. et al. (2022). Forecasting solar energy production using machine learning. International Journal of Photoenergy, 2022, 1–7. [Google Scholar]
13. An, Z., Cheng, L., Guo, Y., Ren, M., Feng, W. et al. (2022). A novel principal component analysis-informer model for fault prediction of nuclear valves. Machines, 10(4), 240. [Google Scholar]
14. Markovics, D., Mayer, M. J. (2022). Comparison of machine learning methods for photovoltaic power forecasting based on numerical weather prediction. Renewable and Sustainable Energy Reviews, 161, 112364. [Google Scholar]
15. Munsif, M., Ullah, M., Fath, U., Khan, S. U., Khan, N. et al. (2023). CT-NET: A novel convolutional transformer-based network for short-term solar energy forecasting using climatic information. Computer Systems Science and Engineering, 47(2), 1751–1773. [Google Scholar]
16. Zhang, G., Yang, D., Galanis, G., Androulakis, E. (2022). Solar forecasting with hourly updated numerical weather prediction. Renewable and Sustainable Energy Reviews, 154, 111768. [Google Scholar]
17. Meenal, R., Binu, D., Ramya, K. C., Michael, P. A., Vinoth Kumar, K. et al. (2022). Weather forecasting for renewable energy system: A review. Archives of Computational Methods in Engineering, 29(5), 2875–2891. [Google Scholar]
18. Sun, M., Feng, C., Zhang, J. (2020). Probabilistic solar power forecasting based on weather scenario generation. Applied Energy, 266, 114823. [Google Scholar]
19. Yang, D., Wang, W., Hong, T. (2022). A historical weather forecast dataset from the European Centre for medium-range weather forecasts (ECMWF) for energy forecasting. Solar Energy, 232, 263–274. [Google Scholar]
20. Petch, J., Di, S., Nelson, W. (2022). Opening the black box: The promise and limitations of explainable machine learning in cardiology. Canadian Journal of Cardiology, 38(2), 204–213. [Google Scholar] [PubMed]
21. Méndez, M., Merayo, M. G., Núñez, M. (2023). Machine learning algorithms to forecast air quality: A survey. Artificial Intelligence Review, 56, 10031–10066. [Google Scholar]
22. Tang, T., Jiao, D., Chen, T., Gui, G. (2022). Medium-and long-term precipitation forecasting method based on data augmentation and machine learning algorithms. IEEE Journal of Selected Topics in Applied Earth Observations and Remote Sensing, 15, 1000–1011. [Google Scholar]
23. Wang, F., Xuan, Z., Zhen, Z., Li, K., Wang, T. et al. (2020). A day-ahead PV power forecasting method based on LSTM-RNN model and time correlation modification under partial daily pattern prediction framework. Energy Conversion and Management, 212, 112766. [Google Scholar]
24. Ghimire, S., Deo, R. C., Casillas-Pérez, D., Salcedo-Sanz, S., Sharma, E. et al. (2022). Deep learning CNN-LSTM-MLP hybrid fusion model for feature optimizations and daily solar radiation prediction. Measurement, 202, 111759. [Google Scholar]
25. Sharma, J., Soni, S., Paliwal, P., Saboor, S., Chaurasiya, P. K. et al. (2022). A novel long term solar photovoltaic power forecasting approach using LSTM with nadam optimizer: A case study of India. Energy Science & Engineering, 10(8), 2909–2929. [Google Scholar]
26. Cheng, L., An, Z., Guo, Y., Ren, M., Yang, Z. et al. (2023). MMFSL: A novel multi-modal few-shot learning framework for fault diagnosis of industrial bearings. IEEE Transactions on Instrumentation and Measurement, 72, 1–13. [Google Scholar]
27. LeCun, Y., Bengio, Y., Hinton, G. (2015). Deep learning. Nature, 521(7553), 436–444. [Google Scholar] [PubMed]
28. Wang, L., Mao, M., Xie, J., Liao, Z., Zhang, H. et al. (2023). Accurate solar PV power prediction interval method based on frequency-domain decomposition and LSTM model. Energy, 262, 125592. [Google Scholar]
29. Elizabeth Michael, N., Mishra, M., Hasan, S., Al-Durra, A. (2022). Short-term solar power predicting model based on multi-step CNN stacked LSTM technique. Energies, 15(6), 2150. [Google Scholar]
30. Barrera-Animas, A. Y., Oyedele, L. O., Bilal, M., Akinosho, T. D., Delgado, J. M. D. et al. (2022). Rainfall prediction: A comparative analysis of modern machine learning algorithms for time-series forecasting. Machine Learning with Applications, 7, 100204. [Google Scholar]
31. Benidis, K., Rangapuram, S. S., Flunkert, V., Wang, Y., Maddix, D. et al. (2022). Deep learning for time series forecasting: Tutorial and literature survey. ACM Computing Surveys, 55(6), 1–36. [Google Scholar]
32. Lv, S. X., Wang, L. (2022). Deep learning combined wind speed forecasting with hybrid time series decomposition and multi-objective parameter optimization. Applied Energy, 311, 118674. [Google Scholar]
33. Krishnan, N., Kumar, K. R., Inda, C. S. (2023). How solar radiation forecasting impacts the utilization of solar energy: A critical review. Journal of Cleaner Production, 388, 0959–6526. [Google Scholar]
34. Wiese, F., Schlecht, I., Bunke, W. D., Gerbaulet, C., Hirth, L. et al. (2019). Open power system data-frictionless data for electricity system modelling. Applied Energy, 236, 401–409. [Google Scholar]
Cite This Article
 Copyright © 2024 The Author(s). Published by Tech Science Press.
This work is licensed under a Creative Commons Attribution 4.0 International License , which permits unrestricted use, distribution, and reproduction in any medium, provided the original work is properly cited.
 Downloads
 Citation Tools