
 Submit a Paper
 Propose a Special lssue
 Open Access
ARTICLE

Impact of Permeability Heterogeneity on Methane Hydrate Production Behavior during Depressurization with Controlled Sand Production
1 School of Petroleum Engineering, China University of Petroleum (East China), Qingdao, 266580, China
2 Engineering Technology Research Company Limited, China National Petroleum Corporation (CNPC), Tianjin, 300450, China
3 Changqing General Drilling Company, CNPC Chuanqing Drilling Engineering Company Limited, Xi’an, 710000, China
* Corresponding Author: Rui Zhang. Email:
Energy Engineering 2025, 122(10), 4153-4168. https://doi.org/10.32604/ee.2025.065906
Received 24 March 2025; Accepted 23 May 2025; Issue published 30 September 2025
 View Full Text
 Download PDF
Abstract
Field tests have demonstrated that depressurization with controlled sand production is an effective technique for natural gas hydrate extraction. Variations in depositional environments and processes result in significant heterogeneity within subsea natural gas hydrate-bearing sediments. However, the influence of permeability heterogeneity on production performance during depressurization with controlled sand production remains inadequately understood. In this study, a multiphase, multi-component mathematical model is developed to simulate depressurization with controlled sand production in methane hydrate-bearing sediments, incorporating geological conditions representative of unconsolidated argillaceous siltstone hydrate deposits in the Shenhu area of the South China Sea. The effects of permeability heterogeneity-specifically, horizontal autocorrelation length and global permeability heterogeneity-on production performance during depressurization with sand production are investigated using geostatistical modeling combined with finite difference method based numerical simulations. Results show that as the horizontal autocorrelation length of permeability distribution increases, cumulative gas production first rises and then declines, reaching its peak at λDh = 0.1, whereas sand production steadily increases. In addition, higher formation permeability heterogeneity results in increased cumulative gas and sand production, suggesting that greater heterogeneity promotes methane hydrate decomposition and gas recovery. These findings can offer valuable insights for optimizing future field development of hydrate-bearing sediments by depressurization with controlled sand production.Keywords
Natural gas hydrates are regarded as a promising clean energy resource and a viable alternative to conventional fossil fuels, owing to their high energy density, widespread distribution, and vast reserves [1–3]. Estimates suggest that the organic carbon reserves in natural gas hydrates are approximately twice those of coal, oil, and conventional natural gas combined [4,5]. Notably, 1 m3 of natural gas hydrate can release up to 164 m3 of natural gas, underscoring its potential as a major energy resource. Given these abundant resources, natural gas hydrates represent a promising clean energy solution to meet future energy demands [6,7].
The China Geological Survey conducted two hydrate production tests in 2017 and 2020 based on natural gas hydrate exploration findings on the northern slope of the Shenhu area in the South China Sea [8–10]. The first test in 2017 utilized a single vertical well and lasted 60 days, achieving a total gas production of 3.09 × 10⁵ m3 [8,9]. This set a world record for the longest continuous stable gas production and the highest total gas yield [7]. In the second test in 2020, a dual horizontal well extraction method was adopted, resulting in 30 days of continuous stable gas production with a total gas output of 8.614 × 10⁵ m3 [10]. The average daily gas production rate during this test reached 2.87 × 10⁴ m3, approximately 5.6 times higher than that of the first test [11].
However, sand production remains a major challenge in natural gas hydrate extraction, with some tests being prematurely halted due to excessive sand influx. Sand production has become a critical factor constraining the long-term, efficient, and safe exploitation of hydrate-bearing sediments [12–15]. Research on sand production risk assessment has largely focused on identifying critical conditions for sand migration, understanding the evolution of sand production rates, and developing effective sand control strategies. In recent years, physical simulation systems of various scales have been developed to explore sand production mechanisms in hydrate reservoirs [16–18]. These systems facilitate comprehensive research on sand production prediction and the clogging mechanisms of sand control media. Due to inherent experimental limitations, preparing hydrate-bearing samples that faithfully replicate in-situ production conditions remains a significant challenge. Parameters such as in-situ pressure, temperature, hydrate saturation, sediment composition, and mechanical properties are difficult to reproduce simultaneously under laboratory conditions. Consequently, existing physical experiments may not fully capture the coupled thermo-hydro-mechanical-chemical behavior of hydrate-bearing sediments in field environments, which limits the direct applicability of laboratory results to field-scale hydrate production operations.
Effective sand control strategies should not solely focus on sand prevention but should also aim to maintain production sustainability, safety, and efficiency through an integrated geological and engineering approach. In addition, considering the dual role of sand production in both enhancing and constraining gas extraction from hydrate sediments, fundamental guidelines have been proposed for predicting sand production in producers and designing well-bottom sand control measures. Liu et al. [19] introduced an innovative technique combining radial wells with liquid-solid phase change supporting agents for hydrate reservoir modification and sand control. This method aims to mitigate the adverse effects of excessive sand production, significantly expanding the depressurization extraction range while ensuring effective sand control.
Recent studies have demonstrated that depressurization combined with moderate sand production can effectively enhance gas production performance [20–22]. Reservoir permeability significantly influences hydrate production efficiency during depressurization [23]. However, the impact of permeability heterogeneity on sand production and overall gas recovery remains insufficiently understood and requires further investigation. To address this knowledge gap, this study develops a multiphase, multi-component mathematical model to simulate depressurization with moderate sand production in methane hydrate-bearing sediments. By integrating stochastic geological modeling with finite difference method based numerical simulations, we examine how permeability heterogeneity, including autocorrelation length, and global permeability heterogeneity, affects sand production and gas recovery efficiency. The findings of this research can provide valuable insights for future practical applications of depressurization combined with controlled sand production in hydrate reservoir development.
2.1 Generation of Synthetic Heterogenous Permeability Fields
The autocorrelation length characterizes the spatial scale of regions exhibiting similar permeability or porosity values, primarily determined by depositional environments and associated geological processes. To capture the spatial heterogeneity of rock physical properties, such as permeability and porosity, in hydrate-bearing sediments, geological parameters representative of typical unconsolidated argillaceous siltstone are employed. Permeability models with varying horizontal autocorrelation lengths are generated using the sequential Gaussian simulation (SGSIM) method [24–26]. The permeability spatial distribution is characterized using an exponential variogram function to capture spatial autocorrelation. Porosity distributions are derived from the generated permeability models based on a classical porosity-permeability empirical relationship for porous media [27]. Fig. 1 illustrates the permeability distribution in hydrate-bearing sediments with a typical dimensionless horizontal autocorrelation length (λDh) of 0.5.
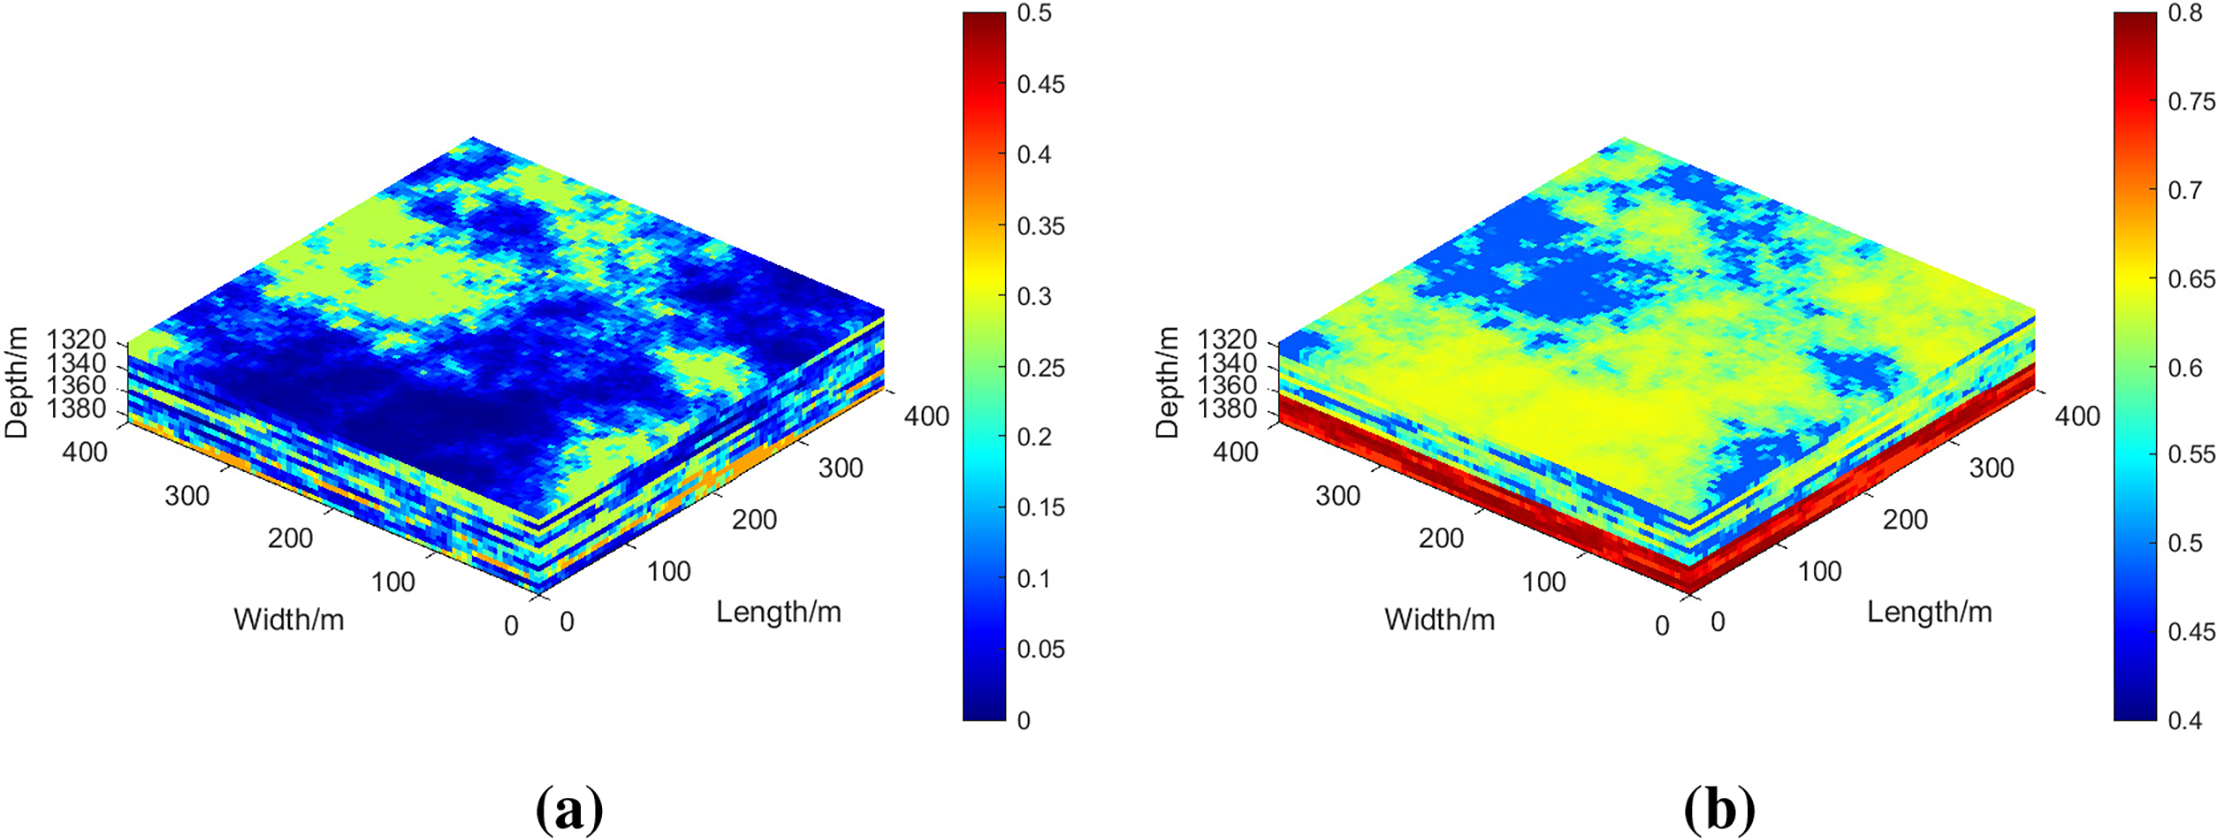
Figure 1: Initial hydrate saturation (a) and log permeability distribution (b) of the synthetic unconsolidated argillaceous siltstone methane hydrate sediments (λDh = 0.5, σ = 1)
The permeability-porosity relationship is expressed as follows [27],
where k0 and k denote the initial and current permeability of the hydrate-bearing sediments, respectively, 10−3 μm2;
2.2.1 Mass and Energy Conservation Equations
During the depressurization of methane hydrate-bearing sediments, the mass conservation equations for different components can be expressed as follows,
where
The energy conservation equation for the gaseous, aqueous, and solid phases during the depressurization of methane hydrate-bearing sediments is described as follows,
where Ci, i=a, g denotes the specific heat capacities of different phases, J·kg−1·K−1; kTH represents the thermal conductivity of the hydrate-bearing sediments, W·m−1·K−1; Mr is the volumetric heat capacity of the rock, J·m−3·°C−1;
2.2.2 Permeability-Porosity Relationships
Taking into account the effects of solid-phase hydrate decomposition and formation, as well as the stripping or deposition of the rock framework, the effective porosity can be expressed by the following equation,
where
Changes in effective porosity directly affect the absolute permeability of hydrate-bearing sediments. the quantitative relationship between permeability and effective porosity in the hydrate reservoirs is described using the classical Carman-Kozeny model [27] as shown in Eq. (1).
The dynamic variation of gas-liquid relative permeability as a function of saturation is quantitatively characterized using the Aziz model [28],
To account for capillary effects between gaseous and aqueous phases, the capillary pressure as a function of saturation can be described using the van Genuchten model [29],
2.2.3 Sand Detachment and Deposition
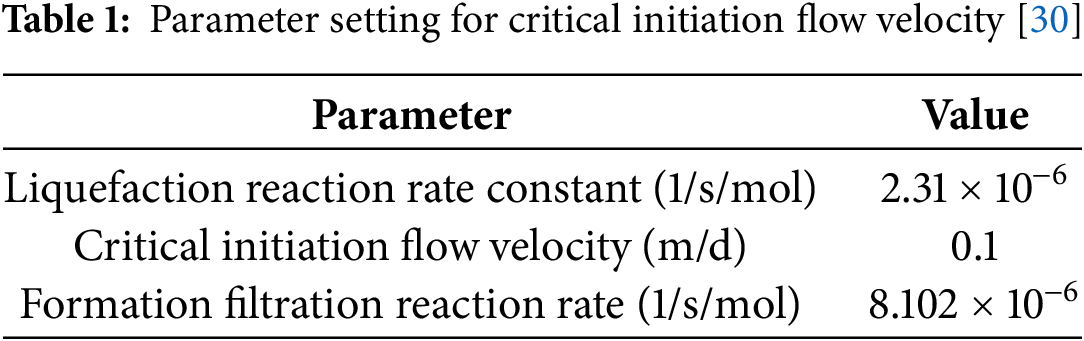
Sediment transport is an intrinsic physical process governed by the coupled effects of hydrate dissociation, reservoir strength degradation, and gas-liquid two-phase flow. The transition of solid sand into a mobile state is determined by the critical flow velocity considering the erosion or deposition effects. The rate of sand detachment can be described as follows,
where msi represents the mobile solid-phase sediment per unit volume; ω denotes the liquefaction reaction factor; ua is the flow rate of the aqueous phase, obtained using Darcy’s law, m/d; ucri is the critical onset flow velocity, m/d. The parameter settings for the critical initiation flow velocity are presented in Table 1.
A solute transport mass balance equation is the most widely adopted method for assessing sand particle retention and migration behavior [30].
where c and σ are sand suspended and retained concentrations, respectively; λ is the filter coefficient.
Sediment stripping, deposition, and sand control strategies are strongly influenced by the grain size distribution of hydrate-bearing sediments. Fig. 2 presents the grain size distribution of the unconsolidated argillaceous siltstone hydrate-bearing sediments, where the median grain size is 14.9 μm. Based on this, the sand control precision (Dp) is set between 2 and 10 μm.
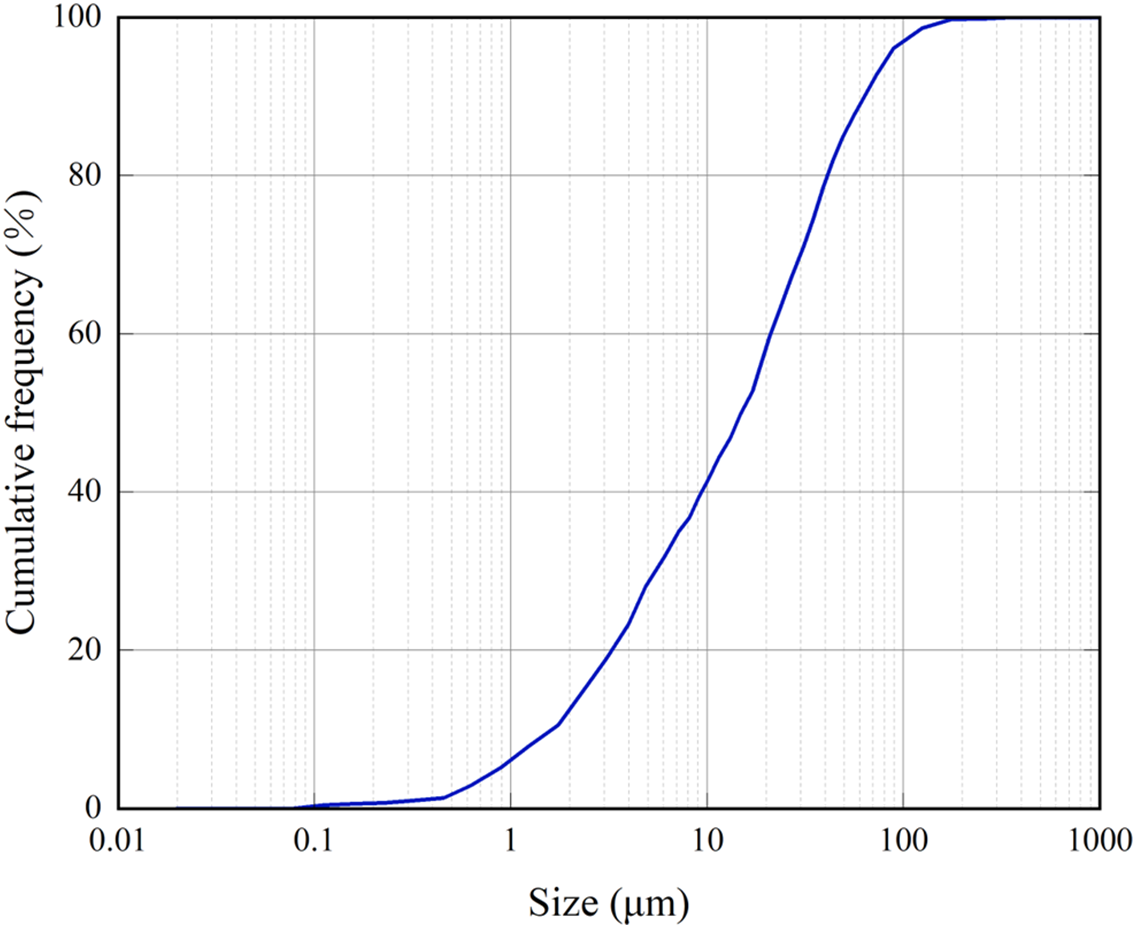
Figure 2: Grain size distribution of targeted methane hydrate sediments
2.2.4 Reaction Kinetics Model for Methane Hydrate Formation and Decomposition
In this study, a three-phase, four-component model is employed to simulate methane hydrate decomposition and formation, as well as sediment stripping and deposition. Within this framework, the aqueous phase consists of formation water and mobile sediments, the gaseous phase consists of methane, and the solid phase comprises hydrate and framework sediments. The decomposition and formation of methane hydrate are typically described as a reversible reaction between gaseous methane and aqueous brine, each governed by specific reaction rates,
where n denotes the hydrate index, which is set to 5 for methane hydrate; ΔH is the enthalpy of the reaction, J/kg.
In hydrate-bearing sediments, the driving force for methane hydrate formation and decomposition is determined by either the difference between the gas fugacity at methane-formation water-hydrate three-phase equilibrium and the actual gas fugacity in the gaseous phase or the difference between the hydrate phase equilibrium pressure and the gaseous phase pressure. When the gaseous phase pressure exceeds the hydrate phase equilibrium pressure (i.e., Pg − Pe > 0), hydrate formation occurs; otherwise, hydrate decomposition takes place. The rates of hydrate formation and decomposition are proportional to this driving force. The formation reaction rate of methane hydrate can be expressed as follows [31],
where nf denotes the formation rate of methane hydrate, mol/(m3·s);
By incorporating the local equilibrium reaction assumption, the expression for the hydrate formation rate can be transformed as follows,
where λf1 and λf2 are the formation rate constant and mass transfer coefficient, respectively, with units of 1/kPa/s and (mol/m3)−1/kPa day; ρa and ρh represent the molar densities of the aqueous and hydrate phases, respectively, mol/m3.
The decomposition rate of methane hydrate can be expressed as follows,
where nd denotes the decomposition reaction rate of methane hydrate, mol/(m3·s);
Similarly, based on the local equilibrium reaction theory, Eq. (13) can be rearranged as,
where λd denotes the decomposition reaction rate constant, (mol/m3)−1/kPa day.
According to the theory of local equilibrium reactions, the equilibrium constant K(Pg, T) can be described as a function of pressure and temperature,
where Pg is pressure, kPa; T is the absolute temperature, K; k1~k5 are relevant coefficients.
The effects of methane dissolution in formation brine and variation of formation water salinity on hydrate formation are not considered in this study. Based on the phase equilibrium curve of methane hydrate in a 3.5 wt% NaCl solution within the temperature range of 0°C to 20°C and assuming k2 = k3 = 0, Eq. (15) simplifies,
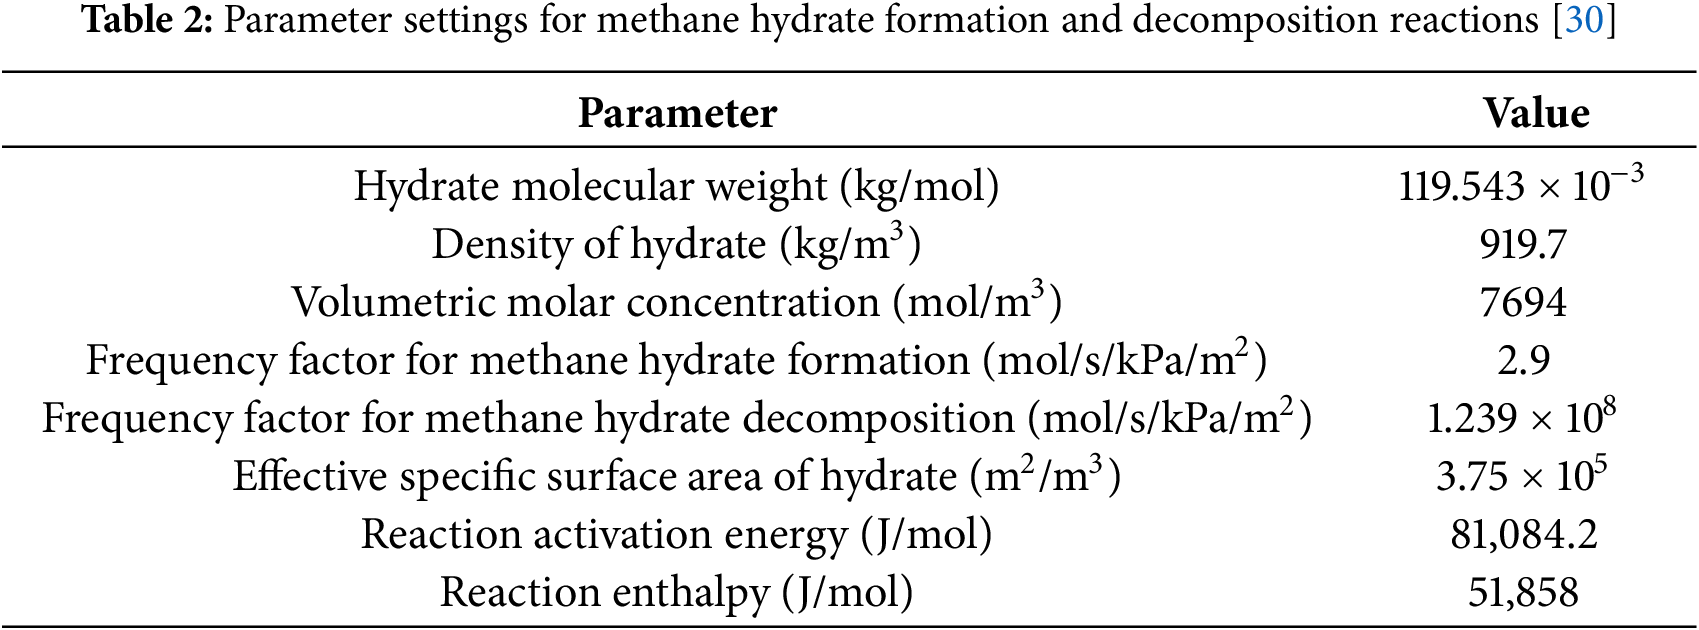
The values of k1, k4 and k5 obtained from curve fitting are k1 = 1.617408 × 10⁹, k4 = −1414.909123, k5 = −105.25 [31]. The parameters for the methane hydrate formation and decomposition reactions are given in Table 2.
The thermo-hydro-chemical coupling relation during hydrate sediments depressurization with sand production is given in Fig. 3a, and a schematic diagram of the modeling workflow is presented in Fig. 3b.
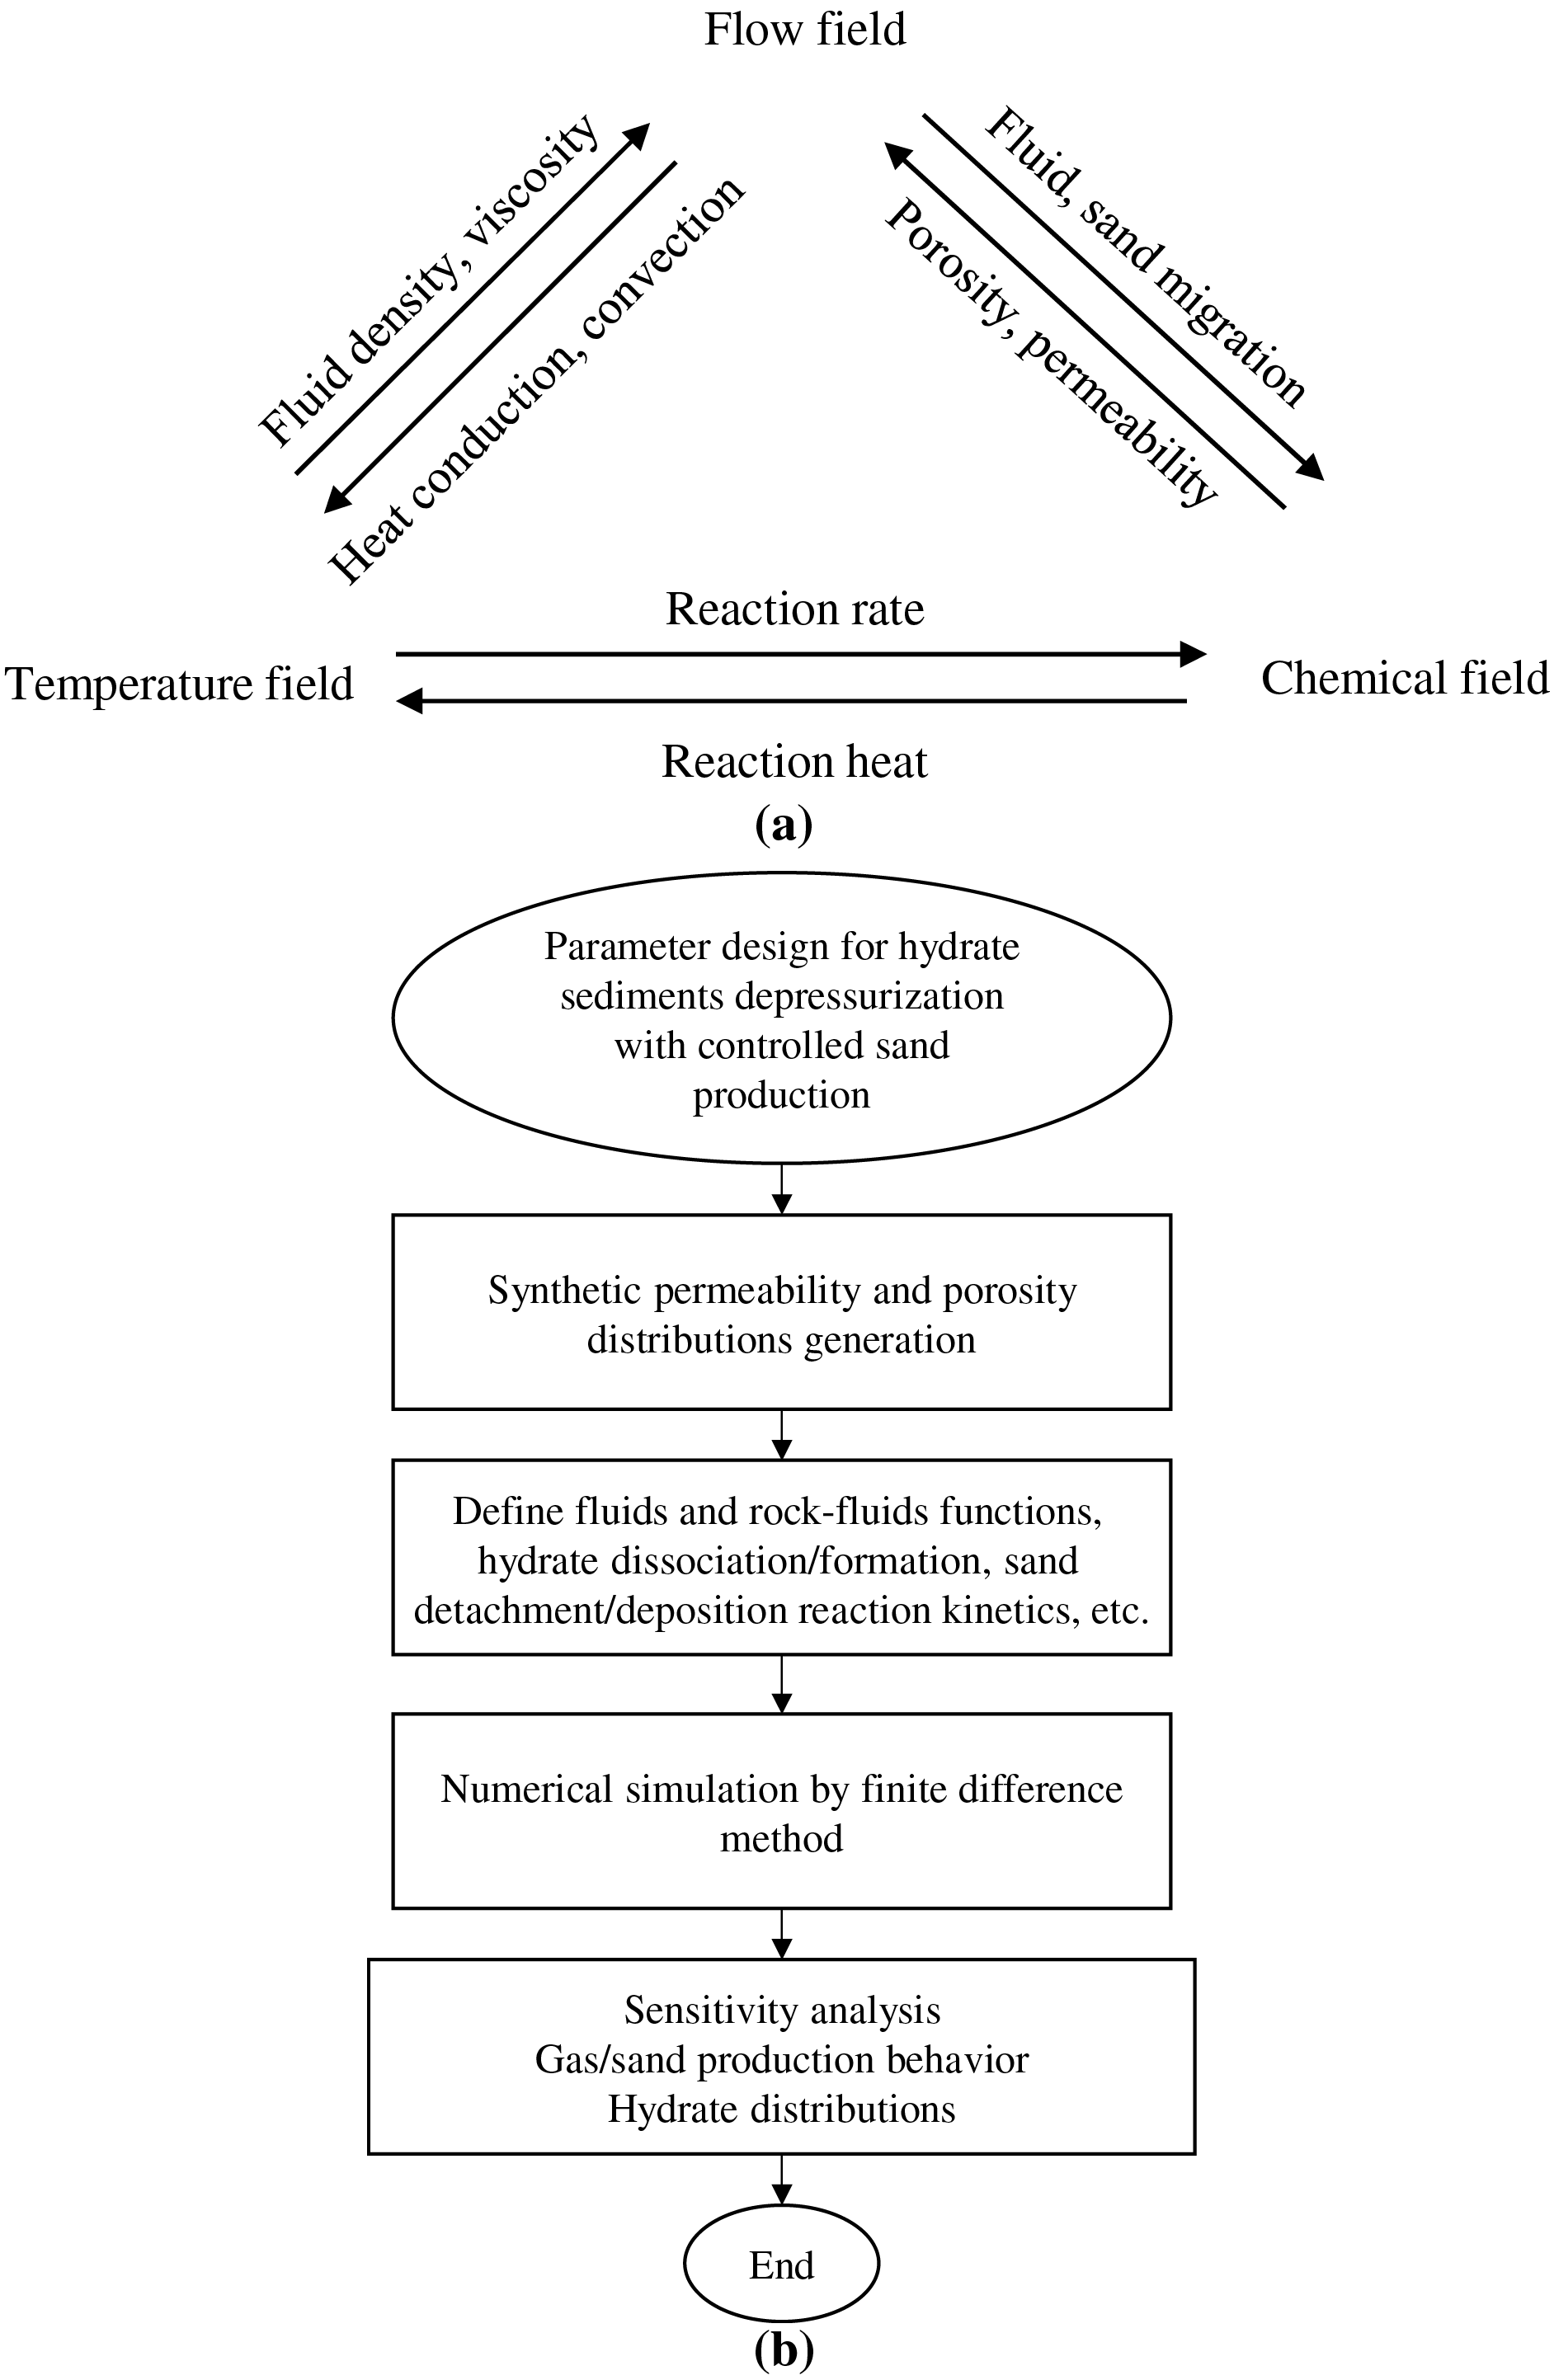
Figure 3: (a) Thermo-hydro-chemical coupling relation during hydrate sediments depressurization with sand production; (b) Schematic diagram of the modeling workflow
2.3 Boundary and Initial Conditions
The methane hydrate-bearing sediment is located 214 m beneath the seabed, with an overlying seawater column of 1266 m and a total formation thickness of 90 m. The formation is vertically stratified into four distinct layers: the overburden, the methane hydrate-bearing layer, the mixed methane hydrate/free gas layer, and the underburden. Under initial conditions, the methane hydrate-bearing layer and the mixed methane hydrate/free gas layer exhibit average porosities of 0.373 and 0.346, respectively. Their corresponding average permeabilities range from 2 to 5 mD, with hydrate saturations of 0.31 and 0.117, and water saturations of 0.317 and 0.537, respectively [32]. The initial temperature profile of the methane hydrate-bearing sediment can be determined based on the seabed temperature and the geothermal gradient,
where Tsf denotes the seabed temperature, set to 3.6°C; ΔT is the geothermal gradient, set to 48°C/km; Z is the depth below the mudline, m.
The initial pressure distribution of methane hydrate-bearing sediments is determined by considering hydrostatic pore pressure,
where Pa is the hydrostatic pore pressure in methane hydrate-bearing sediments, kPa; Patm is the standard atmospheric pressure, set to 101.325 kPa; ρa is the density of formation brine, set to 1000 kg/m3; g represents the gravitational acceleration, set to 9.8 m/s2; H is the overlying seawater depth, m.
Methane hydrate-bearing sediments are produced via depressurization using a vertical well, with a perforation interval of 90 m. During the depressurization process, the bottomhole pressure of the production well is maintained at 3000 kPa. To investigate gas and sand production dynamics under continuous depressurization, the simulation is conducted over a production period of 1000 days. The resulting system of partial differential equations is numerically solved using the finite difference method implemented in CMG-STARS, a widely validated commercial simulator known for its reliability and extensive application in thermal and multiphase flow modeling within the oil and gas sector.
3.1 Impact of Horizontal Autocorrelation Length
Methane hydrate-bearing sediments, shaped by depositional environments and associated processes, exhibit variations in horizontal autocorrelation lengths within permeability and porosity distributions. To examine the impact of horizontal autocorrelation length on methane production behavior during depressurization with moderate sand production, numerical simulations are performed to compare coupled gas and sand production dynamics under four dimensionless horizontal autocorrelation lengths: 0, 0.1, 0.5, and 1. Fig. 4 illustrates the daily and cumulative gas production, along with sand production trends, for each scenario. The results indicate that after 1000 days of continuous production, cumulative methane production first increases and then decreases with increasing horizontal autocorrelation length, peaking at λDh = 0.1. Meanwhile, cumulative sand production steadily rises from 500 to 4300 m3.
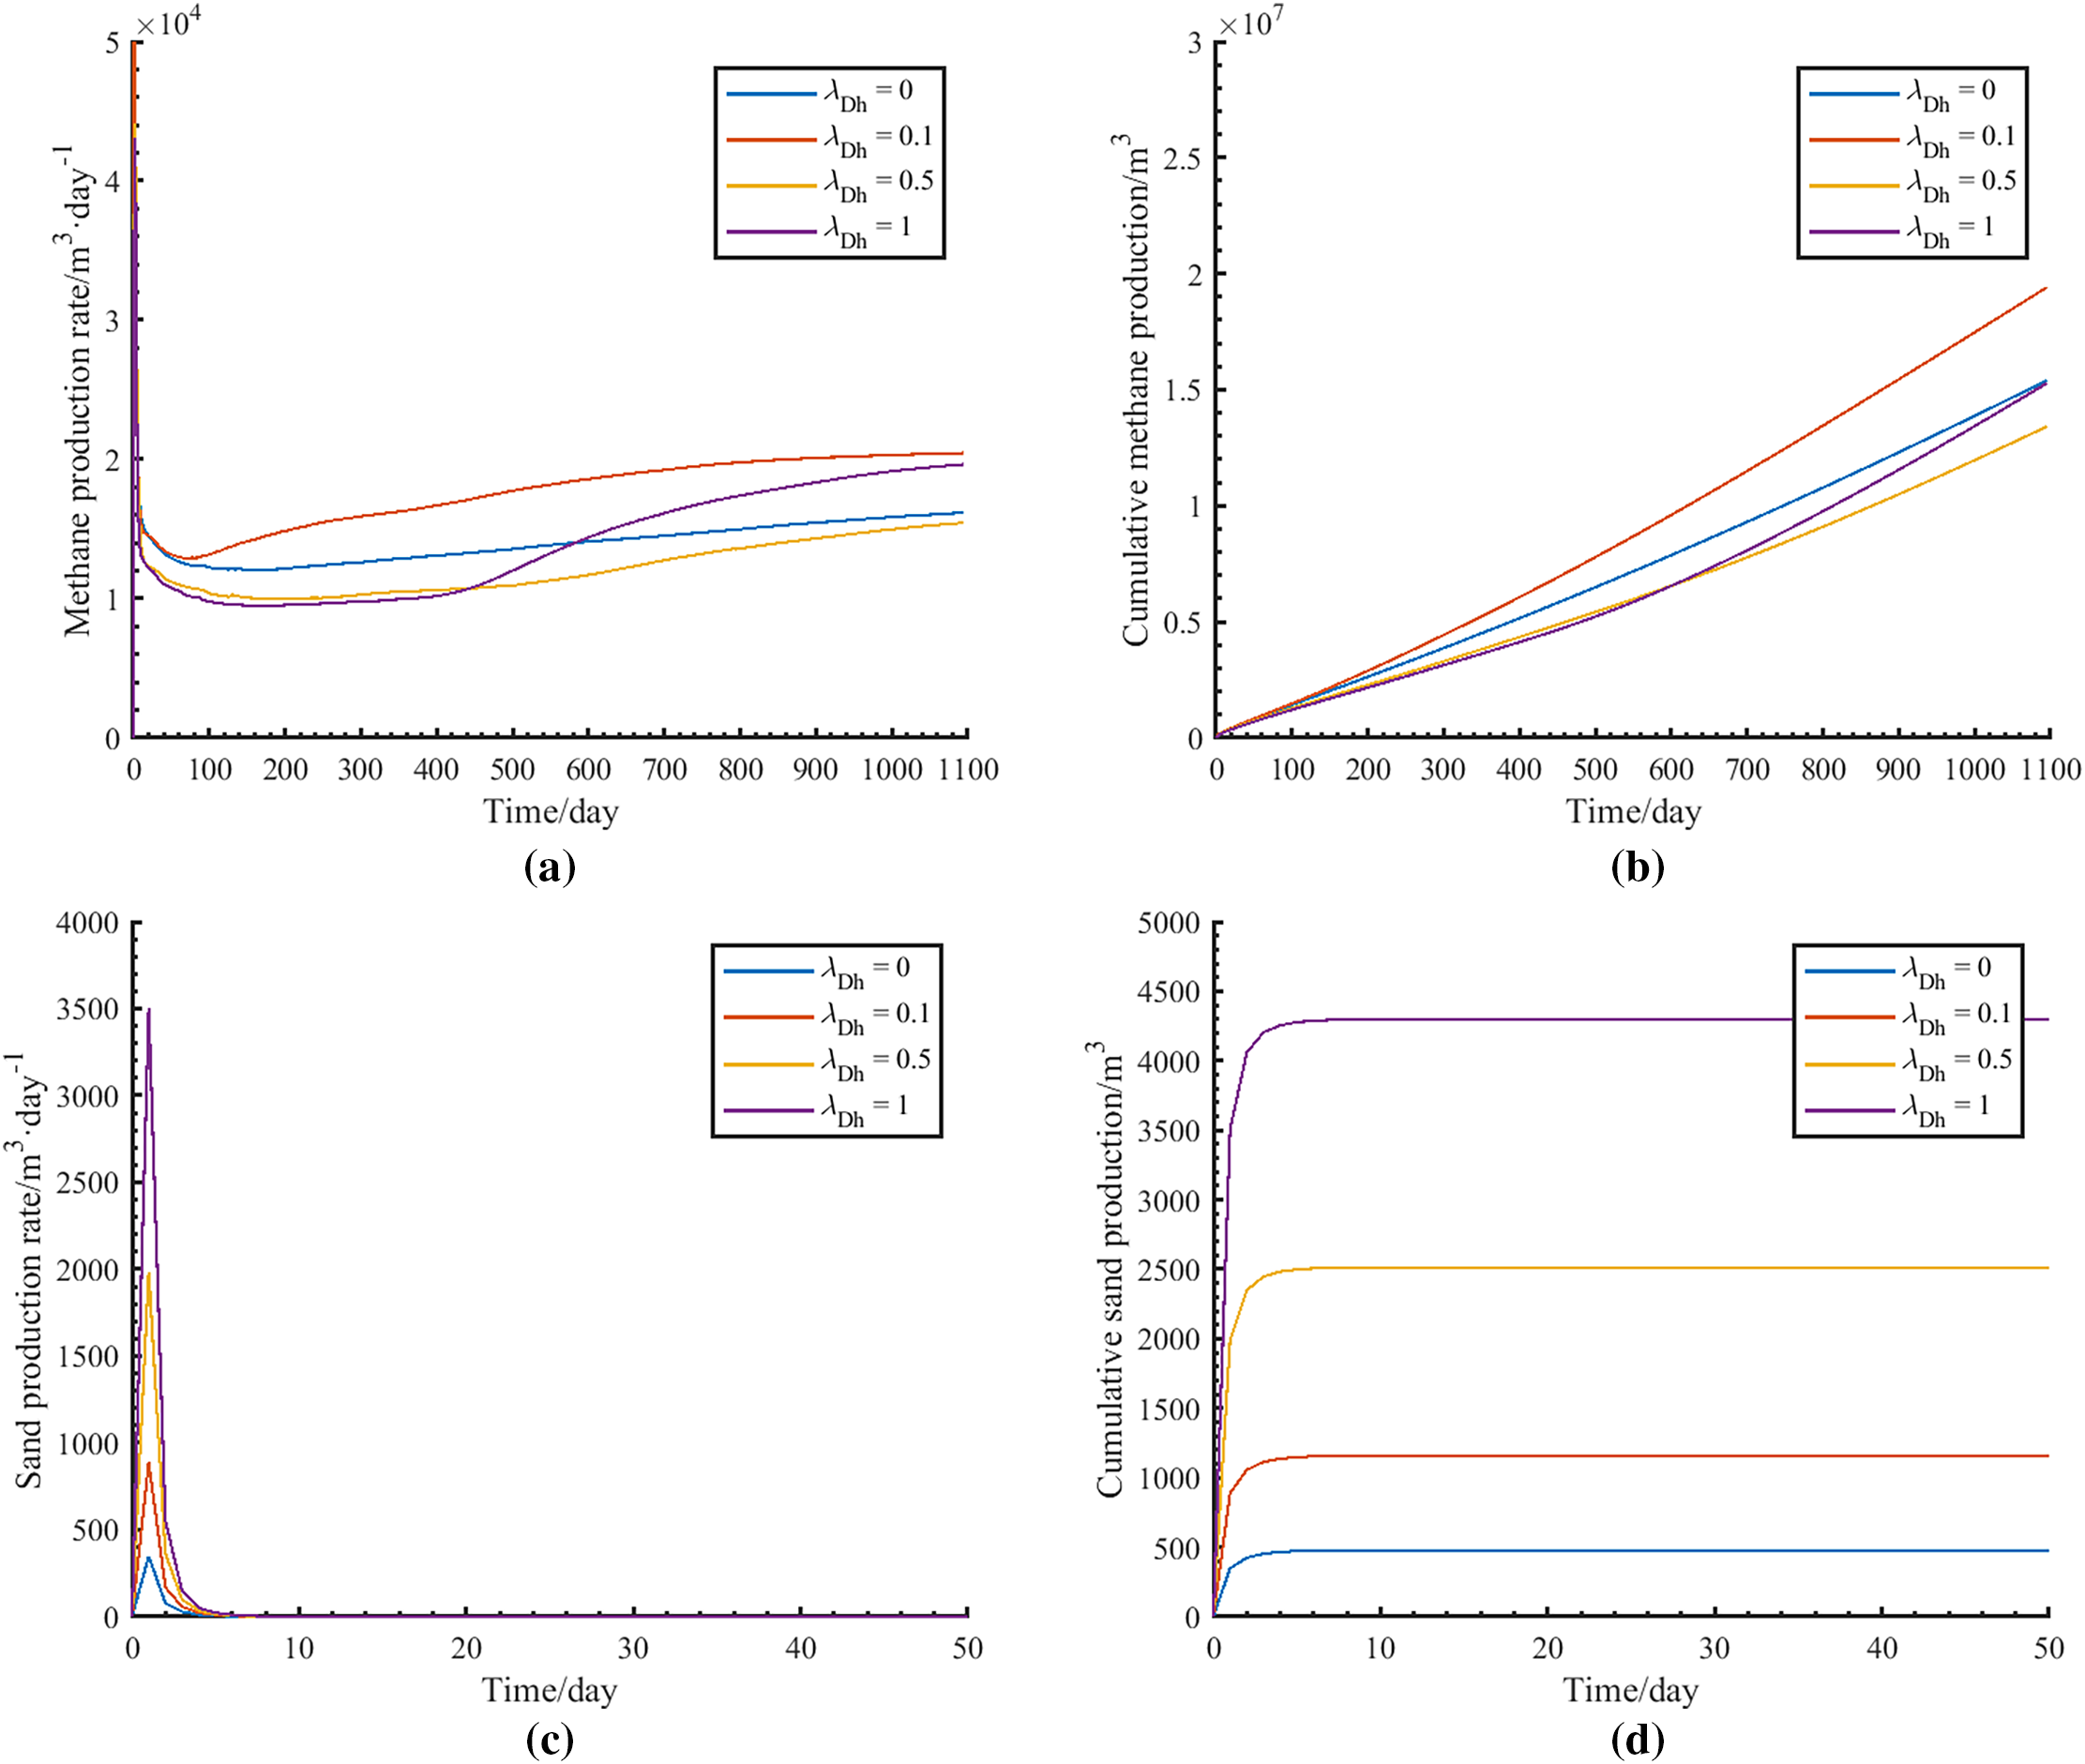
Figure 4: Methane and sand production responses under different horizontal autocorrelation length conditions: (a) Daily gas production; (b) Cumulative gas production; (c) Daily sand production; (d) Cumulative sand production
Fig. 5 shows the initial effective permeability distribution and the methane hydrate saturation profiles before and after 1000 days of production. The results clearly show that low saturation zones resulting from hydrate decomposition are concentrated in high-permeability regions, indicating a strong autocorrelation between hydrate depletion and permeability distribution. These findings suggest that permeability distribution plays a critical role in methane production efficiency during depressurization with controlled sand production, as hydrate decomposition preferentially progresses through low saturation regions. In practical field applications, the optimal horizontal autocorrelation length for permeability distribution should be carefully determined based on geophysical survey data.
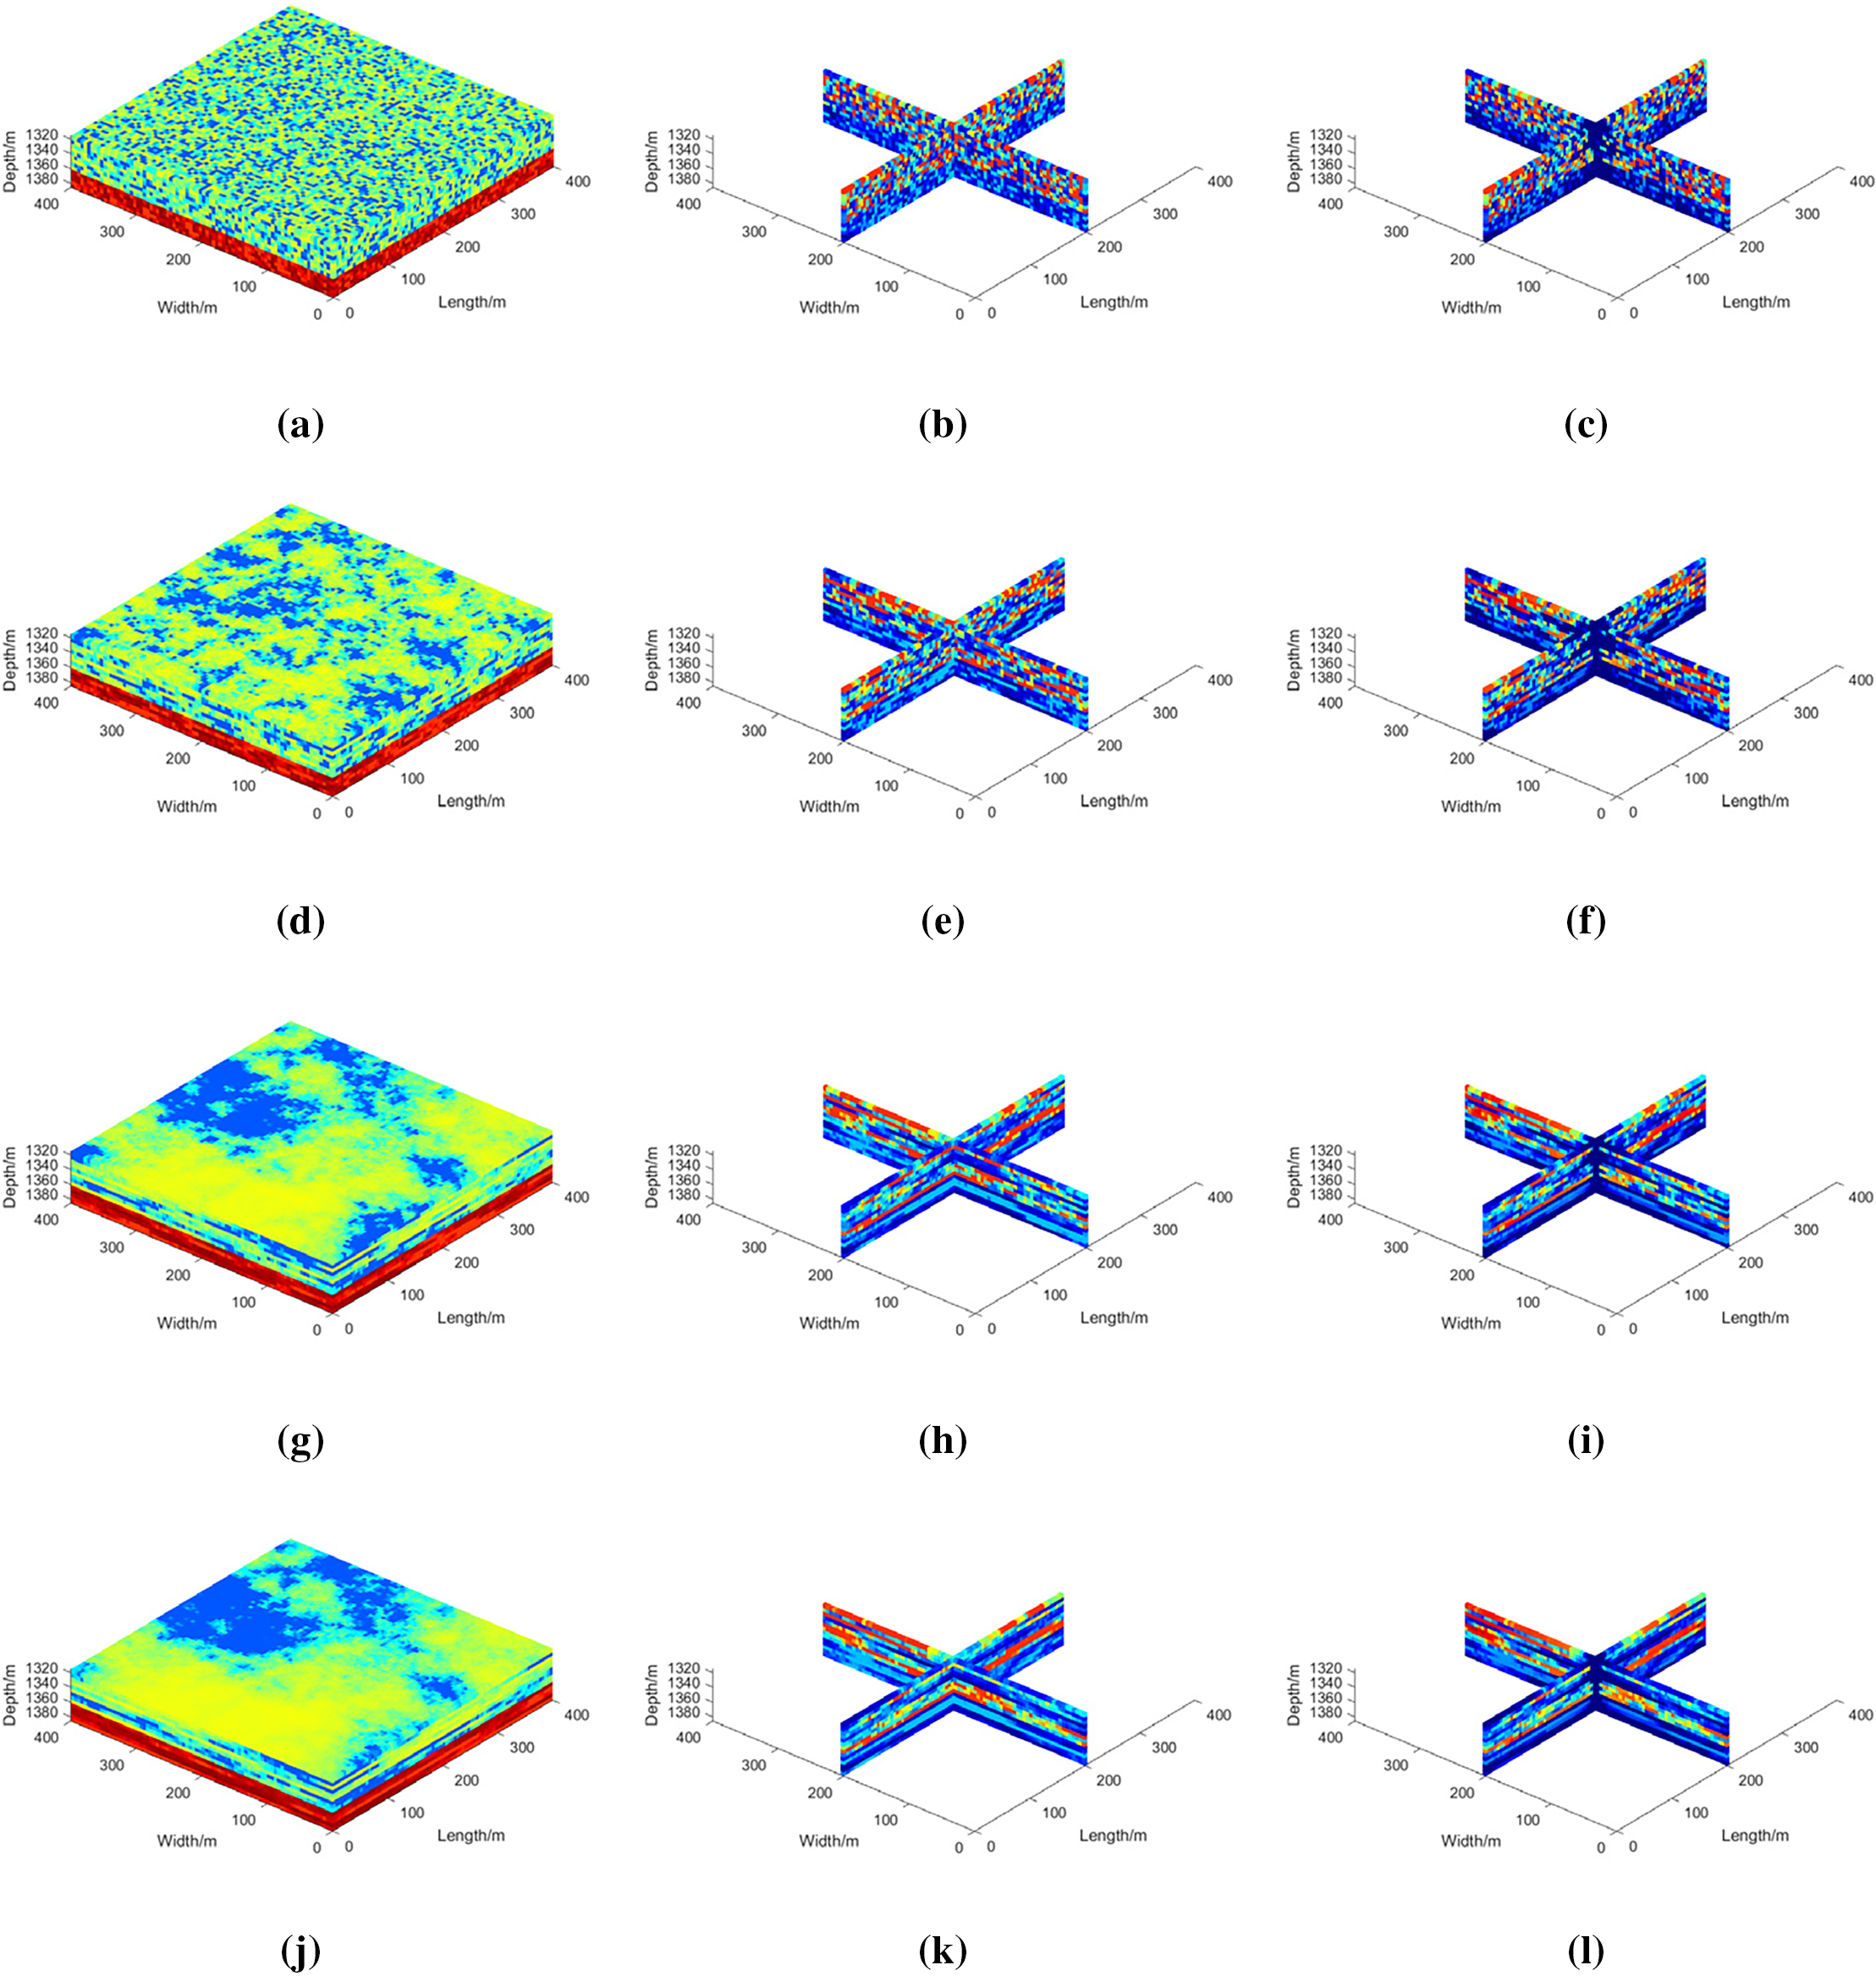
Figure 5: Initial effective permeability and hydrate volume fraction distributions before and after 1000 days of depressurization under different horizontal autocorrelation length conditions: (a–c) λDh = 0; (d–f) λDh = 0.1; (g–i) λDh = 0.5; (j–l) λDh = 1
3.2 Impact of Global Permeability Heterogeneity
To investigate the impact of global permeability heterogeneity on methane and sand production behavior during depressurization, three numerical scenarios are designed and simulated, with permeability heterogeneity characterized by standard deviations of 0.5, 1.0, and 1.2. The simulation results are presented in Fig. 6. As the degree of permeability heterogeneity increases, both daily and cumulative methane production rise, while cumulative sand production increases from 100 to 8000 m3. These results indicate that severe permeability heterogeneity enhances the efficiency of depressurization-based methane production, exhibiting a different response compared to conventional oil and gas production, where excessive heterogeneity often leads to poor sweep efficiency and early water or gas breakthrough. In the context of hydrate exploitation, however, heterogeneity-driven channeling may promote deeper and broader hydrate decomposition fronts, particularly under depressurization. Furthermore, as shown in Fig. 7, at lower heterogeneity levels, the methane hydrate decomposition zone remains concentrated near the production well, whereas higher heterogeneity significantly expands the decomposition zone.
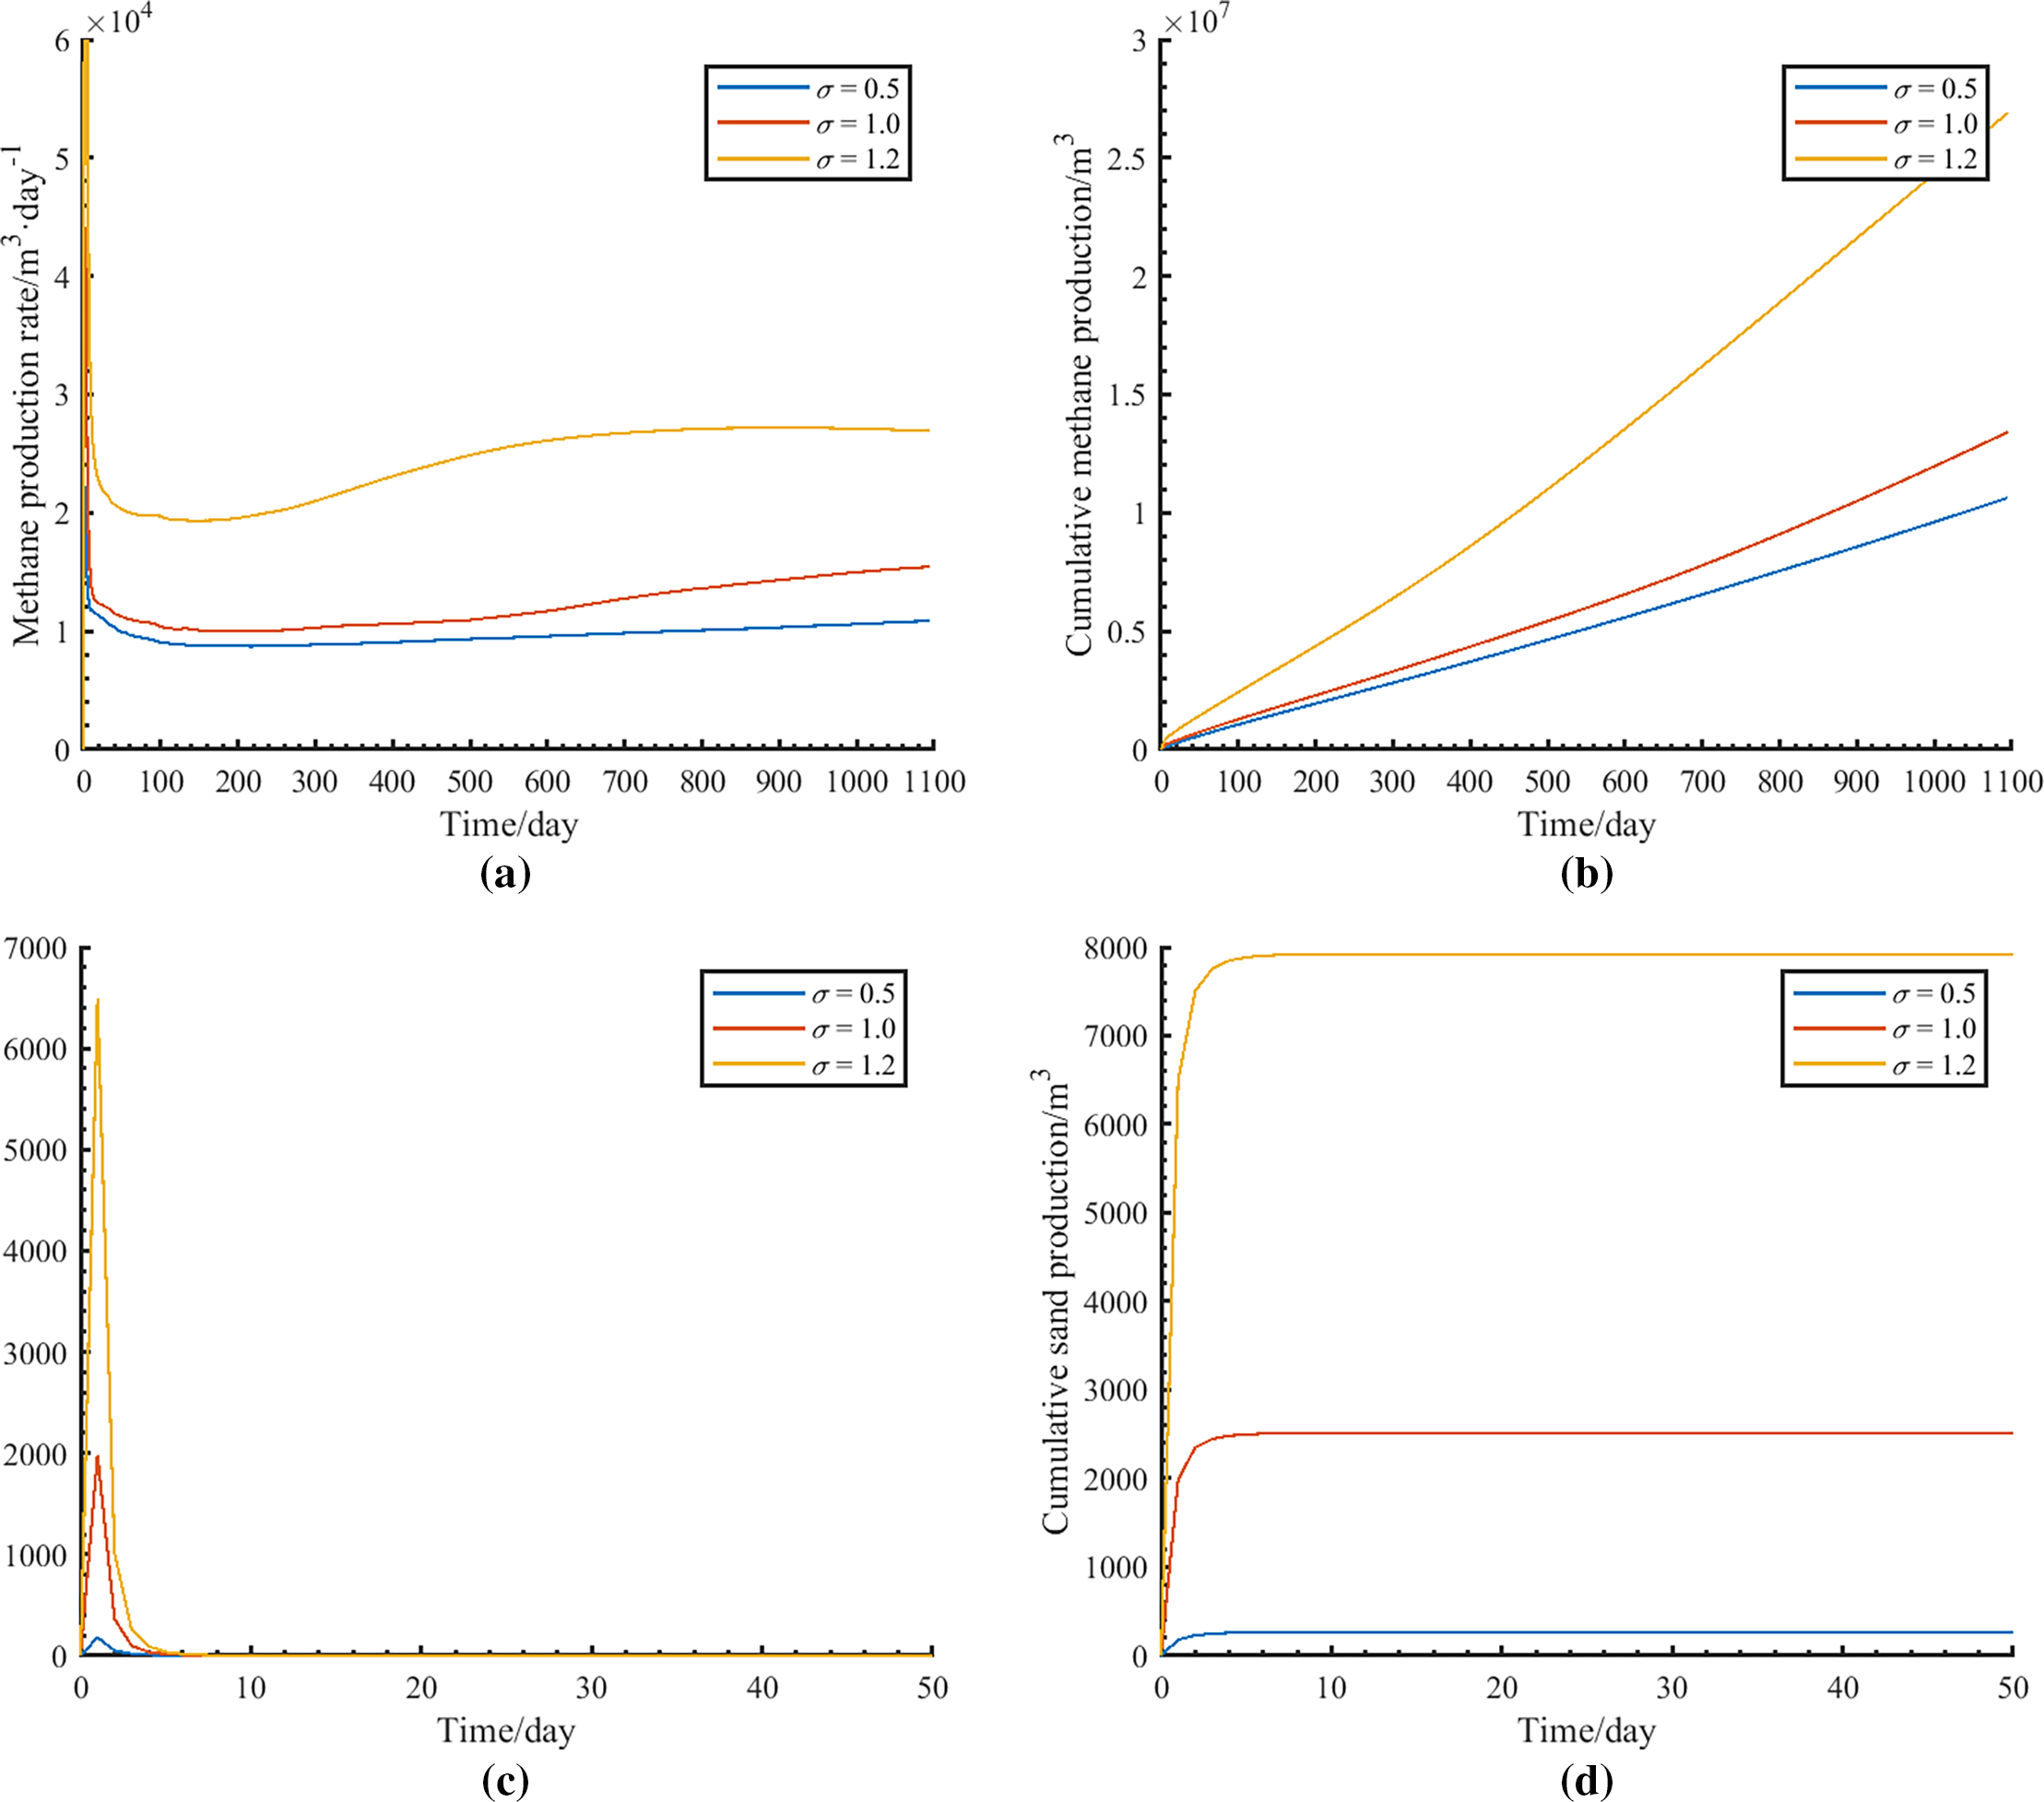
Figure 6: Methane and sand production responses under different permeability heterogeneity conditions: (a) Daily gas production; (b) Cumulative gas production; (c) Daily sand production; (d) Cumulative sand production
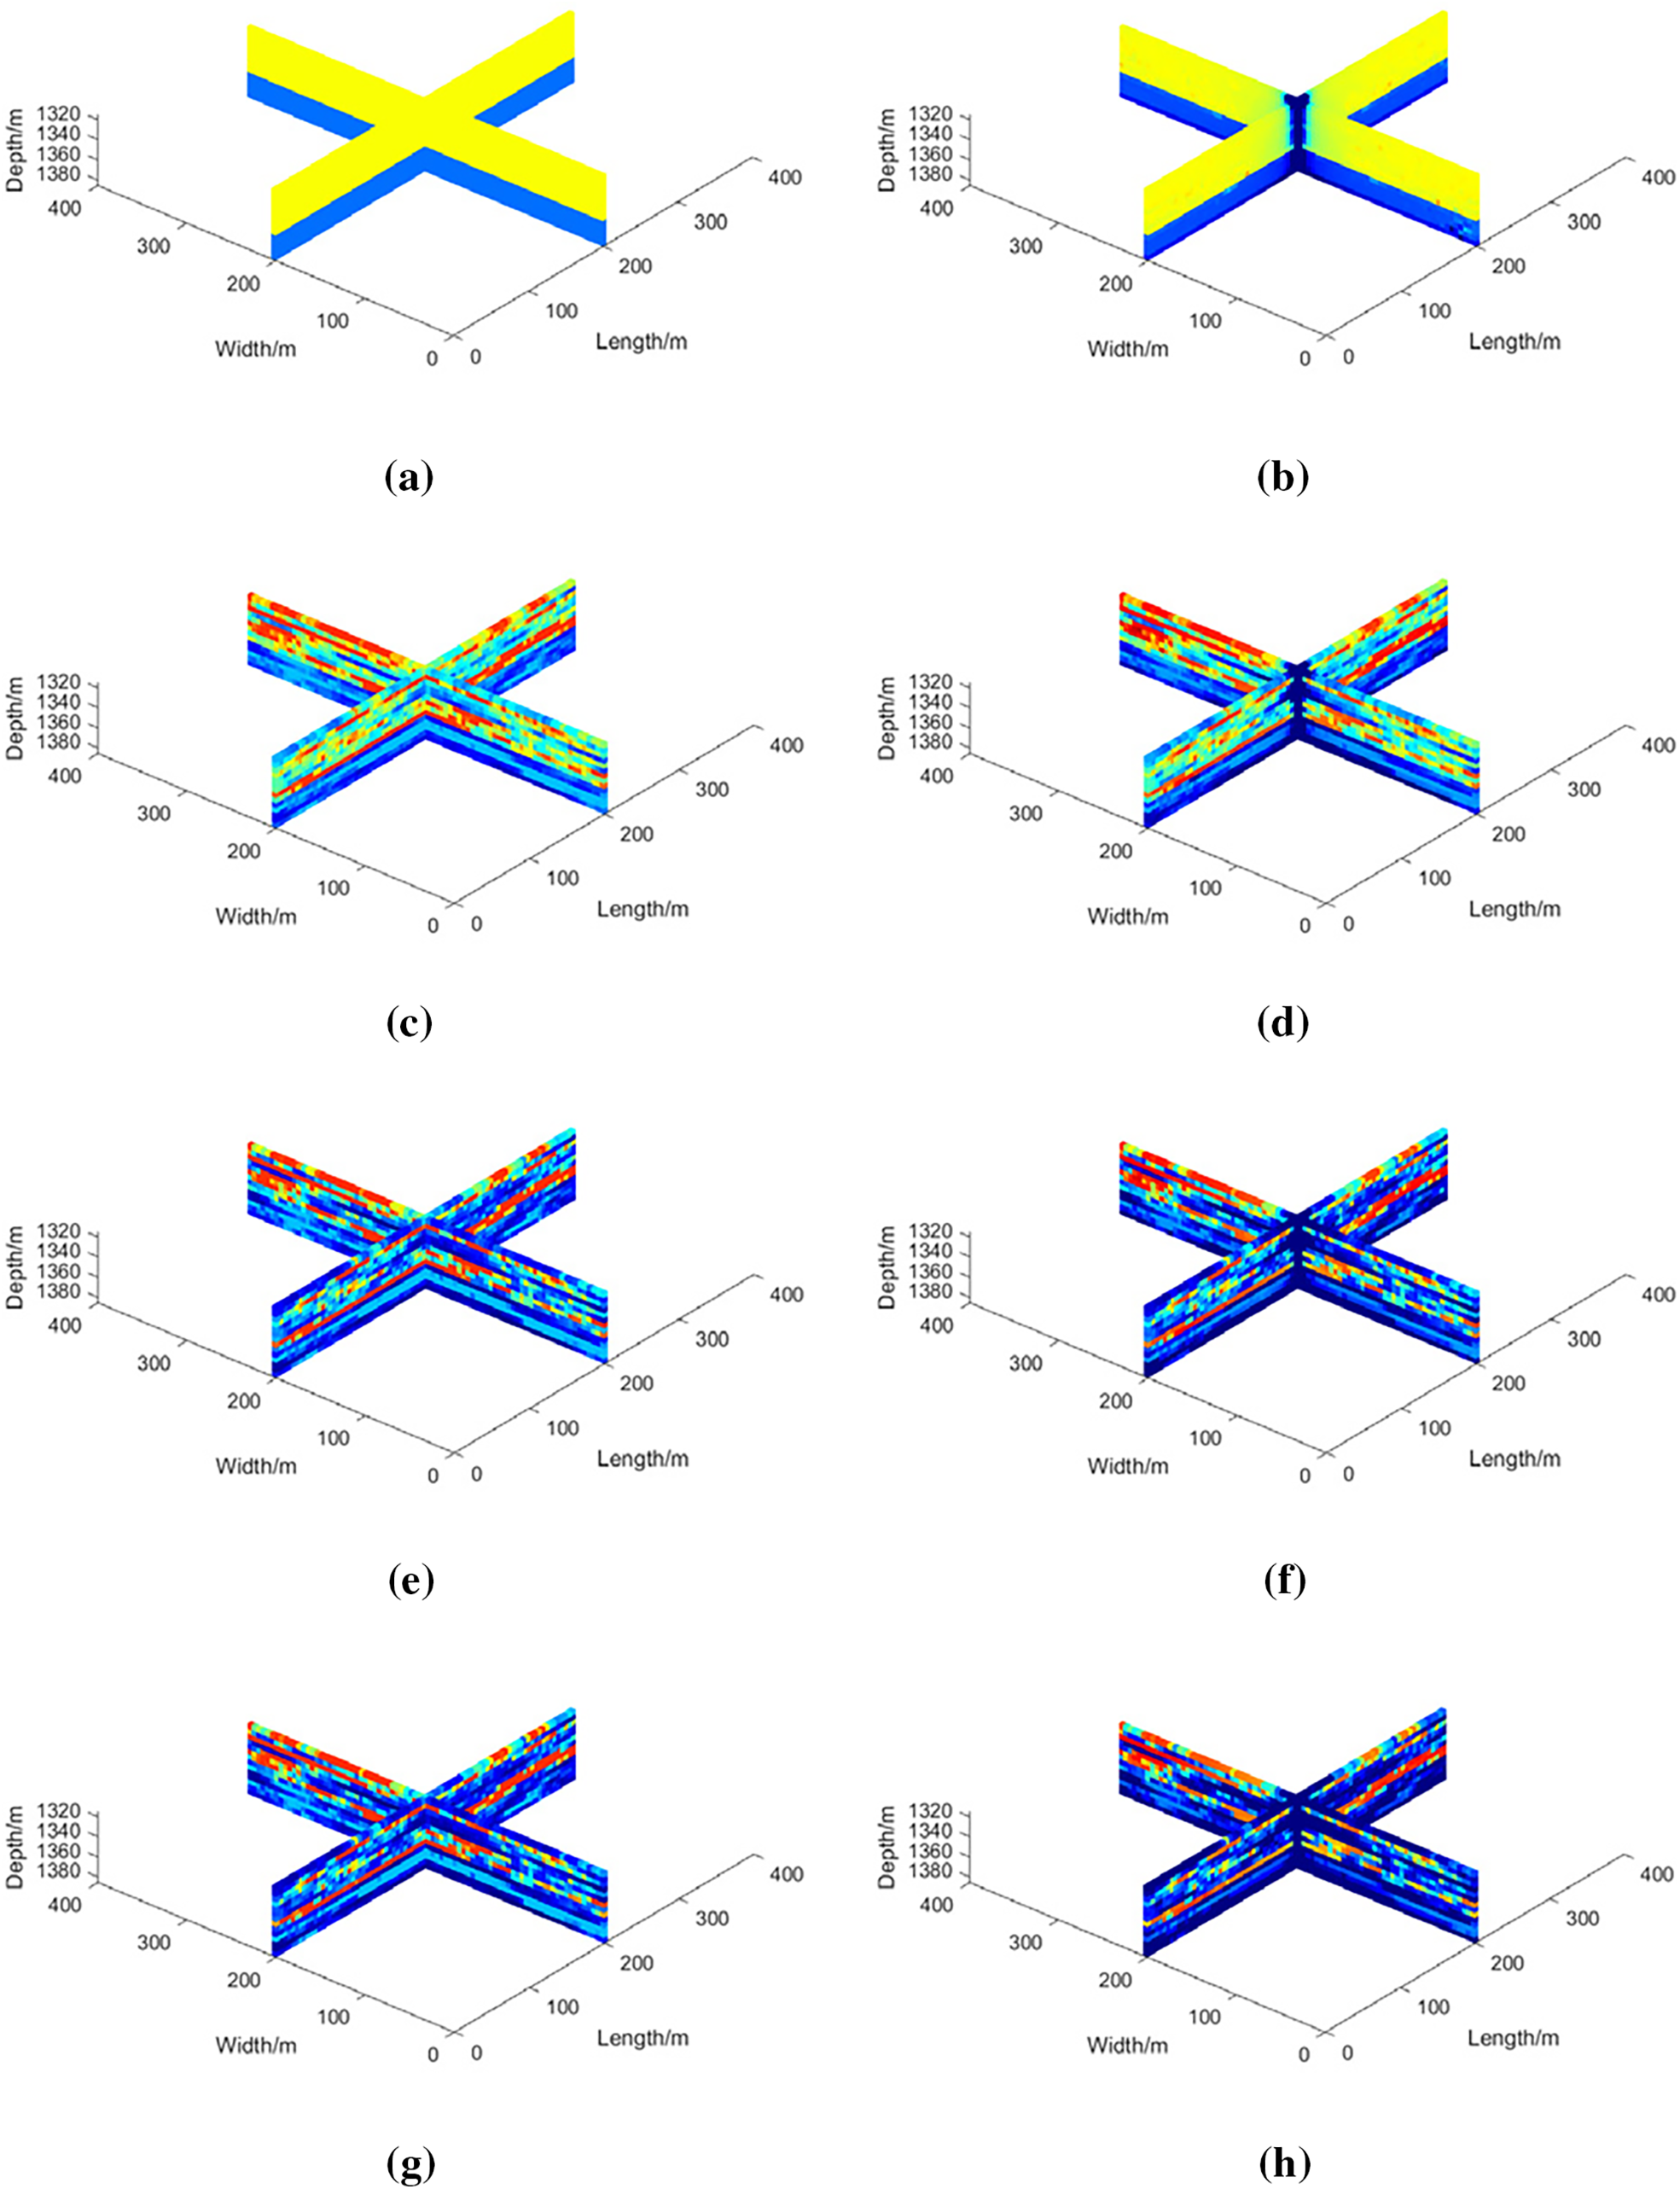
Figure 7: Distribution of permeability and hydrate volume fraction before and after 1000 days of depressurization under different heterogeneity conditions: (a,b) σ = 0; (c,d) σ = 0.5; (e,f) σ = 1; (g,h) σ = 1.2
While the framework can be extended to other hydrate-bearing formations, model parameters such as porosity-permeability relationships, hydrate saturation profiles, and thermal–hydro-chemical properties would need to be adjusted based on local geological conditions. In addition, the current model does not account for the effects of in-situ stress and detailed wellbore dynamics. Specifically, it omits mechanical deformation resulting from hydrate dissociation and the sand production behavior at the wellbore outlet under multiphase flow conditions. Future work should address these limitations by incorporating coupled geomechanical processes and wellbore-scale flow-sediment interaction mechanisms.
In this study, a numerical simulation model has been developed to investigate methane production from unconsolidated argillaceous siltstone hydrate-bearing sediments via depressurization with moderate sand production. By integrating stochastic geostatistical modeling with multiphase, multi-component numerical simulations, this study examines the impact of heterogeneity on methane and sand production responses during the depressurization process. The key findings of this study are summarized as follows,
(1) Depressurization with moderate sand production significantly enhances the methane production rate from hydrate-bearing sediments. Effective sand production management plays a crucial role in optimizing production performance during depressurization.
(2) The horizontal autocorrelation length strongly affects the coupled behavior of methane and sand production during depressurization. As the horizontal permeability autocorrelation length increases, cumulative gas production first rises and then declines, reaching its peak at λDh = 0.1, whereas cumulative sand production continuously increases.
(3) Global permeability heterogeneity plays a crucial role in depressurization with sand production. As the degree of heterogeneity increases, both cumulative gas and sand production exhibit a significant increase.
Acknowledgement: Not applicable.
Funding Statement: This research was funded by the National Key Research and Development Program of China (grant number 2023YFC3009204) and the National Natural Science Foundation of China (grant number 52174015).
Author Contributions: The authors confirm contribution to the paper as follows: Conceptualization, Junyu Deng, Rui Zhang; methodology, Junyu Deng; software, Yifan Yang; validation, Xudong Zhao; formal analysis, Hongzhi Xu, Peng Ji; investigation, Junyu Deng, Zizhen Zhang; writing—original draft preparation, Junyu Deng; writing—review and editing, Rui Zhang; visualization, Yifan Yang; supervision, Rui Zhang; project administration, Rui Zhang; funding acquisition, Rui Zhang. All authors reviewed the results and approved the final version of the manuscript.
Availability of Data and Materials: The data that support the findings of this study are available from the corresponding author upon reasonable request.
Ethics Approval: Not applicable.
Conflicts of Interest: The authors declare no conflicts of interest to report regarding the present study.
References
1. Cui Y, Lu C, Wu M, Peng Y, Yao Y, Luo W. Review of exploration and production technology of natural gas hydrate. Adv Geo-Energy Res. 2018;2(1):53–62. doi:10.26804/ager.2018.01.05. [Google Scholar] [CrossRef]
2. Gong Z, Zhang L, Cheng H, Wang Y, Qi D, Ren S. Productivity and feasibility analysis of gas production from subsea sediment bearing with natural gas hydrate. Int J Oil Gas Coal Technol. 2016;11(3):229–48. doi:10.1504/IJOGCT.2016.074773. [Google Scholar] [CrossRef]
3. Yin Z, Wan QC, Gao Q, Linga P. Effect of pressure drawdown rate on the fluid production behaviour from methane hydrate-bearing sediments. Appl Energy. 2020;271:115195. doi:10.1016/j.apenergy.2020.115195. [Google Scholar] [CrossRef]
4. Guo T, Wang W, Yang X, Chen M, Xu H, Guan L, et al. Numerical simulation of gravel packing in multi-branch horizontal wells in hydrate reservoirs based on CFD-DEM coupling. Geoenergy Sci Eng. 2025;244(19):213445. doi:10.1016/j.geoen.2024.213445. [Google Scholar] [CrossRef]
5. Chen H, Sun J, Guo W, Wang X. Towards to enhancing clayey-silt hydrate production in South China Sea: a comprehensive investigation on the depressurization of methane hydrate in fracturing fluid-saturated area. Int J Heat Mass Transf. 2025;246(18):127072. doi:10.1016/j.ijheatmasstransfer.2025.127072. [Google Scholar] [CrossRef]
6. Lu C, Qin X, Ma C, Yu L, Geng L, Bian H, et al. Investigation of the impact of threshold pressure gradient on gas production from hydrate deposits. Fuel. 2022;319(6964):123569. doi:10.1016/j.fuel.2022.123569. [Google Scholar] [CrossRef]
7. Hao Y, Wang C, Tao S, Sun Y, Liu R, Liang J. Effect of sand production on physical properties and fracturing development of gas hydrate reservoir. Energy. 2024;288(1):129838. doi:10.1016/j.energy.2023.129838. [Google Scholar] [CrossRef]
8. Li JF, Ye JL, Qin XW, Qiu HJ, Wu NY, Lu HL, et al. The first offshore natural gas hydrate production test in South China Sea. China Geol. 2018;1(1):5–16. doi:10.3390/en11102793. [Google Scholar] [CrossRef]
9. Qin X, Liang Q, Ye J, Yang L, Qiu H, Xie W, et al. The response of temperature and pressure of hydrate reservoirs in the first gas hydrate production test in South China Sea. Appl Energy. 2020;278:115649. doi:10.1016/j.apenergy.2020.115649. [Google Scholar] [CrossRef]
10. Ye JL, Qin XW, Xie WW, Lu HL, Ma BJ, Qiu HJ, et al. The second natural gas hydrate production test in the South China Sea. China Geol. 2020;3(2):197–209. doi:10.31035/cg2020043. [Google Scholar] [CrossRef]
11. Ye J, Qin X, Xie W, Lu H, Ma B, Qiu H, et al. Main progress of the second gas hydrate trial production in the South China Sea. Geol China. 2020;47(3):557–68. doi:10.12029/gc20200301. [Google Scholar] [CrossRef]
12. Wu N, Li Y, Wan Y, Sun J, Huang L, Mao P. Prospect of marine natural gas hydrate stimulation theory and technology system. Nat Gas Ind. 2020;40(8):100–15. doi:10.1016/j.ngib.2020.08.003. [Google Scholar] [CrossRef]
13. Deng F, Huang B, Li X, Liu J, Li G, Xu Y, et al. Review of sand control and sand production in a gas hydrate reservoir. Energy Fuels. 2022;36(19):11712–23. doi:10.1021/acs.energyfuels.2c02108. [Google Scholar] [CrossRef]
14. Lu C, Qin X, Sun J, Wang R, Cai J. Research progress and scientific challenges in the depressurization exploitation mechanism of clayey-silt natural gas hydrates in the northern South China Sea. Adv Geo-Energy Res. 2023;10(1):14–20. doi:10.46690/ager.2023.10.03. [Google Scholar] [CrossRef]
15. Shen K, An Y, Xu Z, Wu X, Zhang P, Zhang Y, et al. Numerical simulation on coupling behaviors of sand production and mechanical response during NGH exploitation by depressurization from the argillaceous reservoir. Energy Fuels. 2024;38(1):245–57. doi:10.1021/acs.energyfuels.3c03368. [Google Scholar] [CrossRef]
16. Lu J, Li D, Liang D, Shi L, Zhou X, He Y. An innovative experimental apparatus for the analysis of sand production during natural gas hydrate exploitation. Rev Sci Instrum. 2021;92(10):105110. doi:10.1063/5.0065760. [Google Scholar] [PubMed] [CrossRef]
17. Fang X, Ning F, Wang L, Liu Z, Lu H, Yu Y, et al. Dynamic coupling responses and sand production behavior of gas hydrate-bearing sediments during depressurization: an experimental study. J Pet Sci Eng. 2021;201:108506. doi:10.1016/j.petrol.2021.108506. [Google Scholar] [CrossRef]
18. Li YL, Ning FL, Xu M, Qi MH, Sun JX, Nouri A, et al. Experimental study on solid particle migration and production behaviors during marine natural gas hydrate dissociation by depressurization. Pet Sci. 2023;20(6):3610–23. doi:10.1016/j.petsci.2023.05.018. [Google Scholar] [CrossRef]
19. Liu X, Han Z, Yu L, Wei W, Lu H, Sun Y. Hydrate reservoir stimulation and sand control by liquid-solid phase change proppant filled in radial well. SPE J. 2023;28(4):2003–20. doi:10.2118/214674-pa. [Google Scholar] [CrossRef]
20. Xu YT, Wang Y, Li XS, Li XY, Li G, Deng FC. Experimental research on the influence of particle size on sand production during gas hydrate dissociation via depressurization. Energy Fuels. 2022;36(18):10541–51. doi:10.1021/acs.energyfuels.2c00217. [Google Scholar] [CrossRef]
21. Yan C, Li Y, Cheng Y, Wang W, Song B, Deng F, et al. Sand production evaluation during gas production from natural gas hydrates. J Nat Gas Sci Eng. 2018;57(20):77–88. doi:10.1016/j.jngse.2018.07.006. [Google Scholar] [CrossRef]
22. Zhu H, Xu T, Yuan Y, Feng G, Xia Y, Xin X. Numerical analysis of sand production during natural gas extraction from unconsolidated hydrate-bearing sediments. J Nat Gas Sci Eng. 2020;76:103229. doi:10.1016/j.jngse.2020.103229. [Google Scholar] [CrossRef]
23. Xue K, Liu Y, Yu T, Yang L, Zhao J, Song Y. Numerical simulation of gas hydrate production in Shenhu area using depressurization: the effect of reservoir permeability heterogeneity. Energy. 2023;271:126948. doi:10.1016/j.energy.2023.126948. [Google Scholar] [CrossRef]
24. Wang Y, Wang X, Xu H, Wang Y, Jiang C. Numerical investigation of the influences of geological controlling factors on heat extraction from hydrothermal reservoirs by CO2 recycling. Energy. 2022;252(10):124026. doi:10.1016/j.energy.2022.124026. [Google Scholar] [CrossRef]
25. Wang Y, Zhong K, Gao Y, Sun Z, Dong R, Wang X. Feasibility analysis of storing solar energy in heterogeneous deep aquifer by hot water circulation: insights from coupled hydro-thermo modeling. Adv Geo-Energy Res. 2023;10(3):159–73. doi:10.46690/ager.2023.12.03. [Google Scholar] [CrossRef]
26. Wang YY, Wang XG, Dong RC, Teng WC, Zhan SY, Zeng GY, et al. Reservoir heterogeneity controls of CO2-EOR and storage potentials in residual oil zones: insights from numerical simulations. Pet Sci. 2023;20(5):2879–91. doi:10.1016/j.petsci.2023.03.023. [Google Scholar] [CrossRef]
27. Carman PC. Fluid flow through granular beds. Chem Eng Res Des. 1997;75:S32–48. doi:10.1016/S0263-8762(97)80003-2. [Google Scholar] [CrossRef]
28. Aziz K, Settari A. Petroleum reservoir simulation. London, UK: Applied Science Publishers; 1979. 497 p. [Google Scholar]
29. Van Genuchten MT. A closed-form equation for predicting the hydraulic conductivity of unsaturated soils. Soil Sci Soc Am J. 1980;44(5):892–8. doi:10.2136/sssaj1980.03615995004400050002x. [Google Scholar] [CrossRef]
30. Yu L, Zhang L, Zhang R, Ren S. Assessment of natural gas production from hydrate-bearing sediments with unconsolidated argillaceous siltstones via a controlled sandout method. Energy. 2018;160(6964):654–67. doi:10.1016/j.energy.2018.07.050. [Google Scholar] [CrossRef]
31. Uddin M, Coombe D, Law D, Gunter B. Numerical studies of gas hydrate formation and decomposition in a geological reservoir. J Energy Resour Technol. 2008;130(3):032501. doi:10.1115/1.2956978. [Google Scholar] [CrossRef]
32. Wei J, Fang Y, Lu H, Lu H, Lu J, Liang J, et al. Distribution and characteristics of natural gas hydrates in the Shenhu Sea area, South China Sea. Mar Pet Geol. 2018;98(49):622–8. doi:10.1016/j.marpetgeo.2018.07.028. [Google Scholar] [CrossRef]
Cite This Article
 Copyright © 2025 The Author(s). Published by Tech Science Press.
This work is licensed under a Creative Commons Attribution 4.0 International License , which permits unrestricted use, distribution, and reproduction in any medium, provided the original work is properly cited.
 Downloads
 Citation Tools