
 Submit a Paper
 Propose a Special lssue
 Open Access
ARTICLE

Migration and Distribution Laws of Proppants in Complex Lithology Reservoirs in Offshore Areas
1 Drilling and Production Research Department, CNOOC Research Institute Co., Ltd., Beijing, 100028, China
2 College of Petroleum Engineering, Yangtze University, Wuhan, 430100, China
3 Hubei Key Laboratory of Oil and Gas Drilling and Production Engineering, Yangtze University, Wuhan, 430100, China
* Corresponding Author: Yi Liu. Email:
Energy Engineering 2025, 122(10), 4019-4034. https://doi.org/10.32604/ee.2025.067236
Received 28 April 2025; Accepted 01 August 2025; Issue published 30 September 2025
 View Full Text
 Download PDF
Abstract
Fracture conductivity is a key factor to determine the fracturing effect. Optimizing proppant particle size distribution is critical for ensuring efficient proppant placement within fractures. To address challenges associated with the low-permeability reservoirs in the Lufeng Oilfield of the South China Sea—including high heterogeneity, complex lithology, and suboptimal fracturing outcomes—JRC (Joint Roughness Coefficient) was employed to quantitatively characterize the lithological properties of the target formation. A CFD-DEM (Computational Fluid Dynamics-Discrete Element Method) two-way coupling approach was then utilized to construct a fracture channel model that simulates proppant transport dynamics. The proppant particle size under different lithology was optimized. The results show that: (1) In rough fractures, proppant particles exhibit more chaotic migration behavior compared to their movement on smooth surfaces, thereby increasing the risk of fracture plugging; (2) Within the same particle size range, for proppants with mesh sizes of 40/70 or 20/40, fracture conductivity decreases as roughness increases. In contrast, for 30/50 mesh proppants, conductivity initially increases and then decreases with rising roughness; (3) Under identical roughness conditions, the following recommendations apply based on fracture conductivity behavior relative to proppant particle size: When JRC < 46, conductivity increases with larger particle sizes, with 20/40 mesh proppant recommended; When JRC > 46, conductivity decreases as particle size increases; 40/70 mesh proppant is thus recommended to maintain effective conductivity; At JRC = 46, conductivity first increases then decreases with increasing particle size, making 30/50 mesh the optimal choice. The research findings provide a theoretical foundation for optimizing fracturing designs and enhancing fracturing performance in the field.Keywords
Fracture conductivity, a critical parameter for evaluating hydraulic fracturing effectiveness, has been extensively studied by researchers worldwide. Systematic research has been established regarding proppant size optimization under varying conditions in low-permeability reservoirs [1,2]. However, studies on offshore low-permeability reservoirs remain inadequate due to their complex geological conditions. Multiple factors influence fracture conductivity, with current research primarily focusing on proppant type and size, proppant concentration, and closure stress [3–6]. Taking proppant size as an example, several studies have analyzed conductivity trends under simulated fracture conditions [7,8]. Yet, limited research exists on how proppant size affects conductivity across different lithologies. To address this gap, it is essential to introduce fracture roughness to quantitatively characterize post-fracture roughness in various lithologies. This approach will elucidate the influence of proppant size on conductivity under different rock types, ultimately enabling the optimization of proppant size selection for specific lithological conditions.
Currently, scholars have conducted extensive research on the factors influencing proppant transport, placement, and fracture conductivity [9–11]. Yang et al. [12] systematically analyzed the effects of various fracture geometries, proppant types, and fracturing fluid viscosities on proppant distribution in deep coal seams of the Ordos Basin through a combination of numerical modeling and experimental methods. Zeng et al. [13] and others formed a channel with dimensions of 1.5 m × 0.27 m × 3 mm using two acrylic plates to simulate the fracture, and analyzed the migration and deposition of proppants with different particle sizes in the narrow fracture, so as to obtain the influence of different particle sizes on the conductivity in the narrow fracture. Zhang et al. [14] and others used sandstone rock plates to simulate the fracture morphology in the study of tight sandstones, and analyzed the influence of proppant particle size on the fracture conductivity in tight sandstones. Through reviewing such literature, it is found that different scholars have adopted various methods to screen out distinct influencing factors and draw corresponding conclusions for reservoirs with different lithologies, revealing that lithology significantly affects the final conclusions. To further understand the impact of different lithologies on fracture conductivity and proppant transport/placement, researchers have begun to explore the quantitative characterization of lithologies, aiming to better study the variations of hydraulic fracturing parameters under diverse lithological conditions [15,16]. Since rocks with different lithologies possess distinct mineral compositions, which affect their mechanical properties and fracture patterns, thereby influencing fracture roughness, scholars have introduced fracture roughness as a quantitative indicator for lithological characterization [17,18]. Some scholars simulated different geological conditions in laboratories for reservoirs with specific lithologies, loading rocks containing specific mineral components to generate fractures, measuring fracture roughness, and using the measured roughness as a proxy for corresponding lithologies. However, this method failed to effectively quantify lithologies, so researchers subsequently introduced the fractal dimension to quantify fracture roughness, establishing a more accurate numerical relationship between fracture roughness and lithology [19–21].
In order to better study the influence of proppant particle size on the fracture conductivity under different lithologies of offshore reservoirs, and optimize the construction plan and fracturing design. To better study the influence of proppant particle size on fracture conductivity under different lithologies in offshore reservoirs, and optimize construction plans and fracturing designs, this paper improves the lithological characterization method. Based on point cloud data obtained by laser scanning of fracture surfaces, the fractal dimension is used to quantify the scanned surfaces, thereby characterizing different lithologies quantitatively. In view of the problem of strong heterogeneity of the low-permeability reservoirs in the Lufeng offshore area, it is very necessary to analyze and study the influence of proppant particle size on the conductivity under different lithologies. According to the CFD-DEM dual coupling simulation of the migration of proppants in fractures with different roughness, the migration and placement laws of proppants under different roughness are obtained. The change of the shale content is used to reflect the change of lithology, and then the fracture roughness is used to quantitatively characterize the fracture roughness after fracturing of different lithologies. An experiment on the influence of proppant particle size on the conductivity under different lithologies is carried out, and a roughness-particle size-conductivity chart is established to optimize and select the recommended proppant particle size under different lithologies. This provides a theoretical support and scientific basis for optimizing the fracturing design and improving the fracturing effect in the future.
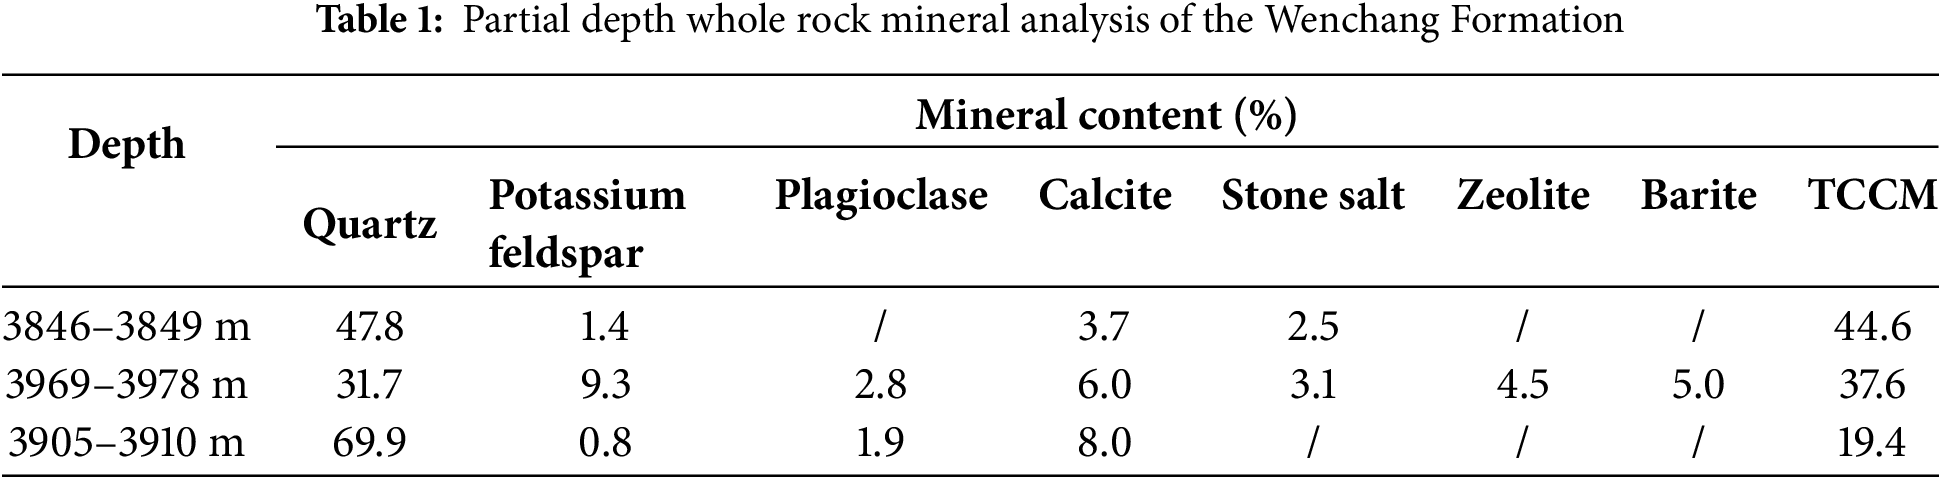
The target formation of the study block is the deep Paleogene in the Lufeng area, the eastern South China Sea. The key formation is the Wenchang Formation of the Paleogene, which is characterized by poor reservoir physical properties and strong heterogeneity [22]. The Paleogene in the reservoir of the Lufeng Sag is mainly a continental faulted subsidence filled basin, featuring deep burial, well-developed source rocks, and poor reservoir properties. Generally, it is composed of medium-low porosity and low-permeability reservoirs close to the oil source. According to the analysis of rock thin sections of the Wenchang Formation, various pore types are distributed in the target reservoir. Based on the genesis, they can be divided into three categories: primary pores, secondary pores, and fractures. Secondary pores include intragranular dissolved pores and intergranular dissolved pores. Among them, the intragranular dissolved pores in the reservoir of the fifth member of the Wenchang Formation can reach 29%, indicating that intragranular dissolved pores are an important type of reservoir pores [23]. Based on the whole-rock mineral analysis of the Wenchang Formation, as shown in Table 1, the rock types are mainly quartz and potassium feldspar; the shale content varies greatly, ranging from 5% to 50%. And the strong variation of the shale content leads to the characteristic of strong heterogeneity in this block.
To characterize different lithologies by varying shale contents and account for the heterogeneity of the study block, it should be noted that rock fracture surfaces are non-smooth with certain roughness. Since the roughness of hydraulic fracture walls directly affects the flow of fracturing fluid, it also influences the transport, settlement, and placement of proppants. Taking the Wenchang Formation as the target reservoir, a 3D model of the fracture surface was obtained via a scanner, and the fractal dimension was introduced to calculate the roughness of the scanned fracture surface, thereby correlating different lithologies (i.e., different shale contents) with distinct roughness values. Subsequently, a CFD-DEM two-way coupling calculation model was adopted, using Fluent to simulate fracturing fluid flow and EDEM (Engineering Discrete Element Method) to monitor proppant movement. A test scheme was established for simulation experiments to obtain the influence of proppant particle size on proppant transport/placement and fracture conductivity under different roughness conditions. The variation laws of conductivity for different proppant sizes under various roughness conditions were obtained through laboratory conductivity tests to validate the numerical simulation results. Finally, a roughness-particle size-conductivity chart was established, providing a theoretical basis for offshore fracturing design optimization. The general process is shown in Fig. 1.

Figure 1: Test route of fracture conductivity
3.1 Establishment of Fracture Model
In this experiment, three types of artificial rock plates with different shale contents (5%, 15%, and 25%) were prepared. The surface models of the rock plates were obtained by a scanner, and the fractal dimension was used to calculate the roughness of the rock plate surfaces, thereby determining the roughness corresponding to rock plates with different shale contents [24–26]. Fig. 2 shows a local enlarged schematic diagram of the rough surfaces of the three rock plates. Finally, the Joint Roughness Coefficient (JRC) corresponding to the artificial rock plates with different shale contents are obtained as follows: 5% shale content—JRC = 30, 15% shale content—JRC = 46, and 25% shale content—JRC = 52. In subsequent articles, JCR will be referred to as fracture roughness.

Figure 2: A magnified schematic diagram of a rough wall surface
Comsol is used to generate fracture models with different fracture roughness, and the upper and lower surfaces of the fractures match each other without contact. Finally, a Boolean operation is performed inside the model to obtain the fracture flow domain. Taking the rough surface with JRC = 46 as an example, a rough fracture model with a flow field size of 500 mm × 100 mm × 1 mm is established according to the on-site fracture size, as shown in Fig. 3. To ensure the convergence of the calculation, based on the regularity of the model, hexahedral meshes are adopted for division, with a mesh size of 1 mm and a total of 50,000 meshes.

Figure 3: Rough fracture flow channel model
The experiment adopts the method of coupling Computational Fluid Dynamics (CFD) and Discrete Element Method (DEM) technology to establish a fluid-particle two-phase flow model. The coupling between the fluid and the particles is achieved through the volume fraction and the interaction force, so as to realize the coupled simulation of the two. From the perspective of practical engineering, the migration process of proppants is a process of the interaction between proppants and solid wall surfaces. It is difficult to simulate the interaction process between proppants and rough fracture surfaces only by using one kind of software. However, the coupled calculation algorithm of CFD-DEM is an algorithm that takes into account the interaction effects between proppant particles and between particles and the wall surface [27,28].
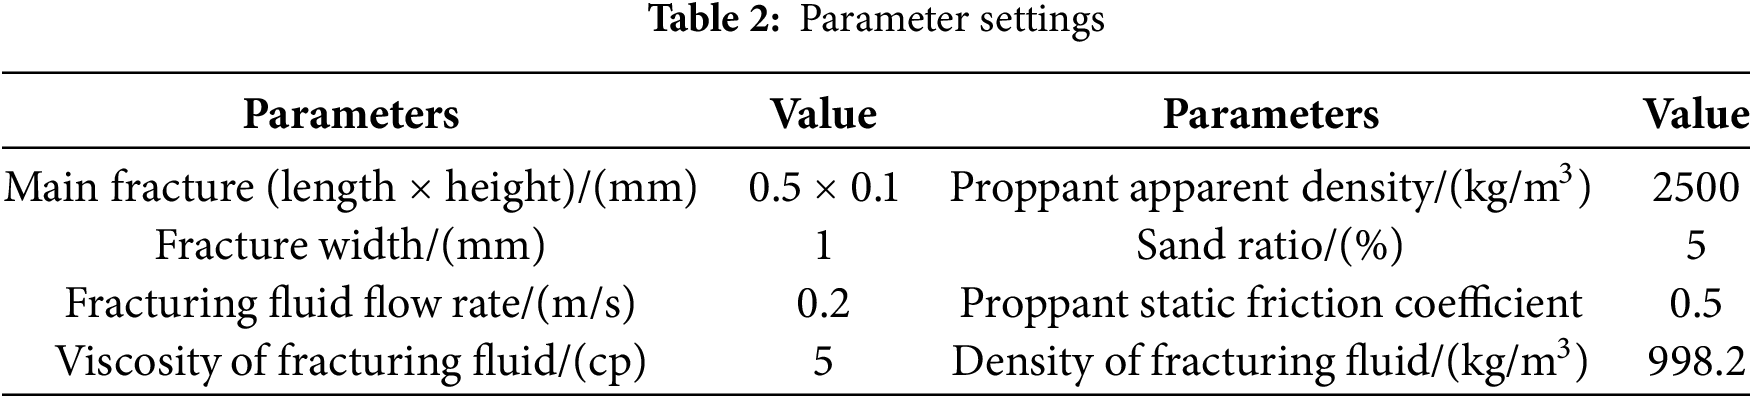
The experimental scheme includes the proppant particle sizes (20/40 mesh, 30/50 mesh, and 40/70 mesh), the fracture roughness corresponding to different shale contents (5%, 15%, and 25%). In actual construction, medium-density ceramic proppants (with an apparent density generally ranging from 2500 to 2700 kg/m3) are used. Therefore, the proppant density in the numerical simulation was set to 2500 kg/m3. and other data are controlled to establish the fracture flow channel model. The specific parameters are shown in Table 2.
Then, a geometric model including the fluid region and the solid particle region is constructed, and the spatial range and boundary conditions of the simulation are determined. The left and right ends of the fracture model shown in Fig. 3 are set as the fluid inlet and outlet, and there is no flow in the up-down direction. The flow of the fluid is described by the mass conservation equation considering the effect of the solid phase, the Navier-Stokes equation, and the turbulent k-epsilon equation set, as shown in Eqs. (1)–(3) below [29–32]:
In the Eqs. (1)–(3): ρf is the fluid density;
The motion trajectory of the particles is directly tracked by using Newton’s second law. In the model, the forces between particles-particles, particles-wall surfaces and the force of the fluid on the particles are considered to determine the physical model. Then, Fluent is used to numerically solve the control equations to obtain the state information of the fluid and particles at different moments. Finally, the converged results are visualized. The general calculation process is shown in Fig. 4.

Figure 4: CFD-DEM bidirectional coupling calculation flowchart
4 Numerical Simulation Analysis
4.1 The Influence of Roughness on Proppant Migration
As shown in Fig. 5, the turbulent kinetic energy of the rough wall surface is much greater than that of the smooth wall surface. Therefore, the magnitude of the roughness in the fracture can greatly affect the movement process of the particles and increase the random movement of the particles. The movement of the proppants in the rough wall surface is subject to greater resistance from the wall surface and the fluid, and the energy dissipation of the particles is also greater, which is not conducive to the migration efficiency of the proppants. The greater the roughness is, the more random the particle movement is, and it is more difficult to form a stable proppant bed, thus leading to a decrease in the conductivity.

Figure 5: Variation of turbulent kinetic energy under different roughness
Fig. 6 shows the migration of ceramsite particles with a mesh size of 20/40 under the condition of high roughness at different moments when JRC = 52. According to the flow channel models at three different moments, it can be found that aggregation occurs in the places where the particles pass through from the start of timing. It can be seen from the black dotted line in t = 10.5 that, with the increase of the height of the proppant bed, due to the influence of the rough curved wall surface, the movement of the particles will gradually form a high-speed channel, and the proppant will move along the channel to a distant place and maintain this movement state for a long time. In addition, when t = 15.2 s, the velocity of the particles reaches the maximum value, which is in the same position as that in the case of a smooth wall surface, both being above the tip of the proppant bed accumulation in the conventional proppant migration. The simulation results are consistent with the theoretical results.

Figure 6: The deposition of particles in the flow channel models at different times when the fracture roughness JRC = 52
In Fig. 6, we observed the migration and placement of proppants in the fracture by tracking particle velocities. During the early pumping stage, a small number of particles remained stationary at the bottom. As more proppants were pumped in, the proppant bed grew taller due to particle settling until an equilibrium was reached between settling and erosion caused by friction, resulting in the formation of three distinct regions: the sedimentation zone, the sliding zone with suspended moving particles, and the suspension zone at the top. Comparing with the smooth fracture case, blue dots indicating “stuck” particles appeared in the sliding zone of the rough fracture but not in the smooth one. This is because the highly undulating walls of the rough fracture caused some particles to become trapped in wall recesses, leading to extremely low particle velocities.
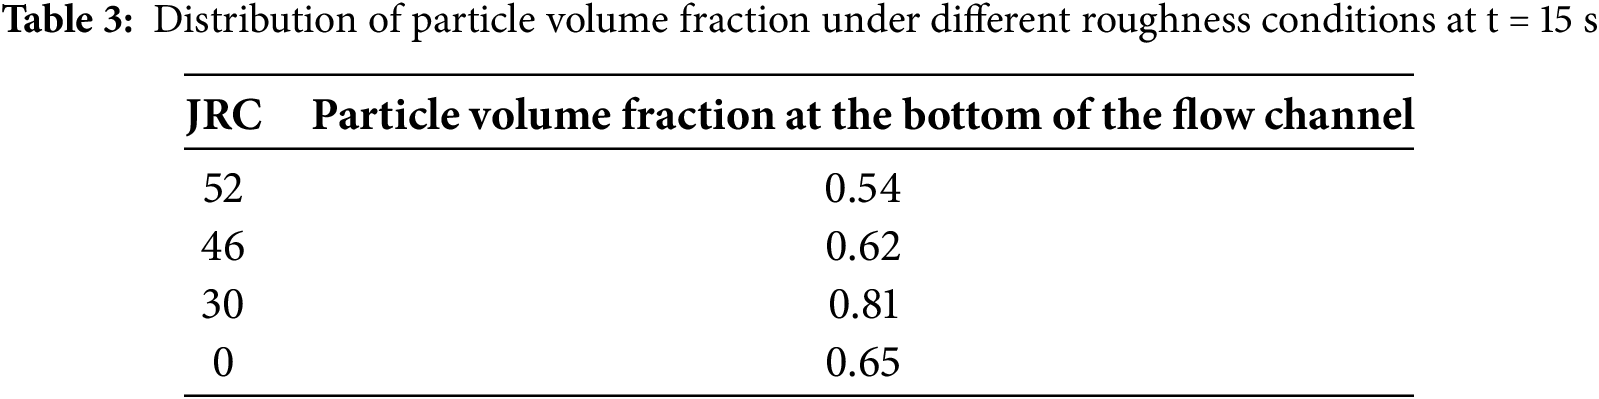
Table 3 shows the distribution of particle volume fraction at t = 15 s for ceramsite with a mesh size of 20/40 under four different roughness conditions. It can be found from the table that when the JRC of the fracture wall surface is 46 and 52, the deposition amount of the proppant is relatively small, indicating that the proppant is distributed everywhere in the fracture and is in a floating state. This will greatly reduce the conductivity. When compared with the case where JRC = 30, the particle volume fraction is more densely deposited, indicating that the area capable of forming conductivity is larger. By comparing the cases of JRC = 52, 46, and 30 with a smooth wall surface, it can be found that the rough wall surface makes the distribution of the proppant in the fracture irregular and more chaotic. The greater the roughness is, the more obvious this chaotic degree becomes, which reduces the effective supporting area of the proppant and thus leads to a significant weakening of the conductivity.
4.2 The Influence of Proppant Particle Size on Proppant Migration
Large-particle-size proppants can form wider fractures, thus achieving high conductivity [33,34]. However, during the fracturing operation, large-particle-size proppants are prone to cause sand plugging, and are likely to break under long-term high closure stress. Small-particle-size proppants can penetrate into micro-fractures during the migration process, thereby connecting fractures further away and creating a larger stimulated area. Nevertheless, due to their smaller particle size, the fluid flow channels formed by them are also smaller compared with those formed by large-particle-size proppants, making it difficult to achieve high conductivity.
As shown in Fig. 7, the migration simulation of proppants with three different particle sizes was carried out in the fracture model with JRC = 46. It can be clearly observed from the figure that when the particle size is relatively small (40/70 mesh), some of the proppants will settle during the migration process, forming a thin and multi-segmented raised sand bed. At the same time, it is found that the velocity at the top of the sand bed is larger than that in other places. At this time, the settled proppants still have fluidity under the continuous disturbance of the proppant-carrying fluid. When the particle size is 30/50 mesh, the deposition effect in the fracture is good, and a good proppant bed can be formed to obtain better conductivity. Through comparison, it is found that when the particle size of the proppant is relatively large (20/40 mesh), the flow of particles in the fracture can also form a fixed channel, and show a certain volume fraction, which can ensure a certain conductivity. Finally, the conductivity from large to small is: 30/50 mesh > 40/70 mesh > 20/40 mesh.

Figure 7: Distribution of proppant volume fraction under different particle size conditions
To more intuitively analyze the influence of roughness and particle size on fracture conductivity, the conductivity is calculated using the following equations [35]:
In Eqs. (4)–(10), F represents fracture conductivity; ω is the fracture width;

According to the numerical simulation results in Table 4: when JCR = 30, fracture conductivity increases with the increase of particle size; when JCR = 46, conductivity first increases and then decreases; when JCR = 52, conductivity shows a decreasing trend with the increase of particle size.
5 The Influence of Proppant Particle Size on Fracture Conductivity under Different Lithologies
5.1 Roughness—Particle Size—Fracture Conductivity Experiment
When optimizing the selection of proppants to achieve higher fracture conductivity, the particle size of the proppants is a crucial factor. A suitable proppant can not only achieve the desired conductivity but also maximize the utilization rate of the reservoir. However, in formations under different conditions, the requirements for proppants vary. In order to systematically study the relationship between the particle size of proppants and conductivity under different roughness conditions, the focus is on studying the placement of proppants under different roughness conditions, so as to obtain the variation law of conductivity.
Combined with the actual fracturing operation situation in the study area, the temperature of the target reservoir is 123°C, and the closure pressure is 63 MPa. Ceramsite with mesh sizes of 40/70, 30/50, and 20/40 is mainly used. Therefore, the laboratory experimental conditions for conductivity are set as follows: under the conditions of a closure pressure of 60 MPa and a proppant concentration of 10 kg·m−3 (uniform placement), the conductivity of three ceramsite particle sizes of 40/70, 30/50, and 20/40 is tested. The slickwater fracturing fluid used in the experiment is the same as that in the actual operation, and the experimental temperature is set at 120°C. The conductivities corresponding to each proppant particle size are tested under different shale contents (5%, 15%, and 25%), respectively. For each shale content, 4 rock samples are prepared, and the experimental liquid used is 3% KCL. In addition, a steel plate, which is regarded as JRC = 0, is used as a reference experiment for comparison with the rock plate experiment. Fig. 8a shows the schematic diagrams of the three rock plates.

Figure 8: (a) Schematic diagrams of three types of rock plates (b) Front view of rock plates with 5% mud content (c) 20/40 mesh ceramsite was laid in the diversion channel. (d) After the experiment, 5% of the rock plate was mixed with 20/40 mesh ceramsite
After preparing the experimental materials and equipment, the experiment was carried out. Fig. 8b–d shows the schematic diagrams of the rock plate with a shale content of 5% before and after the experiment using ceramsite with a mesh size of 20/40. The final conductivity results are shown in Table 5. By observing the final conductivity of the steel plate, it is found that for a smooth surface, the conductivity shows a gradually increasing trend with the increase of the particle size, indicating that increasing the particle size has an obvious effect on improving the conductivity. The final conductivity when using 40/70 mesh is 72% higher than that when using 20/40 mesh. However, the actual situation is more complicated, and the particle size of the proppant cannot be blindly increased. It is necessary to analyze according to the other three groups of roughness.

A comparison of the fracture conductivity results from experiments and numerical simulations reveals that the variation trends of conductivity under different proppant particle sizes and fracture roughness are basically consistent between the two.
5.2 Roughness—Particle Size—Fracture Conductivity Plate
Therefore, based on the experimental and numerical simulation results, a Roughness-Particle Size-Fracture Conductivity Plate is established, as shown in Fig. 9. For the core with a relatively small fracture roughness (JRC < 38), the conductivity increases with the increase of the particle size, which is the same as the result of the smooth flat plate. The particle size of the proppant can be appropriately increased to improve the conductivity, and 20/40 mesh is recommended. However, for the fracture surface with a greater fracture roughness (JRC > 49), the conductivity decreases instead with the increase of the particle size, which is exactly the opposite of that of the smooth surface. A particle size of 40/70 mesh is recommended to ensure the effective conductivity of the fracture. When the fracture roughness JRC = 46, the conductivity shows a trend of first increasing and then decreasing with the increase of the particle size, and 30/50 mesh is recommended. Therefore, when JRC ∈ (38, 49), it is necessary to conduct an analysis according to the actual situation. When the particle size is the same but the roughness is different, the conductivities corresponding to the particle sizes of 20/40 and 40/70 mesh decrease with the increase of the roughness. However, when the particle size of 30/50 mesh is used, the conductivity shows a trend of first increasing and then decreasing with the increase of the roughness. This is consistent with the results of the proppant migration law in the previous section.
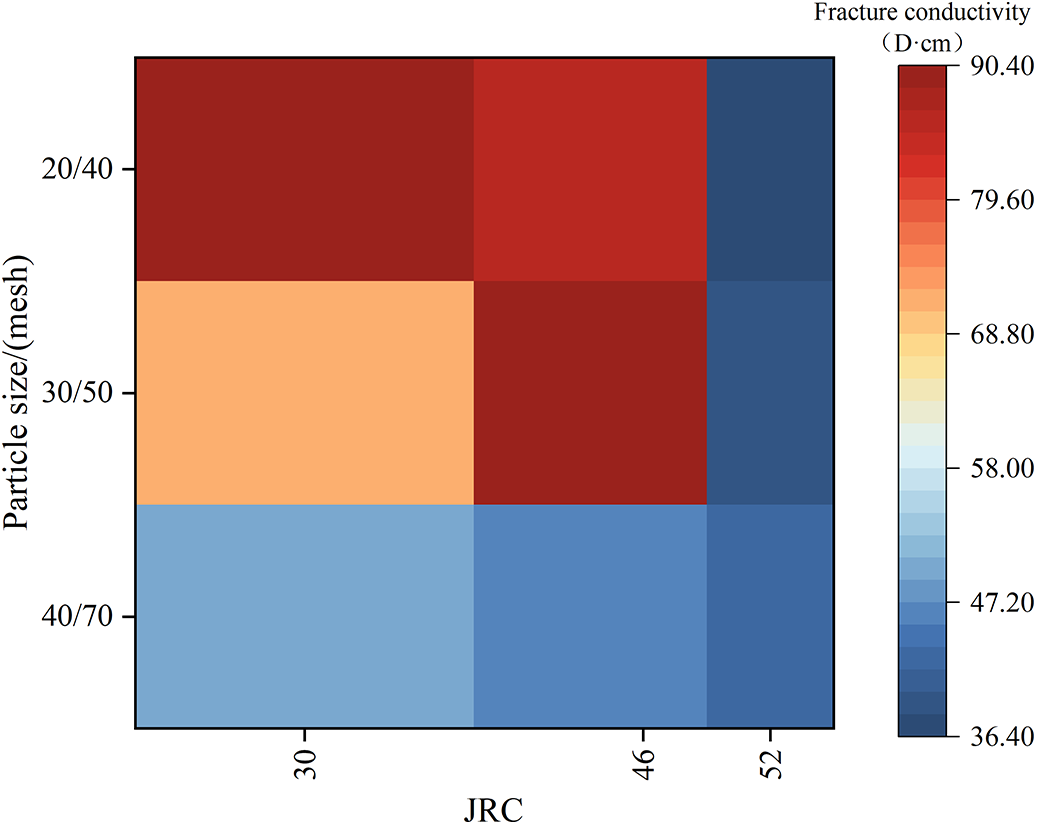
Figure 9: Roughness—particle size—fracture conductivity plate
Taking Wells 13-8-2, 7-9-1 and 14-5-1 in the LF well area as examples, artificial rock plates with similar roughness are prepared according to the drilling cores (as shown in Fig. 10). Firstly, the fracture wall surfaces of the cores are scanned to obtain the point cloud data. Then, through data processing, the height distribution of each elevation point on the fracture surface is obtained, and the fracture roughness is calculated. The fracture roughness of the core fractures in the target reservoirs of the three wells are JRC = 31, JRC = 47 and JRC = 50, respectively.

Figure 10: Fabrication of the rock plate of LF13-8-2
Wells LF13-8-2, LF7-9-1 and LF14-5-1 are selected to verify the model, and the basic parameters are shown in Table 6. Through the conductivity experiments on the rock plates of the three wells, it is found that: when the proppant with a particle size of 20/40 mesh is used for the rock plate of LF13-8-2, the conductivity is the strongest. In the actual working area, a relatively high daily production is also obtained when using the designed ceramsite with a particle size of 20/40 mesh, which corresponds to the conductivity chart. For LF7-9-1, it initially used the designed ceramsite with a particle size of 20/40 mesh for production and had a certain daily production. After using the recommended ceramsite with a particle size of 30/50 mesh according to the chart, the conductivity is further improved, which is about 5% higher than before. For LF14-5-1, the conductivity using the designed particle size fails to meet the expectation, and the production is extremely low. In order to ensure a certain production, based on the roughness-conductivity chart, after using the recommended ceramsite with a smaller particle size of 40/70 mesh, the conductivity is slightly improved.

An analysis of the actual situations of Wells LF7-9-1 and LF14-5-1 shows that for LF14-5-1, due to the relatively large roughness of its fracture wall surface, the migration of proppants is affected. Using proppants with a large particle size is likely to cause fracture blockage, which greatly affects the conductivity and leads to a low production. Therefore, it is consistent with the trend of the conductivity of the recommended particle size in the chart, that is, the smaller the particle size, the higher the conductivity. For LF7-9-1, the fracture roughness is moderate. Thus, if the particle size is too small, it is easy to cause fracture blockage, and if the particle size is too large, it cannot provide a good supporting effect on the fracture, both of which have a negative impact on the conductivity. Therefore, the recommended moderate particle size also corresponds to the actual situation. All of the above verify that the roughness-particle size-conductivity chart has high reliability and can provide theoretical support for fracturing design and construction optimization.
In general, different lithologies correspond to different fracture roughnesses. When the roughness is large, only by using proppants with a large particle size can a certain conductivity be ensured; when the fracture roughness is small, the conductivity corresponding to a small particle size is better. This is because the rough wall surface enhances the interaction between the proppant particles and the wall surface as well as among the particles. In rough fractures, proppant particles are more likely to collide and aggregate to form larger particle clusters. These clusters are difficult to move in the fracture and are prone to accumulate in local areas, resulting in fracture blockage and thus affecting the conductivity. The rough wall surface may also cause the proppant to be more easily embedded in the fracture wall surface. This not only changes the geometric shape of the fracture, making the flow channel narrower, but may also cause damage to the wall surface, further disrupting the stability and conductivity of the fracture.
1. Compared with smooth fractures, rough fractures have greater fluctuations in fluid turbulent kinetic energy, more chaotic and irregular proppant migration, and a higher proportion of particles in a suspended state within the fracture, making the fracture more prone to blockage.
2. Within the same particle size range, when the particle sizes are 40/70 and 20/40 mesh, the conductivity decreases with the increase of the roughness; however, when the particle size is 30/50 mesh, the conductivity shows a trend of first increasing and then decreasing as the roughness increases.
3. Under the same roughness condition, when JRC < 38, the conductivity increases with the increase of the particle size. The particle size of the proppant can be appropriately increased to improve the conductivity, and 20/40 mesh is recommended; but when JRC > 49, the fracture conductivity continuously decreases with the increase of the particle size, and a particle size of 40/70 mesh is recommended to ensure the effective conductivity of the fracture. When JRC = 46, the conductivity shows a trend of first increasing and then decreasing with the increase of the particle size, and 30/50 mesh is recommended.
Acknowledgement: We are grateful to the Hubei Key Laboratory of Oil and Gas Drilling and Production Engineering (Yangtze University) for the financial support of this work.
Funding Statement: The APC was funded by China National Offshore Oil Corporation (CNOOC) 14th Five-Year Plan Major Science and Technology Project: Research on Integrated Geological Engineering Technology for Fracturing and Development of Offshore Low-Permeability Reservoirs (Grant NO. KJGG2022-0701). Mao Jiang, Chengyong Peng, Jiangshu Wu and Xuesong Xing. https://www.cnooc.com.cn.
Author Contributions: The authors confirm contribution to the paper as follows: Conceptualization, Mao Jiang and Yi Liu; methodology, Mao Jiang; software, Yi Liu; validation, Jianshu Wu, Xuesong Xing and Shanyong Liu; formal analysis, Mao Jiang and Yi Liu; investigation, Chengyong Peng; resources, Yishan Lou; data curation, Chengyong Peng and Xuesong Xing; writing—original draft preparation, Chengyong Peng; writing—review and editing, Yi Liu; visualization, Jianshu Wu; supervision, Yishan Lou; project administration, Chengyong Peng and Shanyong Liu; funding acquisition, Mao Jiang. All authors reviewed the results and approved the final version of the manuscript.
Availability of Data and Materials: The data that support the findings of this study are available from the Corresponding Author, [Yi Liu], upon reasonable request.
Ethics Approval: Not applicable.
Conflicts of Interest: The authors declare no conflicts of interest to report regarding the present study.
References
1. He MQ, Li T, Zhao JL, Li SM, Yang Q. Study on proppant optimization in tight sandstone reservoirs: a case study of Shenfu block in Linxing. China Energy Environ Prot. 2024;46(2):112–7. (In Chinese). doi:10.19389/j.cnki.1003-0506.2024.02.019. [Google Scholar] [CrossRef]
2. Li H, Huang B, Zheng W, Zhao X, Tannant D. Embedment of proppants with non-uniform particle sizes into rock fracture surface. Gas Sci Eng. 2023;110(4):204900. doi:10.1016/j.jgsce.2023.204900. [Google Scholar] [CrossRef]
3. Lu C, Liu J, Huang F, Wang J, Zhou G, Wang J, et al. Numerical simulation of proppant embedment in rough surfaces based on full reverse reconstruction. J Petrol Explor Prod Technol. 2022;12(9):2599–608. doi:10.1007/s13202-022-01512-2. [Google Scholar] [CrossRef]
4. Xu J, Zhao Y, Wang X, Wang M, Yang J, Tian F, et al. Effect of proppant group arrangement on fracture conductivity in channel fracturing. Fault-Block Oil Gas Field. 2022;31(3):519–25. (In Chinese). [Google Scholar]
5. Li S, Yi X, Cai B, Wang M, Shi S, Yan X, et al. Proppant transport and settling behavior in complex fractures for slickwater hydraulic fracturing. In: Proceedings of the SPE Oklahoma City Oil and Gas Symposium; 2025 Apr 14–18; Oklahoma City, OK, USA. doi:10.2118/224371-ms. [Google Scholar] [PubMed] [CrossRef]
6. Yang Y, Fu X, Yuan H, Khaidina MP, Wei J. Influence of proppant parameters on hydraulic fracture conductivity. J Min Sci. 2023;59(5):776–89. doi:10.1134/s1062739123050101. [Google Scholar] [CrossRef]
7. Jiang M, Yuan Z, Yu JF, Zhang HL, Yan XJ, Xia JN, et al. Variation of fracture conductivity in unconsolidated sands under the multiple damage mechanisms. Offshore Oil. 2023;43(3):41–5. (In Chinese). [Google Scholar]
8. Jiang M, Li ZQ, Duan GF, Yang JJ, Shi YZ, Shi HQ. Effect of hydraulic fracture conductivity on deep shale gas production. Xinjiang Oil Gas. 2023;19(1):35–41. (In Chinese). [Google Scholar]
9. Wang J, Huang Y, Zhou F, Liang X. The influence of proppant breakage, embedding, and particle migration on fracture conductivity. J Petrol Sci Eng. 2020;193(3):107385. doi:10.1016/j.petrol.2020.107385. [Google Scholar] [CrossRef]
10. Liu Y, Wu L, Guo J, He S, Wu Y. Model for fracture conductivity considering particle size redistribution caused by proppant crushing. Geoenergy Sci Eng. 2024;240(3):213081. doi:10.1016/j.geoen.2024.213081. [Google Scholar] [CrossRef]
11. Wen Z, Tang H, Zhang L, Zhao Y, Zeng B, Zhang J, et al. Simulations of proppant transport in propagating multiple hydraulic fractures using the multi-phase particle-in-cell method. Powder Technol. 2025;464:121218. doi:10.1016/j.powtec.2025.121218. [Google Scholar] [CrossRef]
12. Yang F, Mi H, Wu J, Yang Q. Factors influencing proppant transportation and hydraulic fracture conductivity in deep coal methane reservoirs. Fluid Dyn Mater Process. 2024;20(11):2637–56. doi:10.32604/fdmp.2024.048574. [Google Scholar] [CrossRef]
13. Zeng H, Jin Y, Qu H, Lu YH. Experimental investigation and correlations for proppant distribution in narrow fractures of deep shale gas reservoirs. Petrol Sci. 2022;19(2):619–28. doi:10.1016/j.petsci.2021.10.019. [Google Scholar] [CrossRef]
14. Zhang X, Liu Y, Zhang P, Zhou H. Factors influencing the flow conductivity of propped fractures in ZhongShaximiao tight sandstone reservoir. Dachuan Chem Eng Oil Gas. 2024;53(3):92–7. (In Chinese). [Google Scholar]
15. Ji DG, Zhang S, Zou Y, Ma X, Zhang Z, Zhang X, et al. Experimental study on the fracability and hydraulic fracture propagation mechanism of different lithological rocks in tamulangou formation. In: Proceedings of the ARMA US Rock Mechanics/Geomechanics Symposium; 2021 Jun 28–Jul 1; Houston, TX, USA. [Google Scholar]
16. Wei G, Babadagli T, Huang H, Hou L, Li H. A visual experimental study: resin-coated ceramic proppants transport within rough vertical models. J Petrol Sci Eng. 2020;191(2):107142. doi:10.1016/j.petrol.2020.107142. [Google Scholar] [CrossRef]
17. Aljawad MS, Al-Abdulrabalnabi R, Khan HJ. Impact of fracture roughness on fines migration and fracture aperture growth in calcareous shale rocks during acidized core floods. In: Proceedings of the 11th Unconventional Resources Technology Conference; 2023 Jun 13–15; Denver, CO, USA. p. 3132–42. doi:10.15530/urtec-2023-3870451. [Google Scholar] [CrossRef]
18. Babadagli T, Ren X, Develi K. Effects of fractal surface roughness and lithology on single and multiphase flow in a single fracture: an experimental investigation. Int J Multiph Flow. 2015;68:40–58. doi:10.1016/j.ijmultiphaseflow.2014.10.004. [Google Scholar] [CrossRef]
19. Yin B, Zhang Y, Lou Y, Liu S. Damage mechanism of proppant and conductivity reduction post fracturing in unconventional reservoirs. Fuel. 2025;380(5):133086. doi:10.1016/j.fuel.2024.133086. [Google Scholar] [CrossRef]
20. Qu H, Xu Y, Hong J, Chen X, Li C, Liu X. Experimental and visual analysis of proppant-slickwater flow in a large-scaled rough fracture. SPE J. 2023;28(2):477–95. doi:10.2118/212283-pa. [Google Scholar] [PubMed] [CrossRef]
21. Aliu AO, Xie L, He S. A model to describe hydraulic fracture conductivity decline curve in 3-stages-focus on Longmaxi Formation. J Nat Gas Sci Eng. 2022;100(5–6):104458. doi:10.1016/j.jngse.2022.104458. [Google Scholar] [CrossRef]
22. Liu J. Reservoir characteristics analysis and favorable area prediction of Zhuhai Formation, Wenchang A oilfield, South China Sea. Front Earth Sci. 2024;12:1395146. doi:10.3389/feart.2024.1395146. [Google Scholar] [CrossRef]
23. Sun P, Jiang S, Zhang L, Jia L, Rao H, Fang H, et al. Impacts of sedimentation and diagenesis on deeply buried reservoir quality of a rift basin: a case study of Wenchang formation in the Lufeng depression, Pearl River mouth basin. China Geofluids. 2022;2022(1):8625005. doi:10.1155/2022/8625005. [Google Scholar] [CrossRef]
24. Barton N. Review of a new shear-strength criterion for rock joints. Eng Geol. 1973;7(4):287–332. doi:10.1016/0013-7952(73)90013-6. [Google Scholar] [CrossRef]
25. Xie H, Pariseau WG. Fractal estimation of roughness coefficient of rock joint (JRC). Sci Sin. 1994;5:524–30. (In Chinese). [Google Scholar]
26. Chen Z, Xie X, Wu G, Hou Y, Guo B, Xu Y, et al. Numerical simulation of proppant transport in transverse fractures of horizontal wells. Processes. 2024;12(5):909. doi:10.3390/pr12050909. [Google Scholar] [CrossRef]
27. Guo TK, Luo ZL, Zhou J, Gong YZ, Dai CL, Tang J, et al. Numerical simulation on proppant migration and placement within the rough and complex fractures. Petrol Sci. 2022;19(5):2268–83. doi:10.1016/j.petsci.2022.04.010. [Google Scholar] [CrossRef]
28. Tang P, Li H, Zeng J. Numerical investigation of transport behaviors of nonspherical proppants in hydraulic fracturing using CFD-DEM. Part Sci Technol. 2022;40(2):207–18. doi:10.1080/02726351.2021.1930301. [Google Scholar] [CrossRef]
29. Akanni OO, Nasr-El-Din HA, Gusain D. A computational navier-stokes fluid-dynamics-simulation study of wormhole propagation in carbonate-matrix acidizing and analysis of factors influencing the dissolution process. SPE J. 2017;22(6):2049–66. doi:10.2118/187962-pa. [Google Scholar] [PubMed] [CrossRef]
30. Wang X, Yao J, Gong L, Sun H, Yang Y, Zhang L, et al. Numerical simulations of proppant deposition and transport characteristics in hydraulic fractures and fracture networks. J Petrol Sci Eng. 2019;183(5):106401. doi:10.1016/j.petrol.2019.106401. [Google Scholar] [CrossRef]
31. Safari A, Dehghannya J, Ghanbarzadeh B. Comparison of navier-stokes and K-Epsilon equations in modelling coupled transfer phenomena during frying of potato slices using a continuous solid-fluid phase. Potato Res. 2025:1–30. doi:10.1007/s11540-025-09881-x. [Google Scholar] [CrossRef]
32. Wang T, Zhang F, Furtney J, Damjanac B. A review of methods, applications and limitations for incorporating fluid flow in the discrete element method. J Rock Mech Geotech Eng. 2022;14(3):1005–24. doi:10.1016/j.jrmge.2021.10.015. [Google Scholar] [CrossRef]
33. Chen Q, Huang Z, Huang H, Chen Q, Ling X, Xin F, et al. An experimental study on the impact of the particle size and proportion of composite proppant on the conductivity of propped fractures in coalbed methane reservoirs following pulverized coal fines infiltration. Processes. 2023;11(7):2205. doi:10.3390/pr11072205. [Google Scholar] [CrossRef]
34. Li H, Huang B. A new permeability model of fracture containing proppants. J Nat Gas Sci Eng. 2022;104(1):104661. doi:10.1016/j.jngse.2022.104661. [Google Scholar] [CrossRef]
35. Gao Y, Lv Y, Wang M, Li K. New mathematical models for calculating the proppant embedment and fracture conductivity. In: Proceedings of the PE Annual Technical Conference and Exhibition; 2012 Oct 8–10; San Antonio, TX, USA. doi:10.2118/155954-ms. [Google Scholar] [PubMed] [CrossRef]
Cite This Article
 Copyright © 2025 The Author(s). Published by Tech Science Press.
This work is licensed under a Creative Commons Attribution 4.0 International License , which permits unrestricted use, distribution, and reproduction in any medium, provided the original work is properly cited.
 Downloads
 Citation Tools