
 Submit a Paper
 Propose a Special lssue
 Open Access
ARTICLE

Performance and Degradation Assessment of PV Modules Exposed to Short-Term Outdoor Conditions in Two Distinct US Climatic Zones
Electronics and Optics of Semiconductor Nanostructures and Sustainable Energy Team, Laboratory of Instrumentation of Measure and Control, Department of Physics, Faculty of Sciences, Chouaïb Doukkali University, P.O. Box 20, El Jadida, 24000, Morocco
* Corresponding Author: Assaid El Mahdi. Email:
(This article belongs to the Special Issue: Modelling, Optimisation and Forecasting of Photovoltaic and Photovoltaic thermal System Energy Production)
Energy Engineering 2025, 122(10), 4195-4223. https://doi.org/10.32604/ee.2025.067425
Received 03 May 2025; Accepted 07 July 2025; Issue published 30 September 2025
 View Full Text
 Download PDF
Abstract
Current research focuses on the performance degradation of photovoltaic (PV) modules, examining both crystalline silicon (p-Si and m-Si) and thin-film technologies, including a-Si/c-Si, HIT, CdTe and CIGS. These modules were operated outdoors in two distinct climatic zones in the United States (US) over a period of three years. The degradation analysis includes the study of various quantities, such as the decrease in peak power, the reduction in current and voltage, and the variation in the fill factor. The annual degradation rate (DR) of PV modules is obtained by a linear fit of the effective maximum power evolution over time. The results indicate that m-Si and p-Si modules experienced a slight decrease in performance, with DRs of −0.83% and −1.07%, respectively. Subsequently, the HIT module exhibited a DR of −1.75%, while CdTe and CIGS modules demonstrated DRs of −2.03% and −2.45%, respectively. The a-Si/c-Si module showed the highest DR at −3.26%. Using the Single Diode Model (SDM), we monitored the temporal evolution of physical parameters as well as changes in the shape of the I-V and P-V curves over time. We found that the key points of the I-V curve degrade over time, as do the I-V and P-V characteristics between two days approximately 30 months apart.Keywords
The exploitation and use of fossil fuels have a significant environmental impact due to the production of carbon dioxide (CO2), a major greenhouse gas contributing to climate change. To achieve a stable level of atmospheric CO2 stability, it is imperative to transition to a decarbonized world as soon as possible [1]. Relying on renewable energy represents the primary alternative to facilitate this transition.
Solar energy has become a promising source in the field of renewable energy technologies worldwide, particularly in hot and sunny regions of the Middle East (ME) and Africa, where solar irradiation is abundant [2]. As a result, these regions are increasingly adopting PV module power plants at both residential and commercial scales. For example, Dubai (ME) has launched a clean energy strategy aiming to produce 75% of its energy needs from clean energy sources by 2050 [2]. Similarly, Morocco (Africa) has initiated an energy strategy aiming to cover 52% of its energy needs by 2030 [1]. PV systems exhibit the fastest growth rate among competing renewable energy sources and have now reached grid parity in some regions [3]. With the continuation of current investments, PV energy is expected to play a key economic role. Economic incentives are driving research into the reliability and long-term performance of PV modules.
The lifespan of solar panels and their energy production over time are influenced by several factors, including climate and module type [3–7]. The gradual decrease in solar panel performance over time is known as degradation. Numerous studies have examined the causes of PV module degradation and have identified several contributing factors, including discoloration of Ethylene-Vinyl Acetate (EVA), accumulation of dust and pollutants, delamination of modules, cell cracks, and moisture that can condense inside the module, thereby increasing corrosion rates. This corrosion damages the metal connections of PV cells, reducing their performance, increasing leakage currents, and weakening the bond between the cells and the metal frame [1,5,8–10]. Degradation can be assessed by determining the DR using several methods, including linear least squares fitting, the temporal evolution of effective maximum power (power at STC), the temporal evolution of performance ratio (PR).
Numerous studies have employed the method of temporal evolution of effective maximum power [5,11–15]. This approach involves converting the maximum power under real conditions into effective maximum power, followed by linear adjustment to determine the slope and intercept, thus allowing the calculation of the DR. This represents the percentage decrease in effective maximum power over a year. However, due to limitations of the maximum power model for low irradiance levels, authors focus solely on experimental data corresponding to high irradiances
This document provides an analysis of DR for various PV modules, including m-Si, p-Si, HIT, CIGS, CdTe, and a-Si/
Given that the PV metrics can be represented by a SDM electronic circuit characterized by five physical parameters: photocurrent (
The remainder of this article is organized as follows: following an introduction, Section 2 outlines the methodology and explicit models. Section 3 presents the various results obtained, beginning with the temporal evolution of effective maximum power, followed by key points of the I-V characteristic and the fill factor, as well as physical parameters. Subsequently, the comparison between the I-V characteristics generated under real operating conditions and in STC and those obtained experimentally under real operating conditions and translated into STC. Finally, the generated and experimental I-V and P-V characteristics under STC are discussed. The conclusion is presented in Section 4.
2.1 Specifications of PV Modules and Experimental Data
In this study, short-term meteorological and PV data collected by NREL researchers on PV modules representing various flat plate manufacturing technologies are employed [21,22]. Data were collected over a 3-year period at two different climatic sites in the US (Cocoa and Eugene). PV module technologies tested by NREL include monocrystalline Silicon (m-Si), polycrystalline Silicon (p-Si), Cadmium Telluride (CdTe), Copper Indium Gallium Selenium (CIGS), heterojunction with intrinsic thin-layer (HIT) and amorphous Silicon/microcrystalline silicon (a-Si/
NREL provided the PV modules measurements equipment at both sites, the first in Cocoa, and the second in Eugene. The duration of the outdoor exhibition is segmented into two sub-periods: the initial period started on 21 January 2011, and ended on 04 March 2012, in Cocoa, while the subsequent sub-period started on 20 December 2012, and ended on 20 January 2014, in Eugene.
Cocoa, situated in Brevard County, Florida, is a port city that fronts the North Atlantic Ocean, the measurement site’s geographic coordinates are as follows: longitude 80.46°, latitude 28.39°, and altitude 12 m, Cocoa experiences a humid subtropical climate. Eugene is a city located in the north western region of the US, specifically within Lane County, Oregon. Positioned with a view towards the North Pacific Ocean, Eugene displays a west coast marine climate. The measurement site is defined by geographic coordinates of longitude 123.07°, latitude 44.05°, and an altitude of 145 m.
The measurement platform includes weather and electrical sensors, connected to a central data recording system. Meteorological data include ambient temperature, atmospheric pressure, relative humidity, precipitation, solar irradiances such as direct normal, diffuse horizontal, global horizontal and global for a fixed inclined plane (plane-of-array irradiance). PV data include module temperature, key points of I-V curve, maximum power, fill factor and I-V curves. All quantities were measured with a fixed time step equal to five minutes [21,22].
The main parameters of six different types of PV modules used in this study at STC:

2.2 PV Performance Metrics and Degradation Analysis
When choosing solar panels, it is crucial to take into account the efficiency of solar cells, which measures their ability to convert sunlight into electricity. This electrical efficiency is directly affected by various climatic factors such as solar irradiance, wind speed, pollution, and geographical location. A careful evaluation of the efficiency of PV modules is essential to ensure the sustainable operation and growth of solar power plants [23]. In addition, a thorough analysis of the DR of PV modules is essential to correctly size the components and determine the operational costs of the installation. To carry out an evaluation of degradation, the effective performance of the PV system is taken into account. Weather variations affect the voltage, current and power of the PV device. Due to the effect of temperature and solar irradiance, the choice of these weather conditions is therefore necessary to adjust the PV measurements [23].
The analysis of DR requires the temporal monitoring of PV modules under real-world conditions. NREL provided us with experimental data measured outdoors in two different climates. Among this data, we find PV metrics such as
• Solar irradiance values ranges from 999.5 W/m2 to 1000.5 W/m2
• For the module temperature (
2.2.2 Translation of Maximum Power to STC
The DR of PV modules can be estimated by examining the evolution of the effective maximum power values (
where
2.2.3 Translation of I-V Curve Key Points to STC
In the same way as the effective maximum power, we can translate the four key points (
– The effective short-circuit current
– The effective open-circuit voltage
– The effective maximum power current
– The effective maximum power voltage
where
2.2.4 Fill Factor Expression at STC
The fill factor is a measure of the squareness of the I-V characteristic curve and indicates the quality of the solar cell. The fill factor (
2.2.5 Annual Degradation Rate (DR)
In order to evaluate the DR, a linear adjustment method is applied to the effective values of the PV measurements (
where
2.2.6 PV Module Modelling: Equivalent Circuit and Fundamental Equations of Single Diode Model
The PV generator is modeled by a single diode electronic circuit, frequently used and characterized by five physical parameters (see Fig. 1). The five physical parameters include the photocurrent (
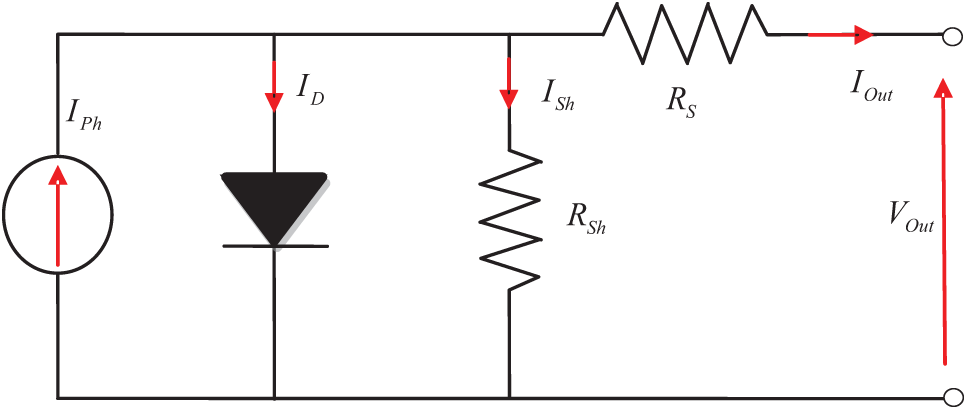
Figure 1: Single-diode equivalent circuit describing PV module [30]
Utilize Kirchhoff’s current law to deduce the equation representing the cell/module output current in the following manner [28].
By substituting Eqs. (10) and (11) into Eq. (9), the transcendental equation establishes a relationship between the output current, the output voltage, and the five physical parameters of a PV module which
The characteristic equations at key points of the current-voltage curve (the open-circuit voltage point
At the point of maximum power, the slope of the power-voltage curve is equal to zero while the slope of the current-voltage curve is equal to the opposite of the optimal conductance
2.2.7 Translation I-V and P-V Curves to STC
The PV metric data provided under real conditions are accompanied by the I-V characteristic, also provided in real-time and under real operating conditions. Since we have selected only I-V characteristics corresponding to condition
After translating the two key points of the I-V curve (
The output power at STC can be calculated using following equation:
2.2.8 Numerical Method to Extract Physical Parameters
In this subsection, our objective is to evaluate the changes in the five physical parameters of the model throughout the period of operation of the PV modules. The parameter extraction method used in this investigation is in accordance with the approach used by [35]. To obtain the remaining five model physical parameters (
– The effective photocurrent at STC is given by the following equation:
where
– The effective saturation current deduced from Eq. (13):
In determining the values of the three remaining physical parameters (
The Eqs. (23)–(25) found the system of nonlinear equations which allows the values of
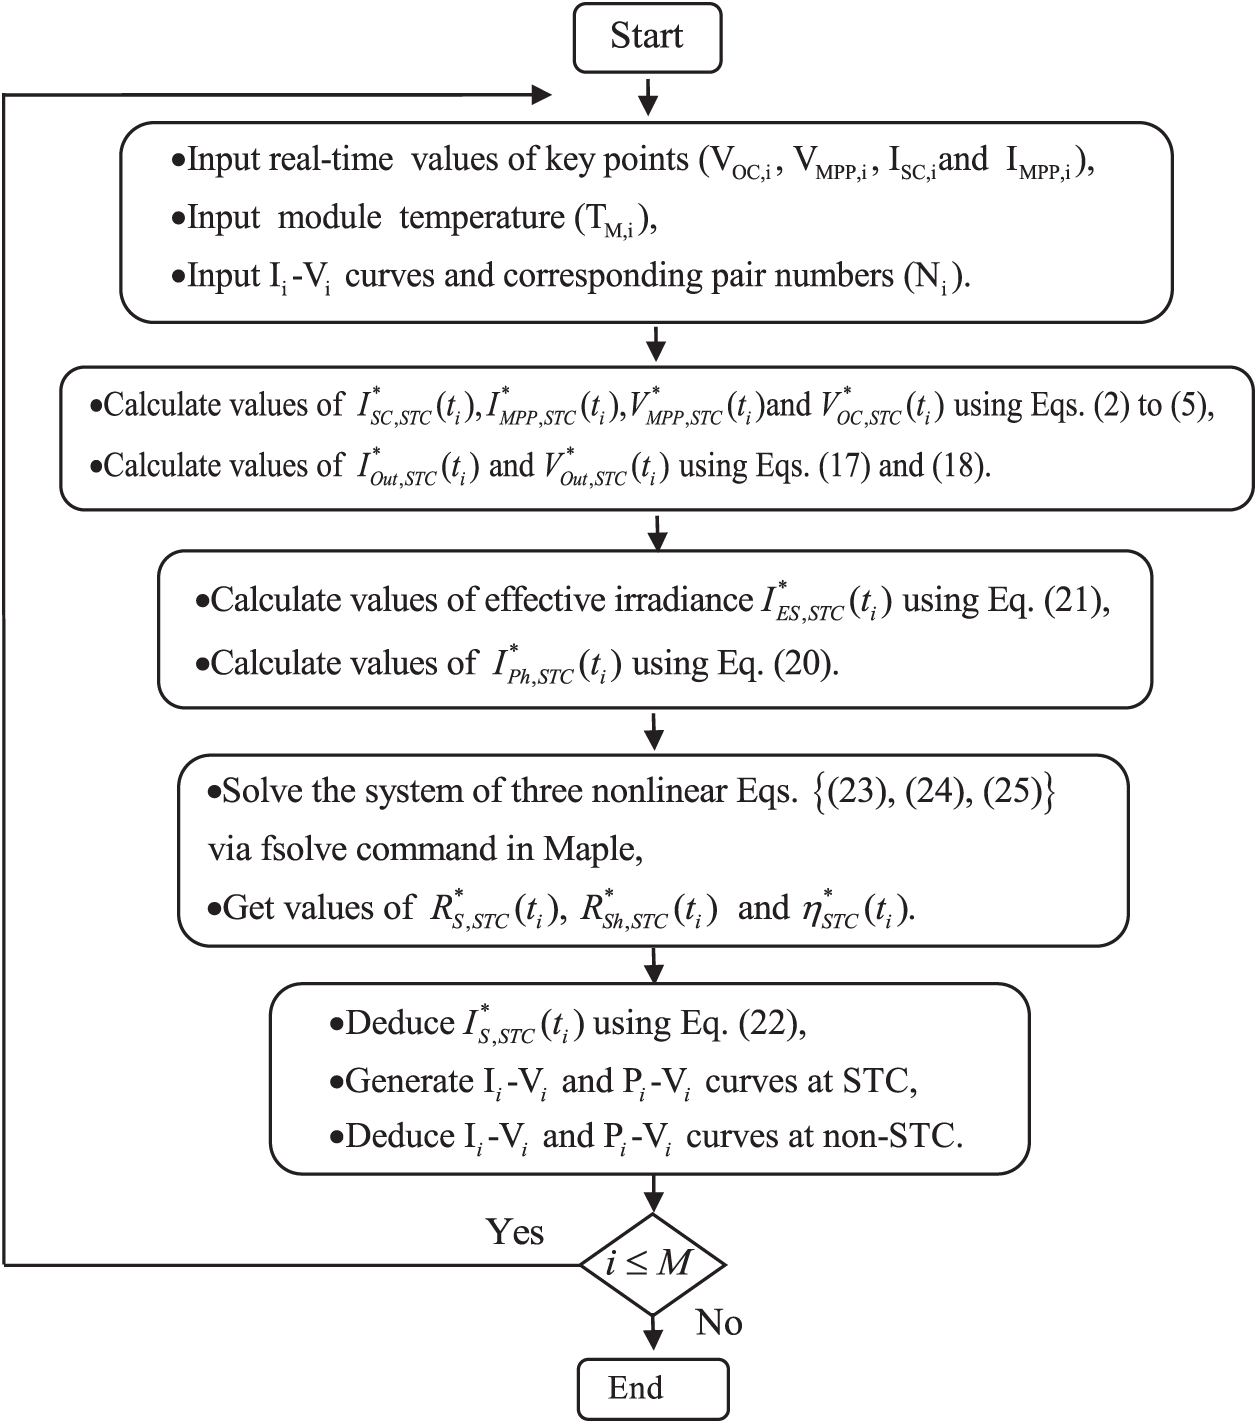
Figure 2: Flowchart for calculating model parameters values of a PV module operating outdoors throughout the operational period
where
To assess the reliability of the physical parameters and PV metrics found to generate features, namely I(V) and P(V) curves as close as possible to experimental curves under real conditions and translated into STC, we rely on a widely used statistical indicator to calculate the discrepancies between measured and generated values: the normalized root mean square error (NRMSE) [31,33].
3.1 Analysis of PV Module Degradation
In this subsection, we depicted the progression of PV metrics (
Fig. 3 illustrates the temporal evolution of
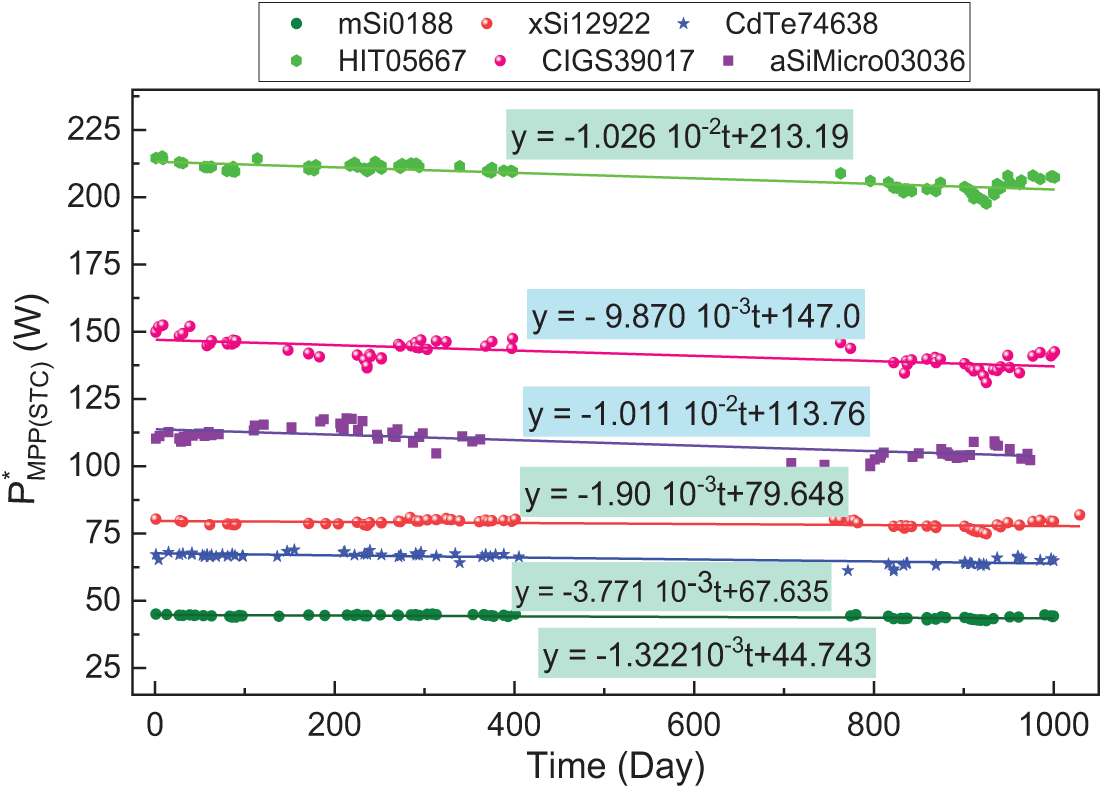
Figure 3: Temporal evolution of effective maximum power for various PV module technologies


3.1.2 Four Key Points of I-V Curve
The effective maximum power

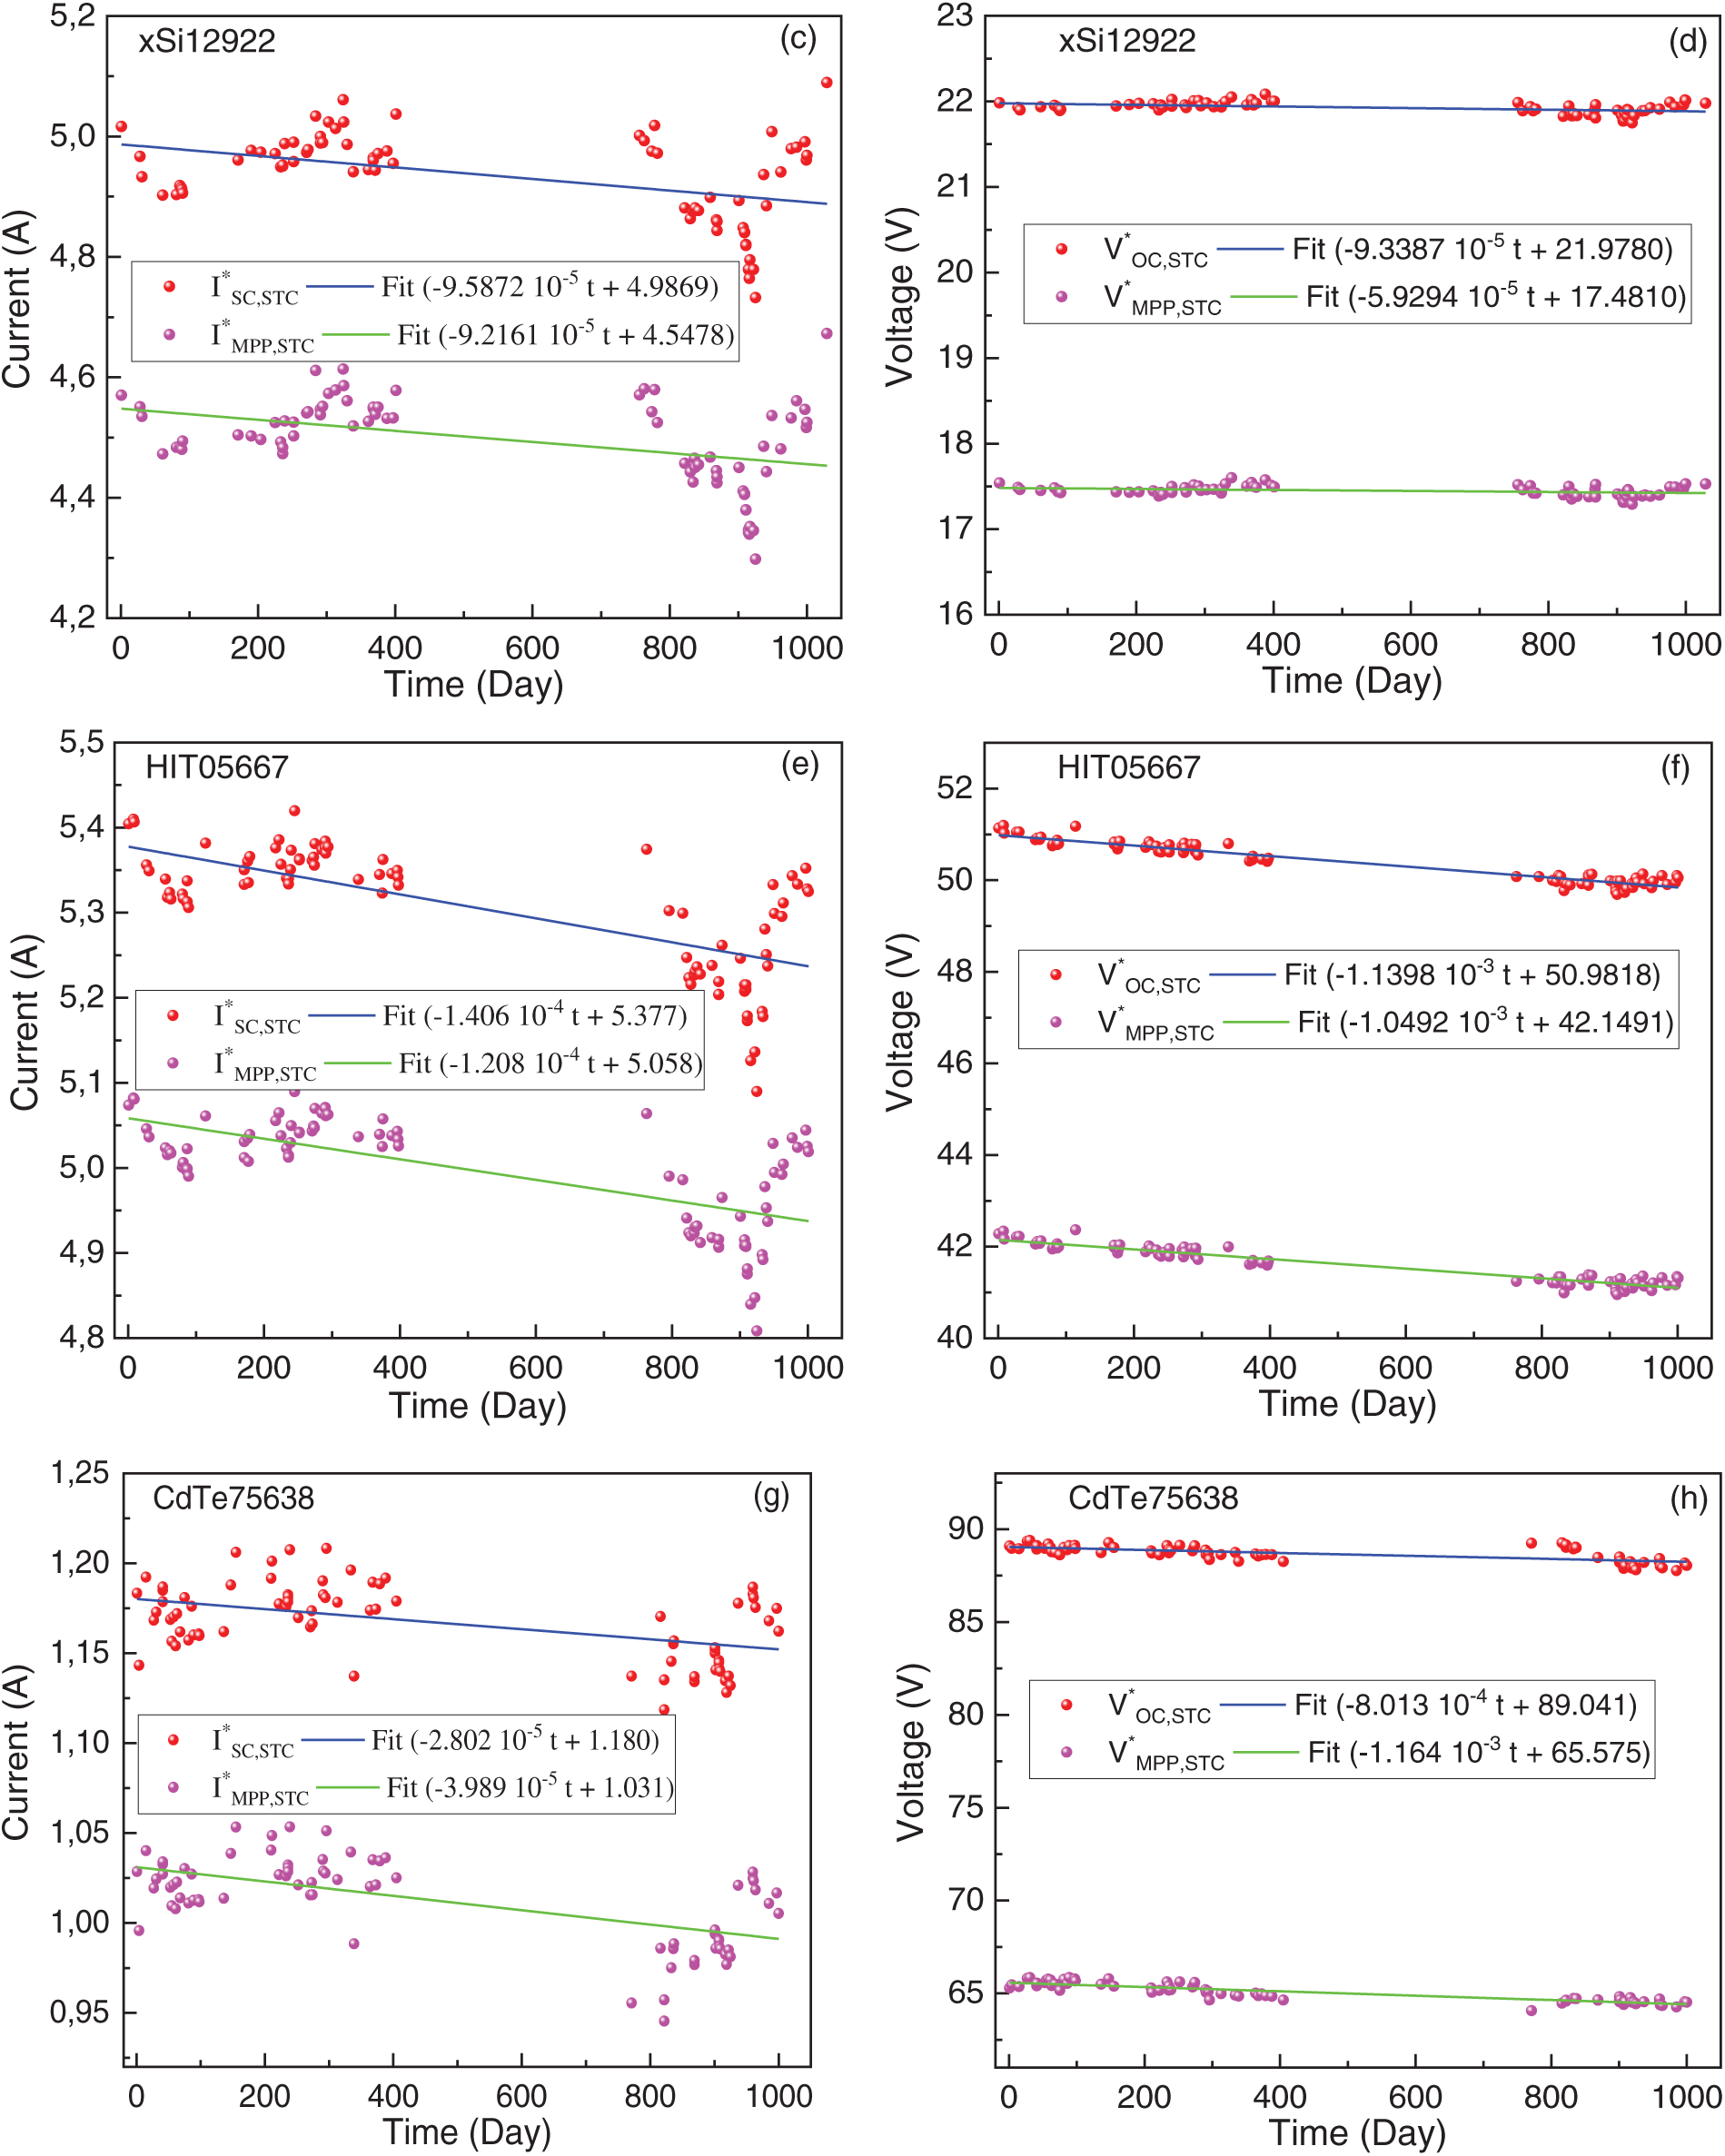

Figure 4: Evolution of the four key points of I-V curve at STC for various PV module technologies. (a, c, e, g, i, k) show the evolution of current vs. time, (b, d, f, h, j, l) show the evolution of voltage vs. time

For the crystalline silicon modules (m-Si and p-Si), the currents
There are several factors that influence the decrease in current in PV modules, depending on the type of module and technology used. Among these factors are dirt, discoloration of the EVA, or the reduction in the transmission of shortwave photons [46]. The aging of electronic components in the PV module, such as connections and cables, is also a determining factor [12,47,48]. Since the PV modules were cleaned daily during their exposure to the outdoors [22], dirt does not contribute to the degradation of the modules. However, we have no information on the visual defects presented by the various PV modules, such as discoloration of the encapsulant, which could significantly contribute to the degradation of module current [12]. Most often, it is the discoloration of the encapsulant that reduces the light transmitted to the PV cells and degrades the current, leading to maximum power degradation. Similarly, a slight degradation of the module voltage was also attributed to the relatively exposure (3 years) of the modules to outdoor conditions [12].
Environmental conditions, such as the thermal cycle, also influence the material quality due to expansion during the day under heat and contraction at night. These variations lead to the appearance of cracks and fractures in the material over time, resulting in its degradation. Consequently, this deterioration contributes to the decrease in voltage and current, impacting the overall power of PV modules.
The effective fill factor (
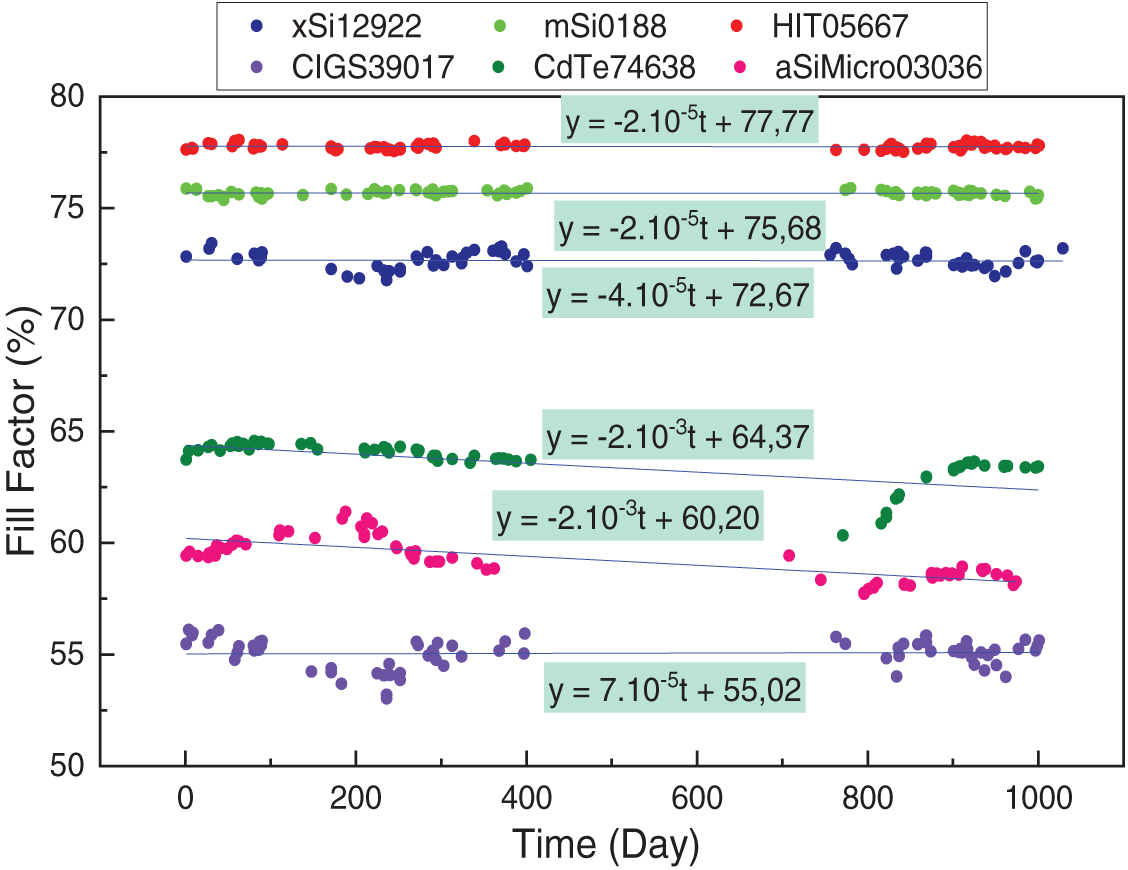
Figure 5: Evolution of effective fill factor values for different PV module technologies

Figure 6: Evolution of effective values of series resistance
3.2 Effective Values of SDM Model Parameters
To investigate the causes of degradation, changes in the series resistance (
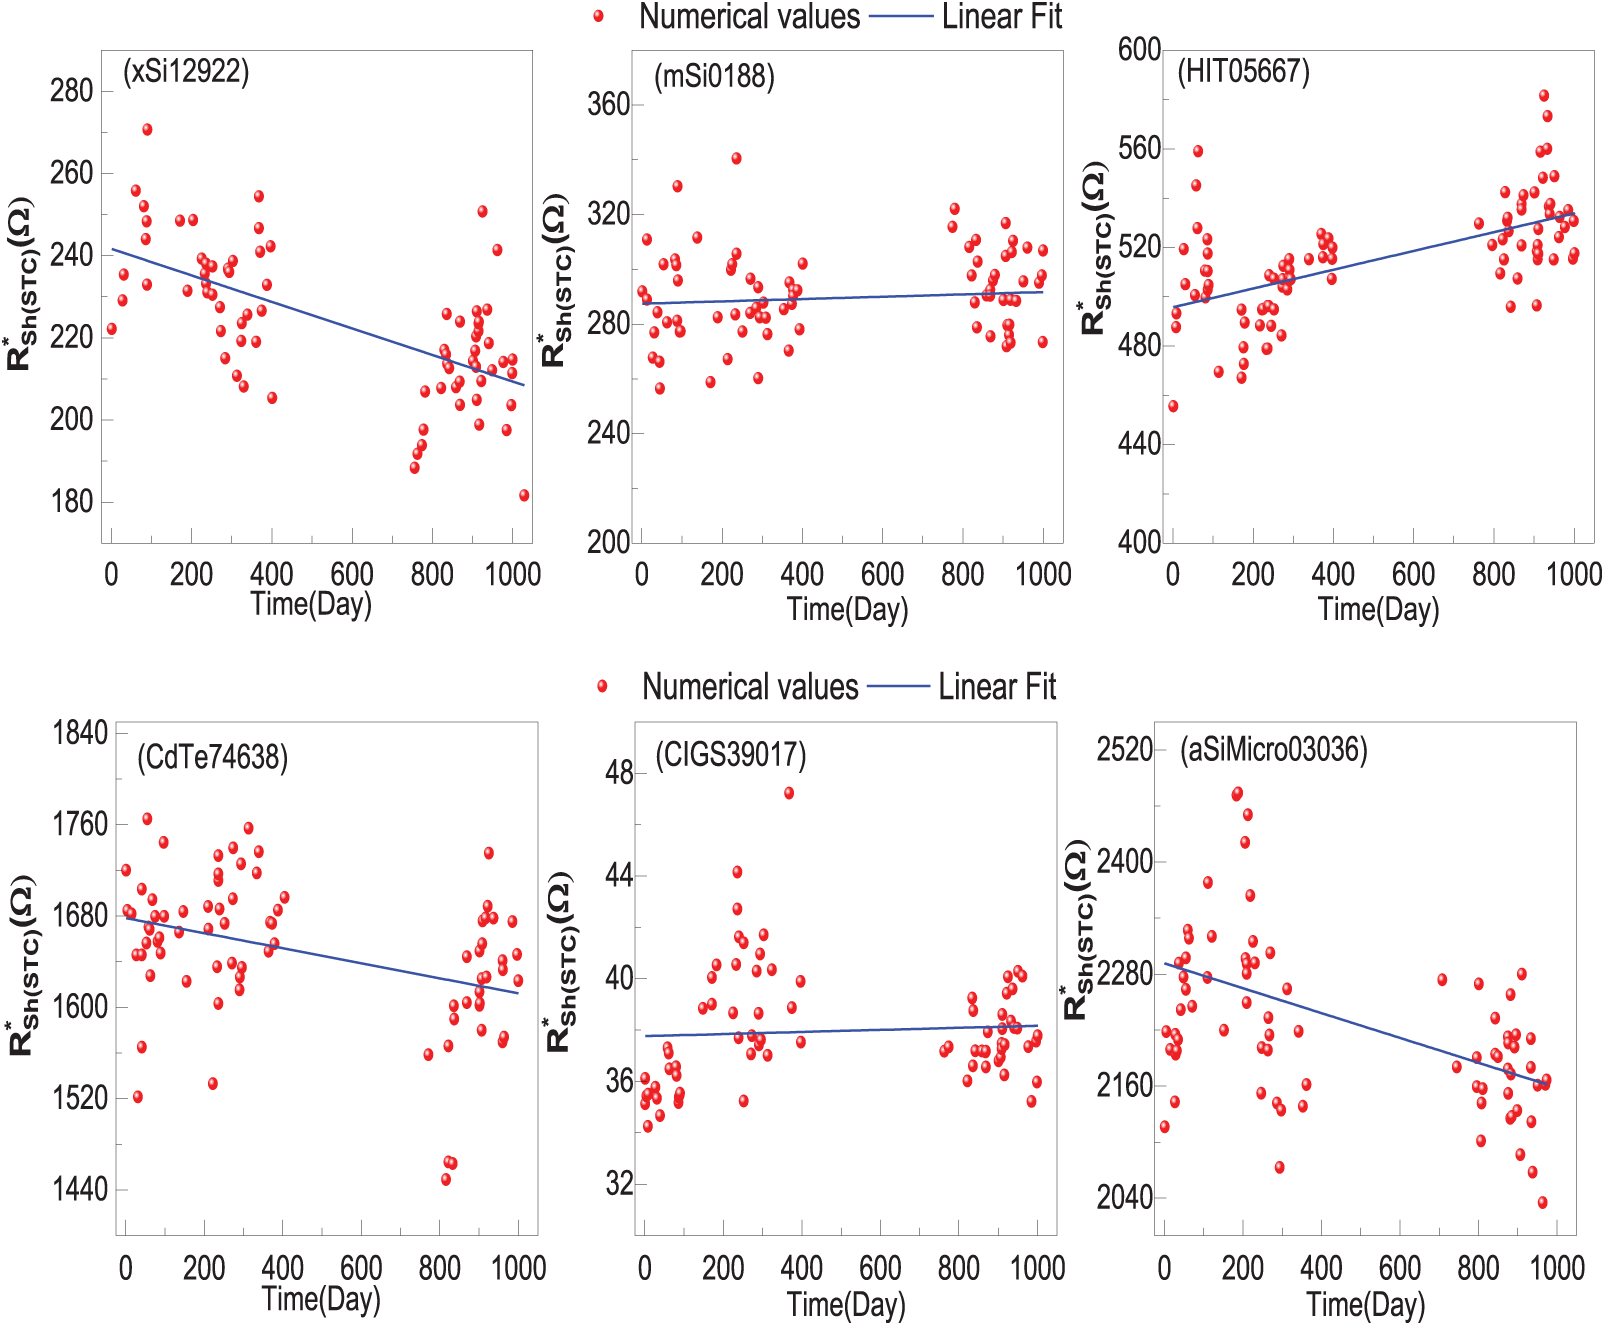
Figure 7: Evolution of effective values of shunt resistance
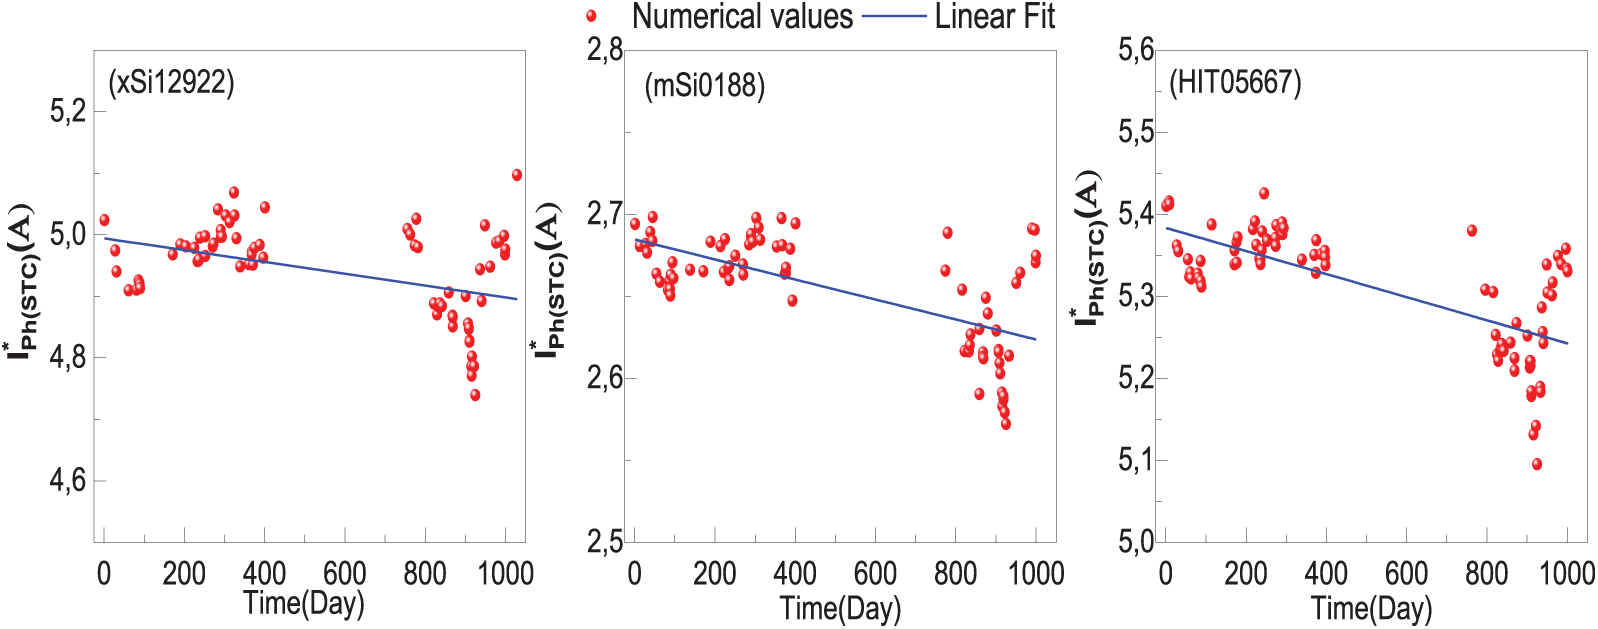
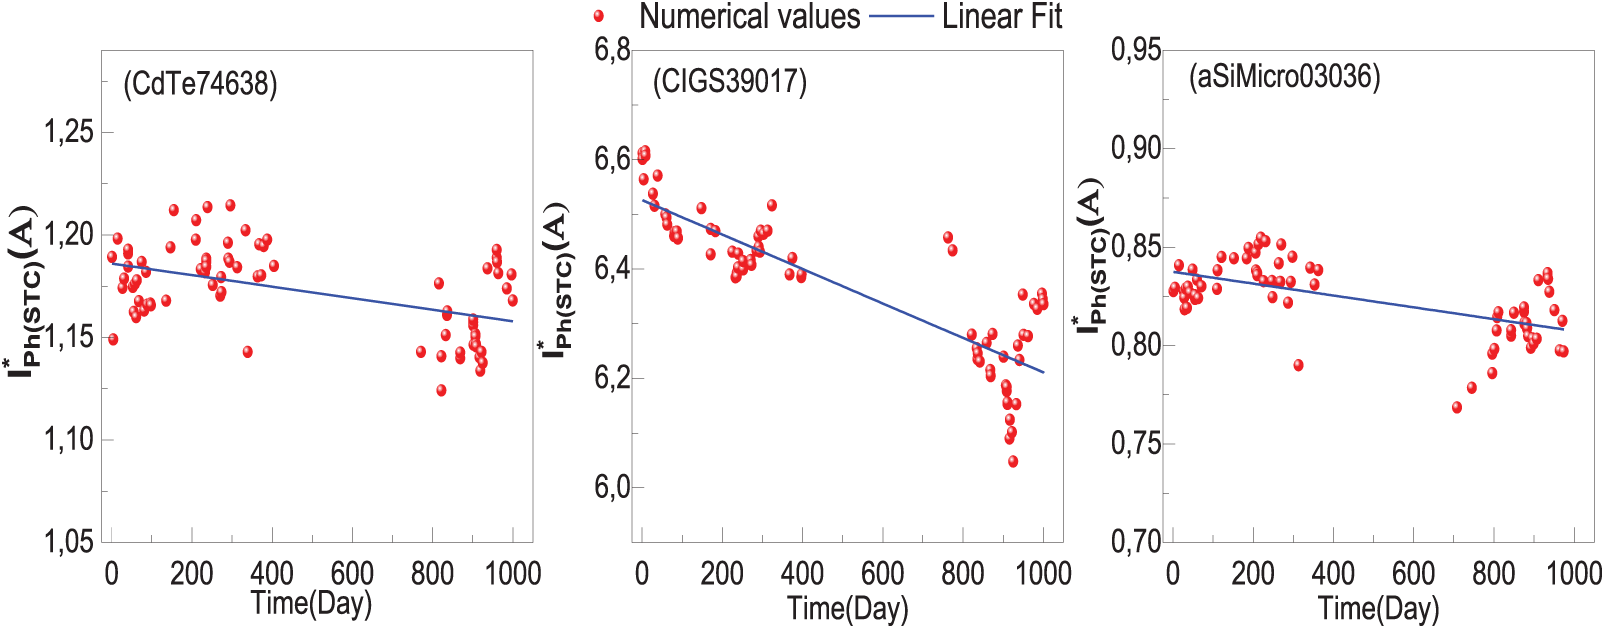
Figure 8: Evolution of effective values of photocurrent
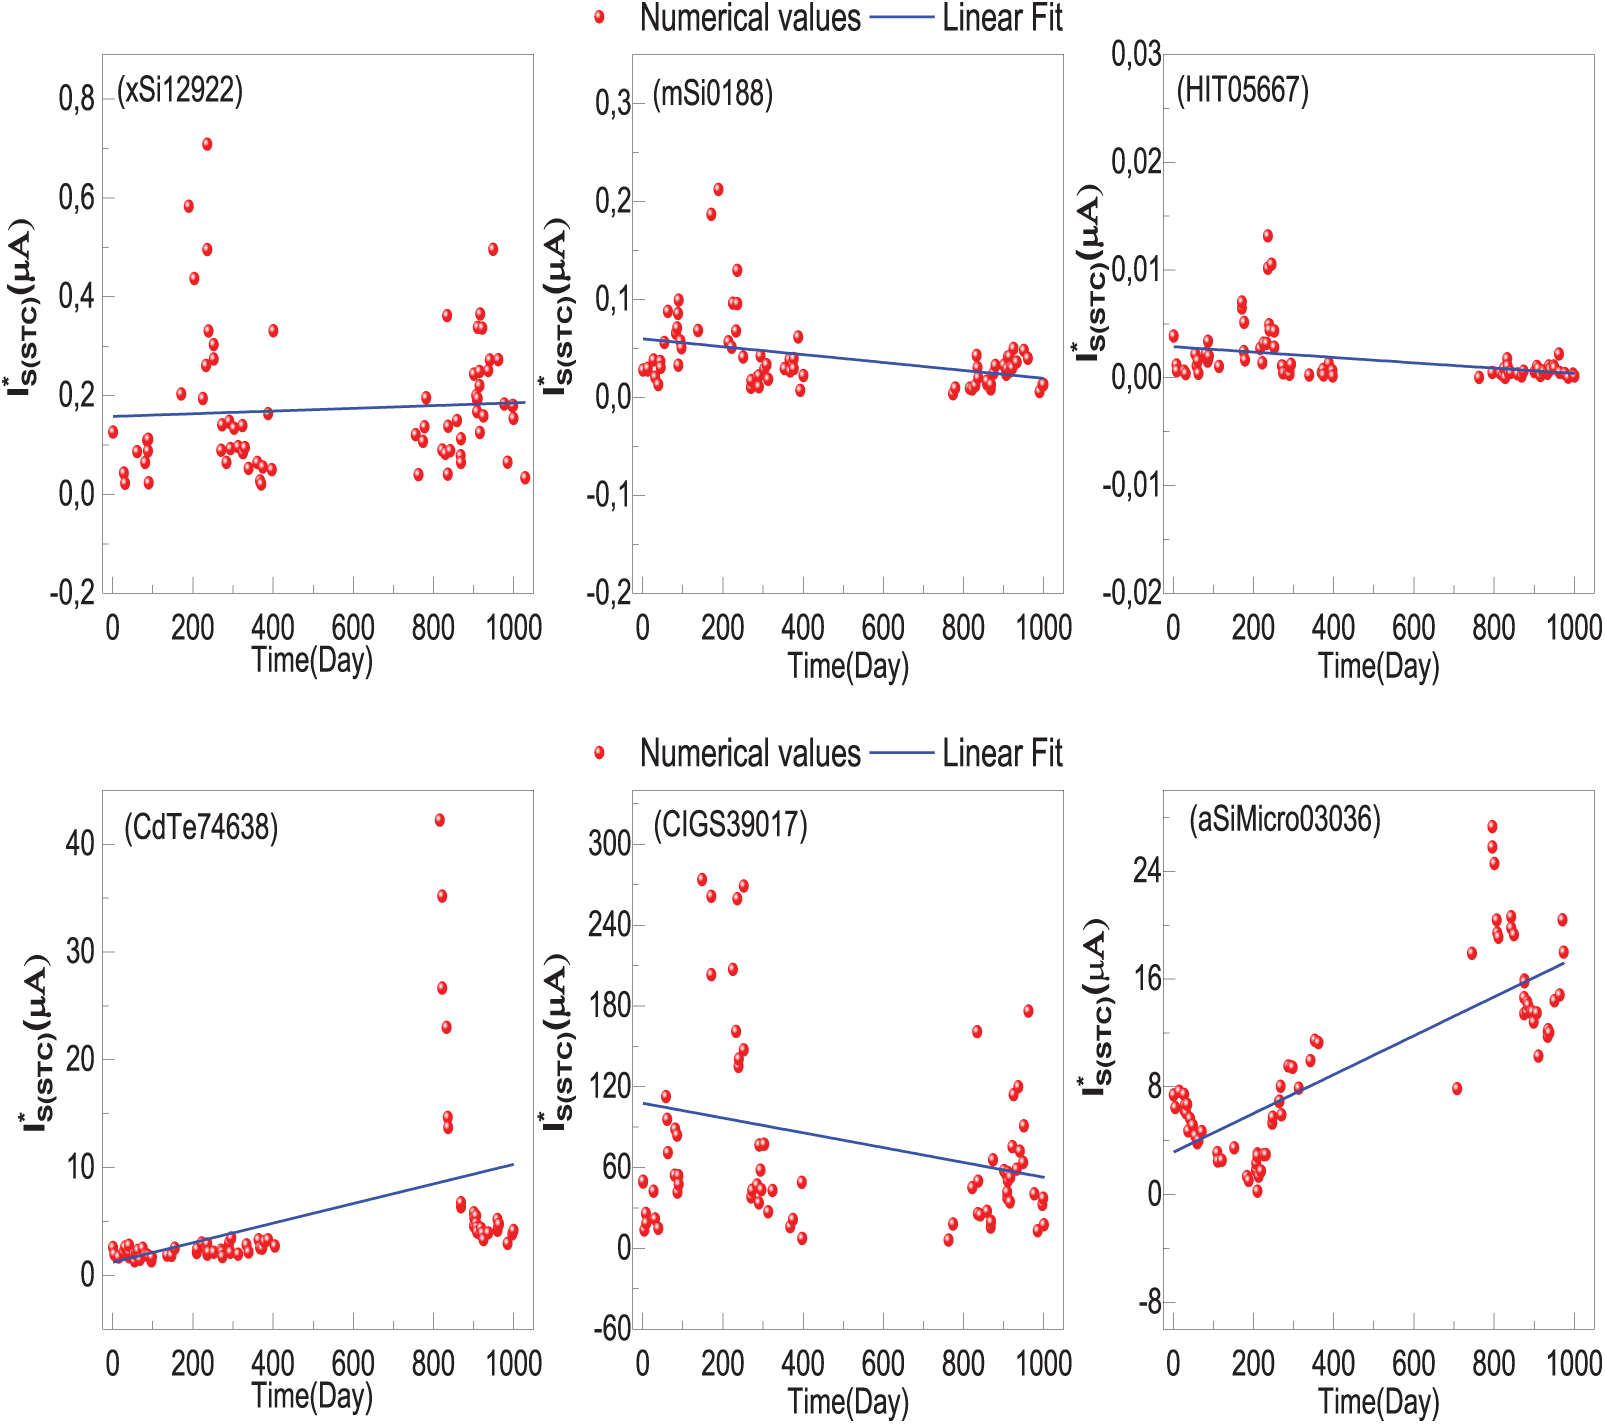
Figure 9: Evolution of effective values of saturation current
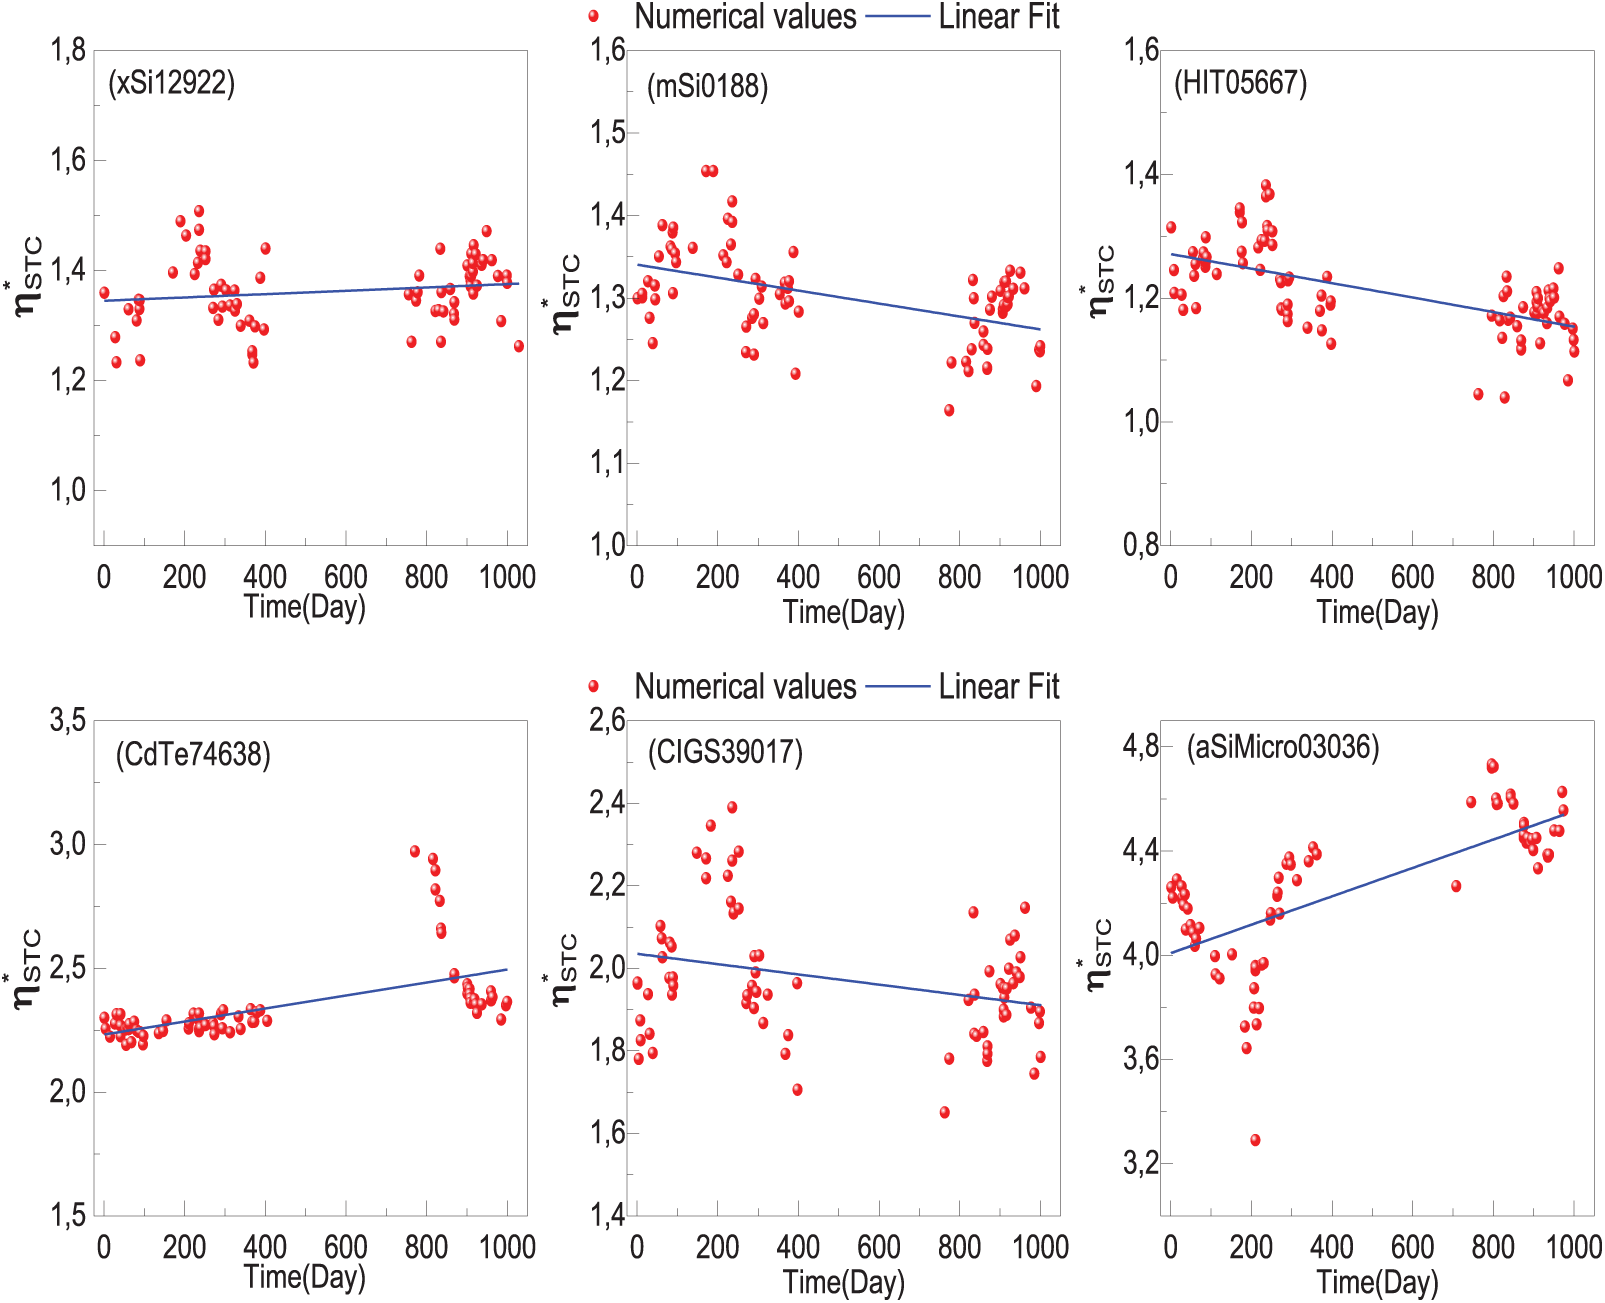
Figure 10: Evolution of effective values of ideality factor
The monotony of physical parameters over time, except for the photocurrent
3.3 Adjustment of I-V Characteristics to STC
The aim of this paragraph is to demonstrate that the previously determined physical parameters provide an I-V characteristic that is consistent with the experimental characteristic, whether under real conditions or at STC.
STC translation equations used in this study allow for the translation of all experimental data from the instantaneous I-V curve under real conditions (red curve, points) to STC (blue curve, points). Additionally, the characteristics generated under STC (orange curve, line) and under real conditions (green curve, line), based on previously determined physical parameters, are also presented and compared to the translated and real experimental characteristics. Fig. 11 summarizes all experimental and generated I-V curves under real and STC conditions for various PV modules. The subfigures (a)–(f) are similar and differ only by the type of technology, which is already indicated on the figure itself. Therefore, no additional explanation is needed in the caption.
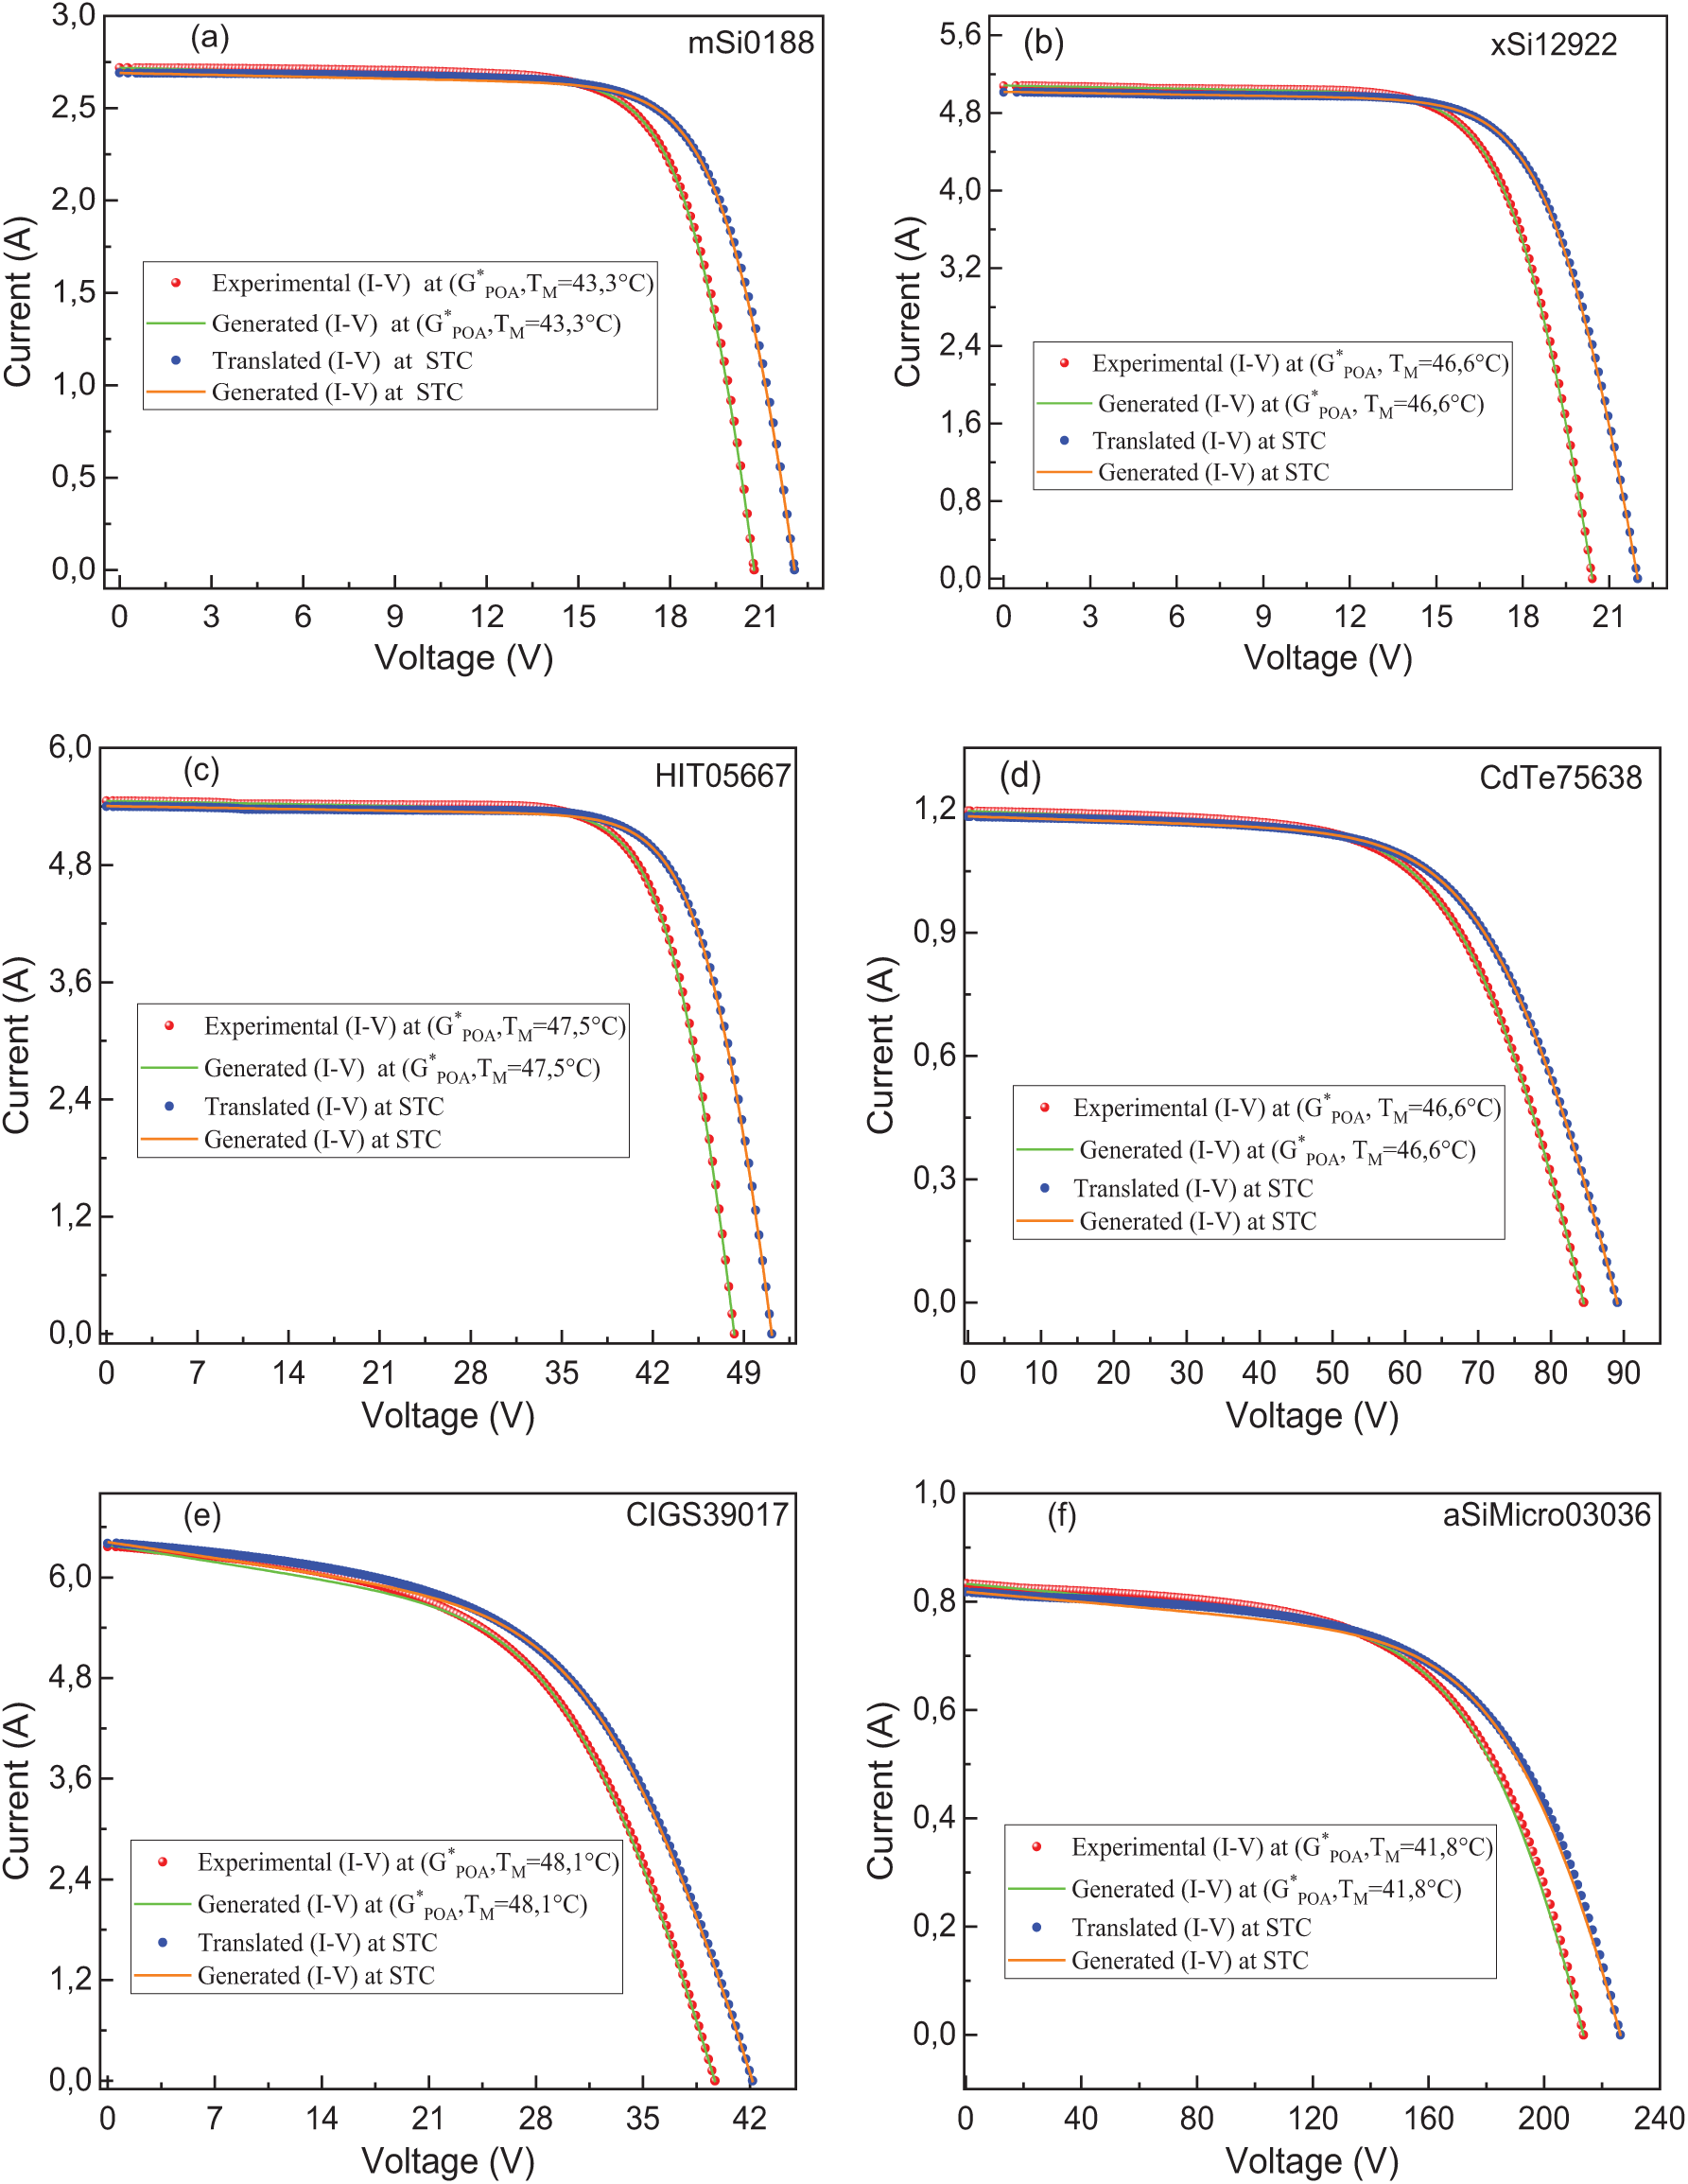
Figure 11: Experimental and generated I-V curves obtained under non-standard test conditions
Based on the obtained results, it is evident that the experimental and generated characteristics agree well. However, to assess the accuracy between the different curves, a commonly used measure is the NRMSE. For this purpose, the NRMSE is calculated between the experimental and generated I-V curves. The NRMSE values obtained are depicted over time (Fig. 12). It is observed that all NRMSE are below 2% between the experimental and generated curves, thus justifying the reliability of the translation equations used in this study and the previously determined physical parameters. The red circles represent the NRMSE between the points of the experimental I-V curve and the one generated under real conditions (the red points and the green curve), while the blue points represent the NRMSE between the points of the I-V curve translated into STC and the one generated under STC (the blue points and the orange curve).
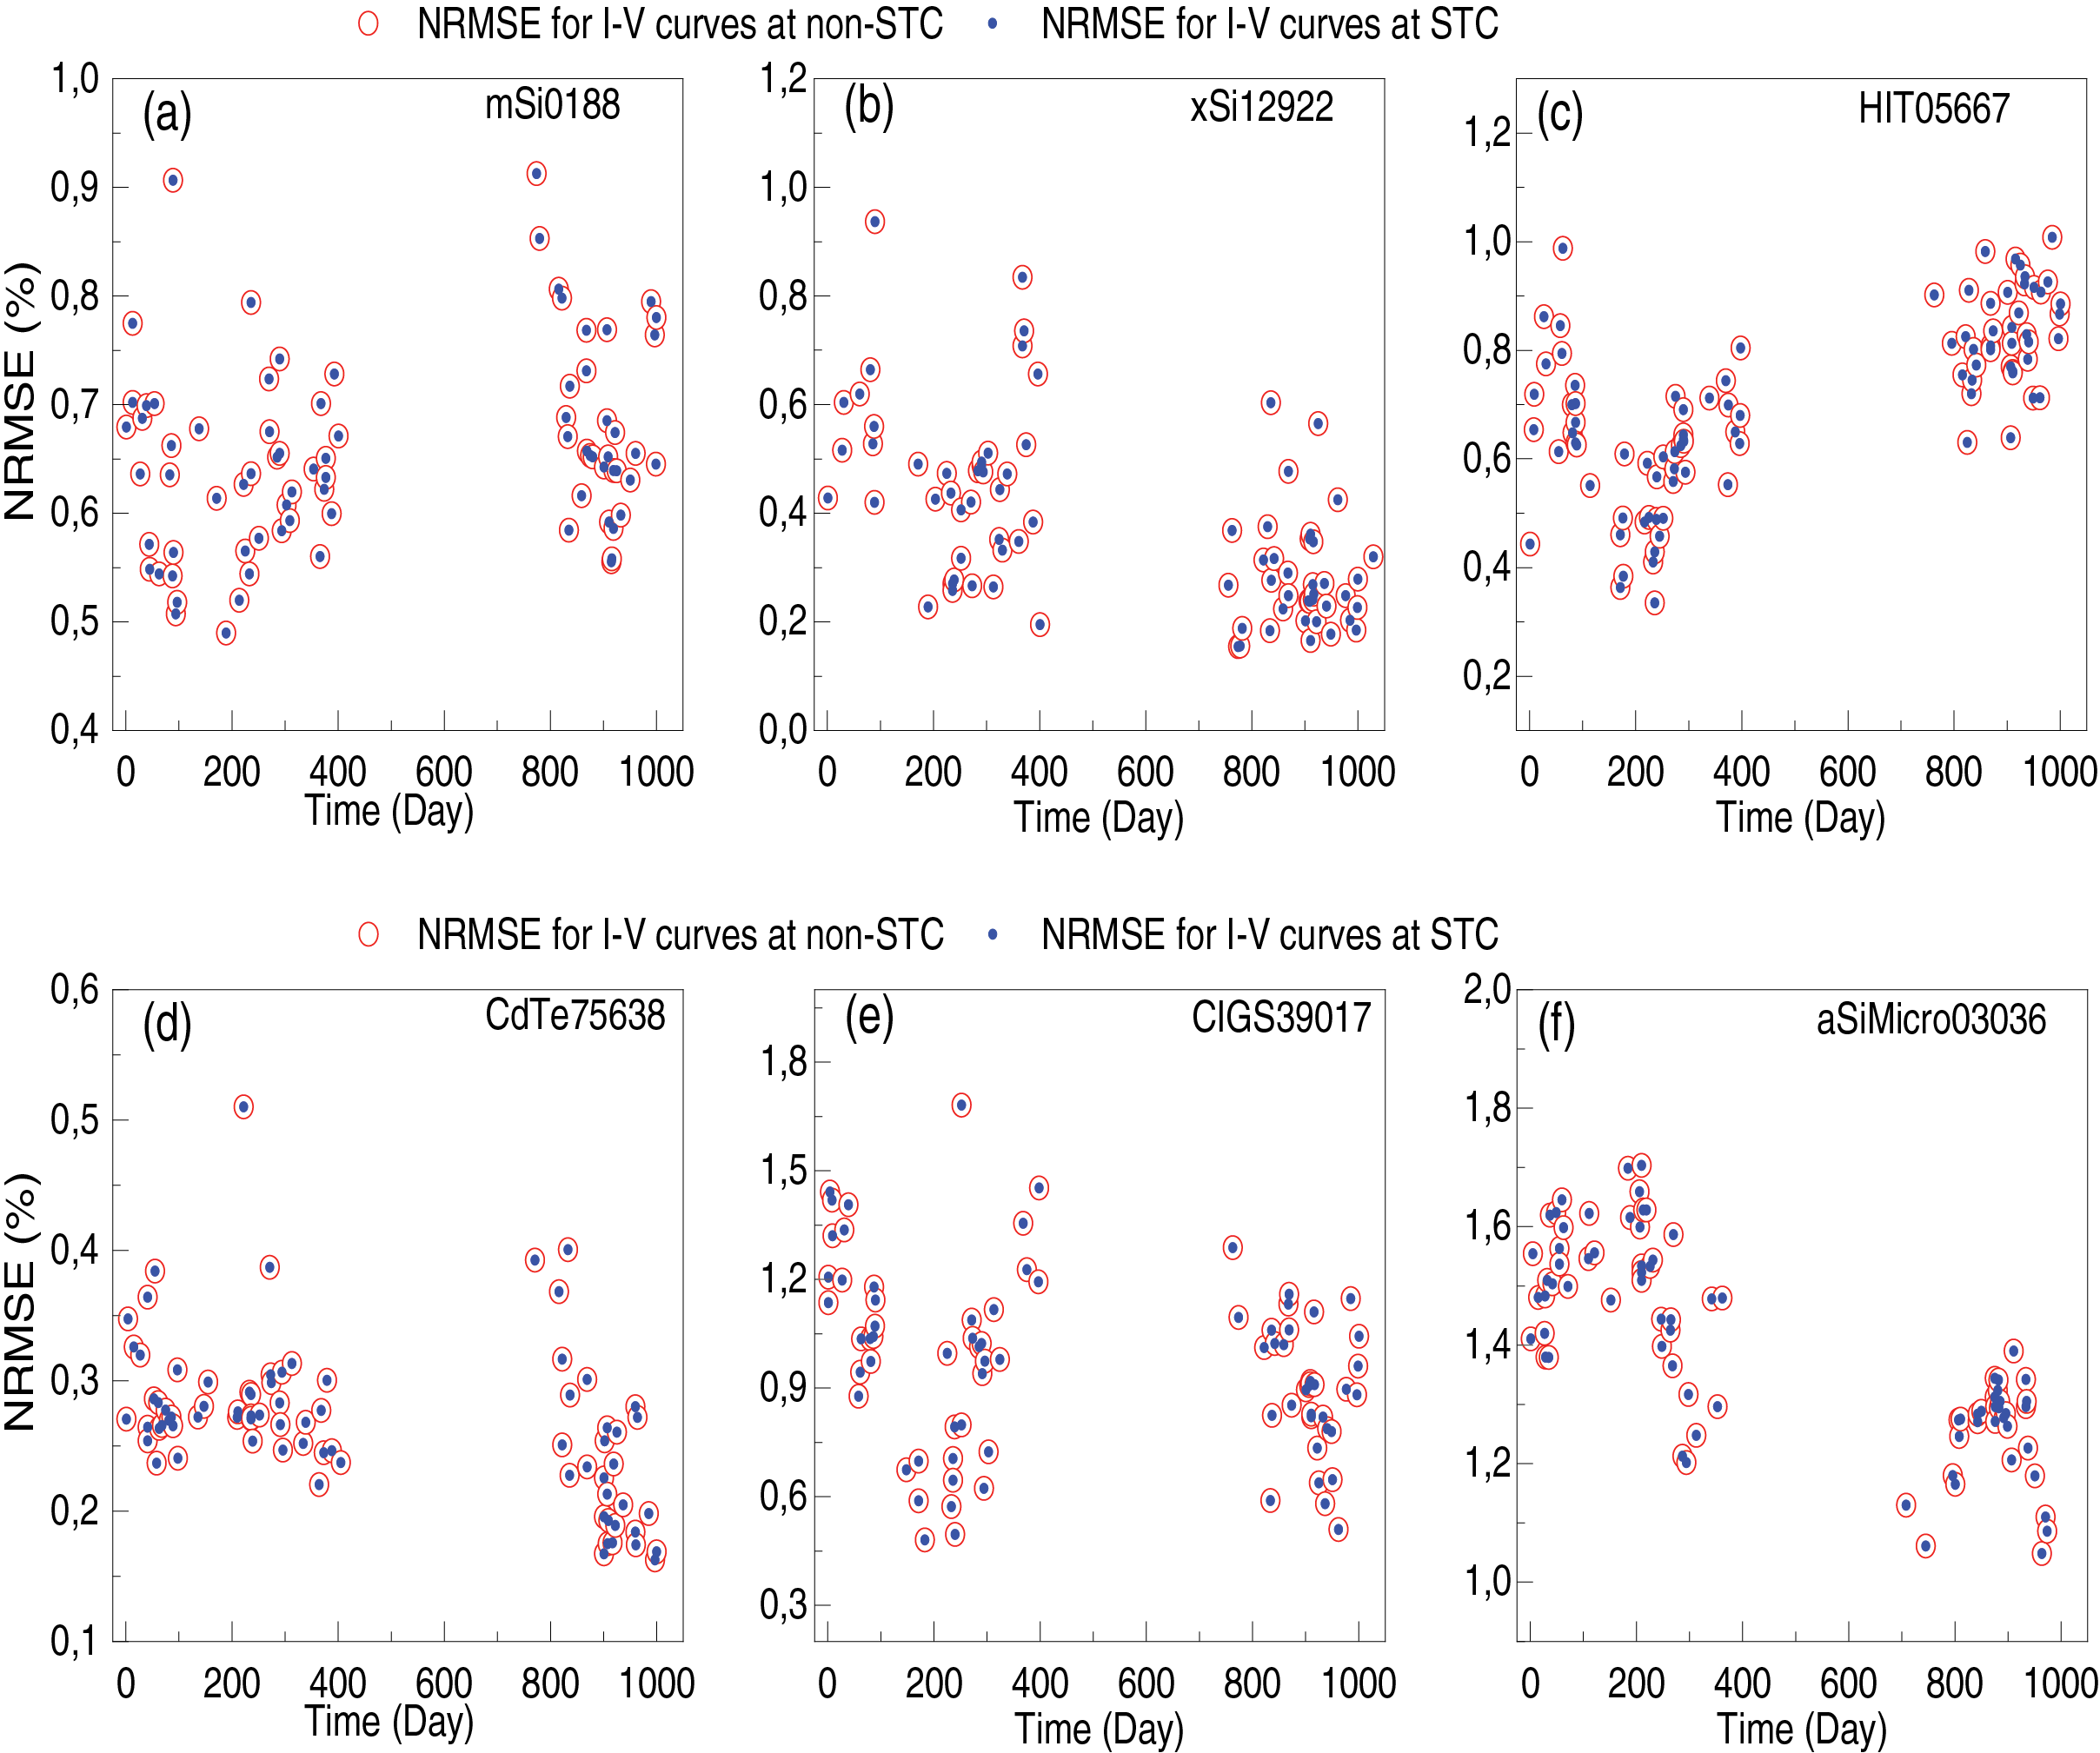
Figure 12: NRMSE values for generated I-V curves under non-STC
3.4 The Degradation Effects on the Shapes of the I-V and P-V Characteristics
This paragraph discusses the effects of aging on the I-V and P-V characteristics of various PV modules. It examines the temporal evolution of key characteristics and the impact of physical parameters on these features. To provide a visual representation of degradation, we compare the I-V and P-V curves measured under the same conditions (STC) on two different days for the same module. Fig. 13 shows the I-V (experimental and generated) and P-V (experimental and generated) curves under STC for six different modules. The degradation effects on the shapes of the I-V and P-V characteristics are clearly visible in the following curves. Consequently, the PV metrics also deteriorate [49].

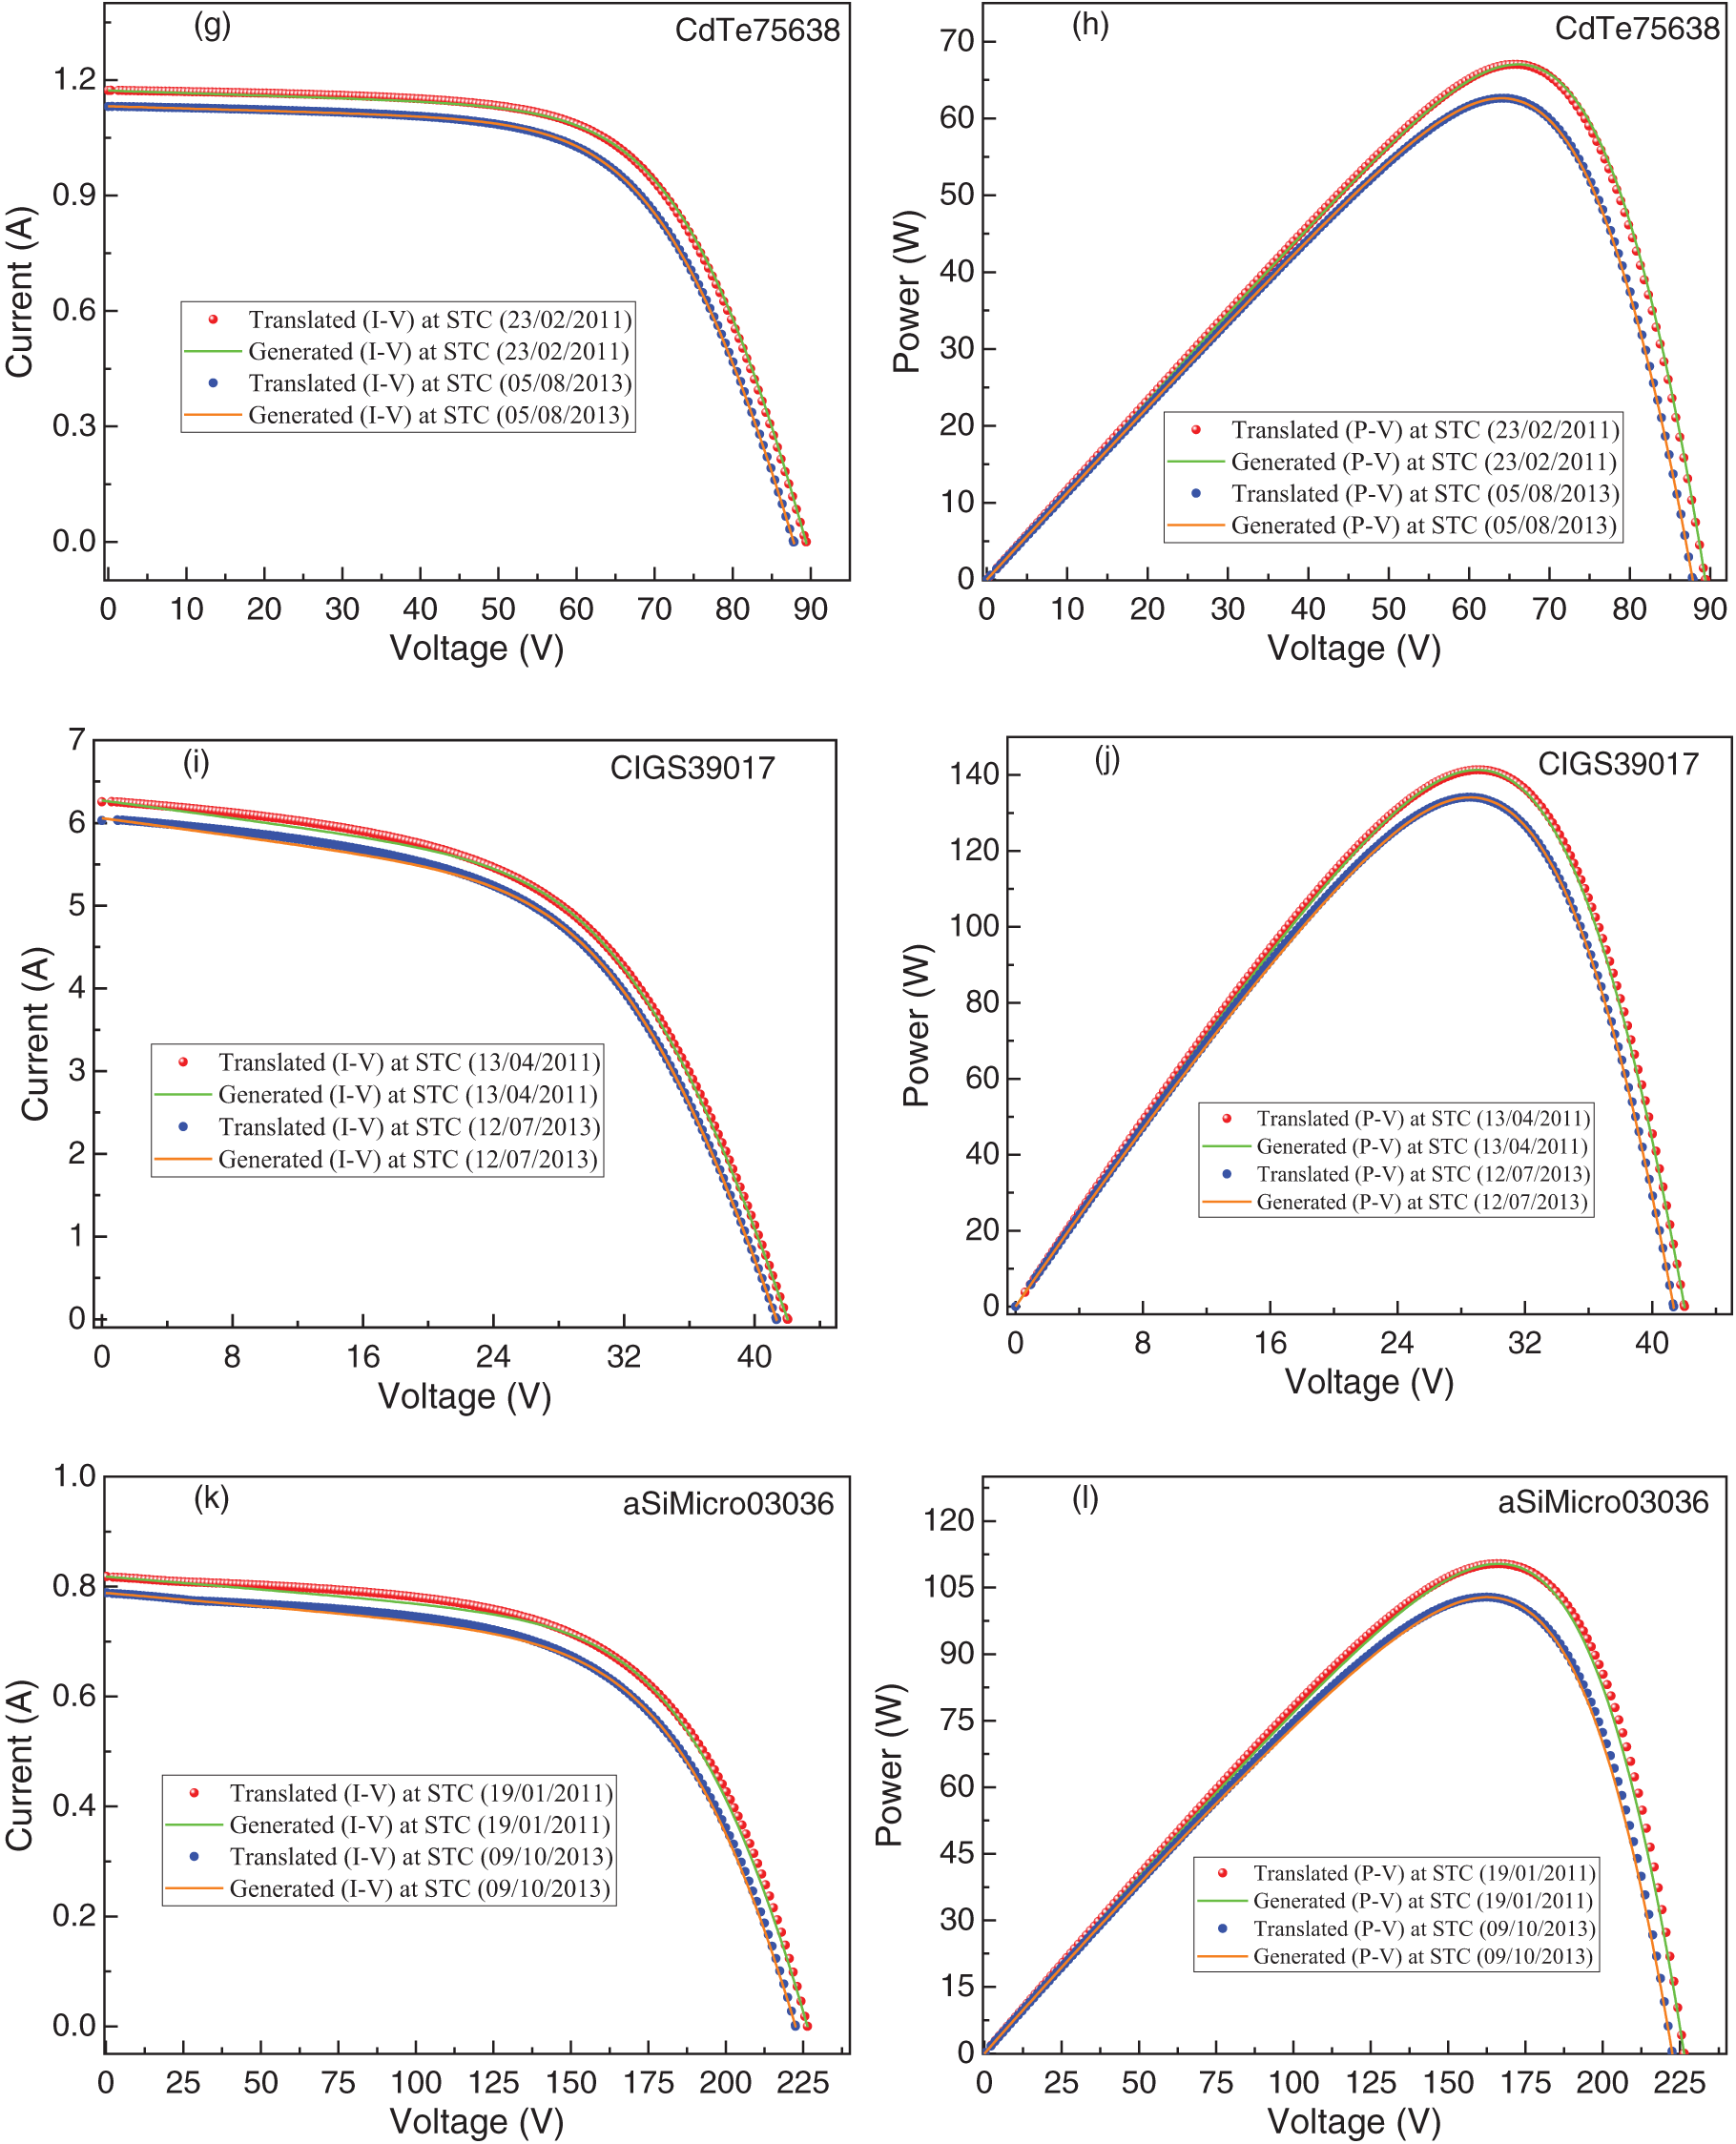
Figure 13: Translated and generated I-V and P-V curves under STC at different times for various PV modules. (a, c, e, g, i, k) represent the evolution of current as a function of voltage, (b, d, f, h, j, l) represent the evolution of power as a function of voltage
Since the I-V and P-V curves were measured under the same conditions, it is reasonable to assume that the differences observed in these curves for the same module result from module degradation rather than differences in measurement conditions. For all six modules, there is a decrease in PV metrics (
This study aims to assess the performance of various PV modules, including crystalline silicon types (m-Si and p-Si) and thin-film types (HIT, CdTe, CIGS, and a-Si/
Acknowledgement: The authors would like to thank Chouaïb Doukkali University (UCD) for its support of this work. They also extend their thanks to the National Renewable Energy Laboratory (NREL) for providing the meteorological and photovoltaic data used in this study.
Funding Statement: The authors received no specific funding for this study.
Author Contributions: Bouasria Youssef: Conceptualization, Methodology, Software, Writing, Original draft, Review and editing. Zaimi Mhammed: Conceptualization, Methodology, Software, Writing, Original draft, Review and editing. El Ainaoui Khadija: Methodology, Writing, Formal analysis, Original draft, Review and editing. Assaid El Mahdi: Conceptualization, Methodology, Software, Writing, Original draft, Review and editing, Supervision. All authors reviewed the results and approved the final version of the manuscript.
Availability of Data and Materials: Given the nature of this research, the participants did not authorize the public release of their data; therefore, the supporting data are not available.
Ethics Approval: Not applicable.
Conflicts of Interest: The authors declare no conflicts of interest to report regarding the present study.
Glossary
| Abbreviations | |
| NREL | National Renewable Energy Laboratory |
| PV | Photovoltaic |
| m-Si | Monocrystalline Silicon |
| p-Si | Polycrystalline Silicon |
| HIT | Heterojunction with intrinsic thin-layer |
| CdTe | Cadmium Telluride |
| CIGS | Copper Indium Gallium Selenium |
| a-Si/ | Amorphous Silicon/microcrystalline silicon |
| I-V | Current -Voltage |
| P-V | Power-Voltage |
| FF | Fill Factor |
| AM | Air Mass |
| STC | Standard Test Conditions |
| POA | Plane-Of-Array |
| DR | Degradation rate |
| MPP | Maximum Power Point |
| OC | Open Circuit |
| SC | Short-circuit |
| ESI | Effective Solar Irradiance |
| NRMSE | Normalized Root-Mean-Square Error |
| SDM | Single-Diode Model |
| Symbols | |
| Output current (A) | |
| Output current at STC (A) | |
| Output voltage (A) | |
| Output voltage at STC (A) | |
| Ideality factor | |
| Ideality factor at STC | |
| Series resistance ( | |
| Series resistance at STC ( | |
| Shunt resistance ( | |
| Shunt resistance at STC ( | |
| Module photocurrent (A) | |
| Module photocurrent at STC (A) | |
| Saturation current (A) | |
| Saturation current at STC (A) | |
| Number of PV solar cells mounted in series within PV module | |
| Boltzmann constant (1.38065.10−3 J/K) | |
| Electron charge (1.6021764.10−19 C) | |
| Thermal voltage (V) | |
| Module temperature (K) | |
| Reference temperature (TSTC = 298.15 K) | |
| SC current (A) | |
| SC current at STC (A) | |
| MPP current (A) | |
| MPP current at STC (A) | |
| OC voltage (V) | |
| OC voltage at STC (V) | |
| MPP voltage (V) | |
| MPP voltage at STC (V) | |
| Module output power at STC (W) | |
| Module maximum power (W) | |
| Module maximum power at STC (W) | |
| Plane-of-array irradiance at STC (1000 W/m2) | |
| Effective solar irradiance at STC (kW/m2) | |
| MPP power temperature coefficient (1/°C) | |
| SC current temperature coefficient (1/°C) | |
| OC voltage temperature coefficient (1/°C) | |
| MPP current temperature coefficient (1/°C) | |
| MPP voltage temperature coefficient (1/°C) | |
References
1. Abdelouahed A, Elmamoun S, Berrada A, Ameur A. Photovoltaic modules degradation assessment using different statistical techniques. Intl J Energy Res. 2022 10;46(12):16593–607. doi:10.1002/er.8320. [Google Scholar] [CrossRef]
2. Adothu B, Kumar S, Jaeckel B, Muttumthala NL, Shekason Z, Daßler D, et al. Identification and investigation of materials degradation in photovoltaic modules from Middle East hot desert. In: Proceedings of the 40th European Photovoltaic Solar Energy Conference and Exhibition; 2023 Sep 18–22; Lisbon, Portugal. doi:10.4229/EUPVSEC2023/3AV.2.29. [Google Scholar] [CrossRef]
3. Salah FEA, Maouhoub N, Tifidat K, Nam Y, Abouhawwash M. An efficient analytical approach for forecasting the peak power of PV panels working in outdoor conditions based on explicit model. Energy Convers Manag X. 2023;20(3):100423. doi:10.1016/j.ecmx.2023.100423. [Google Scholar] [CrossRef]
4. Abraim M, El Ydrissi M, Ghennioui H, Ghennioui A, Hanrieder N, Wilbert S, et al. PVSMS: a system for quantifying soiling effects and optimizing cleaning schedule in PV solar plants. Energy Convers Manag. 2023;284:116978. doi:10.1016/j.enconman.2023.116978. [Google Scholar] [CrossRef]
5. Chekal Affari B, Kahoul N, Haouam A, Cheghib H, Necaibia A, Younes M, et al. Power losses in PV arrays of field-aged modules. Microelectron Reliab. 2023;147:115052. doi:10.1016/j.microrel.2023.115052. [Google Scholar] [CrossRef]
6. Li B, Karin T, Meyers BE, Chen X, Jordan DC, Hansen CW, et al. Determining circuit model parameters from operation data for PV system degradation analysis: PVPRO. Sol Energy. 2023;254:168–81. doi:10.1016/j.solener.2023.03.011. [Google Scholar] [CrossRef]
7. Oum’bark F, Lotfi H, Bennouna A, Ouacha EH. Degradation assessment of two silicon photovoltaic technologies under subtropical desert climate. IJEECS. 2023;29(3):1233. doi:10.11591/ijeecs.v29.i3.pp1233-1246. [Google Scholar] [CrossRef]
8. Atia DM, Hassan AA, El-Madany HT, Eliwa AY, Zahran MB. Degradation and energy performance evaluation of mono-crystalline photovoltaic modules in Egypt. Sci Rep. 2023;13(1):13066. doi:10.1038/s41598-023-40168-8. [Google Scholar] [PubMed] [CrossRef]
9. Bansal N, Jaiswal SP, Singh G. Comparative investigation of performance evaluation, degradation causes, impact and corrective measures for ground mount and rooftop solar PV plants—a review. Sustain Energy Technol Assess. 2021;47(7):101526. doi:10.1016/j.seta.2021.101526. [Google Scholar] [CrossRef]
10. Okorieimoh CC, Norton B, Conlon M. Disaggregating longer-term trends from seasonal variations in measured PV system performance. Electricity. 2024;5(1):1–23. doi:10.3390/electricity5010001. [Google Scholar] [CrossRef]
11. Dag HI, Buker MS. Performance evaluation and degradation assessment of crystalline silicon based photovoltaic rooftop technologies under outdoor conditions. Renew Energy. 2020;156(4):1292–300. doi:10.1016/j.renene.2019.11.141. [Google Scholar] [CrossRef]
12. Gyamfi S, Aboagye B, Peprah F, Obeng M. Degradation analysis of polycrystalline silicon modules from different manufacturers under the same climatic conditions. Energy Convers Manag X. 2023;20(1):100403. doi:10.1016/j.ecmx.2023.100403. [Google Scholar] [CrossRef]
13. Kichou S, Wolf P, Silvestre S, Chouder A. Analysis of the behaviour of cadmium telluride and crystalline silicon photovoltaic modules deployed outdoor under humid continental climate conditions. Sol Energy. 2018;171:681–91. doi:10.1016/j.solener.2018.07.028. [Google Scholar] [CrossRef]
14. Kichou S, Silvestre S, Nofuentes G, Torres-Ramírez M, Chouder A, Guasch D. Behavioral data of thin-film single junction amorphous silicon (a-Si) photovoltaic modules under outdoor long term exposure. Data Brief. 2016;7:366–71. doi:10.1016/j.dib.2016.02.055. [Google Scholar] [PubMed] [CrossRef]
15. Silvestre S, Kichou S, Guglielminotti L, Nofuentes G, Alonso-Abella M. Degradation analysis of thin film photovoltaic modules under outdoor long term exposure in Spanish continental climate conditions. Sol Energy. 2016;139(1):599–607. doi:10.1016/j.solener.2016.10.030. [Google Scholar] [CrossRef]
16. Livera A, Tziolis G, Theristis M, Stein JS, Georghiou GE. Estimating the performance loss rate of photovoltaic systems using time series change point analysis. Energies. 2023;16(9):3724. doi:10.3390/en16093724. [Google Scholar] [CrossRef]
17. Mannino G, Tina GM, Cacciato M, Todaro L, Bizzarri F, Canino A. A photovoltaic degradation evaluation method applied to bifacial modules. Sol Energy. 2023;251(23):39–50. doi:10.1016/j.solener.2022.12.048. [Google Scholar] [CrossRef]
18. Pascual J, Martinez-Moreno F, García M, Marcos J, Marroyo L, Lorenzo E. Long-term degradation rate of crystalline silicon PV modules at commercial PV plants: an 82-MWp assessment over 10 years. Prog Photovolt. 2021;29(12):1294–302. doi:10.1002/pip.3456. [Google Scholar] [CrossRef]
19. Yaichi M, Tayebi A, Boutadara A, Bekraoui A, Mammeri A. Monitoring of PV systems installed in an extremely hostile climate in southern Algeria: performance evaluation extended to degradation assessment of various PV panel of single-crystalline technologies. Energy Convers Manag. 2023;279(6):116777. doi:10.1016/j.enconman.2023.116777. [Google Scholar] [CrossRef]
20. Elhamaoui S, Benazzouz A, Elamim A, Abdelmoula IA, Tijani K, Ghennioui A, et al. Long-term outdoor performance and degradation evaluation of CIS PV plant under the semi-arid climate of Benguerir Morocco. Energy Rep. 2023;9(1):322–39. doi:10.1016/j.egyr.2023.05.272. [Google Scholar] [CrossRef]
21. Marion B, Deceglie MG, Silverman TJ. Analysis of measured photovoltaic module performance for Florida, Oregon, and Colorado locations. Sol Energy. 2014;110:736–44. doi:10.1016/j.solener.2014.10.017. [Google Scholar] [CrossRef]
22. Marion W, Anderberg A, Deline C, Glick S, Muller M, Perrin G, et al. User’s Manual for Data for Validating Models for PV Module. Performance/Report No. NREL/TP-5200-61610, 1130632 [Internet]. 2014 Apr [cited 2024 Jan 25]. Available from: http://www.osti.gov/servlets/purl/1130632/. [Google Scholar]
23. Goswami A, Sadhu PK. Degradation analysis and the impacts on feasibility study of floating solar photovoltaic systems. Sustain Energy Grids Netw. 2021;26(11):100425. doi:10.1016/j.segan.2020.100425. [Google Scholar] [CrossRef]
24. Martínez-Moreno F, Lorenzo E, Muñoz J, Moretón R. On the testing of large PV arrays. Prog Photovolt. 2012;20(1):100–5. doi:10.1002/pip.1102. [Google Scholar] [CrossRef]
25. Silvestre S, Tahri A, Tahri F, Benlebna S, Chouder A. Evaluation of the performance and degradation of crystalline silicon-based photovoltaic modules in the Saharan environment. Energy. 2018;152(6):57–63. doi:10.1016/j.energy.2018.03.135. [Google Scholar] [CrossRef]
26. Tahri A, Silvestre S, Tahri F, Benlebna S, Chouder A. Analysis of thin film photovoltaic modules under outdoor long term exposure in semi-arid climate conditions. Sol Energy. 2017;157(1):587–95. doi:10.1016/j.solener.2017.08.048. [Google Scholar] [CrossRef]
27. Sharma V, Sastry OS, Kumar A, Bora B, Chandel SS. Degradation analysis of a-Si, (HIT) hetro-junction intrinsic thin layer silicon and m-C-Si solar photovoltaic technologies under outdoor conditions. Energy. 2014;72:536–46. doi:10.1016/j.energy.2014.05.078. [Google Scholar] [CrossRef]
28. Premkumar M, Jangir P, Ramakrishnan C, Kumar C, Sowmya R, Deb S, et al. An enhanced Gradient-based Optimizer for parameter estimation of various solar photovoltaic models. Energy Rep. 2022;8(6):15249–85. doi:10.1016/j.egyr.2022.11.092. [Google Scholar] [CrossRef]
29. Tifidat K, Maouhoub N, Askar SS, Abouhawwash M. Numerical procedure for accurate simulation of photovoltaic modules performance based on the identification of the single-diode model parameters. Energy Rep. 2023;9(4):5532–44. doi:10.1016/j.egyr.2023.04.378. [Google Scholar] [CrossRef]
30. Zaimi M, Ainaoui KE, Assaid EM. New analytical expressions of output current for multi-exponential model of PV solar cells and modules based on Taylor series expansion. Sol Energy. 2024;282(8):112953. doi:10.1016/j.solener.2024.112953. [Google Scholar] [CrossRef]
31. El Ainaoui K, Zaimi M, Flouchi I, Elhamaoui S, El Mrabet Y, Ibaararen K, et al. Novel optimized models to enhance performance forecasting of grid-connected PERC PV string operating under semi-arid climate conditions. Sol Energy. 2024;282:112976. doi:10.1016/j.solener.2024.112976. [Google Scholar] [CrossRef]
32. Premkumar M, Kumar C, Sowmya R. Mathematical modelling of solar photovoltaic cell/panel/array based on the physical parameters from the manufacturer’s datasheet. Int J Renew Energy Dev. 2020;9(1):7–22. doi:10.14710/ijred.9.1.7-22. [Google Scholar] [CrossRef]
33. Zaimi M, Ainaoui KE, Mahdi Assaid E. Mathematical models to forecast temporal variations of power law shape parameters of a PV module working in real weather conditions: prediction of maximum power and comparison with single-diode model. Sol Energy. 2023;266:112197. doi:10.1016/j.solener.2023.112197. [Google Scholar] [CrossRef]
34. Hali A, Khlifi Y. New translation method to STC of photovoltaic module characteristics: a comparison of conventional approaches and proposal of a novel method. Microelectron Reliab. 2024;154(1):115324. doi:10.1016/j.microrel.2024.115324. [Google Scholar] [CrossRef]
35. Zaimi M, El Achouby H, Zegoudi O, Ibral A, Assaid EM. Numerical method and new analytical models for determining temporal changes of model-parameters to predict maximum power and efficiency of PV module operating outdoor under arbitrary conditions. Energy Convers Manag. 2020;220:113071. doi:10.1016/j.enconman.2020.113071. [Google Scholar] [CrossRef]
36. Ye JY, Reindl T, Aberle AG, Walsh TM. Performance degradation of various pv module technologies in Tropical Singapore. IEEE J Photovolt. 2014;4(5):1288–94. doi:10.1109/JPHOTOV.2014.2338051. [Google Scholar] [CrossRef]
37. Phinikarides A, Kindyni N, Makrides G, Georghiou GE. Review of photovoltaic degradation rate methodologies. Renew Sustain Energy Rev. 2014;40:143–52. doi:10.1016/j.rser.2014.07.155. [Google Scholar] [CrossRef]
38. Malvoni M, De Giorgi MG, Congedo PM. Forecasting of PV Power Generation using weather input data-preprocessing techniques. Energy Proc. 2017;126(3):651–8. doi:10.1016/j.egypro.2017.08.293. [Google Scholar] [CrossRef]
39. Jordan DC, Kurtz SR. Photovoltaic degradation rates—an analytical review. Prog Photovolt. 2013;21(1):12–29. doi:10.1002/pip.1182. [Google Scholar] [CrossRef]
40. Bouasria Y, Zaimi M, Ainaoui KE, Assaid EM. Analysis of degradation and aging effects on polycrystalline silicon and thin-film PV modules operating outdoors under two US climates. In: Proceedings of the 2024 International Conference on Circuit, Systems and Communication (ICCSC); 2024 Jun 28–29; Fes, Morocco. doi:10.1109/ICCSC62074.2024.10616487. [Google Scholar] [CrossRef]
41. Santhakumari M, Sagar N. A review of the environmental factors degrading the performance of silicon wafer-based photovoltaic modules: failure detection methods and essential mitigation techniques. Renew Sustain Energy Rev. 2019;110:83–100. doi:10.1016/j.rser.2019.04.024. [Google Scholar] [CrossRef]
42. Ozden T, Akinoglu BG, Turan R. Long term outdoor performances of three different on-grid PV arrays in central Anatolia—an extended analysis. Renew Energy. 2017;101:182–95. doi:10.1016/j.renene.2016.08.045. [Google Scholar] [CrossRef]
43. Kichou S, Silvestre S, Nofuentes G, Torres-Ramírez M, Chouder A, Guasch D. Characterization of degradation and evaluation of model parameters of amorphous silicon photovoltaic modules under outdoor long term exposure. Energy. 2016;96(4):231–41. doi:10.1016/j.energy.2015.12.054. [Google Scholar] [CrossRef]
44. Bouaichi A, Merrouni AA, Hajjaj C, Zitouni H, Ghennioui A, Amrani AE, et al. In-situ inspection and measurement of degradation mechanisms for crystalline and thin film PV systems under harsh climatic conditions. Energy Proc. 2019;157(9):1210–9. doi:10.1016/j.egypro.2018.11.287. [Google Scholar] [CrossRef]
45. Chandel M, Agrawal GD, Mathur S, Mathur A. Techno-economic analysis of solar photovoltaic power plant for garment zone of Jaipur city. Case Stud Therm Eng. 2014;2:1–7. doi:10.1016/j.csite.2013.10.002. [Google Scholar] [CrossRef]
46. Bansal N, Jaiswal SP, Singh G. Prolonged degradation and reliability assessment of installed modules operational for 10 years in 5 MW PV plant in hot semi-arid climate. Energy Sustain Dev. 2022;68(39):373–89. doi:10.1016/j.esd.2022.04.008. [Google Scholar] [CrossRef]
47. King DL, Quintana MA, Kratochvil JA, Ellibee DE, Hansen BR. Photovoltaic module performance and durability following long-term field exposure. Prog Photovolt—Res Appl. 2000;8(2):241–56. doi:10.1002/(SICI)1099-159X(200003/04)8:2<241::AID-PIP290>3.0.CO;2-D. [Google Scholar] [CrossRef]
48. Sánchez-Friera P, Piliougine M, Peláez J, Carretero J, Sidrach De Cardona M. Analysis of degradation mechanisms of crystalline silicon PV modules after 12 years of operation in Southern Europe. Prog Photovolt. 2011;19(6):658–66. doi:10.1002/pip.1083. [Google Scholar] [CrossRef]
49. Cárdenas-Bravo C. Computation of Faulty IV curves based on a distributed solar cell algorithm. In: Proceedings of the 8th World Conference on Photovoltaic Energy Conversion; 2022 Sep 30; Milan, Italy. doi:10.4229/WCPEC-82022-3BV.3.32. [Google Scholar] [CrossRef]
Cite This Article
 Copyright © 2025 The Author(s). Published by Tech Science Press.
This work is licensed under a Creative Commons Attribution 4.0 International License , which permits unrestricted use, distribution, and reproduction in any medium, provided the original work is properly cited.
 Downloads
 Citation Tools