
 Submit a Paper
 Propose a Special lssue
 Open Access
ARTICLE

Short-Term Wind Power Prediction Based on Optimized VMD and LSTM
1 College of Mechanical and Control Engineering, Guilin University of Technology, Guilin, 541006, China
2 Guangxi Key Laboratory of Building New Energy and Energy Saving, Guilin, 541006, China
* Corresponding Author: Yu Zhang. Email:
(This article belongs to the Special Issue: AI in Green Energy Technologies and Their Applications)
Energy Engineering 2025, 122(11), 4603-4619. https://doi.org/10.32604/ee.2025.065799
Received 21 March 2025; Accepted 06 June 2025; Issue published 27 October 2025
 View Full Text
 Download PDF
Abstract
Power prediction has been critical in large-scale wind power grid connections. However, traditional wind power prediction methods have long suffered from problems, for instance low prediction accuracy and poor reliability. For this purpose, a hybrid prediction model (VMD-LSTM-Attention) has been proposed, which integrates the variational modal decomposition (VMD), the long short-term memory (LSTM), and the attention mechanism (Attention), and has been optimized by improved dung beetle optimization algorithm (IDBO). Firstly, the algorithm’s performance has been significantly enhanced through the implementation of three key strategies, namely the elite group strategy of the Logistic-Tent map, the nonlinear adjustment factor, and the adaptive T-distribution disturbance mechanism. Subsequently, IDBO has been applied to optimize the important parameters of VMD (decomposition layers and penalty factors) to ensure the best decomposition signal is obtained; Furthermore, the IDBO has been deployed to optimize the three key hyper-parameters of the LSTM, thereby improving its learning capability. Finally, an Attention mechanism has been incorporated to adaptively weight temporal features, thus increasing the model’s ability to focus on key information. Comprehensive simulation experiments have demonstrated that the proposed model achieves higher prediction accuracy compared with VMD-LSTM, VMD-LSTM-Attention, and traditional prediction methods, and quantitative indexes verify the effectiveness of the algorithmic improvement as well as the excellence and precision of the model in wind power prediction.Keywords
China’s wind power sector achieved steady growth amid the nation’s carbon neutrality drive, propelled by green-tech innovation and targeted policy incentives. As reported by the National Energy Administration (NEA), the country’s cumulative installed capacity of wind power has reached approximately 480, by the end of September 2024, representing a year-on-year increase of 19.8 percent [1]. Wind power, as an essential component of renewable energy, has become critical to the stability, flexibility, and sustainability of power systems. However, wind power usually exhibits nonlinearity, uncontrollability, and volatility, which have posed a threat to large-scale grid integration and directly affected grid scheduling and consumption. Therefore, accuracy of wind power prediction is vital to guarantee the stable operation of power system [2].
Researchers both domestically and abroad have conducted extensive studies on prediction models, which are classified mainly into statistical, physical, and learning methods [3]. Physical methods show better performance in medium and long-term predictions and establish specific equations based on the physical principles governing meteorological factors (e.g., wind speed, humidity, and temperature) to achieve the purpose of prediction. The most representative approaches include Numerical Weather Prediction (NWP) and Weather Research and Forecasting (WRF) [4]. For the past several years, WRF has been widely applied to typhoon prediction [5,6]. However, these methods are easily affected by meteorological changes, environmental changes, and model structure, and their robustness is weak. However, the physical methods are easily affected by meteorological changes, environmental changes, and model structure, resulting in the robustness being weak. Statistical methods generate empirically based predictions by analyzing historical data [7]. Common statistical models include the autoregressive model (AR), moving average model (MA), and autoregressive moving average model (ARMA). However, these models are ill-suited to handle nonlinear relationships and dynamic changes, and they exhibit high sensitivity to noise. In recent years, the field of artificial intelligence has ushered in revolutionary breakthroughs. The machine learning technology centered on artificial neural networks (ANN), particularly the deep learning approach, has demonstrated unprecedented technological advantages in modeling complex nonlinear relationships and mining massive datasets [8], thereby providing robust support for the prediction of wind power. Literature [9] proposed a wind power prediction model based on LSTM and compared it with a Backpropagation Neural Network (BP) and Gated Recurrent Unit (GRU) and LSTM outperformed the other models in terms of overall prediction, however, for the fluctuating part of the wind power, LSTM failed to effectively capture its trend. To address the nonlinearity and volatility exhibited by wind power, some scholars have used signal decomposition to reduce the difficulty of prediction. Liu et al. in [10] introduced a model combining Convolutional Neural Network (CNN), GRU and introduced Discrete Cosine Transform (DCT) for power load prediction, and the CNN-LSTM model integrating DCT has significantly ameliorated the precision of wind power prediction the accuracy compared with the LSTM model, but due to the regularity of the power load curve and the excellent performance of DCT in dealing with periodic and symmetric signals, its performance in wind power prediction is more limited, especially in dealing with nonlinear features and the more volatile wind power. In [11], researchers have conducted a study on the selection of signal decomposition methods for time sequence, comparing different methods of decomposition by time-frequency analysis, mutual information and check experiment, and concluded that VMD and singular spectral analysis (SSA) exhibit superior modal decoupling characteristics in the decomposition of time series signals; Compared with the traditional decomposition methods, VMD can accurately distinguish and separate different frequency domain features in the signal, leveraging its constraint optimization mechanism based on the variational framework. Meanwhile, SSA effectively extracts the independent components of the signal through the singular value decomposition of the trajectory matrix, albeit at a high computational cost [12], and these two methods significantly mitigate the modal aliasing phenomenon by their unique mathematical constraints. In 2023, the authors of [13] employed an improved arithmetic optimization algorithm to perform optimization on the parameters of VMD and LSTM with the aim to ameliorate the precision of wind power prediction, and VMD significantly enhances the fitting effect of wind power curves over the other decomposition methods, but the model performs poorly in predicting the late stage accuracy, and it fails to effectively solve the problem of LSTM in dealing with the long sequence of data, the face the problem of information forgetting when the number of time steps increases [14].
In this study, to address the shortcomings of the previous studies, this paper has proposed a VMD-LSTM-Attention combined prediction model based on IDBO. The VMD parameters have been optimized by IDBO to achieve more accurate signal decomposition, transform the nonlinear features in the wind power sequence into a smooth sequence, and decrease the prediction difficulty. By introducing an attention mechanism in the output layer of the LSTM, the weighting mechanism enables the model to obtain information directly from all time steps without relying on the transmission of hidden states, so as to capture the long-distance dependencies in the long sequences more effectively, and to enhance the ability of the LSTM in the processing of long sequences; meanwhile, the network parameters of the LSTM are also optimized with IDBO to further increase the precision of the prediction model.
2 Grounded Theory for Modeling
2.1 Principle of VMD Algorithm
Empirical Mode Decomposition (EMD) often encounters the issue of model mixing in practical applications [15]. To solve this problem, researchers like Dragomiretskiy and colleagues, through rigorous mathematical derivation, proposed a novel method capable of effectively suppressing the mode mixing phenomenon—Variational Mode Decomposition (VMD). Different from the principle on which EMD is based, the core idea of VMD decomposition is to construct and solve the constrained variational problem, and the corresponding constrained variational expression is as follows:
where
To solve the above problem, the constrained variational problem is turned into an unconstrained variational problem by introducing Lagrange multipliers and a quadratic penalty term to solve it:
where a
VMD employs an iterative computational approach to identify the optimal solution of the variational model, thereby determining the center frequency and bandwidth of each Intrinsic Mode Function (IMF) component. Since this process is entirely non-recursive, VMD significantly mitigates the end effects inherent to EMD when processing nonlinear time series data, while also alleviating the mode mixing phenomenon.
2.2 Introduction to the Principle of LSTM
LSTM is a distinctive Recurrent Neural Network (RNN). By combining memory units and gating mechanisms, LSTM has overcome the gradient explosion and gradient vanishing matters which may occur in RNN when processing long sequences of data [16]. It presents a distinctive structure, as illustrated in Fig. 1 below.
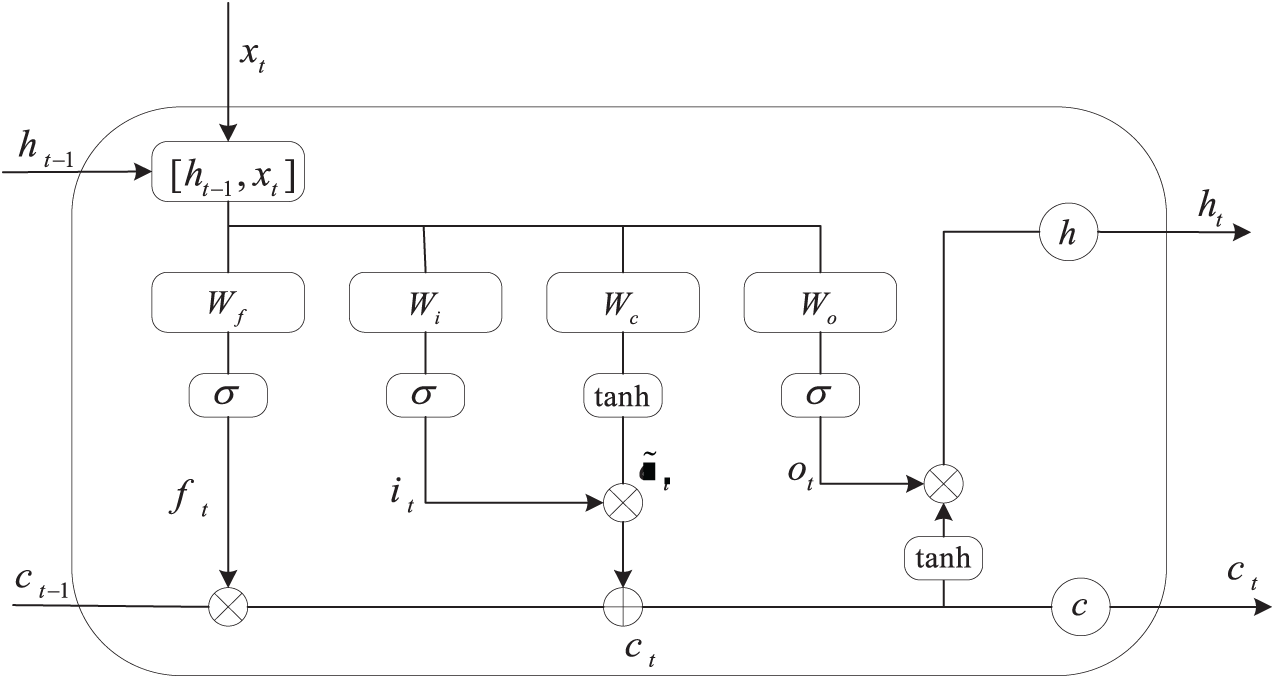
Figure 1: LSTM network architecture diagram
The core component of LSTM involves three “gates”: the forget gate
where
The output gate determines the output information, while the output value is scaled by the tanh function:
Through this design, LSTM can effectively retain critical information in longer time series while discarding unnecessary data, which significantly improves the ability to deal with complex sequences.
The attention mechanism is essentially a mapping function, which maps a Query matrix, a Key matrix, and a Value matrix to an output, the relationship is defined as follows:
where
Assigning distinct weights to various sections of inputs, helps the model to concentrate on the parts with high relevance, to ameliorate generalization capacity of the model.
The structure of the LSTM-Attention model is shown in Fig. 2:
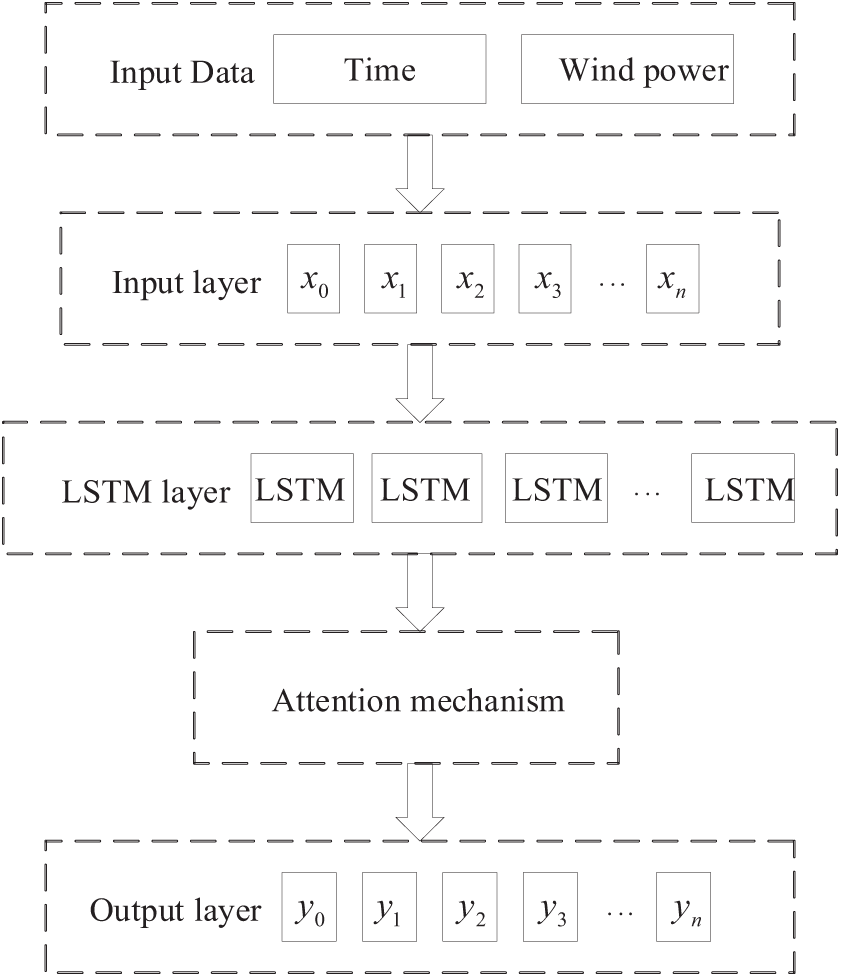
Figure 2: Structure of the LSTM-Attention model
3 Improved Dung Beetle Optimization Algorithm
The DBO is a novel swarm intelligence optimization algorithm originally put forward by Jianka Xue and Bo Shen in 2022 [18], which is inspired by the diverse behaviors that dung beetles exhibit in their daily activities, including ball rolling, foraging, stealing, and reproduction. This algorithm draws upon these biological characteristics to establish its optimization mechanism [19].
Ball-rolling dung beetles use sunlight for navigation reference, ensuring the smooth linear rolling of the dung ball. However, some natural factors, such as light source intensity, can have an impact on the path of travel of the rolling dung beetles in this process. The description of the position is as follows Eq. (10). When a dung beetle is unable to move on after encountering an obstacle, it readjusts travel direction through dance behavior, and the position is updated according to Eq. (11).
where t is the current number of iterations of the algorithm;
In order to protect offspring, identifying optimal oviposition sites holds vital importance for dung beetles. By defining an optimal breeding zone through constrained thresholds, the placement of brood balls is strictly confined within a bounded range:
where
During each iteration, the female dung beetle will only lay one spawn, and the position of each spawn is defined as follows:
where
As the dung beetle larvae develop, they come out of the ground looking for food. The foraging area is defined as:
where
The update of the foraging position of small dung beetles is defined as follows:
where B1 is a random number fit the normal distribution; B2 is a stochastic vector that falls inside (0, 1).
Among dung beetle populations, some dung beetles will steal food from other dung beetles, and the position of the stealing beetles is updated as:
where K is a constant; and
Similar to other optimization algorithms, the DBO exhibits advantages such as fast convergence speed, high precision, and strong stability. However, it also suffered from the problem of falling into local best solutions. To amend this problem, this paper has improved the DBO in the following three strategies.
3.2.1 The Elite Group Strategy of Logistic-Tent Map
Chaotic mapping is an effective means to improve population diversity and can be used to replace the random initialization of populations. It has good diversity in the search space through its special nonlinear dynamic properties, which can generate multiple widely distributed candidate solutions in a short time. Compared with the traditional random initialization method, chaotic mapping can make the initial population more evenly distributed in the solution space, avoiding the over-concentration of the population in a small range, and contributing to a more comprehensive exploration [20]. In this paper, Logistic-Tent mapping has been brought in to improve the performance of DBO with the following system equation:
where r is the control parameter.
Generate n population individuals by Logistic-Tent mapping and combine the n population individuals generated by random initialization by calculating the population fitness and selecting the n elite individuals with higher fitness instead of random initialization.
3.2.2 The Nonlinear Adjustment Factor
During the iteration process, the DBO may suffer from insufficient global search, mainly due to the linear decrease of the adjustment factor from 1 to 0, which affects the global search capability. Li et al. [21] improved the Gray Wolf optimization algorithm (GWO) by introducing a convergence factor in the form of a cosine, which enhanced the global search capability of algorithms as well as the local development capability. In this paper, we draw on this idea to improve the adjustment factor, by adjusting the value of R, DBO achieves a balance between global search and local search, the improved formula is defined as follows:
At the early phases of the algorithm’s operation, a large value of R encourages the algorithm to search globally to discover potentially superior solutions. However, in the later iteration, a small value of R motivates the algorithm to perform local searches to finely optimize the vicinity of the discovered superior solutions. This balancing strategy helps the algorithm to effectively approach the global optimal solution while maintaining the search diversity.
3.2.3 The t-Distribution Perturbation with Adaptive
The foraging behavior of small dung beetles is directly related to the global best position in the DBO. In later iteration of the DBO, individual dung beetles may congregate near the current optimal position, resulting in a less efficient search and possibly missing the optimal solution. The t-distribution is a symmetric probability distribution with longer tails than the normal distribution. In the optimization algorithm, the use of its “sharp peaks and thick tails” can assist the algorithm escape from the local best solution and explore a broader solution space. To prevent the DBO falling into a local optimum when performing a global search, the current iteration number t is used as the parameter freedom degree v to improve the position update of the current optimal solution. The foraging behavior of the small dung beetles has perturbed to improve the search effect, and the position update is performed as follows:
The flow diagram of the IDBO is illustrated in Fig. 3 below.
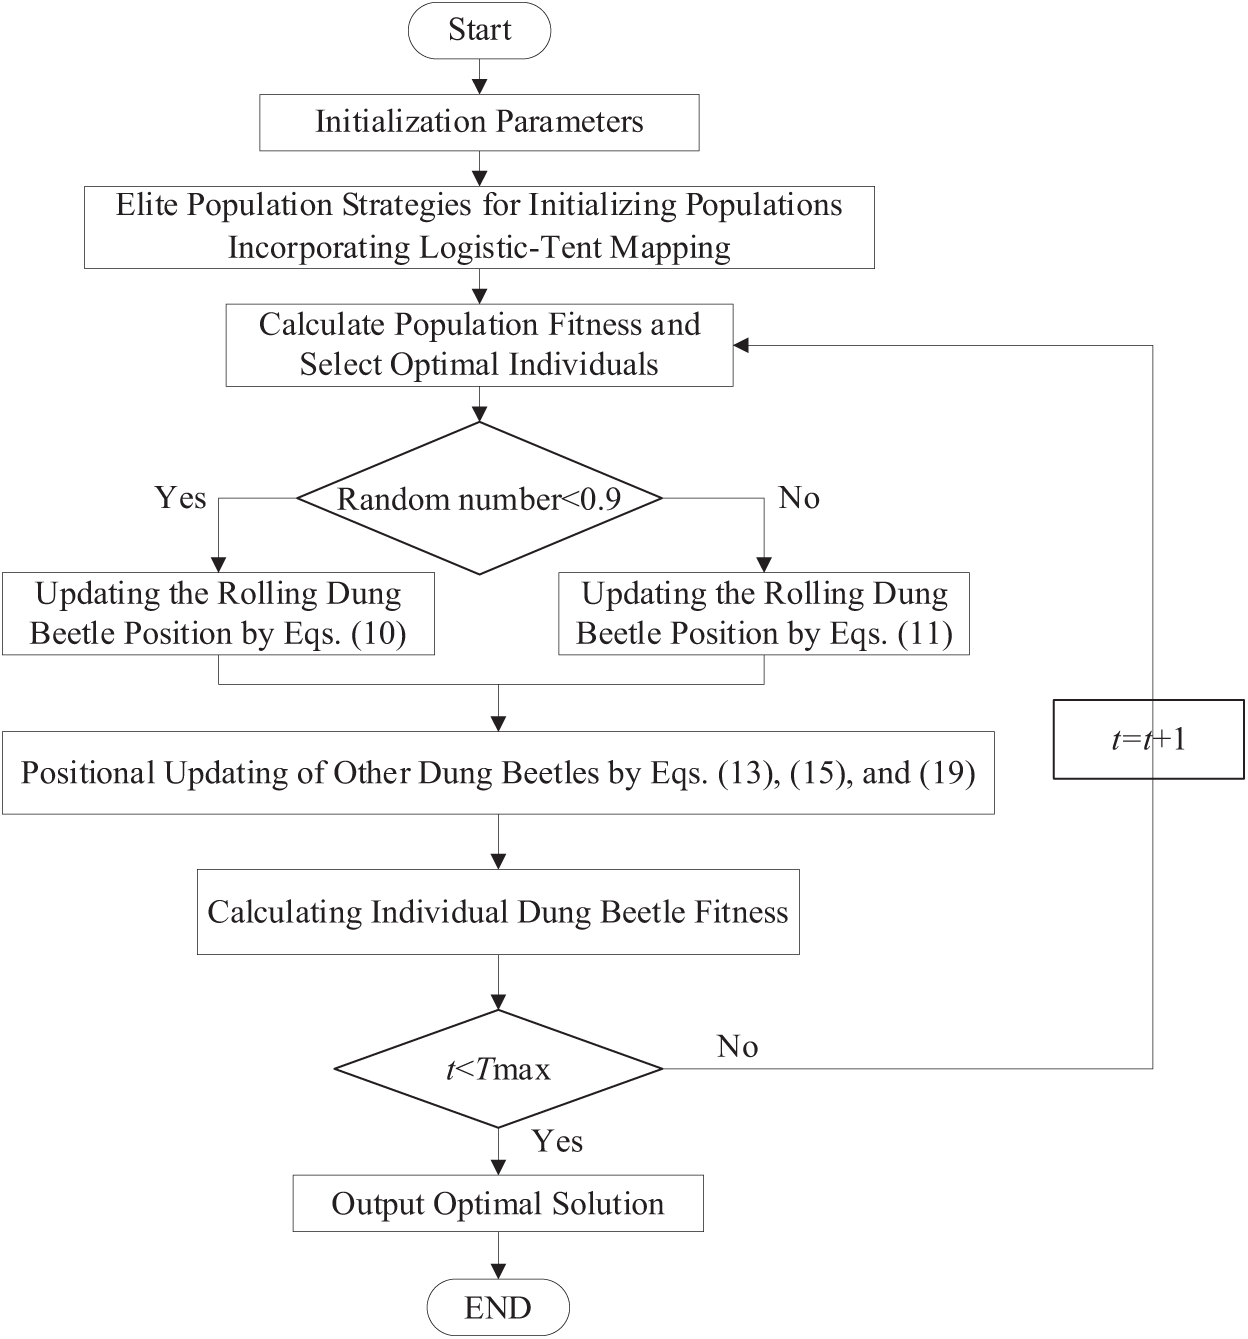
Figure 3: Flowchart of IDBO
3.3 Algorithm Performance Test
In 2023, Xue et al. [19] compared the DBO with the GWO, Sparrow Search Algorithm (SSA), Whale Optimization Algorithm (WOA), and Harris Hawk Optimization (HHO) in a comparative experiment to verify the superiority of the DBO in resolving complex problems. By excluding external interference and directly verify the improvement effect of the improved strategy on the speed of iterative convergence and the ability of global optimization search, so as to reveal the algorithmic optimization mechanism of IDBO with more precision. The simulation environment is on the Windows 11 operating system, using PyCharm software for simulation, the Python version is 3.9, and the graphics card is GeForce RTX 4060. The number of iterations is set to 200, four standard test functions are used as the objective function, and the related functions and parameters are set as shown in Table 1:
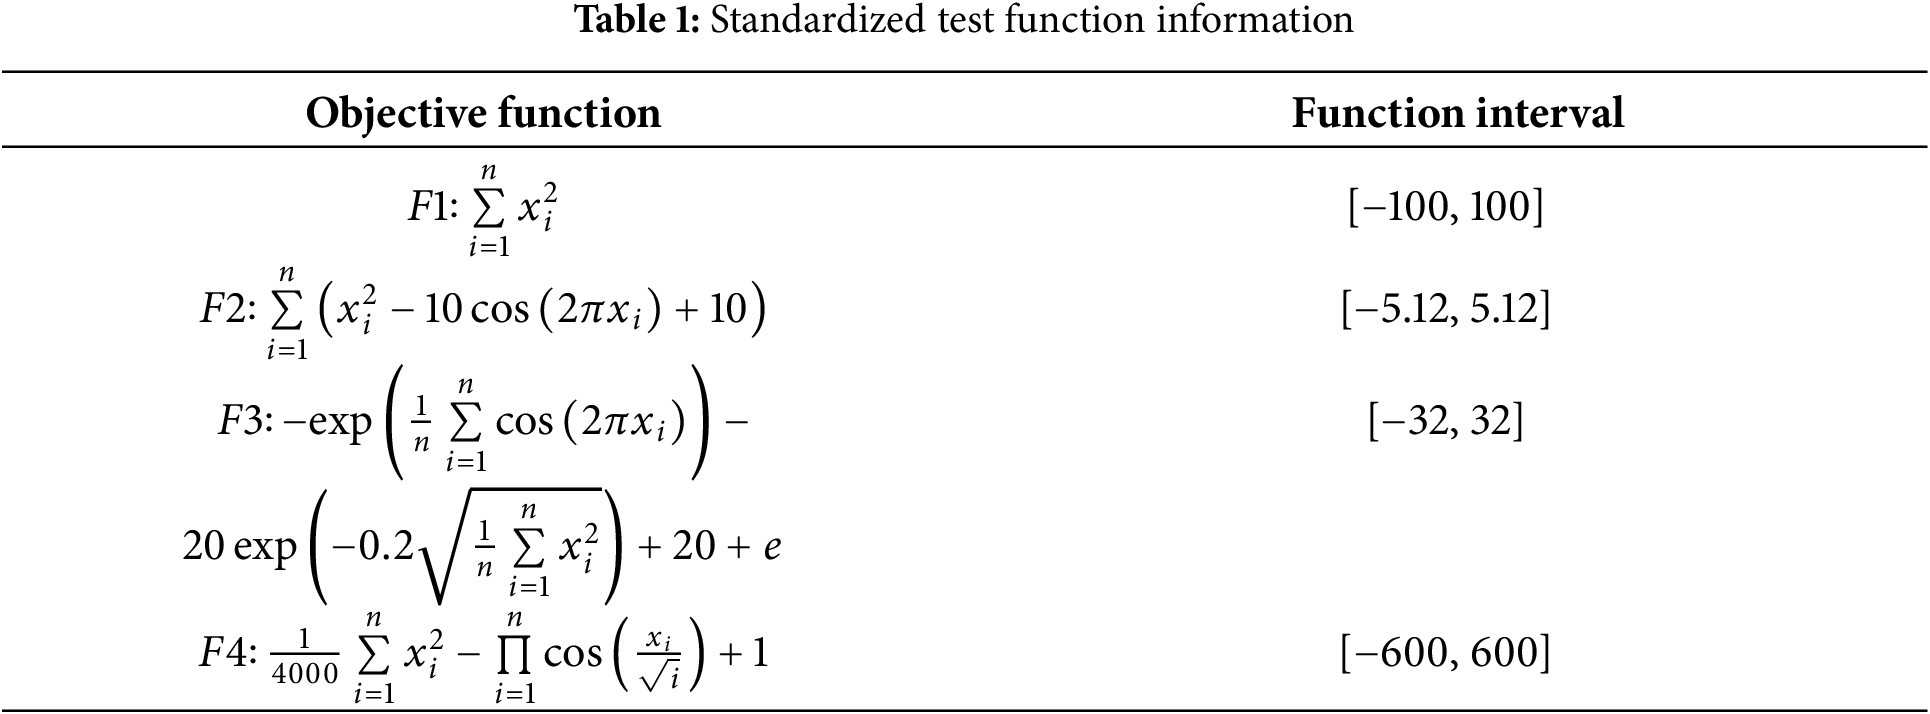
In this study, standardized test functions F1, F2, F3, and F4, all with dimension 30, were selected for the validation experiment. The results are shown in Fig. 4, where IDBO has significant advantages in convergence speed and convergence accuracy. Specifically, IDBO can approach the global optimal region faster, with a greater rate of decrease in fitness at the beginning of the iteration, while DBO performs slightly slower. At the late stage of iteration, the convergence of IDBO tends to be stable and more accurate, showing stronger local search ability, which verifies the effectiveness of the improved strategy, and has made IDBO both fast response ability and robustness in high-dimensional complex problems, and has provided theoretical basis and practical support for the application of intelligent optimization algorithms.
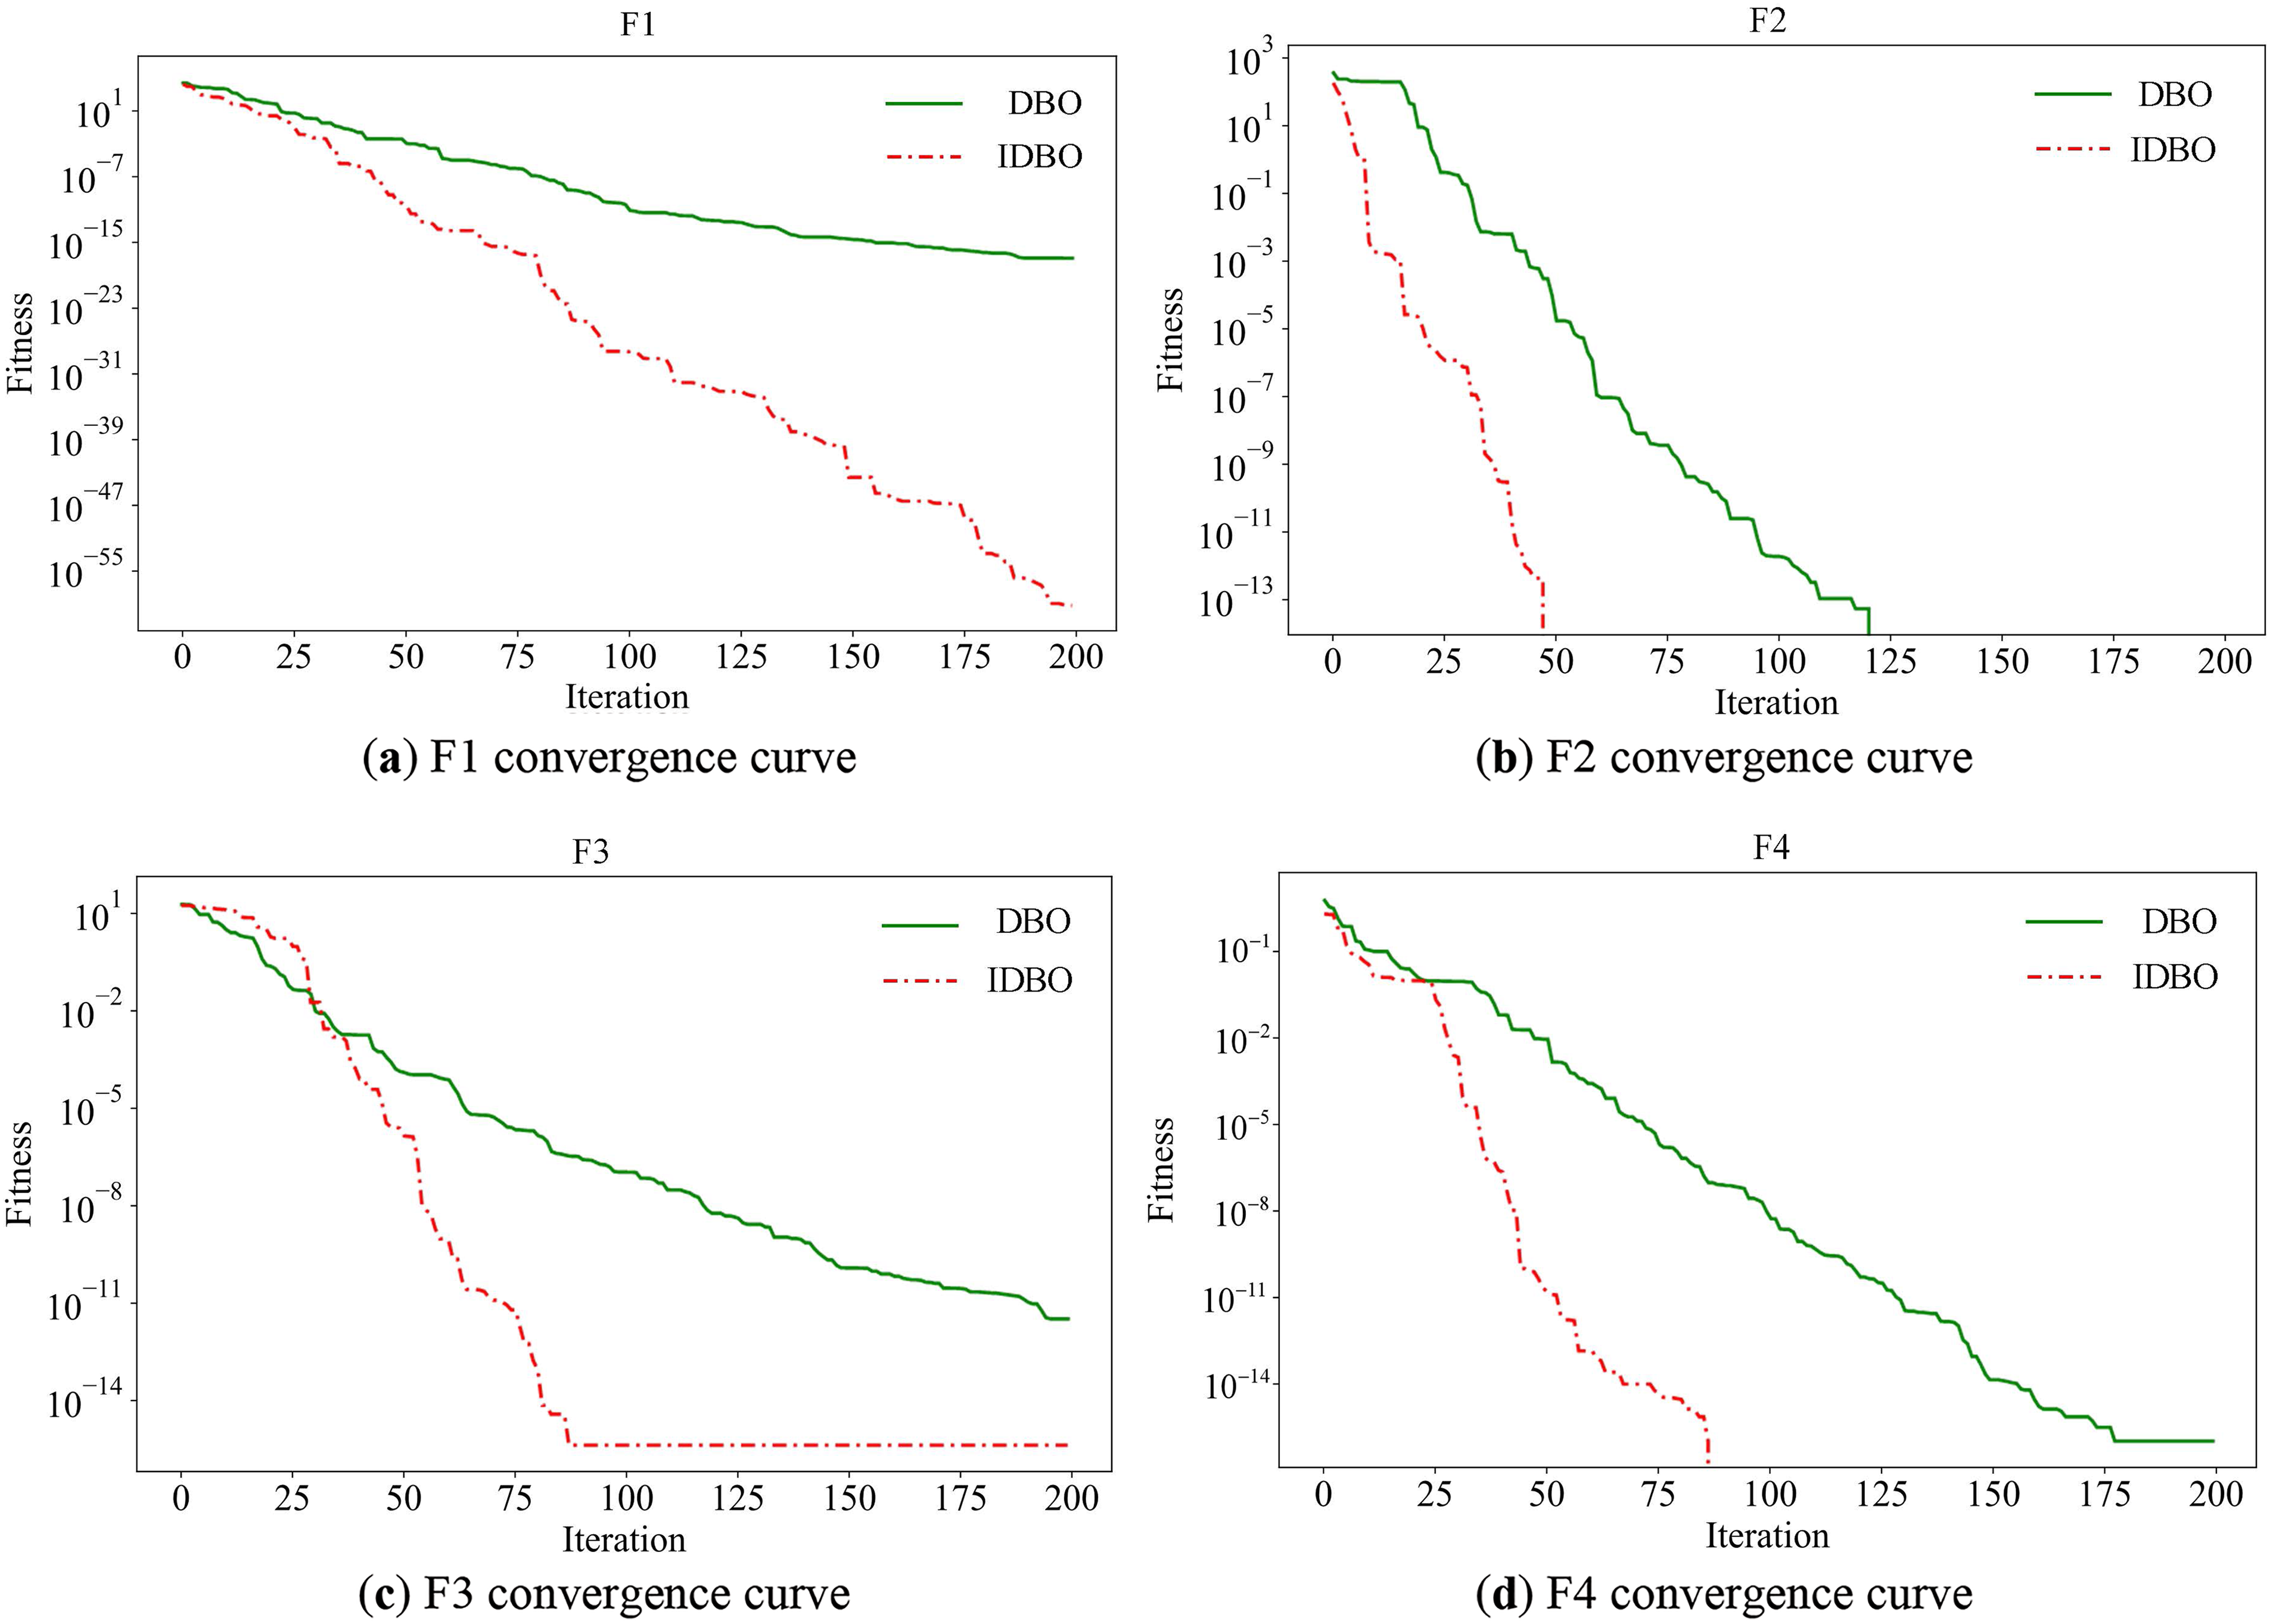
Figure 4: Convergence curves for each test function
The nonlinearity and volatility of wind power are the biggest influencing factors in wind power prediction. The VMD parameters have been optimized by the IDBO to obtain the optimal decomposition parameters to diminish the effect of wind power volatility. To address the nonlinear characteristics of wind power, the IDBO-LSTM-Attention network has been established to train and learn each component, and the number of neurons, learning rate, and batch size in the network are optimized using the IDBO to enhance the ability of network models to resolve nonlinear characteristics. The ultimate wind power prediction results are derived by reconstructing the prediction results of each IMF component. The wind power prediction model is shown in Fig. 5 below.
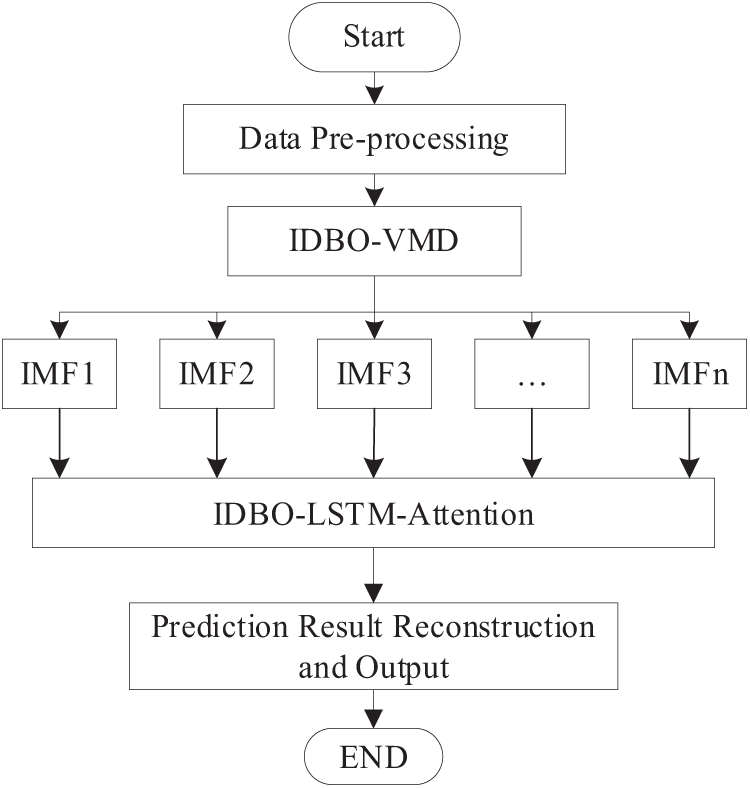
Figure 5: Flowchart of the combined prediction model
This paper adopts Mean Absolute Error (MAE), Root Mean Square Error (RMSE), and Coefficient of Determination (R-Square), as the evaluation indexes of the model’s prediction performance, which are calculated as follows:
where
This paper uses data from a wind energy farm in Xinjiang, China, containing information on wind velocity, wind direction, barometric pressure, and humidity, the time span from 01 January 2019, to 31 March 2019, a total of 8640 relevant data, with a temporal resolution of 15 min, and the power data are shown in Fig. 6 below.
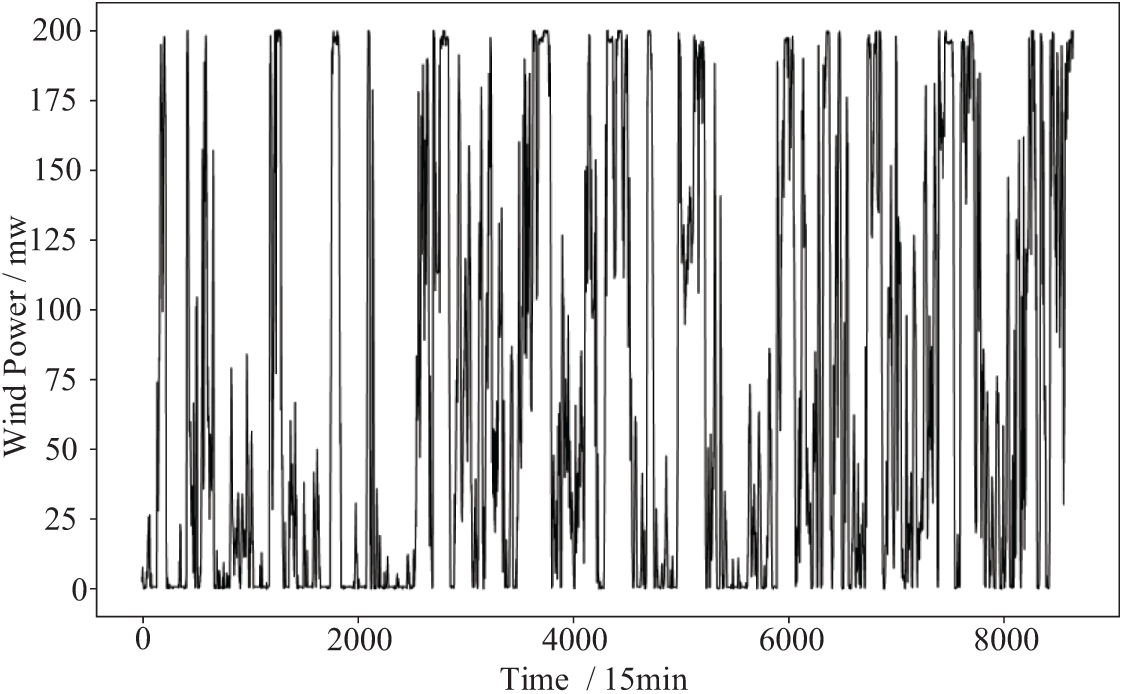
Figure 6: Wind power data
To reduce the difficulty of model training and prediction, data from the first 950 sampling points of the dataset are selected as the learning and testing samples in this paper, where 85% of the data are used as the training set, and 15% of the data are used as the test set. In order to test the effect of VMD on the wind power generation prediction results and to compare the prediction results of VMD-LSTM-Attention under different K values,
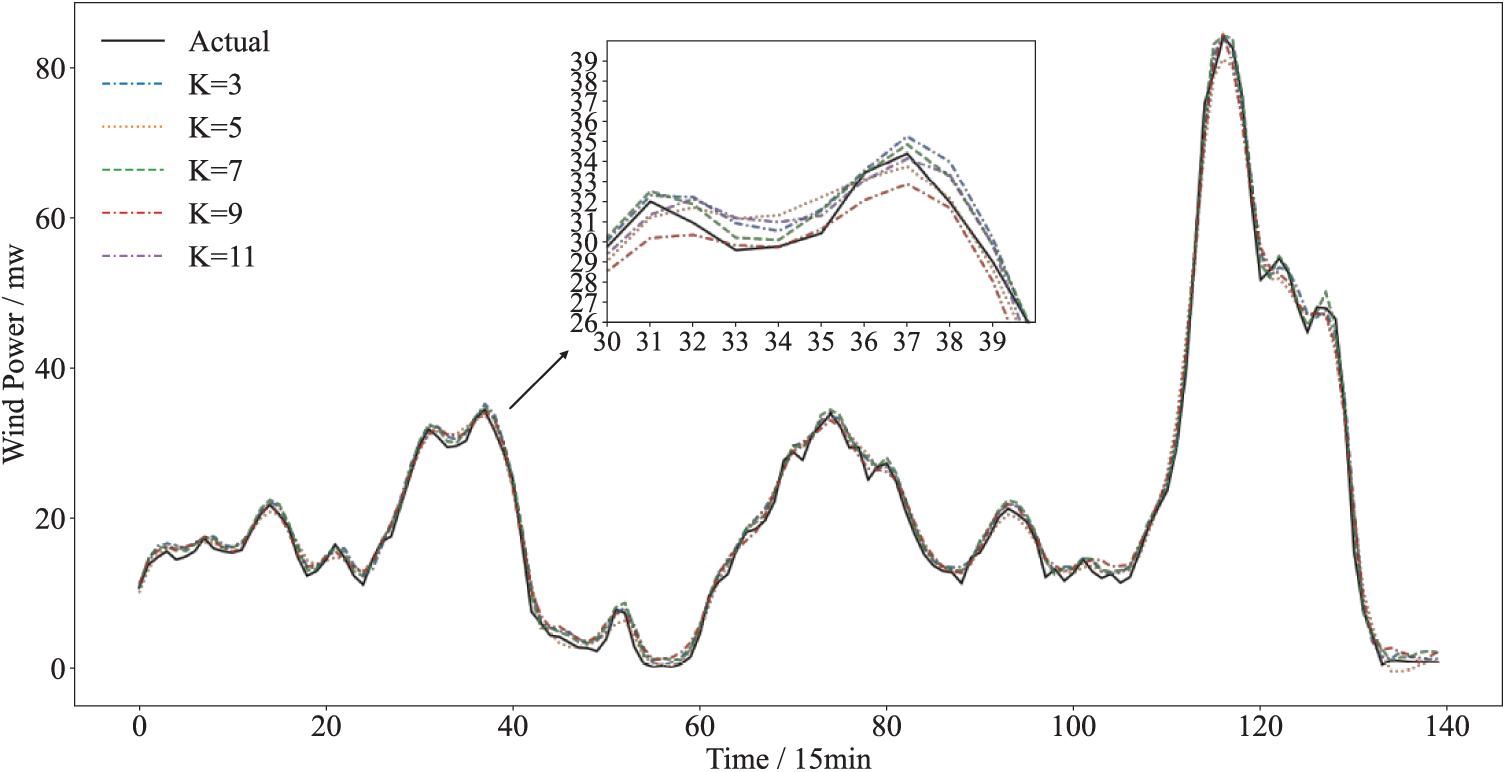
Figure 7: Prediction results of VMD-LSTM-Attention with different K values
The prediction errors for different values of K are shown in Fig. 8.
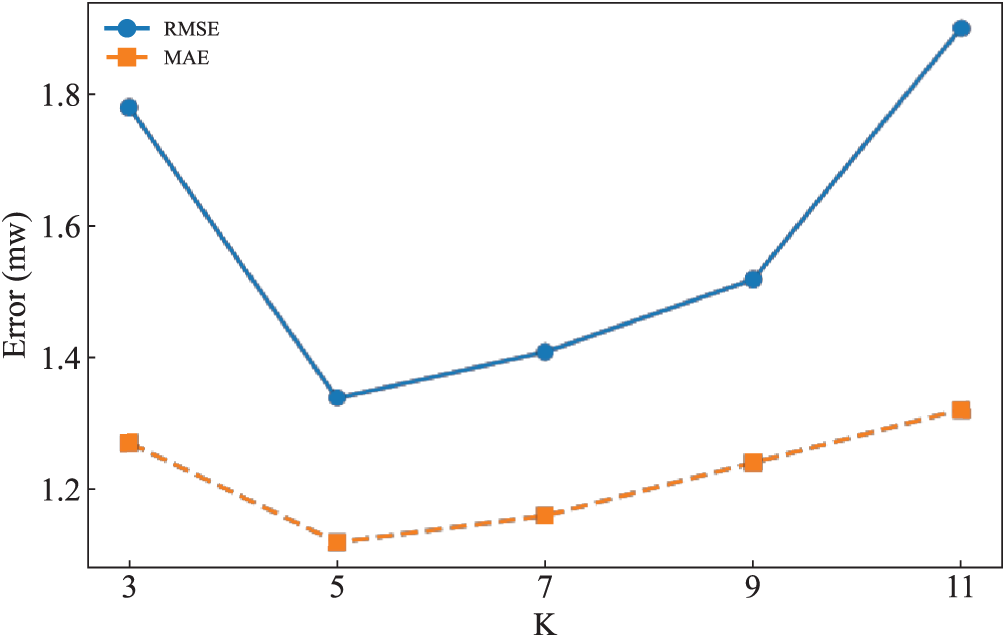
Figure 8: Prediction error of VMD-LSTM-Attention at different values of K
By comparing different K values, it is noted that when K is too small, it leads to modal aliasing resulting in feature impurity and relatively low accuracy. When K > 7 the index deteriorates and shows a tendency of overdecomposition, leading to modal redundancy, increasing model complexity and possibly triggering overfitting. Therefore, it is crucial to optimize the parameters of the VMD. In the paper, the decomposition layer and penalty factor in VMD are optimized using IDBO with minimum information entropy as the fitness function. The low entropy value indicates that VMD effectively separates the fluctuation component from the noise, and has higher mode purity. Through parameter adaptive optimization, the decomposition results are accurately adapted to the nonlinear and fluctuating characteristics of wind power, so as to provide more focused modal characteristics for the prediction model and improve the prediction accuracy. The lower bound of the parameters is set to [100, 2], the upper bound is set to [9000, 10], and the eventual combination of parameters obtained by the algorithm is [2355, 6], its optimization iteration curve is shown in Fig. 9.
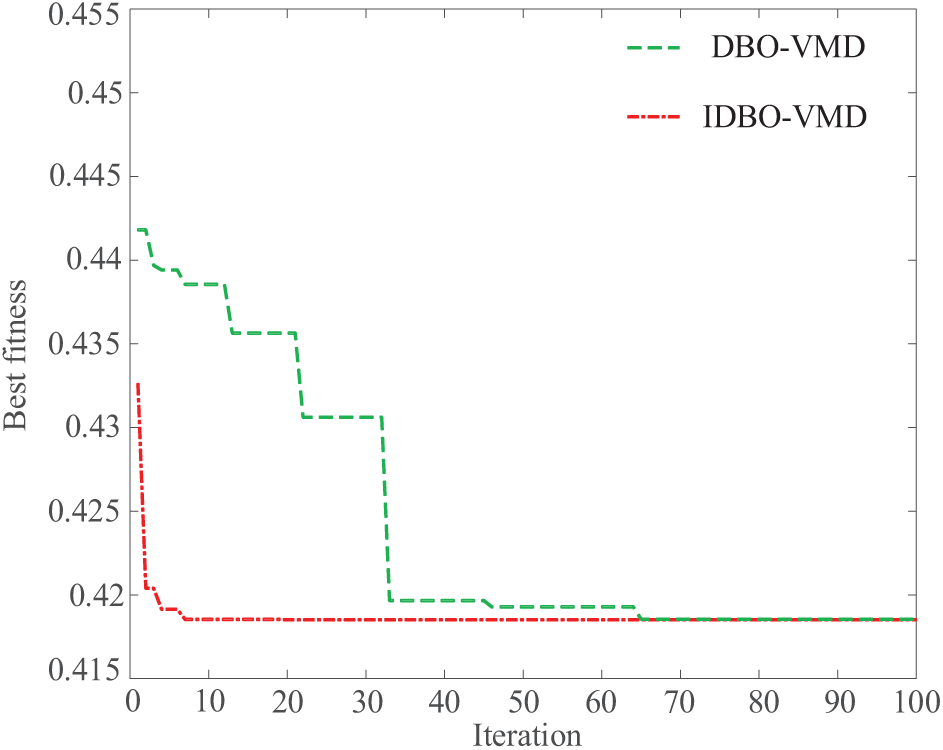
Figure 9: IDBO optimizes the VMD parameter iteration curve
The optimized parameters are used to process the preprocessed data, and the decomposition result is presented in Fig. 10. Through the decomposition, the nonlinear characteristics of the data are effectively suppressed, thus reducing the difficulty of wind power prediction.
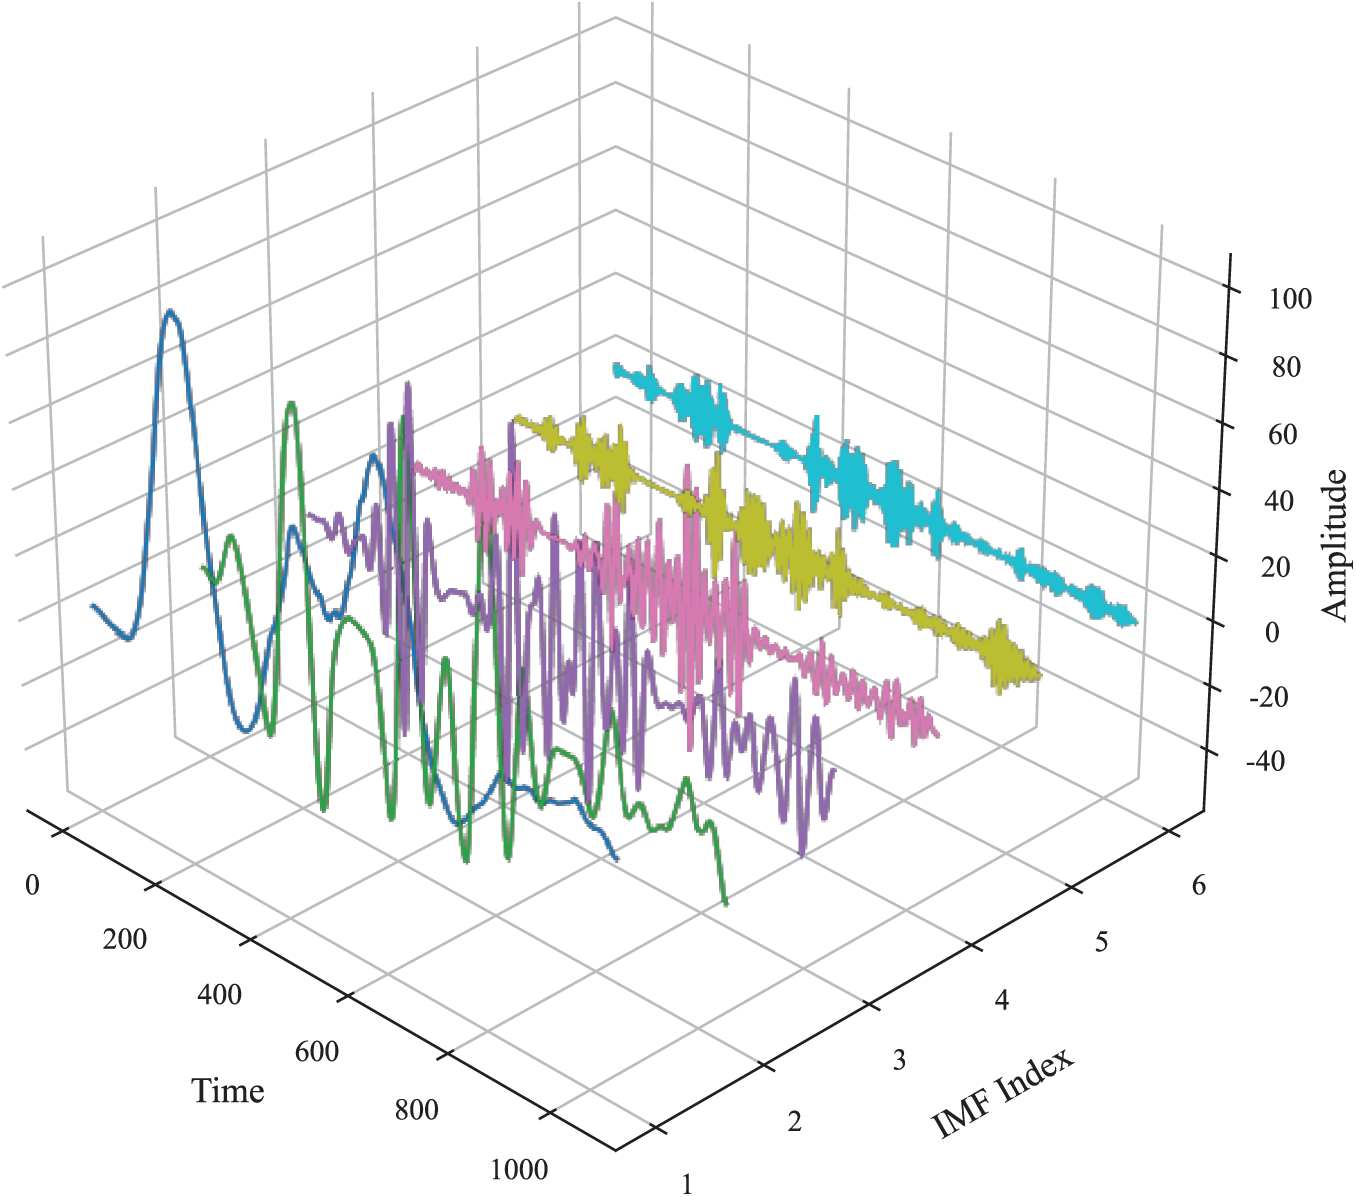
Figure 10: Results after processing the data using VMD
5.2 Comparison of Model Prediction Effects
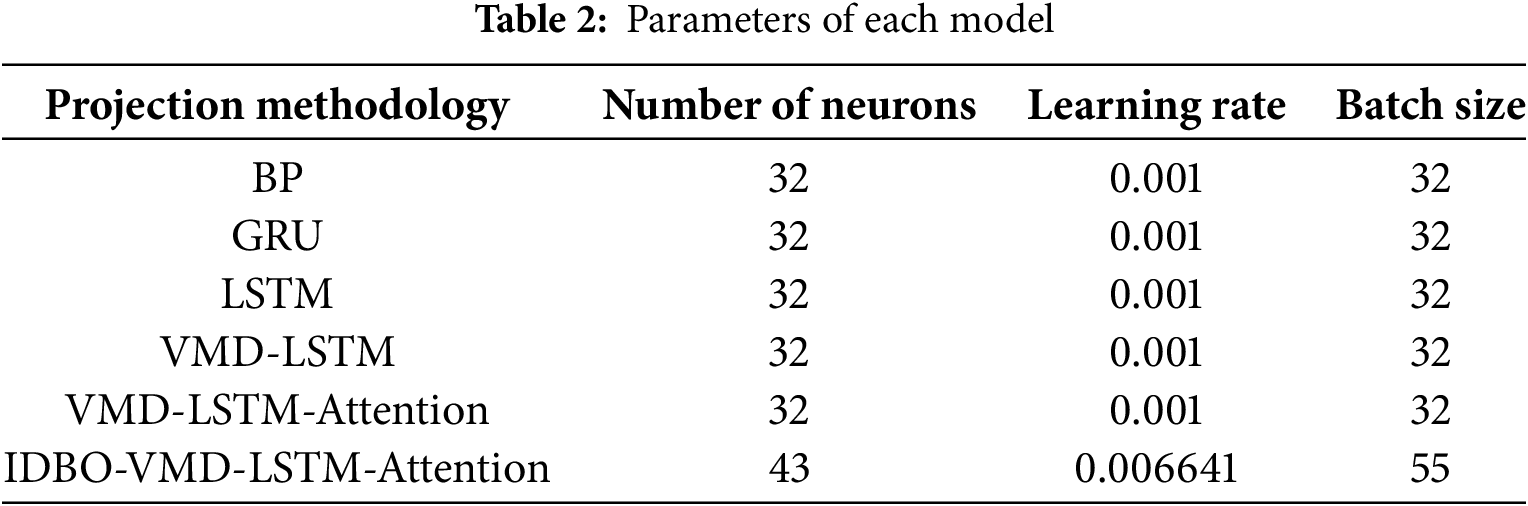
In order to fully evaluate the prediction performance of the proposed model in this paper, it is compared with other prediction models. The number of training iterations is set to 200, the sliding window length is set to 6, and the other parameters to be optimized in the model appear in Table 2:
The simulation results are shown in Fig. 11. It is observed that the single prediction model has a biased prediction result, and is difficult to capture the actual change trend when large fluctuations occur in the wind power system, the prediction performance is significantly improved by combining the single model. The model in this paper can not only fit the actual value more accurately but also accurately predict the fluctuation trend when the actual value fluctuates drastically, effectively improving the prediction precision and robustness.
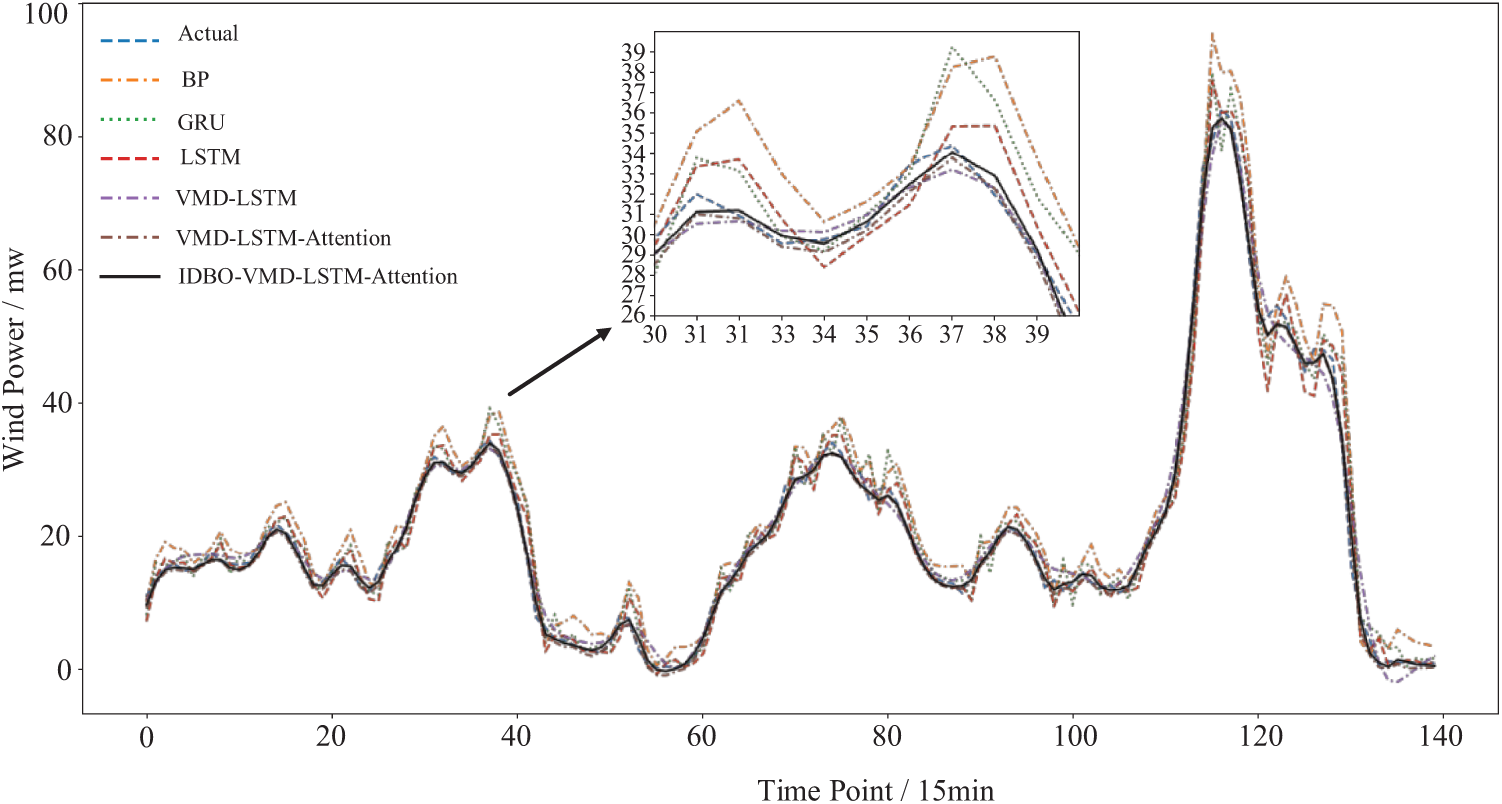
Figure 11: Comparison of the predictions of all the models mentioned in the paper
Fig. 12 illustrates the histogram of the prediction errors for each model, and the errors for each model show a trend toward a normal distribution. The superior performance of the single Model LSTM in prediction is verified by comparing the error distributions of BP, GRU, and LSTM; By comparing the error distributions of LSTM and VMD-LSTM, the error distribution interval of VMD-LSTM is smaller. Duo to the noise suppression and signal decoupling capabilities of VMD, the prediction error is smaller; Compared with the error of VMD-LSTM, the error distribution interval of VMD-LSTM-Attention is smaller. Attention makes the model more flexible to focus on the importance of different time points in the input data, and enhances the learning ability of the model for key features. The error of this paper’s model is the most concentrated, integrates the advantages of VMD-LSTM and VMD-LSTM-Attention, and employs IDBO to optimize the parameters of VMD and LSTM, ranging from −2 to 2, and the normal distribution characteristic is the most obvious, the amplitude and fluctuation of the error reaches the lowest, and the frequency peak is the highest, which means the prediction results are more accurate and stable, indicating that this paper’s model is not only able to reliably make predictions in the area of short-term wind power prediction but also able to maintain a high level of adaptability and precision in dynamic and complex environments.
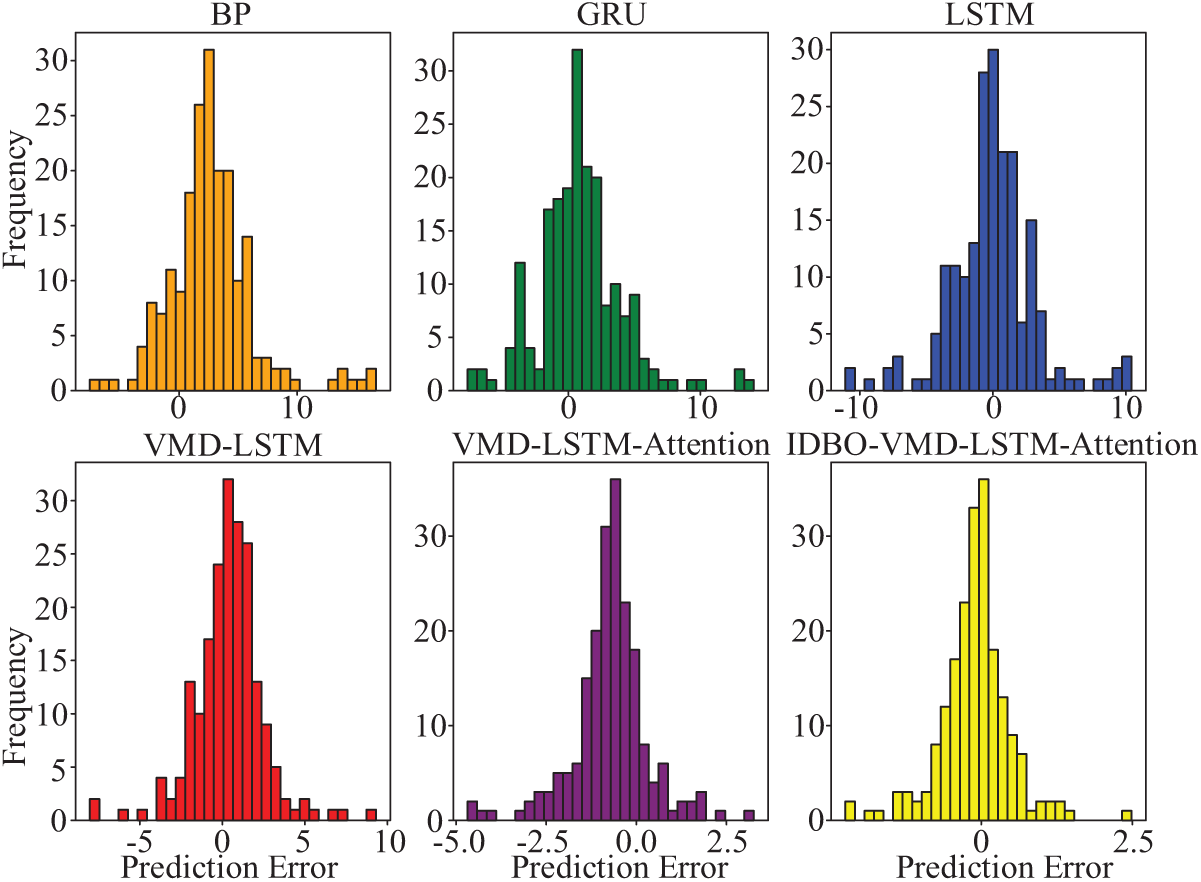
Figure 12: Histogram of prediction error
Combined with the figure and table analysis, the traditional LSTM model fused with VMD improves the prediction accuracy more significantly, which verifies the validity of VMD in enhancing the fitting precision of the wind power curve. Introducing Attention to the LSTM output layer, increases the prediction accuracy, reflecting that the introduction of Attention enhances the ability of LSTM to handle long sequences. As a swarm intelligence algorithm, IDBO has a significant effect on the prediction effect after being added to the combined model. After optimizing the VMD-LSTM-Attention model with IDBO, the evaluation indexes of RMSE and MAE are reduced by 34.9% and 27.6%, compared with the unoptimized model, and improved by 0.7%, which indicates that the introduction of intelligent algorithms has a significant effect on the enhancement of the model prediction accuracy. Through the comparison of evaluation indexes, the IDBO-VMD-LSTM-Attention combination prediction model mentioned in this paper can predict wind power better, which proves the validity of the models mentioned in this article as well as its accuracy in predicting nonlinear fluctuations.
The evaluation indexes are detailed in Table 3 below:
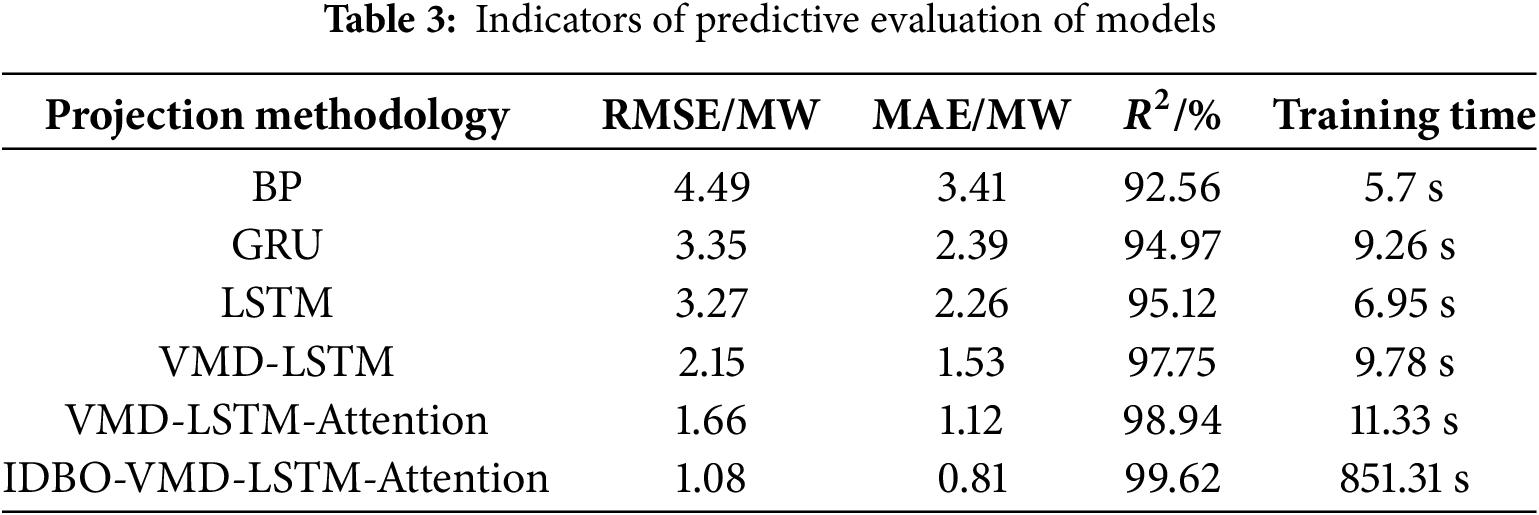
By comparing the training time, the IDBO-VMD-LSTM-Attention model sacrifices a significant amount of time in the training phase for parameter optimization, but provides extremely high prediction accuracy. In real-time deployment, the model is able to reason quickly after offline training and provide highly accurate real-time predictions. Despite the long training time, the long-term benefits and stability of the model make it a very competitive choice for complex systems.
This paper has proposed a combined model based on IDBO to optimize VMD, and LSTM-Attention, and compare it with other models to obtain the following conclusions:
(a) For the problem of slow convergence of DBO, the elite population strategy of Logistic-Tent mapping, nonlinear convergence factor, and t-distribution perturbation with adaptive have been introduced to improve the DBO. By comparing the performance of DBO with IDBO, IDBO has faster convergence speed and higher accuracy. It can effectively and optimally select the parameters of VMD and the LSTM model.
(b) Compared with the classical LSTM model, the combined prediction model incorporating IDBO proposed in this article shows higher prediction precision in wind power prediction. The model does not suffer from performance degradation due to LSTM’s excessive dependence on hidden state transfer during long sequence processing. By comparing with other prediction models and analyzing the related evaluation indexes, the viability of the proposed model in short-term wind power prediction has been verified, its significant potential in improving prediction accuracy is highlighted.
Since the combined prediction model proposed herein relies on historical wind power data, it belongs to the offline prediction model, which is slightly less real-time compared to the online prediction model. The future of research will focus on the online prediction model to further improve its real-time performance in wind power prediction.
Acknowledgement: Not applicable.
Funding Statement: This work was supported by the Open Fund of Guangxi Key Laboratory of Building New Energy and Energy Saving (Project Number: Guike Energy 17-J-21-3).
Author Contributions: The authors confirm their contribution to the paper as follows: study conception and design: Xinjian Li, Yu Zhang; data collection: Zewen Wang, Zhenyun Song; analysis and interpretation of results: Xinjian Li, Yu Zhang; draft manuscript preparation: Xinjian Li, Yu Zhang. All authors reviewed the results and approved the final version of the manuscript.
Availability of Data and Materials: The data used to support the findings of this study are available from the corresponding author upon request.
Ethics Approval: Not applicable.
Conflicts of Interest: The authors declare no conflicts of interest to report regarding the present study.
References
1. National Energy Administration. The country’s cumulative installed power generation capacity is about 3.16 billion KW [Internet]. [cited 2025 Jun 06]. Available from: https://www.nea.gov.cn/2024-10/25/c_1310786908.htm. (In Chinese). [Google Scholar]
2. Ke JJ, Chen T. Data decomposition modeling based on improved dung beetle optimization algorithm for wind power prediction. Data. 2024;9(12):146. doi:10.3390/data9120146. [Google Scholar] [CrossRef]
3. Qi XJ, Chen Q, Zhang JJ. Short-term prediction of PV power based on fusions of power series and ramp series. Electr Power Syst Res. 2023;222(5):109499. doi:10.1016/j.epsr.2023.109499. [Google Scholar] [CrossRef]
4. Zheng JQ, Ling Q, Li J, Feng YR. Improving the short-range precipitation forecast of numerical weather prediction through a deep learning-based mask approach. Adv Atmos Sci. 2024;41(8):1601–13. doi:10.1007/s00376-023-3085-7. [Google Scholar] [CrossRef]
5. Xu WF, Liu P, Cheng L, Zhou Y, Xia Q, Gong Y, et al. Multi-step wind speed prediction by combining a WRF simulation and an error correction strategy. Renew Energy. 2021;163(8):772–82. doi:10.1016/j.renene.2020.09.032. [Google Scholar] [CrossRef]
6. Xu DM, Shen FF, Min JZ, Shu AQ. Assimilation of GPM microwave imager radiance for track prediction of typhoon cases with the WRF hybrid En3DVAR system. Adv Atmos Sci. 2021;38(6):983–93. doi:10.1007/s00376-021-0252-6. [Google Scholar] [CrossRef]
7. Ma L, Wang L, Zeng S, Zhao Y, Liu C, Zhang H, et al. Short-term household load forecasting based on attention mechanism and CNN-ICPSO-LSTM. Energy Eng. 2024;121(6):1473–93. doi:10.32604/ee.2024.047332. [Google Scholar] [CrossRef]
8. Wu Z, Luo G, Yang Z, Guo Y, Li K, Xue Y. A comprehensive review on deep learning approaches in wind forecasting applications. CAAI Trans Intell Technol. 2022;7(2):129–43. doi:10.1049/cit2.12076. [Google Scholar] [CrossRef]
9. Zhang SJ, Zhang XF, Xie ZZ, Jia WY, Zhang ZY. Power prediction method of wind power based on LSTM. Energy Energy Conserv. 2024;8:11–3. (In Chinese). doi:10.16643/j.cnki.14-1360/td.2024.08.007. [Google Scholar] [CrossRef]
10. Liu W, Cai DS, Feng FY, Han H, Huang Q. Research on short-term electric load forecasting based on DCT-CNN-GRU. Electr Meas Instrum. 2024:1–11. (In Chinese). [Google Scholar]
11. Liang Y, Zhang DQ, Zhang JZ, Hu G. A state-of-the-art analysis on decomposition method for short-term wind speed forecasting using LSTM and a novel hybrid deep learning model. Energy. 2024;333:133826. doi:10.1016/j.energy.2024.133826. [Google Scholar] [CrossRef]
12. Chen W, Zhang Y. A queued variational mode decomposition method. J Frankl Inst. 2024;361(12):106965. doi:10.1016/j.jfranklin.2024.106965. [Google Scholar] [CrossRef]
13. Xiao LX, Zhang Y, Zhou H, Zhao GH. Ultra short trem wind power prediction based on IAOA-VMD-LSTM. Acta Energiae Solaris Sin. 2023;44(11):239–46. (In Chinese). doi:10.19912/j.0254-0096.tynxb.2022-1054. [Google Scholar] [CrossRef]
14. Wang Q, Peng RQ, Wang JQ, Li Z, Qu HB. NEWLSTM: an optimized long short-term memory language model for sequence prediction. IEEE Access. 2020;8:65395–401. doi:10.1109/ACCESS.2020.2985418. [Google Scholar] [CrossRef]
15. Huang J, Zhang W, Qin J, Song S. Ultra-short-term wind power prediction based on eEEMD-LSTM. Energies. 2024;17(1):251. doi:10.3390/en17010251. [Google Scholar] [CrossRef]
16. Seabe PL, Moutsinga CRB, Pindza E. Forecasting cryptocurrency prices using LSTM, GRU, and Bi-directional LSTM: a deep learning approach. Fractal Fract. 2023;7(2):203. doi:10.3390/fractalfract7020203. [Google Scholar] [CrossRef]
17. Wang Q, Cheng H, Zhang WR, Li GX, Xu F, Chen DH, et al. Short-term photovoltaic power prediction based on multi-stage temporal feature learning. Energy Eng. 2025;122(2):747–64. doi:10.32604/ee.2025.059533. [Google Scholar] [CrossRef]
18. Wang X, Wei YX, Guo ZH. A sinh-cosh-enhanced DBO algorithm applied to global optimization problems. Biomimetics. 2024;9(5):271. doi:10.3390/biomimetics9050271. [Google Scholar] [PubMed] [CrossRef]
19. Xue JK, Shen B. Dung beetle optimizer: a new meta-heuristic algorithm for global optimization. J Supercomput. 2023;79(7):7305–36. doi:10.1007/s11227-022-04959-6. [Google Scholar] [CrossRef]
20. Hou YX, Gao HB, Wang ZJ, Du CS. Improved grey wolf optimization algorithm and application. Sensors. 2022;22(10):3810. doi:10.3390/s22103810. [Google Scholar] [PubMed] [CrossRef]
21. Li Y, Lin XX, Liu JS. An improved gray wolf optimization algorithm to solve engineering problems. Sustainability. 2021;13(6):3208. doi:10.3390/su13063208. [Google Scholar] [CrossRef]
Cite This Article
 Copyright © 2025 The Author(s). Published by Tech Science Press.
This work is licensed under a Creative Commons Attribution 4.0 International License , which permits unrestricted use, distribution, and reproduction in any medium, provided the original work is properly cited.
 Downloads
 Citation Tools