
 Submit a Paper
 Propose a Special lssue
 Open Access
ARTICLE

Configuration and Operation Optimization of Active Distribution Network Based on Wind-Solar-Hydrogen-Storage Integration
1 School of Automation and Electrical Engineering, Lanzhou Jiaotong University, Lanzhou, 730070, China
2 State Grid Gansu Electric Power Co., Ltd., Electric Power Research Institute, Lanzhou, 730070, China
* Corresponding Author: Yulong Che. Email:
(This article belongs to the Special Issue: Revolution in Energy Systems: Hydrogen and Beyond)
Energy Engineering 2025, 122(11), 4777-4797. https://doi.org/10.32604/ee.2025.068134
Received 21 May 2025; Accepted 29 July 2025; Issue published 27 October 2025
 View Full Text
 Download PDF
Abstract
Aiming at the issues of insufficient carrying capacity, limited flexibility, and weak source-network-load-storage coordination capability in distribution networks under the background of high-proportion new energy integration. This study proposes a bi-level optimization model for ADN integrating hybrid wind-solar-hydrogen-storage systems. First, an electro-hydrogen coupling system framework is constructed, including models for electrolytic hydrogen production, hydrogen storage, and fuel cells. Meanwhile, typical scenarios of wind-solar joint output are developed using Copula functions to characterize the variability of renewable energy generation. Second, a bi-level optimization model for ADN with electrolytic hydrogen production and storage systems is established: the upper layer employs a multi-objective differential evolution algorithm to solve the optimal siting and sizing problem, aiming to minimize life-cycle costs; the lower layer formulates a coordinated operation optimization model that incorporates contribution degree functions, Voltage Distribution Equilibrium Metric (VDEM), and the renewable energy consumption and absorption rate to ensure real-time synergistic optimization of power flow and voltage stability. Finally, simulations based on the IEEE 33-bus system demonstrate that the proposed method reduces the system’s energy curtailment costs by 34.6% and increases the renewable energy accommodation rate to 99.27%. This study verifies the effectiveness of electrolytic hydrogen production and storage systems as flexible loads in enhancing the hosting capacity of distribution networks, significantly improving grid operational flexibility, and source-network-load-storage coordination. These findings provide a technical pathway for the synergistic planning of high-renewable-penetration power systems, highlighting the critical role of electro-hydrogen coupling in balancing economic efficiency and technical reliability in modern ADN.Keywords
The proposal of “double carbon” goal increases the pressure of power structure transformation [1]. Accelerating the upgrading and retrofitting of distribution networks to enhance their hosting capacity and operational flexibility for accommodating renewable energy and diverse loads [2] represents a primary objective of the modern power system. Under these conditions, the new power system confronts significant challenges in areas like planning, dispatching, and operational maintenance [3]. Hence, hydrogen generation and storage can offer a solution by enhancing system flexibility [4]. Integrating fuel cells with hydrogen systems into ADNs can effectively promote the accommodation of wind-solar energy and optimize the energy structure, enabling local consumption of clean energy. Consequently, the planning, configuration, and coordinated operational optimization of electro-hydrogen coupling systems in ADN have become urgent issues to be addressed in current research. Scholars worldwide have conducted multifaceted research on the planning and operation of ADN and electric-hydrogen coupling systems.
In terms of system optimization and control strategies, the renewable energy-based hydrogen and synthetic fuel production is achieved through renewable energy systems with energy storage and hydrogen technologies in [5]. The minimum levelized cost of energy is subsequently calculated. Reference [6] proposes a decentralized energy management scheme implementing real-time pricing-based demand response for electricity-hydrogen sectoral coupling dispatch in DC microgrids. Reference [7] establishes an optimization model for distribution networks with energy storage and photovoltaics, the voltage curve has been improved, transmission losses have been reduced, and peak demand has been lowered. Additionally, Ref. [8] presents a multi-objective optimization framework. It employs a genetic algorithm to collaboratively optimize the capacity configuration and siting layout for solar, wind, and other energy sources. References [9,10] respectively propose a coordinated planning method for electro-hydrogen integrated energy systems considering life-cycle carbon emissions and an optimization model targeting minimized economic operation costs, CO2 reductions, and energy loss reductions. However, both studies neglect the uncertainty of wind and solar power generation in their planning processes.
In the field of multi-energy coupling and optimal configuration, reference [11] proposes a Hierarchical Energy Hub Planning approach for energy hub configuration. The approach optimizes the capacity, location, and number of energy hubs at each hierarchical level, and conducts hierarchical evaluations on the economic feasibility and reliability of the system. While accounts for the uncertainty of Renewable Energy Sources other parameters are treated with constant values. The impacts of hydrogen-based systems and conventional sector-coupling systems on total costs and CO2 emissions were quantitatively compared [12]. It developed a multi-objective optimization model aiming to minimize both total costs and CO2 emissions. A comprehensive assessment of a hydrogen production system based on renewable energy sources such as solar and wind power, along with an economic and environmental analysis of the system, was presented [13]. The construction and maintenance costs of power-to-hydrogen systems were incorporated into the optimization model [14]. A complementary system of pumped-hydro storage, battery energy storage, and hydrogen storage was established to optimize wind-solar-hydrogen energy storage systems for enhanced renewable energy accommodation [15]. The economic viability of hydrogen energy storage for excess electricity in wind power plants was investigated [16]. Additionally, reference [17] aims to minimize the average annual cost and power supply loss probability when optimizing an integrated grid-connected power system comprising wind, solar, batteries, and fuel cells.
In the field of uncertainty handling and robustness optimization, references [18,19] both adopt stochastic robust optimization techniques: the forme significantly reduces the operating costs of microgrids, while the latter addresses the day-ahead scheduling problem of a microgrid with wind, photovoltaic, micro-turbine distributed generators, and batteries. Reference [20] is based on stochastic programming theory, develops a two-stage stochastic programming model for multi-microgrid planning. The optimal operation of intelligent microgrids (MGs) under high-penetration renewable energy scenarios was addressed using a stochastic programming approach [21]. To overcome the limitations of traditional single-stage planning methods, a multi-stage dynamic programming model for hydrogen-electricity coupled microgrids was proposed [22], aiming to balance uncertainty management and long-term economic viability.
Overall, existing studies primarily focus on microgrids and park-integrated energy systems, while neglecting the correlation characteristics of wind and solar resources. To address this gap, this paper proposes a scheme for optimal configuration and coordinated operation of distribution networks based on wind-solar-hydrogen coupling. By accounting for wind-solar correlations and treating hydrogen production and storage systems as flexible loads within the distribution network, a bi-level optimization model is established. This model incorporates multiple indices, including an economic objective function for total life-cycle costs, voltage metrics, and the renewable energy accommodation rate, to closely integrate planning and operation. Simulation cases are conducted to validate the model’s effectiveness and economic efficiency in enhancing grid flexibility and renewable integration.
2 Electricity-Hydrogen Coupling System
The electro-hydrogen coupling system achieves efficient optimal allocation of energy through the mutual conversion, storage, and collaborative utilization of electrical energy and hydrogen energy. This section mainly focuses on modeling the hydrogen production system, hydrogen storage tank, fuel cell, and wind-solar scenarios.
2.1 Operation Framework of Electro-Hydrogen Coupling System
The framework of the electricity-hydrogen coupling system (EHCS) studied in this paper, as illustrated in Fig. 1, comprises an ADN, Wind power, photovoltaic, electrolysis cells, hydrogen storage tanks and fuel cells. The electrolysis cell, hydrogen storage tank and fuel cell are simplified as a single node integrated into the regional grid, namely the EHS node. Hydrogen storage is used to replace battery energy storage, with energy supplied to the power system and hydrogen load terminals through fuel cells and hydrogen storage tanks. This approach enables the accommodation of renewable energy, ensures stable system operation, and enhances the proportion of renewable energy utilization. The energy flow in the system is as follows: Most of the load is met by wind power generation and PV power generation, with any shortfall in wind-solar output supplemented by the utility grid. Excess electricity generated by wind and solar power is transmitted to electrolyzer units for hydrogen production, which is then stored in hydrogen storage tanks. Fuel cell utilizes the stored hydrogen to supply energy to the system and hydrogen load terminals when needed, thereby enabling the absorption of renewable energy, ensuring stable system operation, and improving the utilization rate of renewable energy.
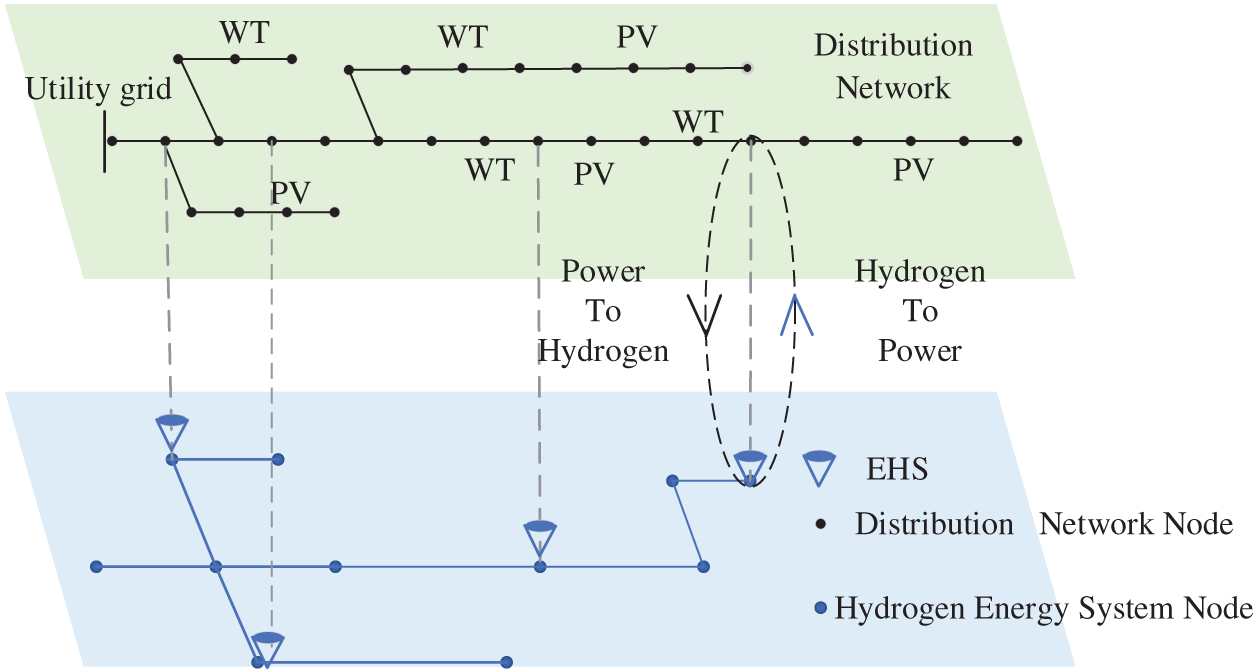
Figure 1: Framework diagram of electro-hydrogen coupling system
2.2 Models of Related Equipment for Electro-Hydrogen Coupling System
2.2.1 Electrolyzer Hydrogen Production Model
Electrolyzer-based hydrogen production technology is a key to achieving energy transition. The mathematical model is as follows.
where,
2.2.2 Hydrogen Storage Tank Model
A hydrogen storage tank is a core component of the hydrogen energy storage system. It is used to store hydrogen and address the spatiotemporal mismatch between hydrogen production and application.
where,
2.2.3 Hydrogen Fuel Cell Model
Hydrogen fuel cell is a device that directly converts the chemical energy of hydrogen into electrical energy through electrochemical reactions. The mathematical model is as follows.
where,
2.3 Scenario Generation Considering Uncertainties and Correlations of Wind and Solar
The output characteristics of wind and solar power generation exhibit significant stochastic volatility due to natural attributes, and there exists certain temporal correlation between the output sequences of wind and solar power plants in the same region. If traditional planning methods adopt deterministic assumptions or isolated modeling approaches, the resulting plans will deviate from the optimal state. Therefore, when determining the optimal configuration scheme for the system, it is essential to consider the uncertainties and correlations of wind and solar power outputs. Copula functions can characterize the correlations among random variables by linking their joint distribution function to their respective marginal distribution functions. Meanwhile, parametric distribution models are commonly employed when studying the probability distribution models of wind speed and solar irradiance. Parametric methods (Weibull distribution, Beta distribution) [23] require pre-specifying the theoretical distribution forms of variables and achieving model fitting through parameter estimation. However, these methods heavily rely on distributional assumptions, which may cause them to overlook the dynamic coupling between wind speed and solar irradiance. As a result, they fail to adapt adequately to complex patterns in real-world data, and may even produce significant deviations [24]. In contrast, non-parametric methods do not require prespecifying the distribution type. Instead, they characterize variables solely through data-driven approaches. These methods directly reflect the power output profiles of wind and solar resources from historical datasets. In summary, the specific steps for scenario generation considering wind-solar correlations in this paper are as follows:
(1) First, data preprocessing and marginal distribution modeling are conducted. Based on historical data of 8760 h wind turbine and PV outputs (one data point per hour), For each time segment within 24 h, generate probability density functions of wind and photovoltaic power output. Gaussian kernel functions are selected through non-parametric kernel density estimation to create.
In the formula, t = 1, 2, …, 24 represents 24 time intervals.
Then, for each variable X and Y (wind power and PV power), find the optimal probability density function
where,
(2) Map the data to a uniform distribution through the cumulative distribution function (CDF). For each variable X, compute its uniform distribution value U.
When generating scenarios via inverse transformation,
(3) Decompose the multi-dimensional joint distribution using the R-Vine structure, factorizing the three-dimensional joint distribution into a product of bivariate Copula and marginal distribution:
(4) Scenario generation is implemented via inverse transform sampling. First, generate uniform distribution samples based on the Copula function:
Then, obtain physical scenarios through inverse transformation:
(5) Considering the excessively large data sample size, a backward reduction algorithm is adopted to balance speed and accuracy in scenario reduction. First, calculate the distance matrix among all scenarios:
Then identify the pair of scenarios
where,
Finally, remove scenario
(6) For each variable in the retained scenarios, verify the consistency between its empirical CDF and the original data’s CDF by comparing them with the CDF:
3 Bi-Level Optimization Model for ADN with Electric Heating System
This paper aims to comprehensively consider operational strategies in the system planning phase. It also seeks to tightly integrate planning with operations. Meanwhile, the study addresses how uncertainties impact system optimization and coordinated operation. Based on these considerations, this paper establishes an optimization model for distribution network siting, sizing, and operation. The upper layer solves the siting and sizing problem, with the objective function being the total lifecycle cost, including investment costs, operation and maintenance costs, electricity purchase/sales costs, penalty costs for wind and solar curtailment, and equipment disposal costs. The lower layer addresses the coordinated operation of the distribution network, with the objective function incorporating a contribution degree function considering peak-valley price differential benefits, a Voltage Distribution Equilibrium Metric (VDEM), and a renewable energy utilization rate indicator.
3.1 Upper-Level Site-Selection and Capacity-Sizing Model
The electricity-hydrogen system can utilize electrolyzers to convert surplus wind and solar power into hydrogen energy for storage, and then feed the hydrogen back into the grid through fuel cells, thereby smoothing the fluctuations of renewable energy and reducing the power curtailment rate. However, increasing the capacity of hydrogen production devices, the scale of hydrogen storage tanks, and the power of fuel cells can enhance the system’s regulation capability. This enhancement, however, will lead to significant increases in equipment investment and operation and maintenance costs. Additionally, it may even cause economic deterioration due to over-configuration. Therefore, how to reasonably site and size hydrogen production, hydrogen storage, and fuel cells to reduce the system’s wind/solar curtailment rate while ensuring the system’s economy is the key issue addressed in this paper. In summary, this study develops a lifecycle cost model for the system from a holistic lifecycle perspective, while proposing an economic performance metric C1 that integrates revenue from electricity and hydrogen sales.
where,
where,
where,
3.2 Lower-Level Coordinated Operation Model
This study aims to address the spatio-temporal imbalance between power sources and loads caused by high renewable energy penetration. It proposes a flexible load optimal dispatch method based on hydrogen production-storage coordination. The method constructs an “electricity-hydrogen-electricity” bidirectional coupling system. This system converts curtailed wind and solar power into hydrogen via water electrolysis for storage, and then uses fuel cells to convert hydrogen back into electricity. By dynamically matching sources and loads, this method mitigates fluctuations in renewable generation, improves peak-valley differences and nodal voltage violations, and enhances renewable energy integration. The lower-level operation model schedules equipment with objectives of maximizing peak-valley arbitrage contribution, voltage distribution balance, and renewable energy consumption.
3.2.1 Contribution Degree Function Considering Peak-Valley Difference Benefits
Given the significant difference in current time-of-use electricity prices between peak and valley periods, this study utilizes hydrogen production and storage as flexible loads in distribution networks. By leveraging the “low-price storage and high-price discharge” characteristic to generate profits, a contribution degree reward function is established to improve the load curve, achieve peak shaving and valley filling, and mitigate active power fluctuations caused by the uncertainty of wind and solar energy.
where,
3.2.2 Voltage Distribution Equilibrium Metric
Node voltage deviation is commonly used to characterize voltage distribution, but it is difficult to reflect the overall voltage distribution in large systems. This paper proposes a VDEM that comprehensively captures voltage distribution, including the absolute value of voltage deviations and the degree of dispersion in these deviations.
where,
3.2.3 Renewable Energy Consumption and Absorption Rate
The renewable energy consumption and absorption rate index refers to the ability of adjustable resources within a region to mitigate net load fluctuations during the dispatch cycle. It helps evaluate and optimize the renewable energy integration and load regulation capabilities of distribution networks across different time periods.
where,
(1) Power Output Constraints of the EHES
(2) Capacity Constraints of the Hydrogen Production System and Fuel Cells
where,
(3) Hydrogen Storage System Constraints
The sum of hydrogen consumed by power generation and stored hydrogen equals the hydrogen produced by the electrolyzer.
where,
(4) Branch Power Constraints
where, a is the transmission power of the distribution network line, and b and c are the maximum and minimum values of the branch power.
(5) Node Voltage Constraints
The node voltage must be within the allowable range (±5% of the rated voltage in this paper) to avoid equipment damage or power supply quality issues for users.
(6) Power Balance Constraints
where,
3.4 Solution Algorithm of the Model
Differential Evolution (DE) algorithm [25] is an effective technique for solving complex optimization problems. DE algorithm possesses memory capabilities that enable it to dynamically track the current search status, adjust its search strategy accordingly. There is no need for it to feature information of the problem, can directly operate on structural objects, imposes no restrictions on the objective function, and is suitable for solving complex optimization problems. For the bi-level optimization model of the ADN system established in this study, its solution belongs to a multi-objective non-linear optimization problem. Therefore, the DE algorithm is used in the upper-layer optimization to solve the optimal site selection and capacity configuration scheme of the system, with the CPLEX solver being used in the lower-layer optimization to solve the collaborative operation scheme under the upper-layer configuration. The bridge between the DE algorithm and the mathematical model is the variables to be predicted, including the capacity of each system and the site selection of each system. The detailed solution procedure is illustrated in Fig. 2.
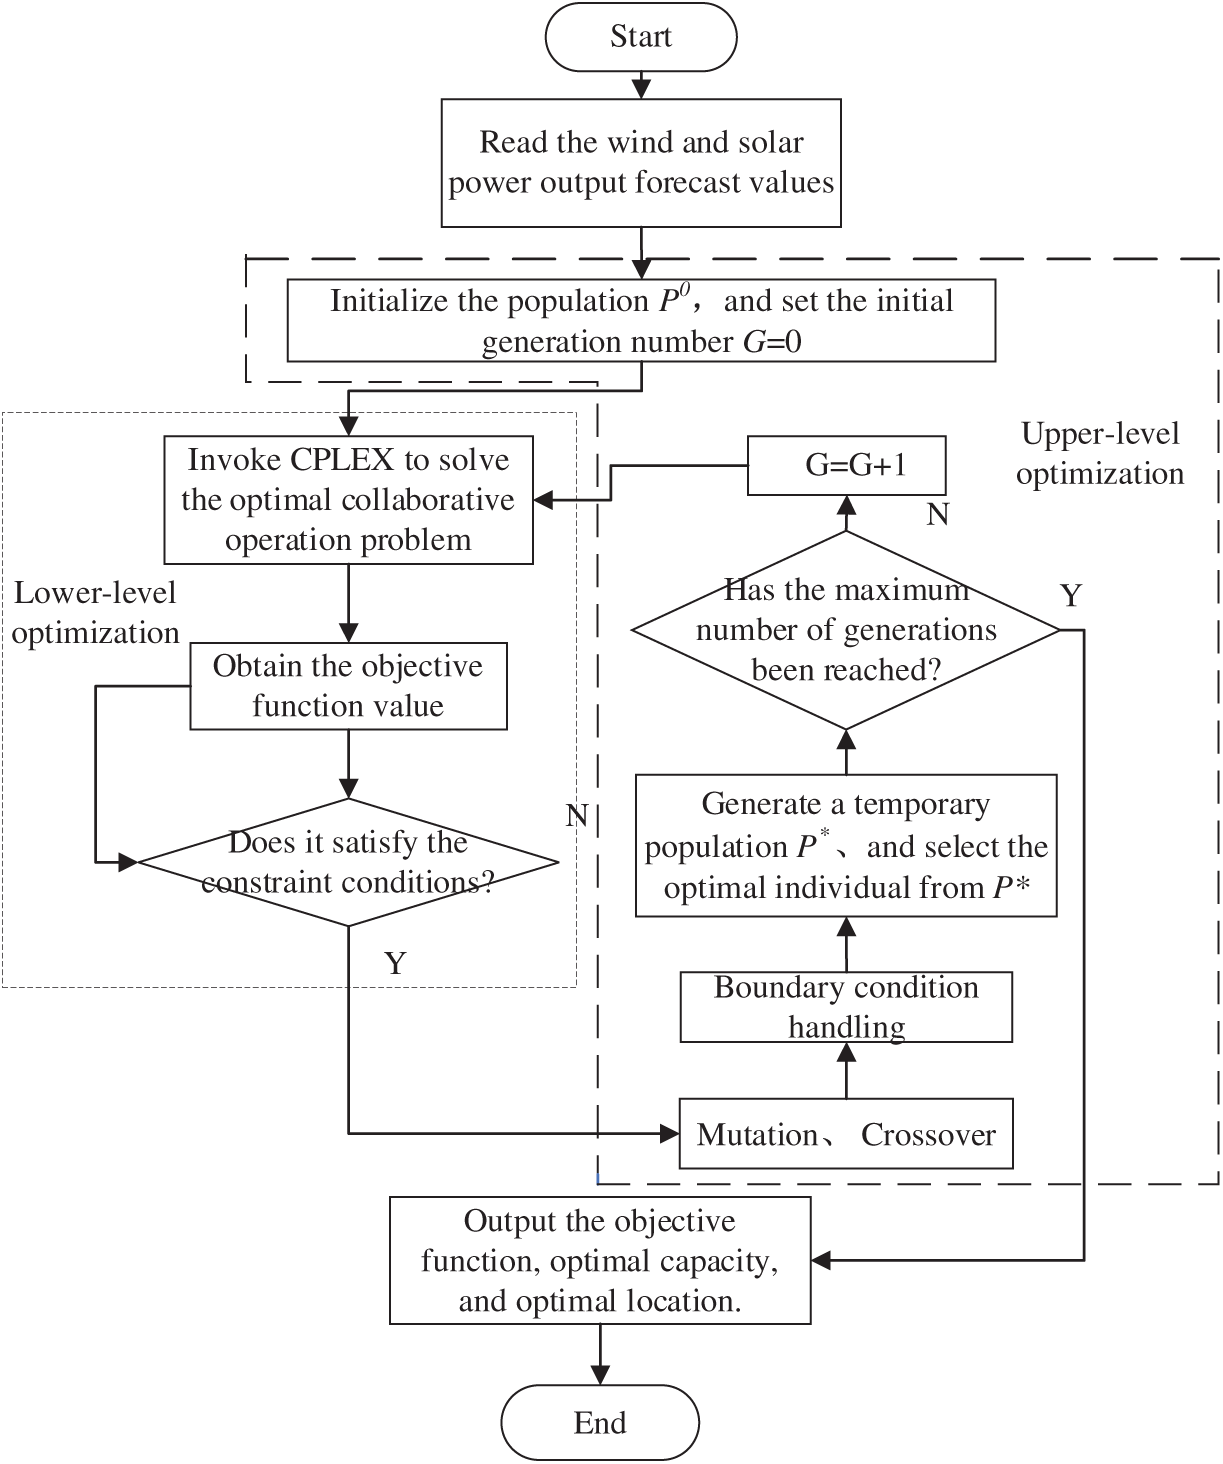
Figure 2: Framework diagram of electro-hydrogen coupling system
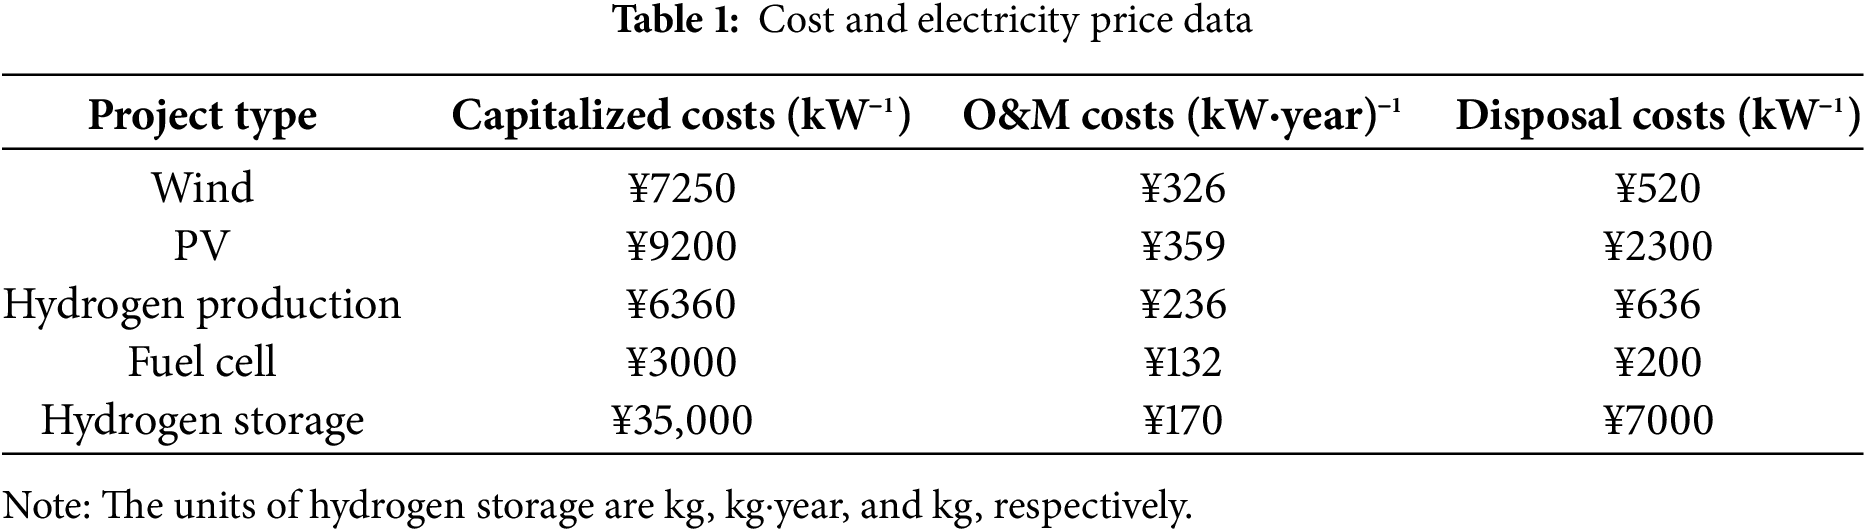
To evaluate the validity of the planning model and its solution algorithm, this paper uses a 33-node system case study. The location distribution of each node and the setting of load parameters refer to the IEEE 33-node system. The beginning active load for the system is 3715 kW, while the reactive load is 2300 kVar. The planned voltage level is 10 kV, the dispatch cycle is 24 h, and the planning horizon is 20 years. Nodes 2–33 are available for connecting hydrogen production and storage systems. The cost data used in the case study are derived from the literature [26], as shown in Table 1.
Historical 8760 h wind turbine and PV output data from a wind farm and PV plant in China’s western region were selected as initial inputs for wind-solar scenario generation. The parameters of the EHES components are listed in Table 2, and the objective function parameters are provided in Table 3. Since no independent feed-in tariff mechanism exists for fuel cells, the average feed-in tariffs of wind and PV power are adopted. Time-of-use electricity prices are illustrated in Fig. 3. ADN is divided into four zones, with hydrogen production-storage systems deployed as flexible loads within these zones. Fig. 4 illustrates the distribution network topology and zoning configuration.
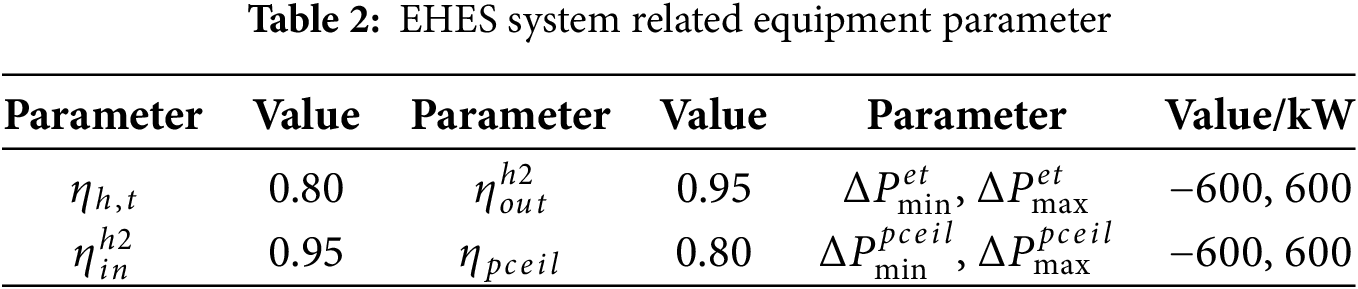
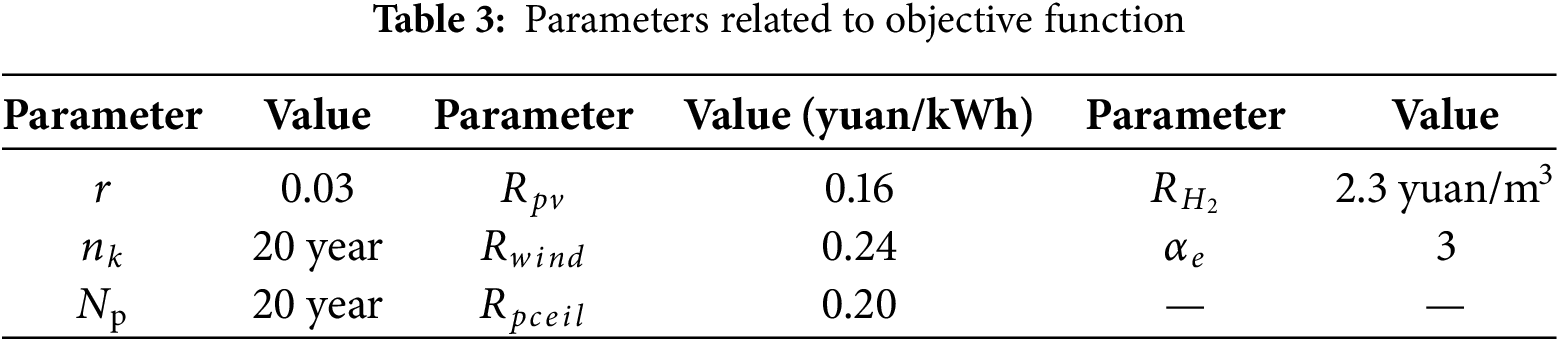
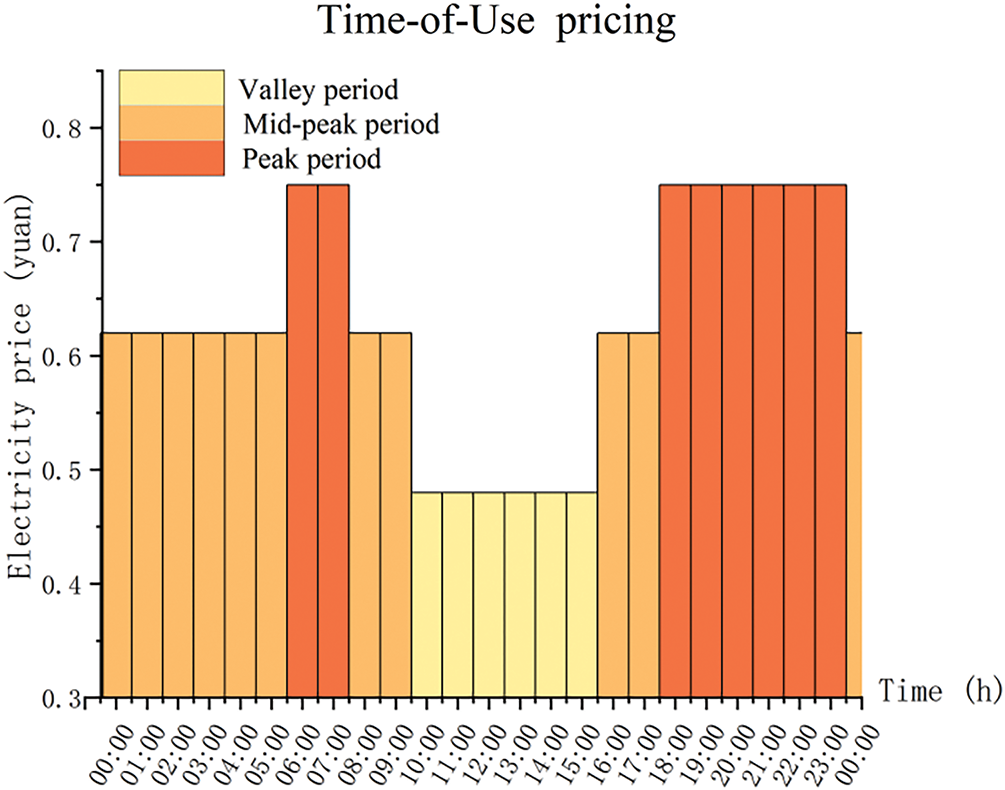
Figure 3: Time-of-use electricity price diagram
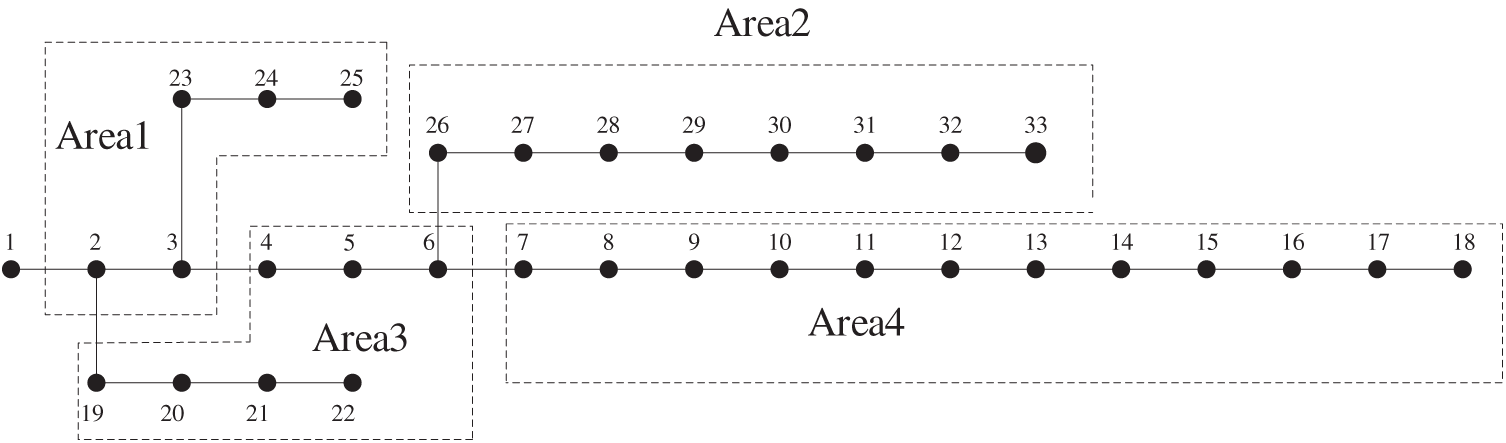
Figure 4: Structure diagram of IEEE-33 node distribution network
4.2 Analysis of Scenario Generation for Wind and Solar Uncertainty and Correlation
To address the computational challenges posed by large-scale wind and PV scenarios, a backward reduction algorithm was employed to reduce the scenarios to four representative cases. The algorithm directly outputs the reduced scenarios along with their corresponding probabilities after execution. Fig. 5 shows the wind power output scenarios, the Fig. 6 shows the PV output scenarios, and Fig. 7 shows the occurrence probabilities of wind and solar power outputs in each scenario. Through the analysis of Figs. 5 and 6, it can be seen that the output characteristics of PV and wind power in each typical scenario exhibit significant seasonal and temporal patterns. Specifically, the data in Fig. 5 shows that Scenarios 3 and 4 exhibit significantly increased PV irradiance during summer periods, and their power output curves are consistent with the characteristics of high daytime radiation intensity and long duration in typical summers. Scenario 2 exhibits transitional seasonal characteristics, with its output level falling between winter and summer conditions, reflecting the changing patterns of light conditions in spring and autumn. In Scenario 1, the PV output level is significantly reduced, and its low irradiance characteristics are consistent with the physical laws of reduced solar altitude angles and shortened sunshine hours in winter. In summary, the scenario generation outcomes capture the stochastic characteristics and interdependencies of wind and PV generations. which can well simulate the wind-solar output characteristics in Northwest China and facilitate the integrated planning and functioning of the system.
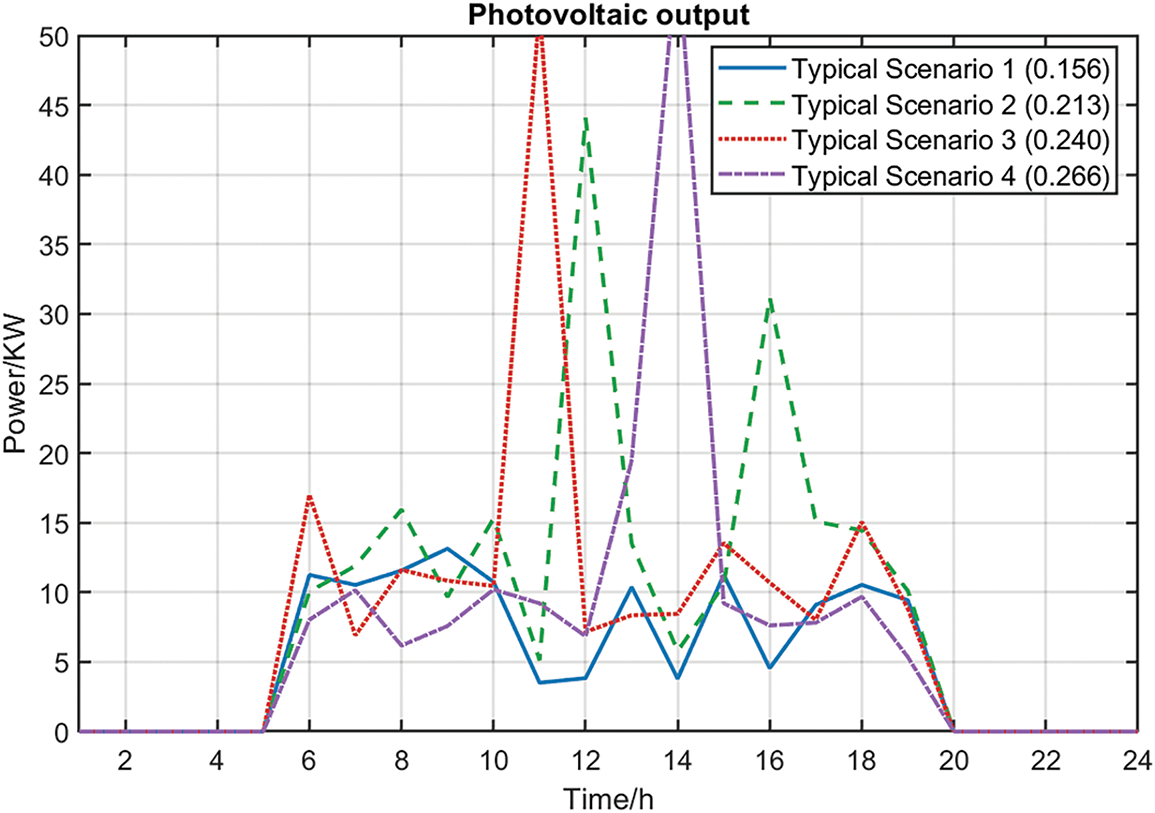
Figure 5: Photovoltaic output
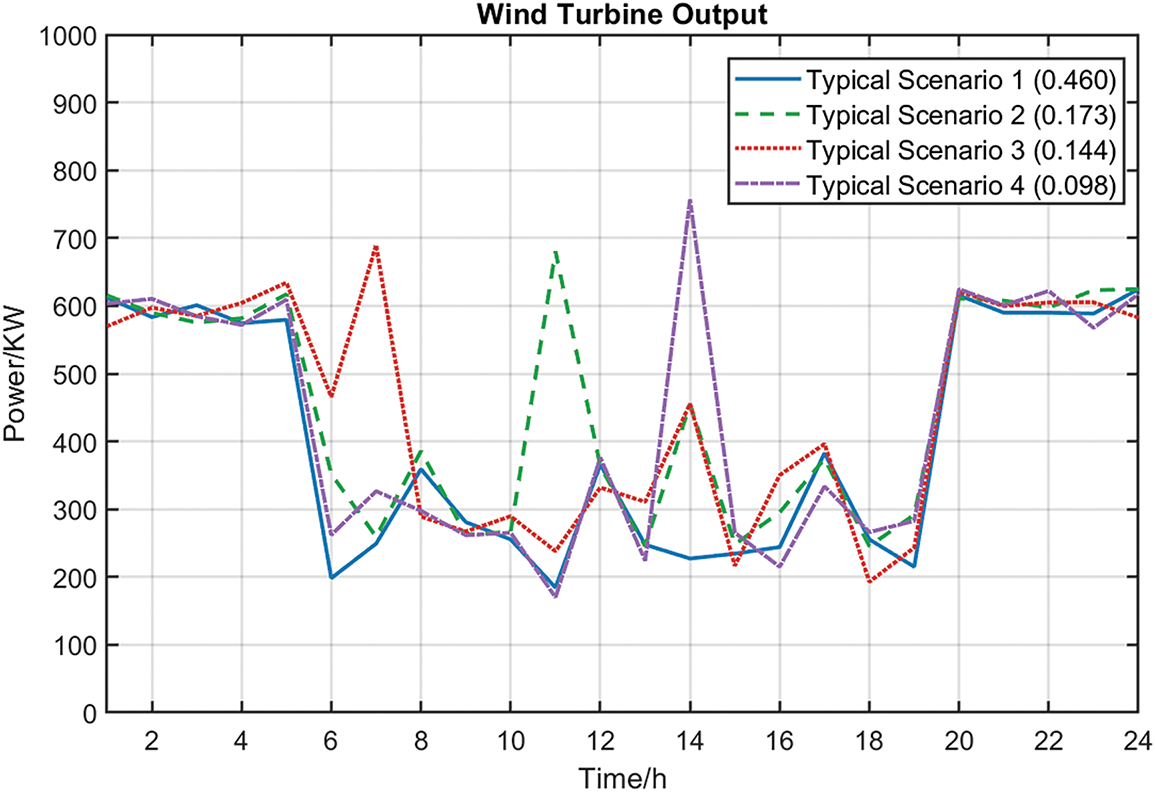
Figure 6: Wind turbine output
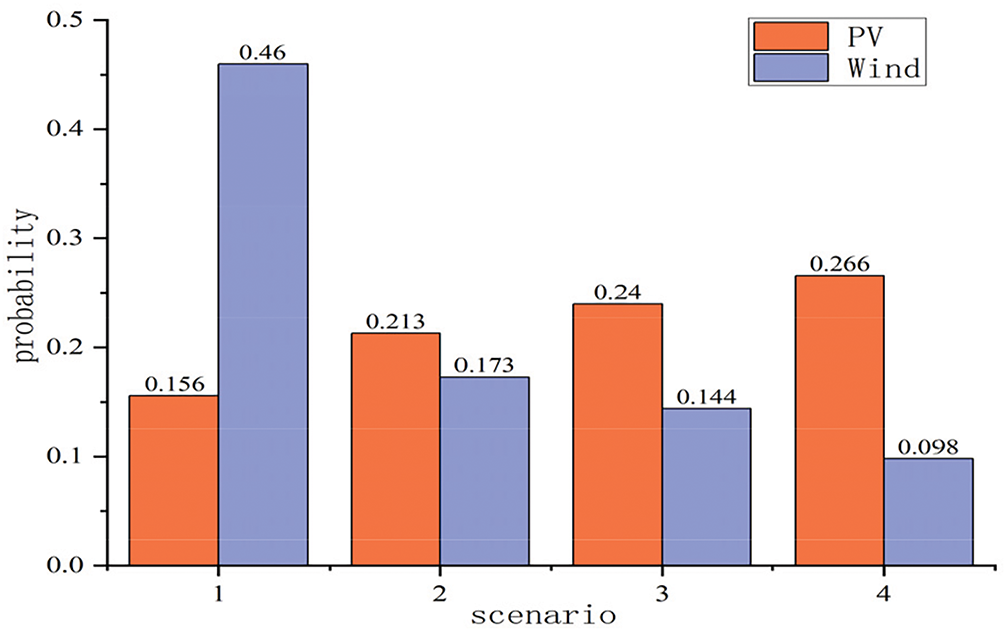
Figure 7: The output probability of various landscape scenarios
4.3 Analysis of Bi-Level Optimization Results
4.3.1 Analysis of Bi-Level Optimization Results
To test the validity of the created model and algorithmic framework, two different scenarios are selected for case simulation analysis, as follows:
Scenario 1: Without EHS integration
Scenario 2: With EHS integration
As shown in Fig. 8, the maximum node voltage in the pre-optimized system reaches 1.184, exceeding the upper voltage limit. Moreover, voltages at all nodes remain relatively low during certain periods, likely due to high user loads in those intervals combined with the absence of power supply from fuel cells, resulting in voltage depression. After configuring hydrogen production and storage systems, the overall voltage level of the system has been improved, with all voltages remaining within the specified range. According to Table 4, the voltage distribution balance index is 3.15%, indicating that the system voltage deviation has been further reduced, effectively suppressing voltage fluctuations. This also verifies the effectiveness of hydrogen production and storage in improving system voltage deviations.
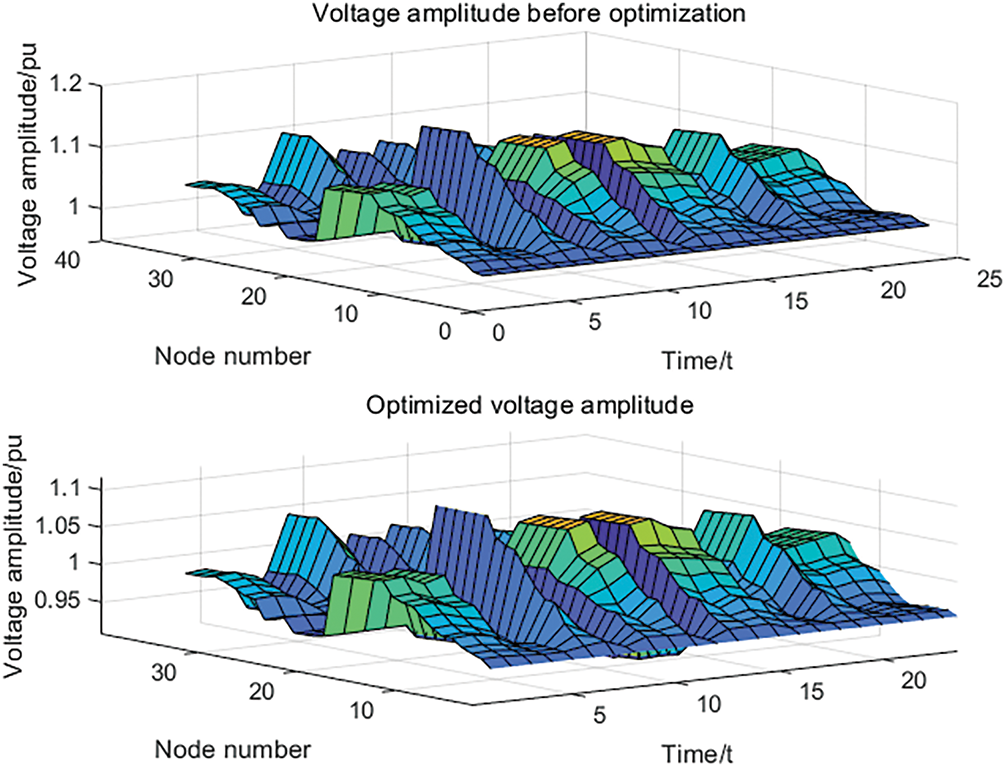
Figure 8: Voltage curve
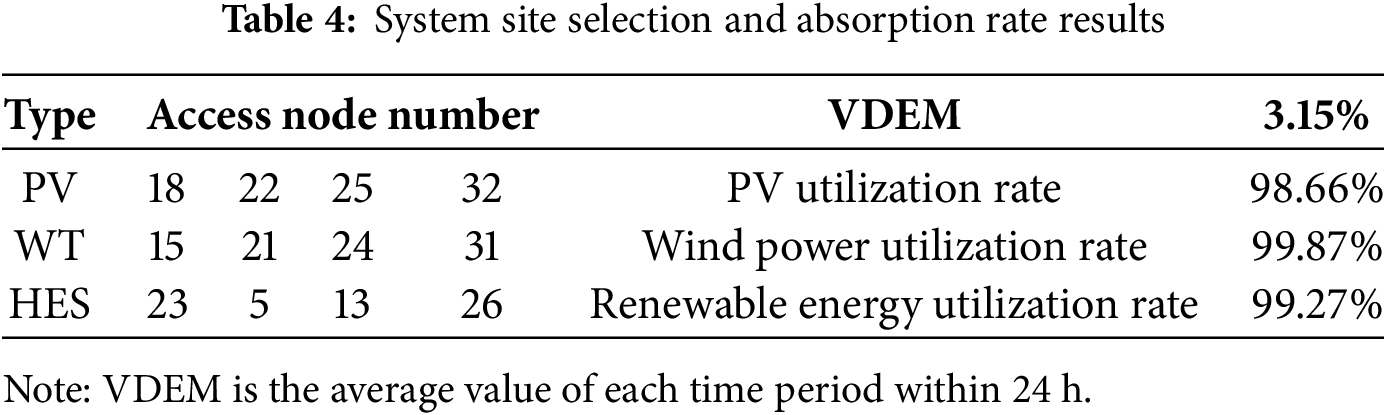
Table 4 presents the system site selection results and lower-layer scheduling indicators; Table 5 shows the configuration result data. It is evident that after dividing system into four zones and applying the site selection and capacity configuration model proposed in this paper, reasonable hydrogen production, storage, and fuel cell capacities can be configured according to the given zones and their load conditions. Table 6 presents the system cost planning. This reveals that after configuring the HES, the energy curtailment cost decreased from 354,629.1279 to 231,919.8529 yuan, a 34.6% reduction compared to Scenario 1, effectively reducing wind and solar curtailment waste. The system’s power purchase cost decreased from 234,216.89 to 82,041.44 yuan, a 64.97% reduction compared to Scenario 1, indicating that the system can achieve basic self-sufficiency after HES integration, thereby reducing the pressure on the power grid.
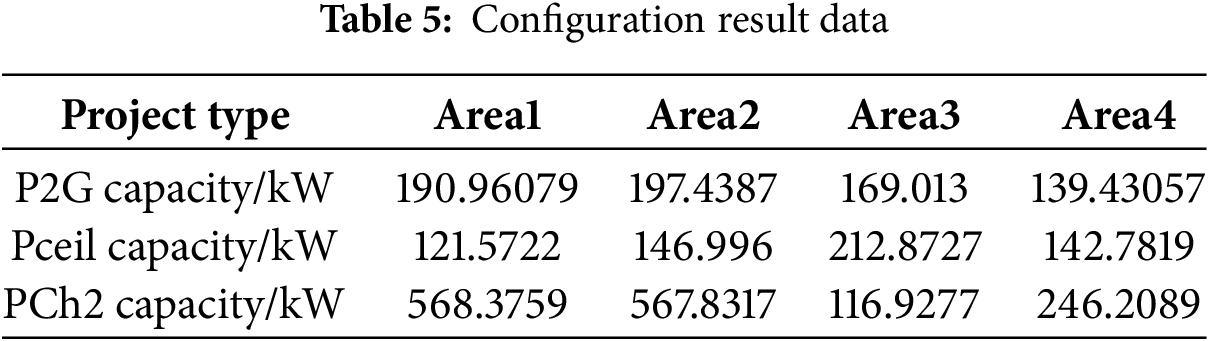
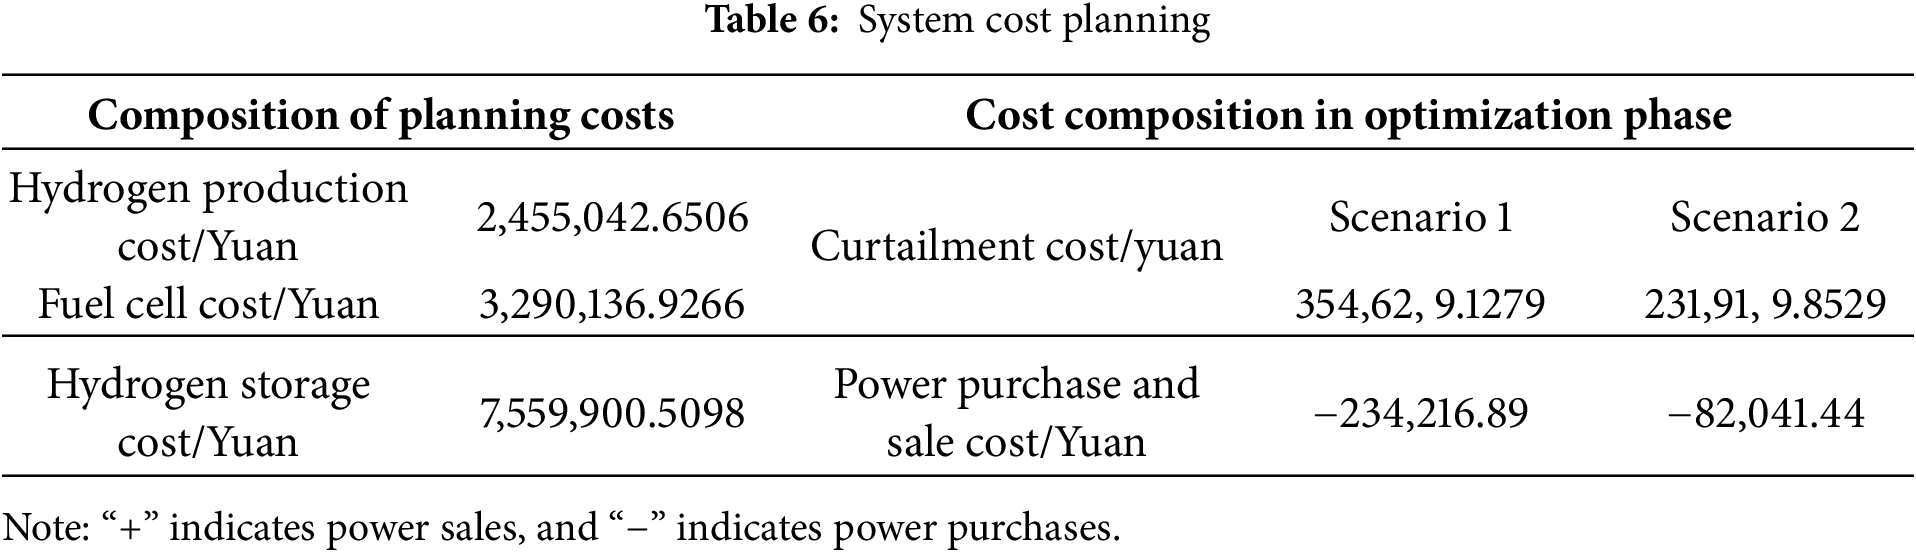
Fig. 9 shows the load dispatch diagram after system optimization. In the power curves with the integration of dispatch resources such as HES, remarkable peak-shaving and valley-filling effects are demonstrated. The results show that the optimization model is accurate and reliable. Its scheduling outcomes not only provide a reference for intraday dispatching but also serve as a basis for adjusting flexible loads such as HES. Hydrogen production is activated during the low-load period from 00:00 to 08:00, which coincides with abundant wind resources, thereby increasing wind power absorption. From 11:00 to 17:00, when solar irradiance is high, hydrogen production during this period also enhances PV utilization. During the peak load periods of 08:00–12:00 and 18:00–23:00, when the distribution network load increases, fuel cells generate power by consuming hydrogen stored during low-load periods. This lessens the electricity procured from the main grid and alleviates the influence of heightened load upon the power grid.
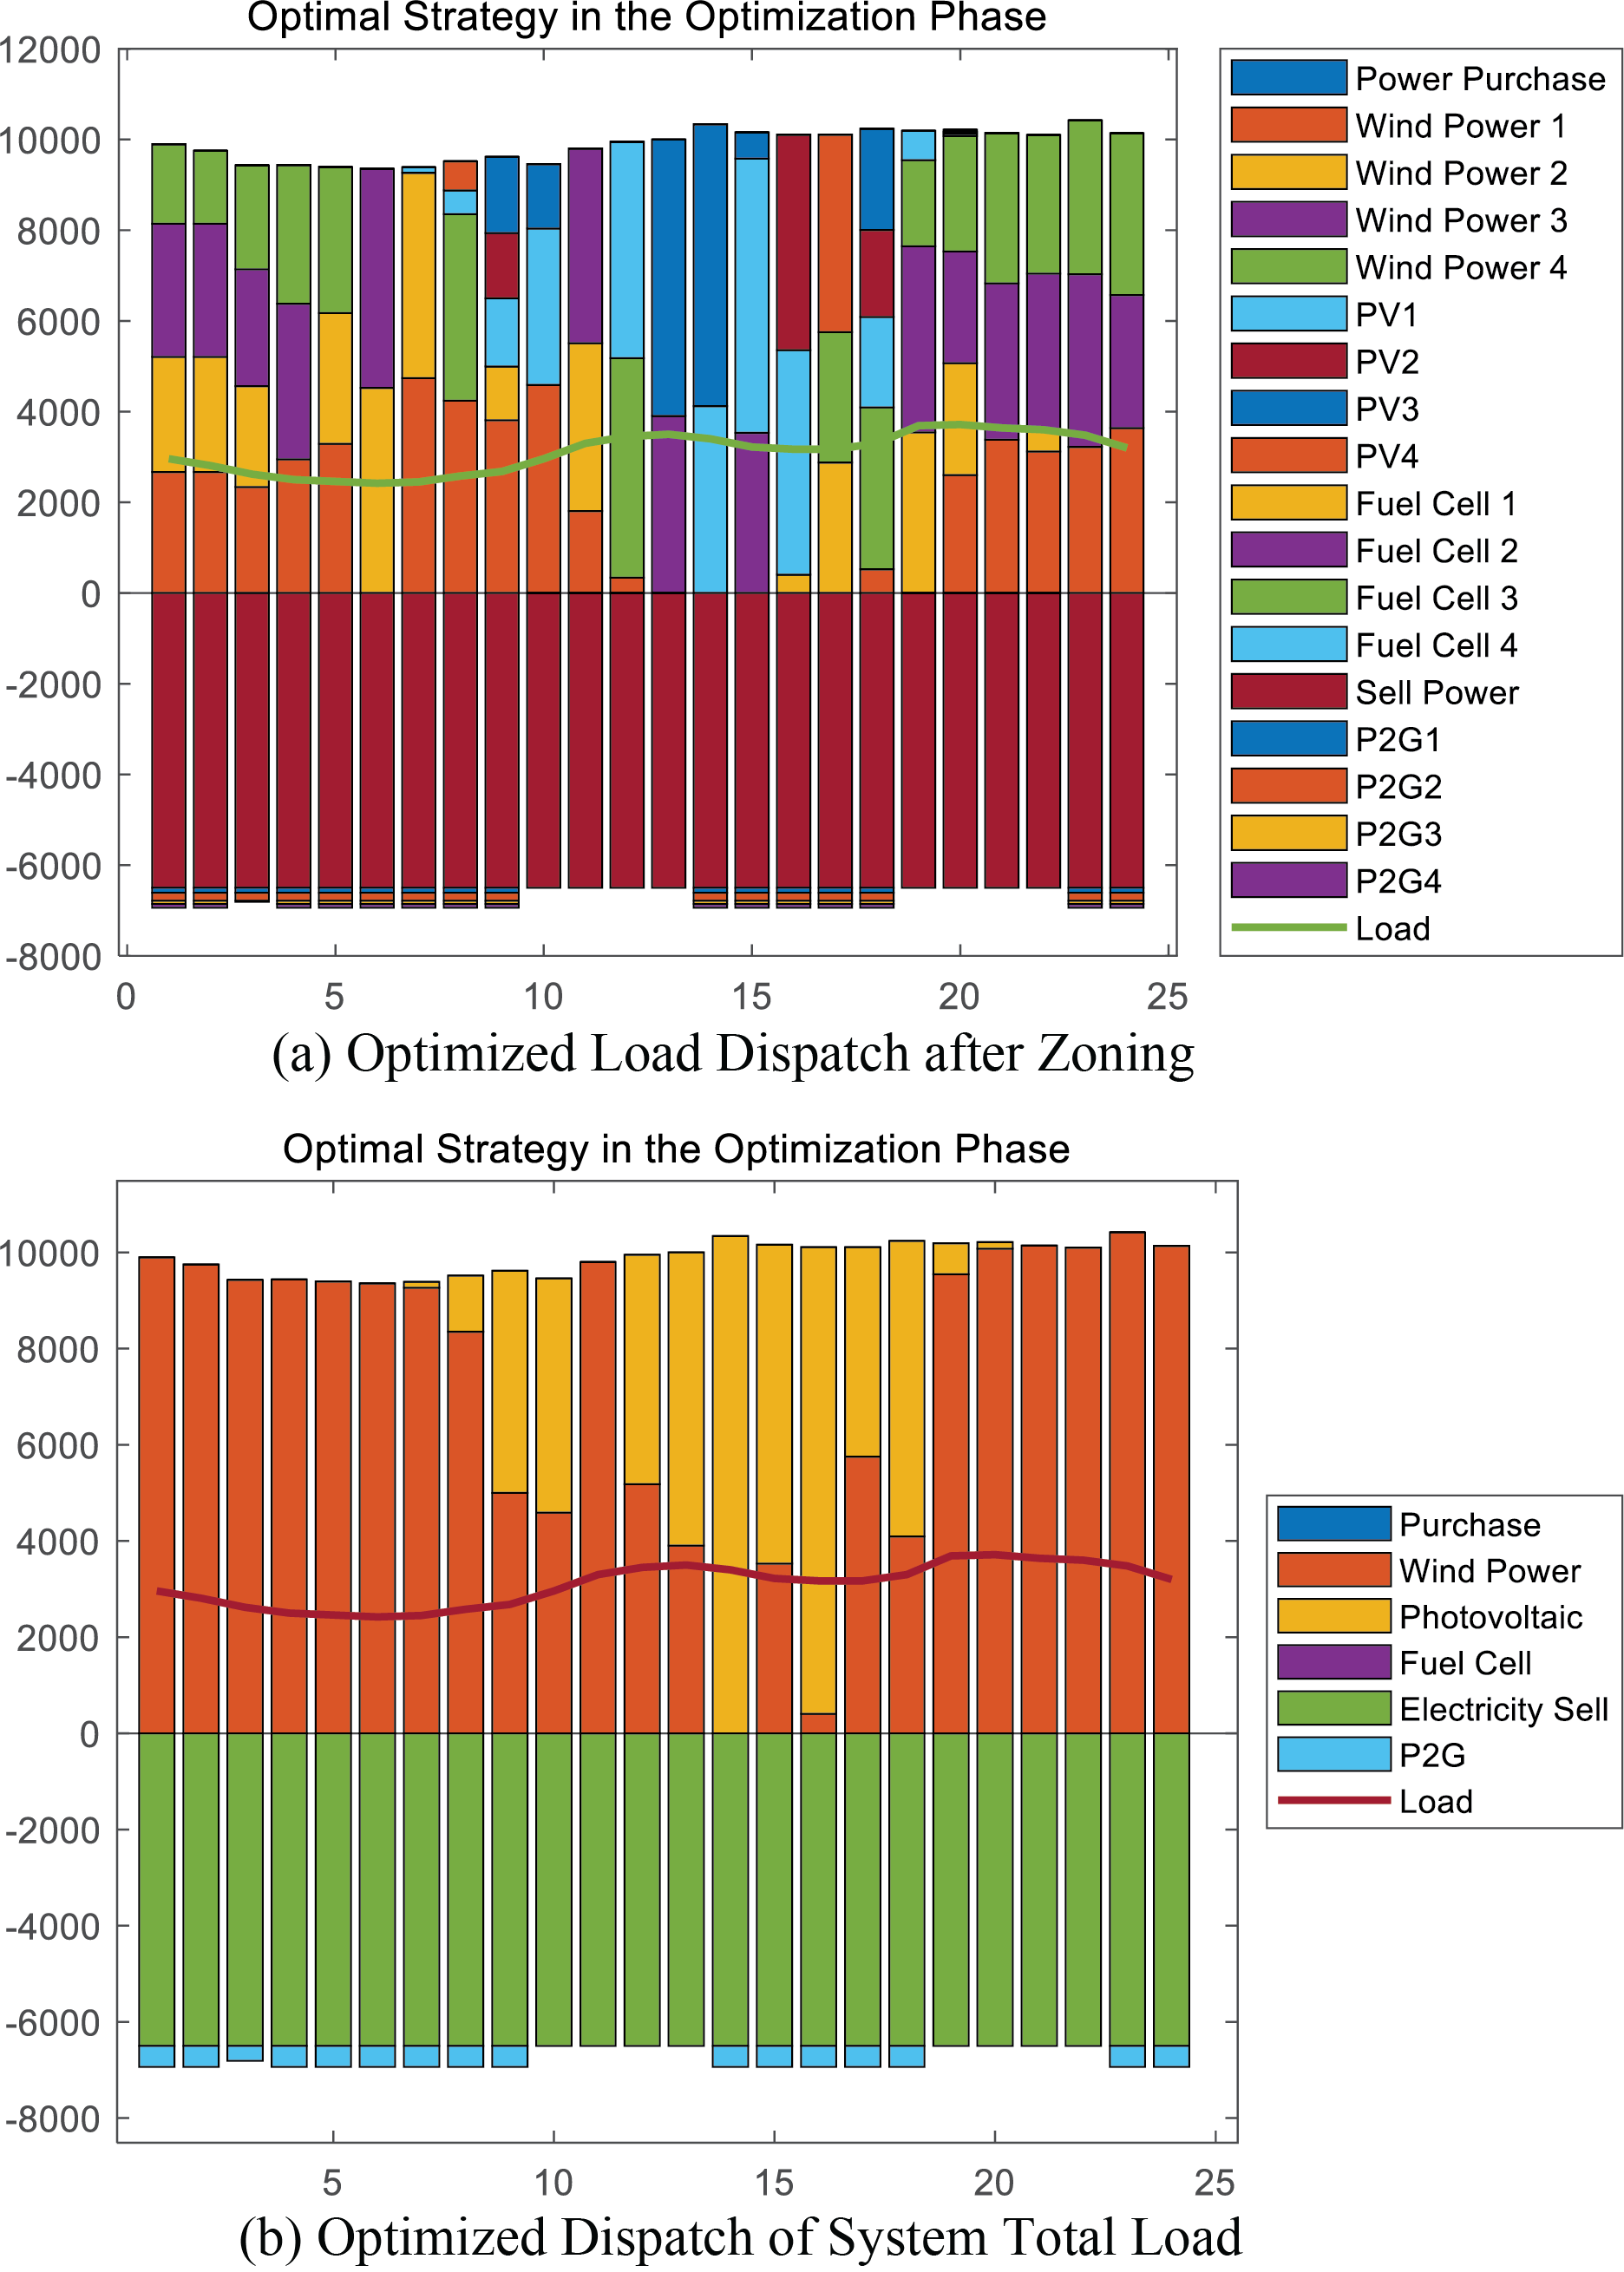
Figure 9: Optimization results of load dispatch
Throughout the process, when the load curve is in a low valley period and the grid has excess power output, hydrogen production is encouraged to increase load; when the curve is in a peak period and the grid has reduced power output, fuel cells increase power output to reduce load. The overall curve fluctuation is significantly reduced, alleviating the pressure on the distribution network. In summary, configuring hydrogen production and storage in distribution networks can cut down the system’s peak-valley difference, effectively improve the load curve, and utilize its low-cost storage and high-value discharge characteristics to enhance the overall economy of the system.
Figs. 10 and 11 show the absorption curves of wind power and PV power. Combined with Table 4, it can be seen that the PV absorption rate is 98.66%, the wind power absorption rate is 99.87%, and the new energy absorption rate is 99.27%. By means of proper deployment of hydrogen production and storage, wind and PV power within the system can be efficiently accommodated. Consequently, the incidence of wind and solar curtailment can be notably decreased, and efficient exploitation of renewable energy can be realized.
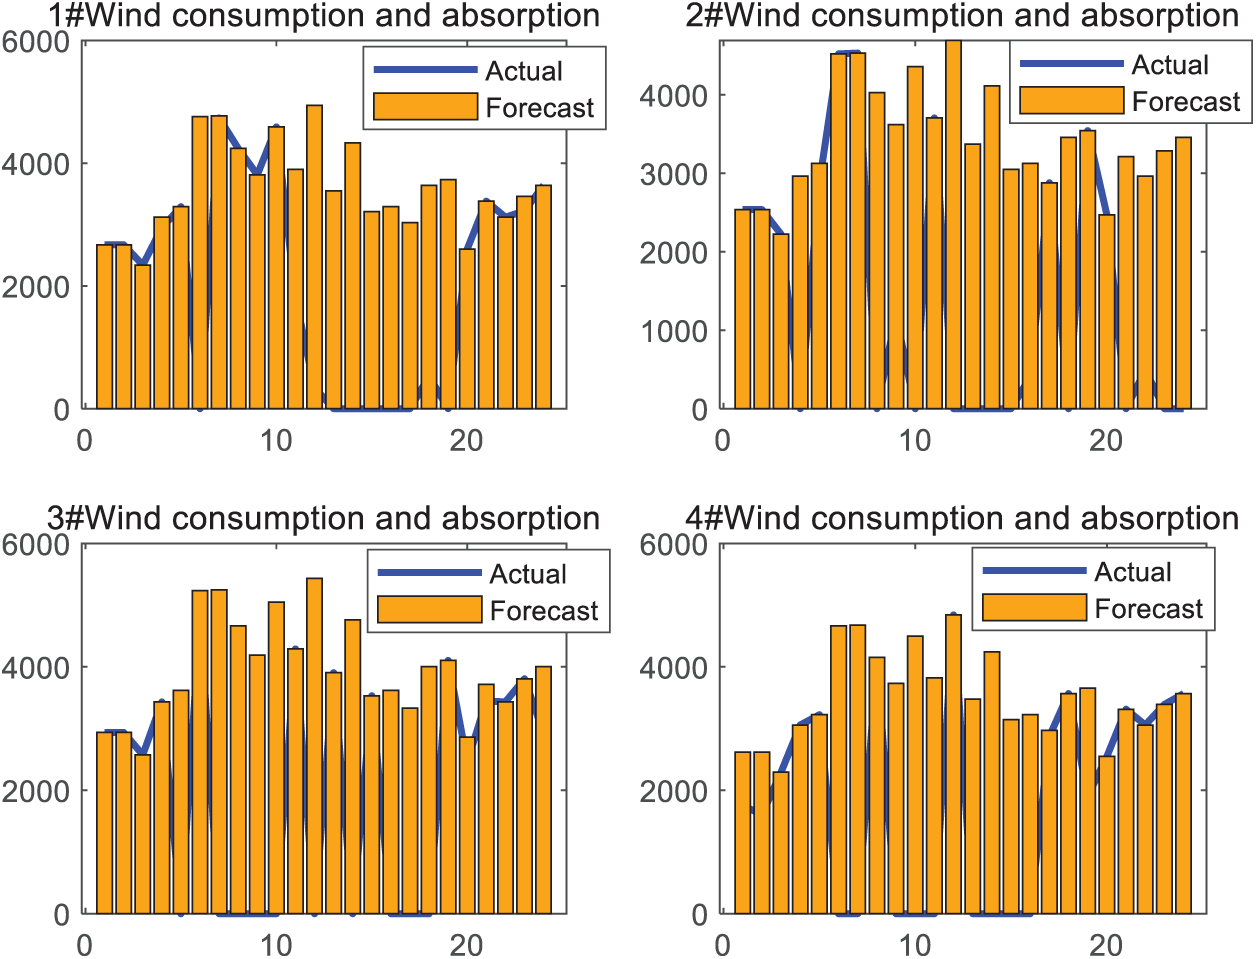
Figure 10: Wind power consumption and absorption situation
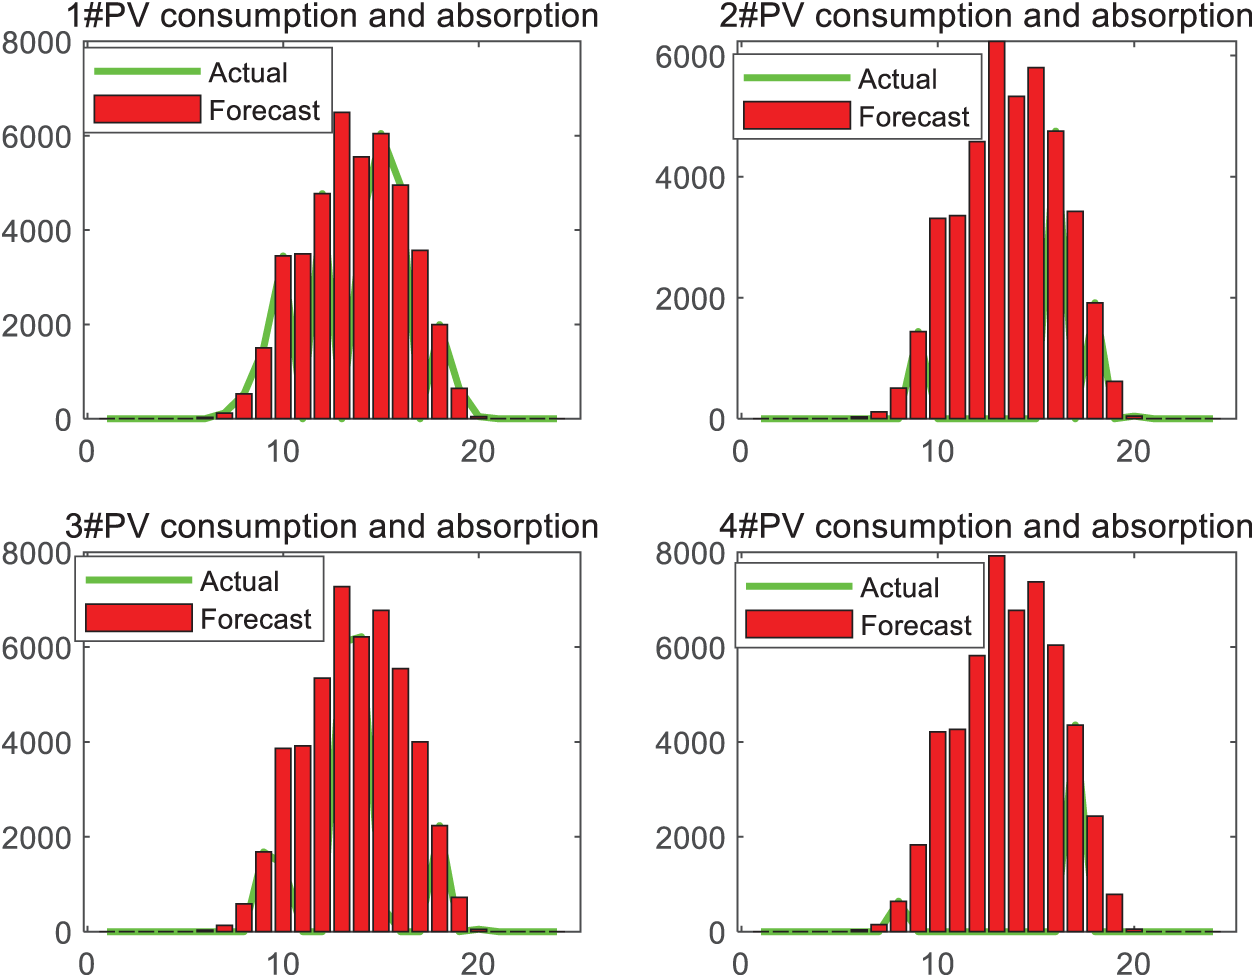
Figure 11: PV consumption and absorption situation
4.3.2 Comparative Analysis with Existing Technologies
To verify the superiority of the proposed distribution network based on wind-solar-hydrogen-storage, it is compared with the following benchmark schemes:
Scheme 1: power-to-hydrogen system
Scheme 2: wind-solar-energy storage hybrid system
Scheme 3: power-to-hydrogen system
Scheme 1 only includes an electrolyzer and a hydrogen storage tank without a fuel cell, realizing unidirectional power-to-hydrogen conversion. Scheme 2 is composed of wind turbines, photovoltaic panels, and battery energy storage, without hydrogen energy conversion links. Scheme 3, namely the wind-solar-hydrogen-storage coupling system, includes an electrolyzer, a hydrogen storage tank, and a fuel cell, achieving bidirectional “power-to-hydrogen-to-power” energy flow. The simulation results are shown in Table 7.
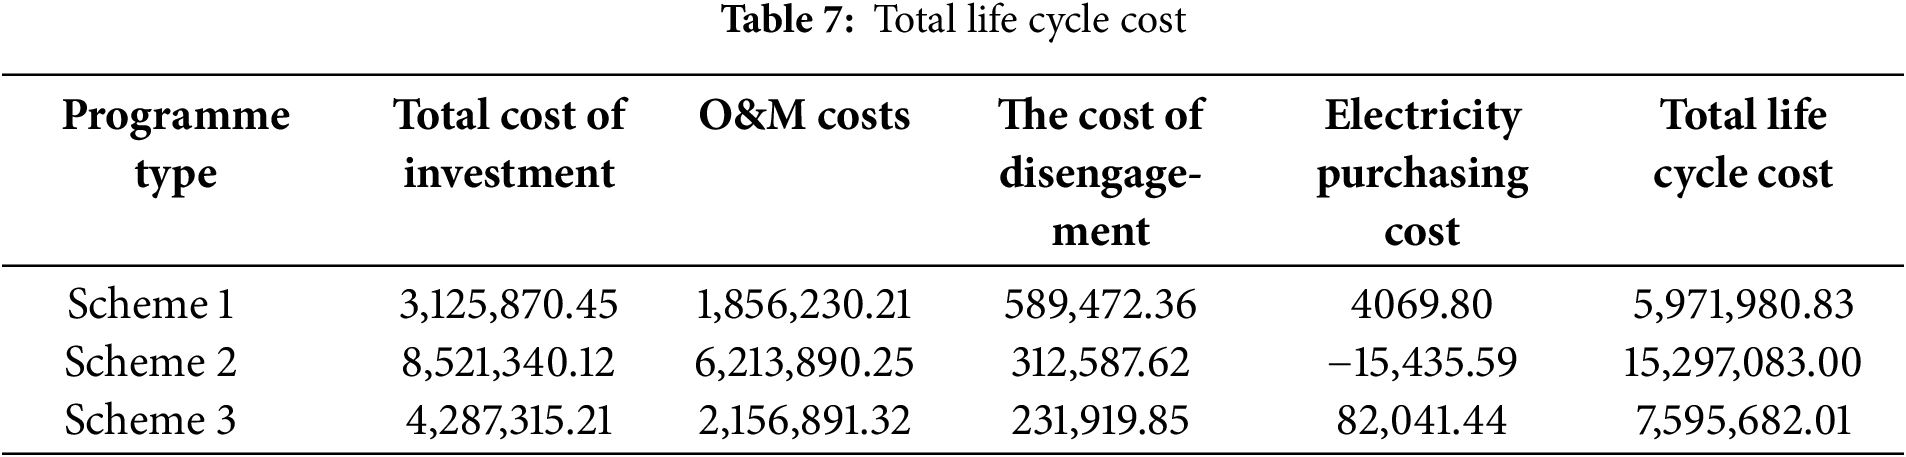
Scheme 1 has the lowest cost but can only produce hydrogen unidirectionally. Without a fuel cell for power recovery, its curtailment cost is significantly higher than the proposed scheme. Scheme 2 incurs the highest cost, mainly due to the high investment and operation-maintenance costs of battery energy storage. Although Scheme 3 is less economical than Scheme 2, it achieves bidirectional power-to-hydrogen and hydrogen-to-power conversion, striking a balance between economy and system performance. Thus, it is suitable for the high-proportion renewable energy scenarios proposed in this paper.
Focusing on the optimal configuration and scheduling issue of distribution networks supported by wind-solar-hydrogen-storage systems, this research characterizes the uncertainty and correlation of wind/solar power as well as the collaborative operation of EHS. It puts forward a bi-level optimization model for distribution networks incorporating EHS. Employing the differential evolution algorithm for solving, it yields the following conclusions.
(1) By integrating Copula functions to comprehensively account for the uncertainty and correlation of wind and solar power outputs, the generated renewable energy scenarios closely replicate regional wind-solar generation characteristics. This provides a reliable data foundation for holistic planning and operational decision-making in distribution networks.
(2) A bi-level optimization model for distribution networks with EHS is proposed. The upper-layer site selection and capacity configuration model aims to minimize the full life-cycle cost as the objective function, achieving site selection and capacity configuration for each subsystem. This solves the problem of over-configuration in distribution networks and effectively improves the economic efficiency of distribution networks.
(3) The lower-layer operation model uses the contribution function, VDEM, and new energy absorption rate as objective functions to effectively reduce system voltage deviation. It also verifies the peak shaving and valley filling effects of HES, enabling full utilization of flexible loads and energy storage devices.
In summary, the optimization results validate the feasibility and rationality of the optimal scheduling for ADN considering the collaborative operation of hydrogen production and storage, from evaluation indicators such as the economy of ADN, voltage indexes, and new energy absorption rates. This approach effectively reduces differences in the operation modes of ADN and lowers the total operation cost. For future research, incorporating power quantity and energy balance can further refine the distribution network scheduling model. Furthermore, analyzing the power output and response compensation mechanisms of various generation-side power sources from an electricity market perspective would be beneficial.
Acknowledgement: Not applicable.
Funding Statement: This work was supported in part by the Innovation Project for Young Science and Technology Talents in Lanzhou City (2023-QN-121), National Natural Science Foundation of China (No. 52467008), and Key Talent Project of Gansu Provincial Department of Science and Technology (2025RCXM044).
Author Contributions: The authors confirm contribution to the paper as follows: study conception and design: Wenyao Su and Yulong Che; data collection: Wenyao Su, Limiao Ren, Xiping Ma and Hongsheng Su; analysis and interpretation of results: Wenyao Su, Hongsheng Su and Yulong Che; case study: Wenyao Su and Tian Zhao; draft manuscript preparation: Wenyao Su and Yulong Che. All authors reviewed the results and approved the final version of the manuscript.
Availability of Data and Materials: The data presented in this study are available on request from the corresponding author.
Ethics Approval: Not applicable.
Conflicts of Interest: The authors declare no conflicts of interest to report regarding the present study.
References
1. Zhao Z, Yang K, Xu Y. Low-carbon transformation of power structure under the “double carbon” goal: power planning and policy implications. Environ Sci Pollut Res. 2023;30(25):66961–77. doi:10.1007/s11356-023-27027-9. [Google Scholar] [PubMed] [CrossRef]
2. Notification of the National Development and Reform Commission and the National Energy Administration on distributing the “14th Five-Year Plan for the modern energy system”. [cited 2025 May 19]. Available from: https://www.gov.cn/zhengce/zhengceku/2022-03/23/content_5680759.htm. [Google Scholar]
3. Zang T, Wang S, Wang Z, Li C, Liu Y, Xiao Y, et al. Integrated planning and operation dispatching of source-grid-load-storage in a new power system: a coupled socio-cyber-physical perspective. Energies. 2024;17(12):3013. doi:10.3390/en17123013. [Google Scholar] [CrossRef]
4. Alzahrani A, Ramu SK, Devarajan G, Vairavasundaram I, Vairavasundaram S. A review on hydrogen-based hybrid microgrid system: topologies for hydrogen energy storage, integration, and energy management with solar and wind energy. Energies. 2022;15(21):7979. doi:10.3390/en15217979. [Google Scholar] [CrossRef]
5. Abdin Z, Mérida W. Hybrid energy systems for off-grid power supply and hydrogen production based on renewable energy: a techno-economic analysis. Energy Convers Manag. 2019;196:1068–79. doi:10.1016/j.enconman.2019.06.068. [Google Scholar] [CrossRef]
6. Singh A, Kumar A, Chinmaya KA, Maulik A. Optimal operation of an electricity-hydrogen DC microgrid with integrated demand response. Sustain Energy Grids Netw. 2024;39(37):101451. doi:10.1016/j.segan.2024.101451. [Google Scholar] [CrossRef]
7. Pompern N, Premrudeepreechacharn S, Siritaratiwat A, Khunkitti S. Optimal placement and capacity of battery energy storage system in distribution networks integrated with PV and EVs using metaheuristic algorithms. IEEE Access. 2023;11:68379–94. doi:10.1109/ACCESS.2023.3291590. [Google Scholar] [CrossRef]
8. Maghami MR, Yaghoubi E, Mohamed M, Yaghoubi E, Jahromi MZ, Fei TK. Multi-objective optimization of unbalanced power distribution systems: a comprehensive approach to address uncertainties and enhance performance. Energy Convers Manag X. 2025;27(2):101087. doi:10.1016/j.ecmx.2025.101087. [Google Scholar] [CrossRef]
9. Bian H, Zhou C, Guo Z, Zhou Y, Ren Q. Coordinated planning of electricity-hydrogen integrated energy system considering lifecycle carbon emissions. IEEE Access. 2024;12(14):33889–909. doi:10.1109/ACCESS.2024.3373189. [Google Scholar] [CrossRef]
10. Song D, Wu X, Jiang L, Zhang S, Feng N. Nondominated sorting grey wolf algorithm-based optimal scheduling for electric-hydrogen-heat multi-energy microgrid. Electr Power Syst Res. 2025;245(1):111628. doi:10.1016/j.epsr.2025.111628. [Google Scholar] [CrossRef]
11. Oh BC, Son YG, Acquah MA, Kim SY. A new framework for hierarchical multi-objective energy hub planning considering reliability. Energy. 2024;303(1):131889. doi:10.1016/j.energy.2024.131889. [Google Scholar] [CrossRef]
12. Eldakadosi M, Schneeloch J. Hydrogen vs. conventional sector-coupling residential energy systems: an economic and environmental comparison based on multi-objective design optimization. Renew Energy. 2024;236(13):121412. doi:10.1016/j.renene.2024.121412. [Google Scholar] [CrossRef]
13. Nasser M, Megahed TF, Ookawara S, Hassan H. Performance evaluation of PV panels/wind turbines hybrid system for green hydrogen generation and storage: energy, exergy, economic, and enviroeconomic. Energy Convers Manag. 2022;267:115870. doi:10.1016/j.enconman.2022.115870. [Google Scholar] [CrossRef]
14. Shahbazbegian V, Shafie-khah M, Laaksonen H, Strbac G, Ameli H. Resilience-oriented operation of microgrids in the presence of power-to-hydrogen systems. Appl Energy. 2023;348:121429. doi:10.1016/j.apenergy.2023.121429. [Google Scholar] [CrossRef]
15. Eghbali N, Hakimi SM, Hasankhani A, Derakhshan G, Abdi B. Stochastic energy management for a renewable energy based microgrid considering battery, hydrogen storage, and demand response. Sustain Energy Grids Netw. 2022;30(1):100652. doi:10.1016/j.segan.2022.100652. [Google Scholar] [CrossRef]
16. Kroniger D, Madlener R. Hydrogen storage for wind parks: a real options evaluation for an optimal investment in more flexibility. Appl Energy. 2014;136(3):931–46. doi:10.1016/j.apenergy.2014.04.041. [Google Scholar] [CrossRef]
17. Wang J, Wen Y, Wu K, Ding S, Liu Y, Tian H, et al. Optimization study of wind, solar, hydro and hydrogen storage based on improved multi-objective particle swarm optimization. J Energy Storage. 2024;93(7):112298. doi:10.1016/j.est.2024.112298. [Google Scholar] [CrossRef]
18. Hematian H, Askari MT, Ahmadi MA, Sameemoqadam M, Nik MB. Robust optimization for microgrid management with compensator, EV, storage, demand response, and renewable integration. IEEE Access. 2024;12:73413–25. doi:10.1109/ACCESS.2024.3401834. [Google Scholar] [CrossRef]
19. Ebrahimi MR, Amjady N. Adaptive robust optimization framework for day-ahead microgrid scheduling. Int J Electr Power Energy Syst. 2019;107:213–23. doi:10.1016/j.ijepes.2018.11.029. [Google Scholar] [CrossRef]
20. Vera EG, Cañizares CA, Pirnia M, Guedes TP, Trujillo JDM. Two-stage stochastic optimization model for multi-microgrid planning. IEEE Trans Smart Grid. 2023;14(3):1723–35. doi:10.1109/TSG.2022.3211449. [Google Scholar] [CrossRef]
21. Wang S, Hou Y, Guan X, Liu S, Huo Z. Resiliency-informed optimal scheduling of smart distribution network with urban distributed photovoltaic: a stochastic P-robust optimization. Energy. 2024;313:133449. doi:10.1016/j.energy.2024.133449. [Google Scholar] [CrossRef]
22. Fan Y, Liu W, Zhu F, Wang S, Yue H, Zeng Y, et al. Short-term stochastic multi-objective optimization scheduling of wind-solar-hydro hybrid system considering source-load uncertainties. Appl Energy. 2024;372:123781. doi:10.1016/j.apenergy.2024.123781. [Google Scholar] [CrossRef]
23. Qin Z, Li W, Xiong X. Incorporating multiple correlations among wind speeds, photovoltaic powers and bus loads in composite system reliability evaluation. Appl Energy. 2013;110:285–94. doi:10.1016/j.apenergy.2013.04.045. [Google Scholar] [CrossRef]
24. Bai KF, Gu J, Peng HQ, Zhu BR. Optimal allocation for multi-energy complementary microgrid based on scenario generation of wind power and photovoltaic output. Autom Electr Power Syst. 2018;42(15):133–41. (In Chinese). [Google Scholar]
25. Pan QK, Suganthan PN, Wang L, Gao L, Mallipeddi R. A differential evolution algorithm with self-adapting strategy and control parameters. Comput Oper Res. 2011;38(1):394–408. doi:10.1016/j.cor.2010.06.007. [Google Scholar] [CrossRef]
26. Jia CZ, Wang LM, Meng EL, Yang DR, Guo DJ, Liu YS. Optimal capacity configuration and day-ahead scheduling of wind-solar-hydrogen coupled power generation system. Electr Power. 2020;53(10):80–7. (In Chinese). [Google Scholar]
Cite This Article
 Copyright © 2025 The Author(s). Published by Tech Science Press.
This work is licensed under a Creative Commons Attribution 4.0 International License , which permits unrestricted use, distribution, and reproduction in any medium, provided the original work is properly cited.
 Downloads
 Citation Tools