
 Submit a Paper
 Propose a Special lssue
 Open Access
ARTICLE

Energy Optimization Strategy for Reconfigurable Distribution Network with High Renewable Penetration Based on Bald Eagle Search Algorithm
State Grid Taizhou Power Supply Company, Taizhou, 225300, China
* Corresponding Author: Lingyi Ji. Email:
(This article belongs to the Special Issue: Innovations and Challenges in Smart Grid Technologies)
Energy Engineering 2025, 122(11), 4635-4651. https://doi.org/10.32604/ee.2025.068667
Received 03 June 2025; Accepted 22 August 2025; Issue published 27 October 2025
 View Full Text
 Download PDF
Abstract
This paper proposes a cost-optimal energy management strategy for reconfigurable distribution networks with high penetration of renewable generation. The proposed strategy accounts for renewable generation costs, maintenance and operating expenses of energy storage systems, diesel generator operational costs, typical daily load profiles, and power balance constraints. A penalty term for power backflow is incorporated into the objective function to discourage undesirable reverse flows. The Bald Eagle Search (BES) meta-heuristic is adopted to solve the resulting constrained optimization problem. Numerical simulations under multiple load scenarios demonstrate that the proposed method effectively reduces operating cost while preventing power backflow and maintaining secure operation of the distribution network.Keywords
The widespread application of new energy generation can effectively alleviate the problem of carbon emissions [1]. As renewable penetration increases, distribution networks must accommodate bidirectional power flows and more variable operating conditions, which complicates system control and reliability. As a result, the operation of the distribution network—and even the entire power system—is undergoing significant transformation. In this context, reconfigurable distribution networks are not only required to supply electricity to user loads, but also to accommodate and distribute power from distributed energy resources. Variations in the proportion and generation patterns of distributed generation make the direction of power flow uncertain, significantly increasing the complexity of operating and regulating reconfigurable distribution networks [2,3]. Meanwhile, current non-interruptible power supply technologies based on mobile generators and energy storage vehicles are insufficient to address issues such as power backflow that may arise in high renewable penetration distribution networks. However, the uncertainty of distributed generation and variable load profiles presents significant optimization challenges.
To address these challenges, researchers have proposed numerous optimization and energy management approaches. Reference [4] investigated the energy allocation problem in smart homes and microgrids with high penetration of renewable energy. By taking into account load demand, generation uncertainty, and market price fluctuations, a two-stage model was developed to achieve optimized energy scheduling; Reference [5] employed particle swarm optimization to optimize each artificial neural network and integrated it into an adaptive energy management system, with simulation results demonstrating improved microgrid performance. Reference [6] applied the slime mold algorithm, combined with the weighted sum technique and fuzzy clustering, to optimize the operating costs and active losses of distributed generators in the distribution network, and its performance was validated against various other optimization algorithms. Reference [7] proposed a dynamic weight distributed algorithm based on primal-dual methods for comprehensive energy allocation, offering greater flexibility, reliability, and adaptability compared to traditional centralized algorithms. Reference [8] introduced a binary particle swarm optimization algorithm with an acceleration coefficient, aimed at minimizing losses in distribution network systems, and evaluated its convergence speed under different operating conditions. Reference [9] developed an enhanced whale optimization algorithm under the security constraints of reconfigurable distribution networks, which improved global convergence speed. Reference [10] presented a distributed, market-assisted restoration strategy for multi-energy distribution systems, integrating energy trading mechanisms with the system restoration process, and achieving efficient recovery and operation of electricity, heat, and gas systems through multi-agent collaborative optimization. The following Table 1 summarizes the differences between different optimization algorithms.
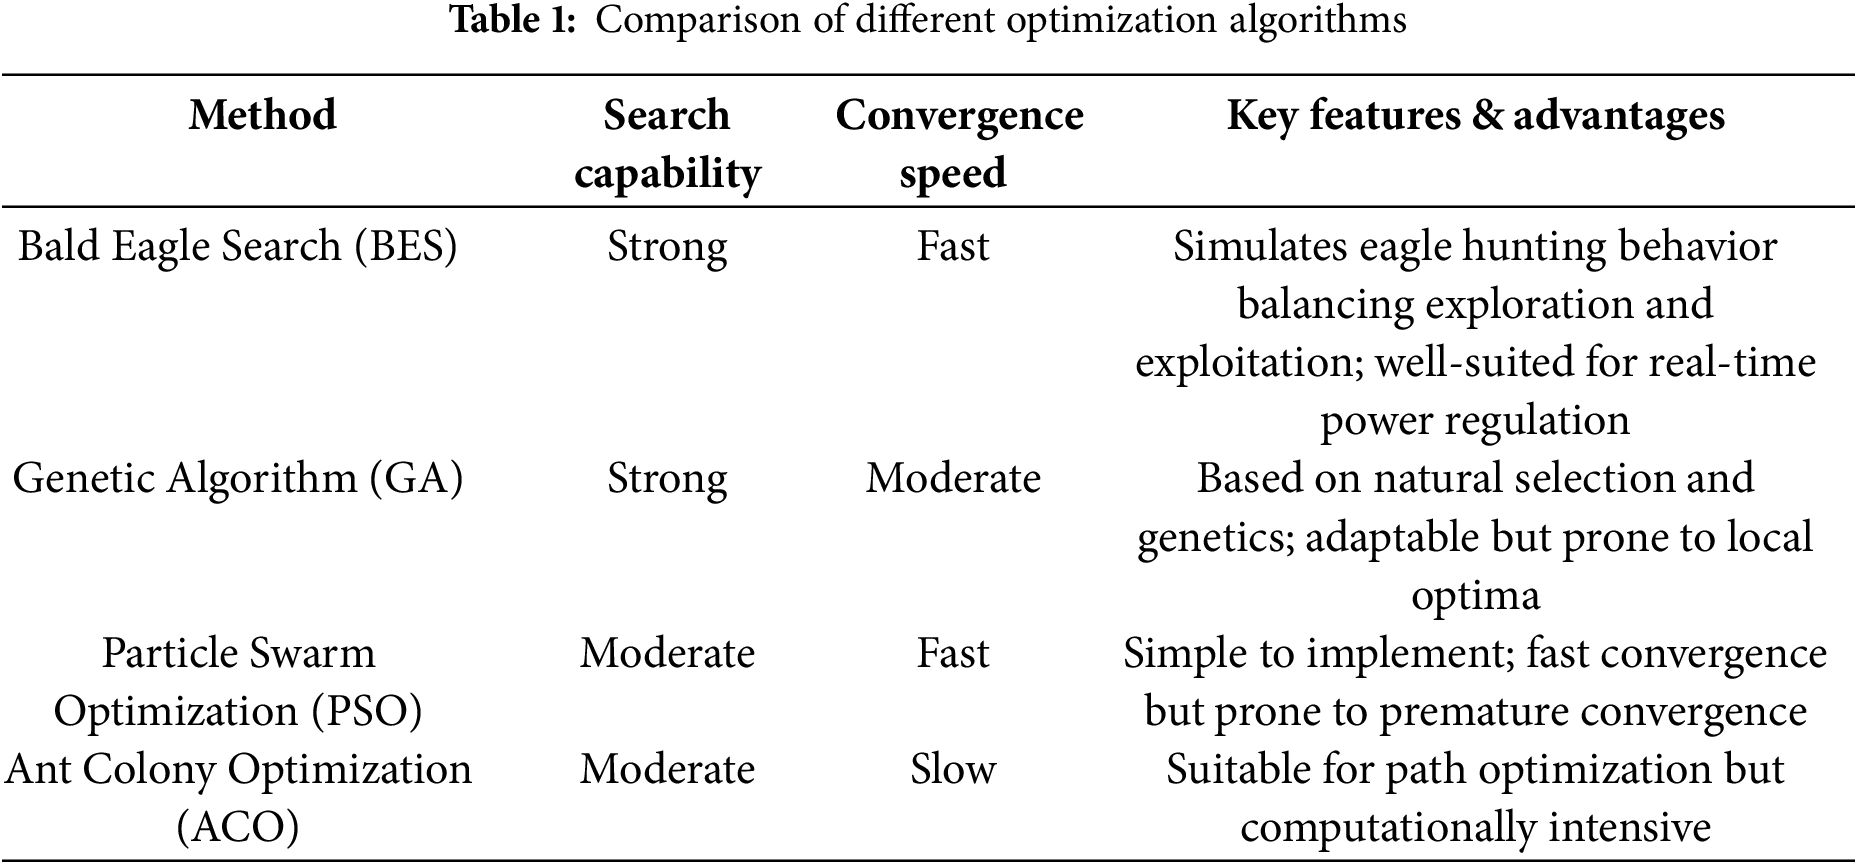
Given the Bald Eagle Search (BES) algorithm’s strong capability in handling complex nonlinear optimization problems and its fast convergence speed, it is particularly well-suited for the dynamic and multi-constrained nature of energy management in reconfigurable distribution networks. These characteristics enable BES to effectively balance exploration and exploitation, thereby enhancing solution quality while avoiding premature convergence. Accordingly, this study employs BES as the core optimization tool to achieve cost-optimal energy management while preventing power backflow.
This paper formulates an energy optimization framework for an reconfigurable distribution network that integrates incorporating photovoltaic (PV), wind, diesel generators, and electrochemical energy storage. The principal contributions are:
(1) Development of mathematical models for PV and wind generation that capture key operational characteristics;
(2) Construction of a practical state-of-charge (SOC) model for storage units representative of lead-acid battery behavior;
(3) Incorporation of a power backflow penalty into the operating cost objective to mitigate reverse flows in high-penetration scenarios;
(4) Application of the Bald Eagle Search algorithm to obtain cost-optimal dispatch while satisfying technical constraints;
(5) Extensive simulation studies under residential and industrial load scenarios that validate the effectiveness of the proposed approach.
2 Mathematical Models of Different Parts in the Reconfigurable Distribution Network
The prerequisite for optimizing the energy of the reconfigurable distribution network is to clarify the power output, consumption, and storage components within the system. Therefore, the first step is to establish a corresponding mathematical model.
2.1 Mathematical Model of Wind Turbine
Wind turbines are the primary means of harnessing wind energy, capturing it through rotating blades and converting it into electrical power. According to Betz’ theory, the maximum extractable energy from a wind turbine can be expressed as follows [11]:
In the formula,
In the above equation,
It can be observed that the output power of wind turbines is influenced by both the wind speed v and the power coefficient Cp at time t. Among these, Cp can be flexibly regulated through the mechanical angular velocity
A wind power output model is then established using the average wind speed profile from a specific wind farm. The daily wind speed variation is illustrated in Fig. 1. A 24-s simulation was conducted to represent 24 h of real-time operation.
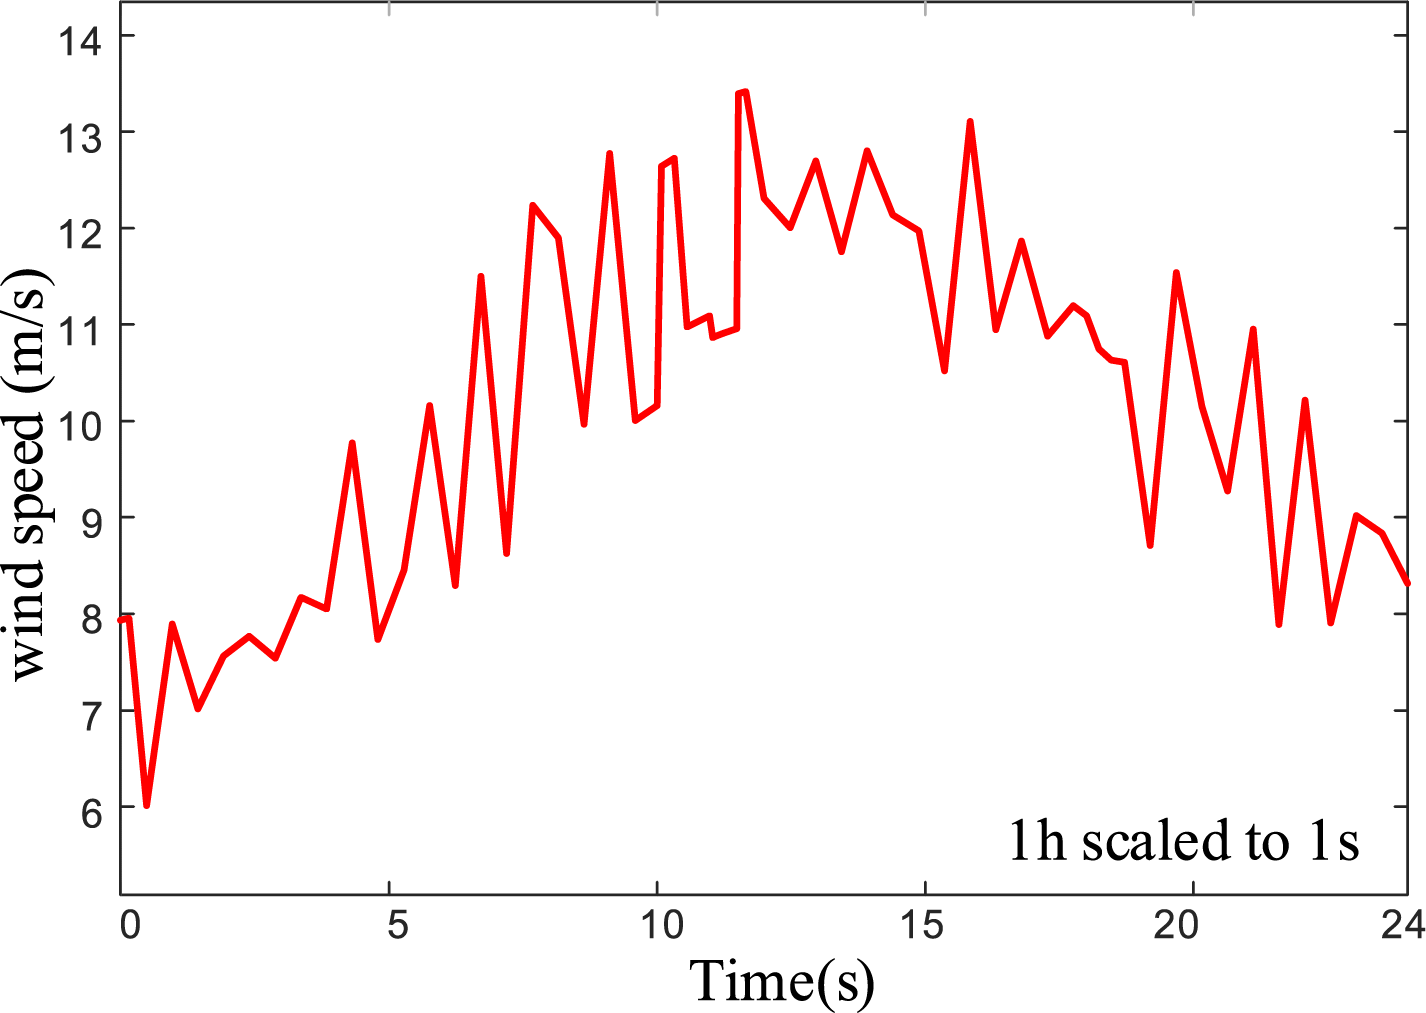
Figure 1: Daily wind speed curve
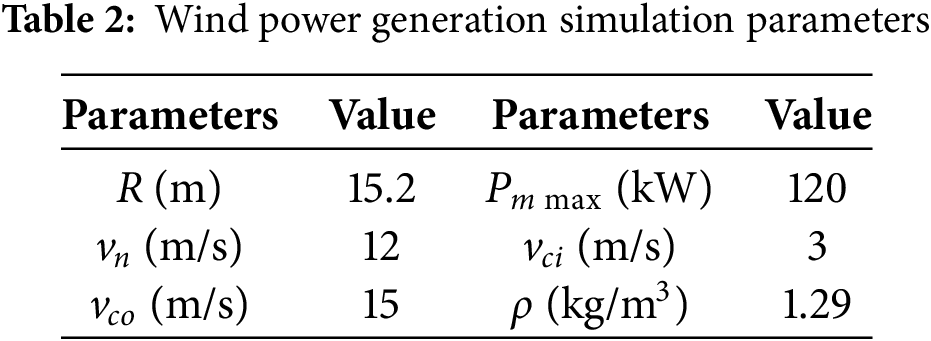
The simulation parameter settings for wind turbines are shown in Table 2 wind power generation simulation parameters.
The output curve of the wind turbine model obtained through simulation is shown in Fig. 2.
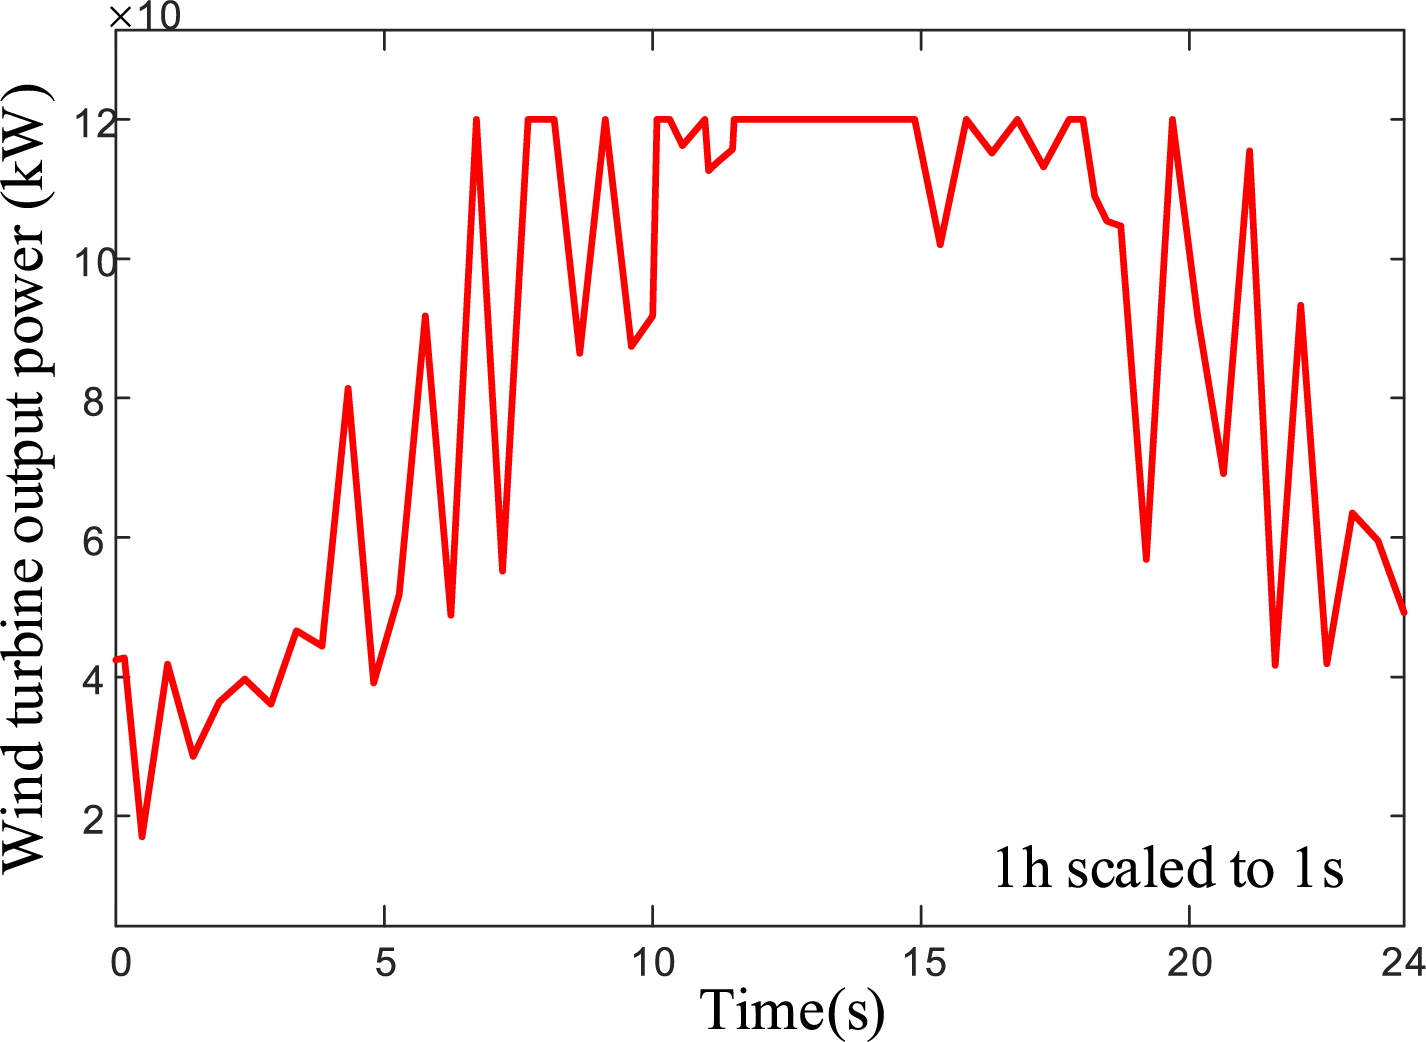
Figure 2: Maximum output power of wind turbines at different wind speeds
2.2 Mathematical Model of Photovoltaic Power Generation
Photovoltaic power generation converts solar energy directly into electrical power. The output power of a photovoltaic power generation unit can be expressed by the following equation [12].
In the formula,
The actual output power of photovoltaic generation is primarily influenced by solar irradiance [13], which typically follows a smooth, bell-shaped curve—gradually increasing to a peak and then declining. The irradiance received by the photovoltaic array at time t can be expressed by the following equation:
where Gmax is the maximum irradiance (kW/m2); tp1 is the sunrise time (h); Tpg is the duration of sunshine (h). According to Eq. (3), another key factor affecting the output of photovoltaic systems is the surface temperature of the photovoltaic unit during operation, which is primarily affected by solar irradiance. In summer, the rear surface temperature of photovoltaic modules can reach up to 70°C, while the working junction temperature can climb as high as 100°C. Typically, the highest temperature during the day occurs approximately two hours after the peak irradiance, so there is a relationship between Tpv and G(t) as follows:
where kT is the temperature coefficient and ts is the delay time, taken as 2 h. Taking tp1 as 5 h, Gmax as 680 kW/m2, and Tpg as 14 h, Then the following simulation results were obtained in Fig. 3.
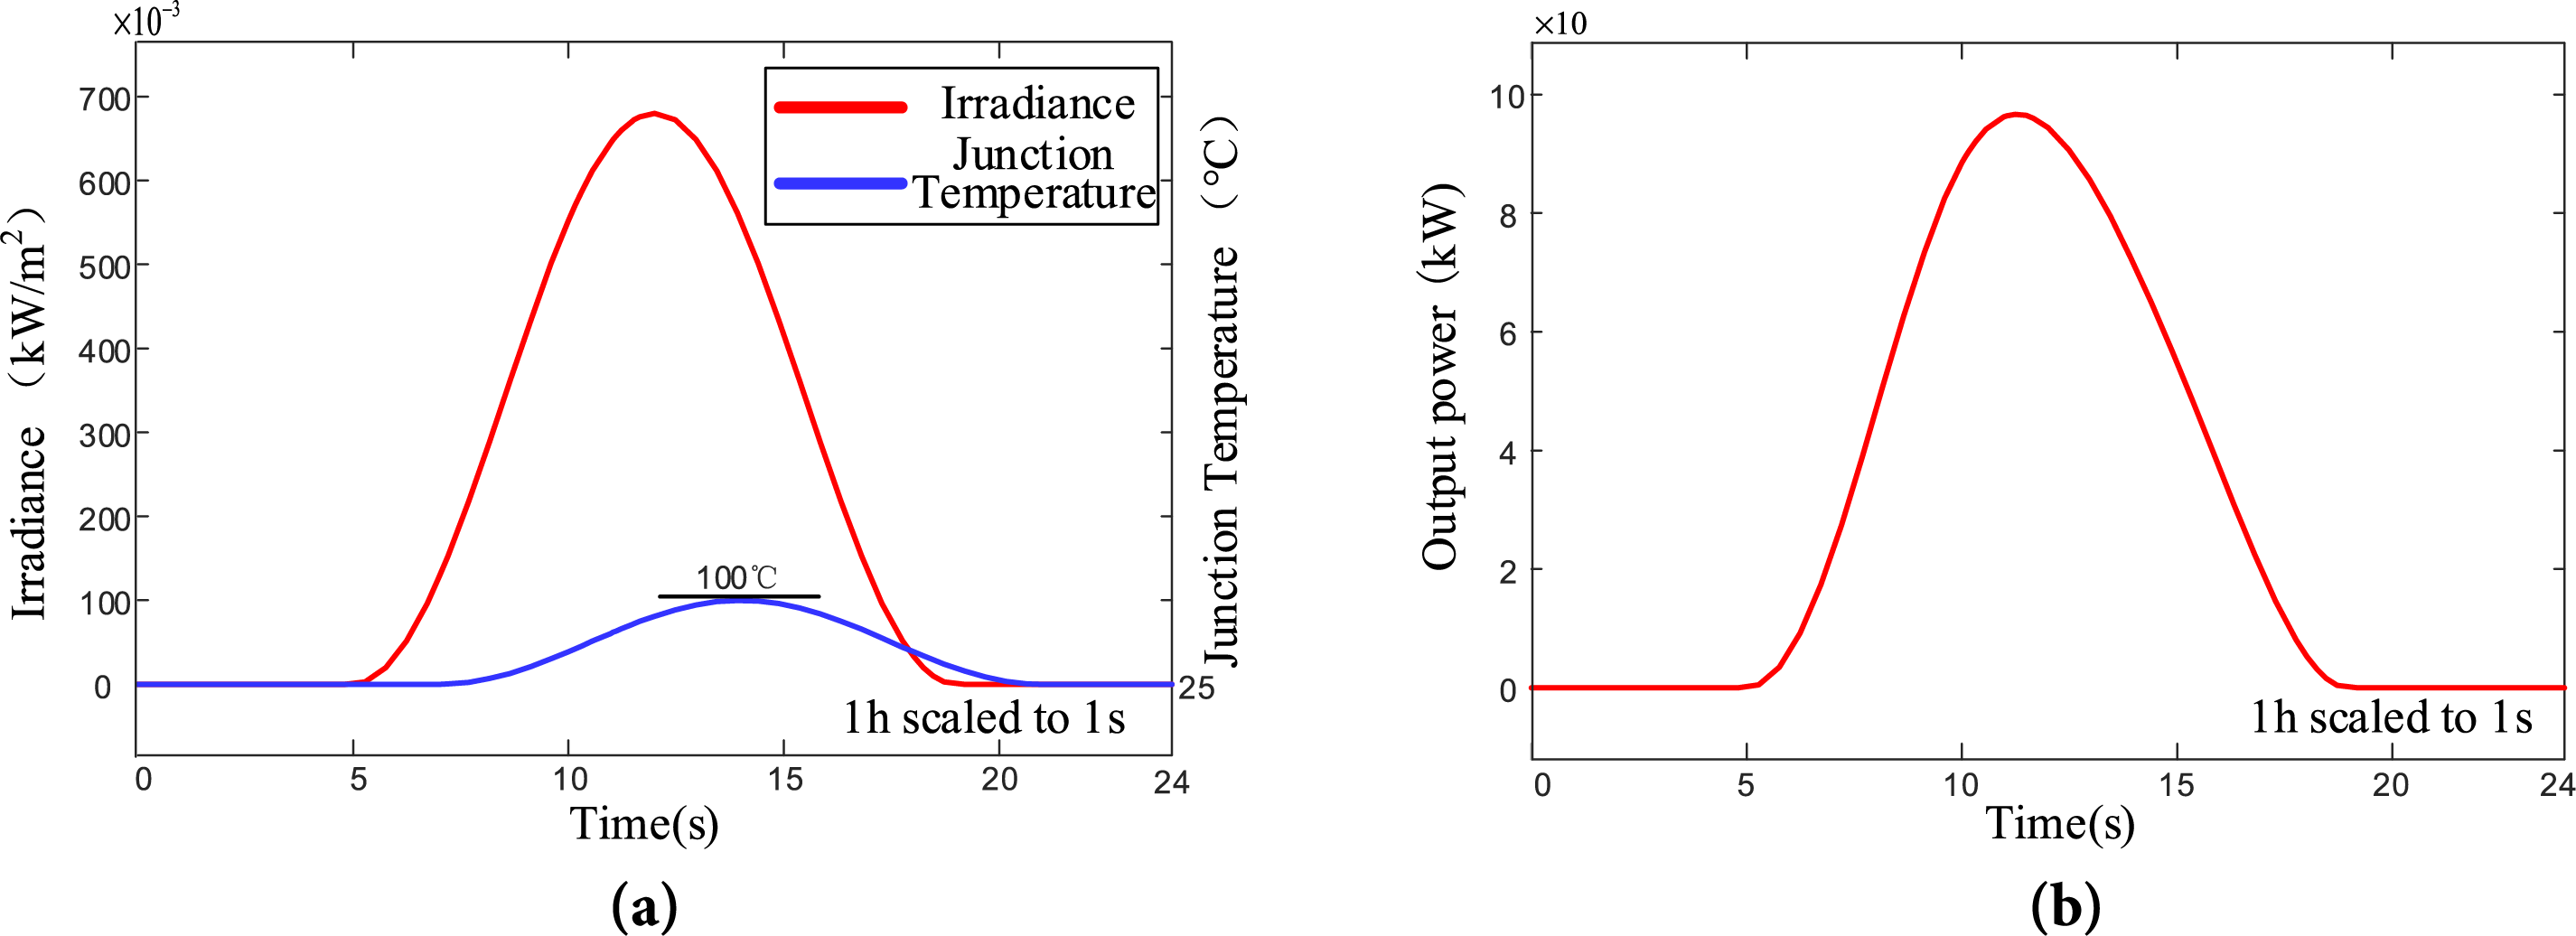
Figure 3: Photovoltaic power generation simulation curve. (a) Irradiance and junction temperature curves; (b) Daily output power curve of photovoltaic power generation
After obtaining the above two parameters, the photovoltaic power generation model can be constructed using Eq. (3), with a rated power of Ppv,r set to 200 kW, and the above Fig. 3b photovoltaic power generation output curve can be obtained.
2.3 Mathematical Model of Diesel Generator
Emergency power supply vehicles are vital for fault repair and maintenance in reconfigurable distribution networks. Their core power supply unit is a diesel generator, which generally consists of a diesel engine, a synchronous generator, a fuel tank, and other parts [14]. Diesel generators are modeled in terms of fuel consumption vs. output power and generator dynamics. Fuel consumption is approximated by a linear/quadratic fuel curve characterized by intercept and slope coefficients [15]. The relationship between the actual output power Pgen of a diesel generator and the fuel consumption F is expressed as follows:
In the formula, F0 is the intercept coefficient of the fuel curve of the diesel generator (L/(kW·h)), typically set to 0.08415; F1 is the slope of the fuel consumption curve for diesel generators (L/(kW·h)), which can be set to 0.246; Ygen represents the rated power of the diesel generator (kW), set to 50 in this study. The diesel engine and generator are driven by a coaxial line, and there is inevitably a loss coefficient
where Pe is the synchronous generator output power. The synchronous generator is simplified and treated as a black box, where the input variables are the dq axis currents and the mechanical angular velocity, and the output is the electrical power Pe. Therefore, it is sufficient to establish a mathematical model that describes the power generation process. The following equation is the mathematical model of the output torque of a permanent magnet synchronous motor after coordinate transformation [16].
where Rs is the stator resistance of the motor (
In the simulation, we adopt a simplified electromechanical model suitable for system-level optimization [17]. Given a fixed rated mechanical angular velocity, the stator current increases gradually to its rated value over time. The specific parameters of the motor used in the simulation are shown in Table 3.
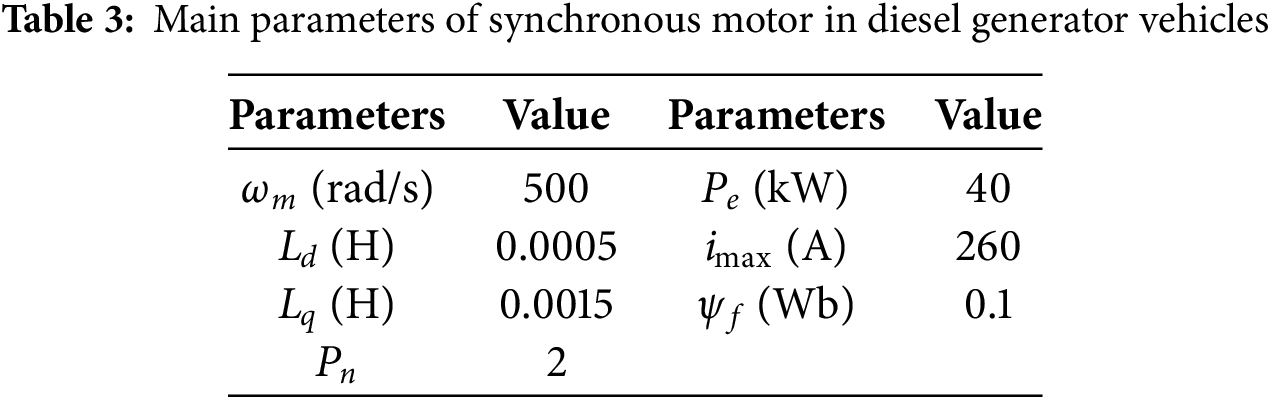
The following simulation curves were obtained, where Fig. 4a shows the current distribution curve and Fig. 4b shows the actual output power curve of the diesel generator. The maximum power of 40 kW was reached at 18 s during operation.
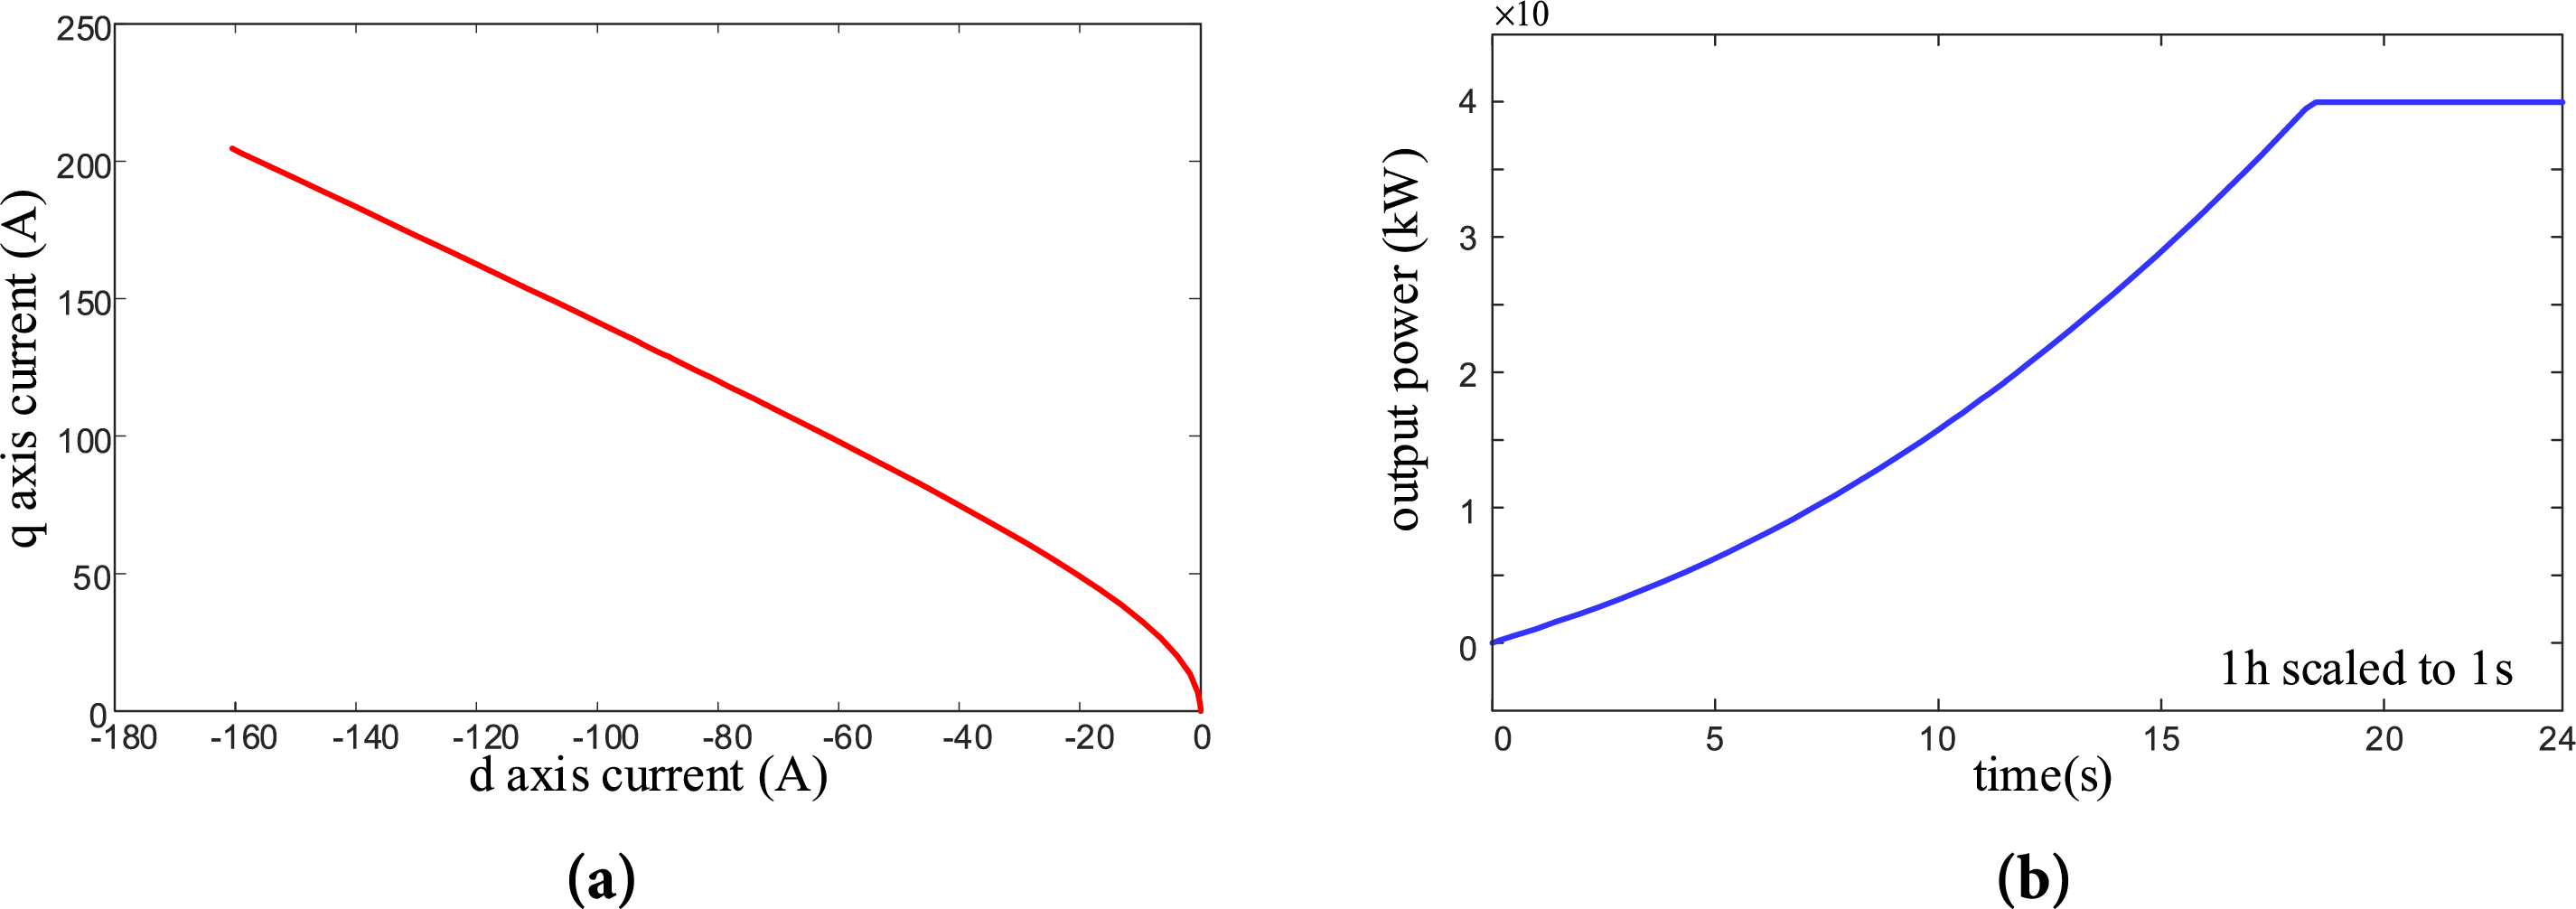
Figure 4: Simulation curve of diesel generator. (a) Current distribution curve; (b) Output power curve of diesel generator
2.4 Mathematical Model of Energy Storage Devices
Electrochemical energy storage, owing to its advantages of high energy density, rapid response capability, low maintenance costs, and operational flexibility, has emerged as the predominant direction for large-scale energy storage technologies. This study model electrochemical storage using a practical SOC update equation suitable for system-level optimization. The storage unit acts as an intermediate energy buffer; its SOC evolves according to charge/discharge power, efficiency, and self-discharge. The SOC of the battery is defined based on the charge/discharge current as follows [18].
In the above equation:
In the formula,
A black-box model is built based on Formula (10), with input of power P and the existing state of charge SOC(t), and output of remaining SOC(t) and charge discharge flag, with charge set to 1 and discharge set to 0. The structural diagram is shown in Fig. 5. The storage unit is modeled as an intermediate energy buffer for the purpose of system-level optimization, rather than detailed electrochemical modeling.
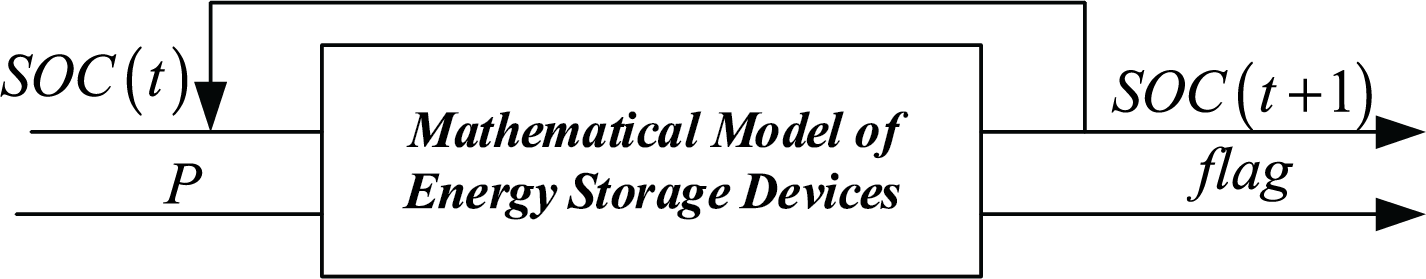
Figure 5: Energy storage black box model
Simulate the energy storage battery with the parameters shown in Table 4.
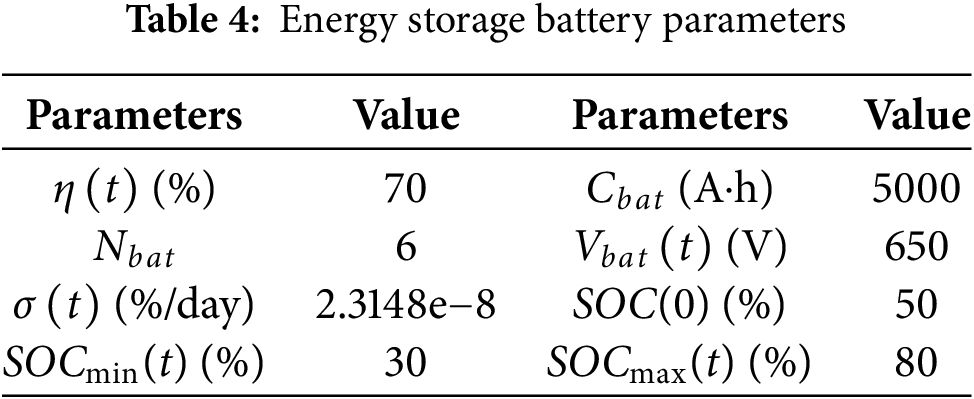
Due to the negligible self-discharge rate, it is omitted in this model. In the simulation, 24 s are used to represent 24 h, and accordingly, the total battery capacity is scaled down proportionally to 1.4 A·h. To simulate the operational behaviour of the energy storage system, the input power is randomly assigned positive and negative values, representing charging and discharging scenarios. As a result, the SOC profile shown in Fig. 6 is obtained.
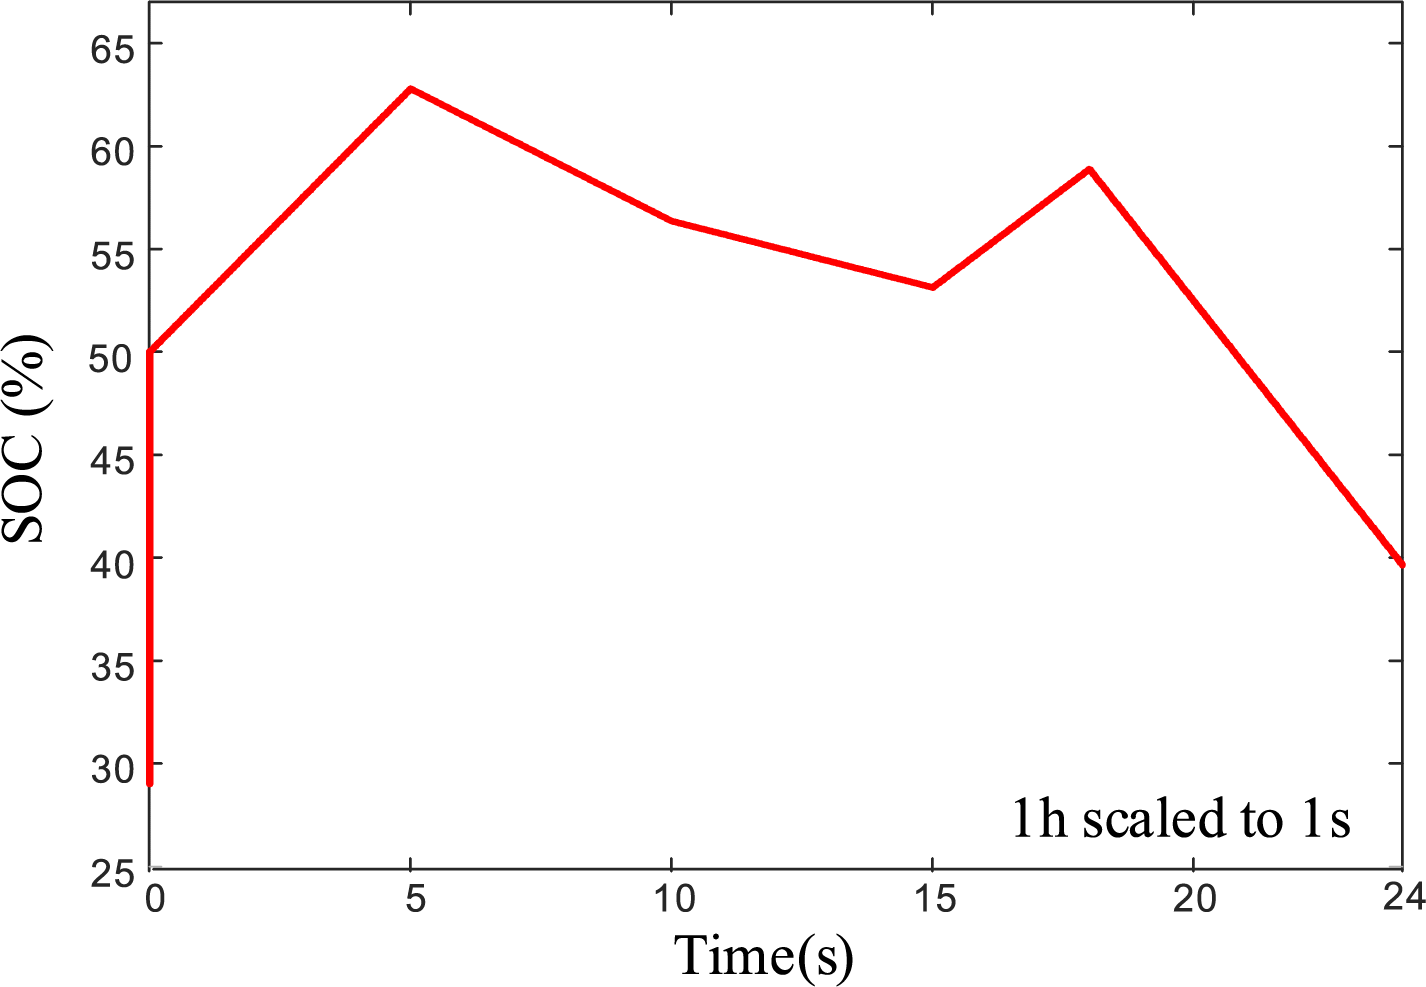
Figure 6: SOC simulation curve
3 Energy Optimization Strategy Based on Bald Eagle Search
The diversity of distributed power sources, together with variations in control characteristics, operating states, and costs, renders energy optimization in high-penetration reconfigurable distribution networks a complex, multi-constraint nonlinear programming problem [19]. To address this, the present study employs the Bald Eagle Search (BES) algorithm, a meta-heuristic optimization method, to achieve energy management optimization.
The entire system requires coordinated optimization of photovoltaic (PV) output, wind power output, and diesel generator output. Among them, wind power and diesel generator output are easy to adjust, while photovoltaic output is generally regarded as uncontrollable due to its dependence on solar irradiance. Consequently, wind power and diesel generators are treated as controllable assets to ensure overall power balance and cost-effective operation of the reconfigurable distribution network. The BES algorithm starts with population initialization, generating n bald eagles as candidate solutions. Each bald eagle carries two characteristic information
Based on the constraint conditions, randomly generate feature values according to the following formula.
Among them,
Selection stage: Bald eagles choose the best hunting space rich in prey, which is expressed as follows:
Among them,
Search stage: Simulate a bald eagle discovering prey and use spiral acceleration search to determine the optimal hunting position. The position update is achieved through the following equation.
where
Among them,
These three stages form the iterative process of the Bald Eagle Search algorithm. Each iteration will continuously retain the optimal feature values under the set goal until the expected goal is met or the number of iterations is reached to stop.
To better illustrate the effectiveness of the optimization algorithm in terms of search breadth and avoidance of local optima, the figure below presents the search areas covered by the vulture population during the search phase after 10 and 50 iterations. It can be seen from Fig. 7 that, irrespective of whether 10 or 50 iterations are performed, the vulture population follows a spiral trajectory while seeking the optimal solution. Even after only 10 iterations, a relatively high coverage of the search space is achieved. Moreover, as the number of iterations increases, the search density continues to rise and the overall search range expands. This indicates that the vulture optimization algorithm exhibits certain advantages in convergence speed and in avoiding local optima.
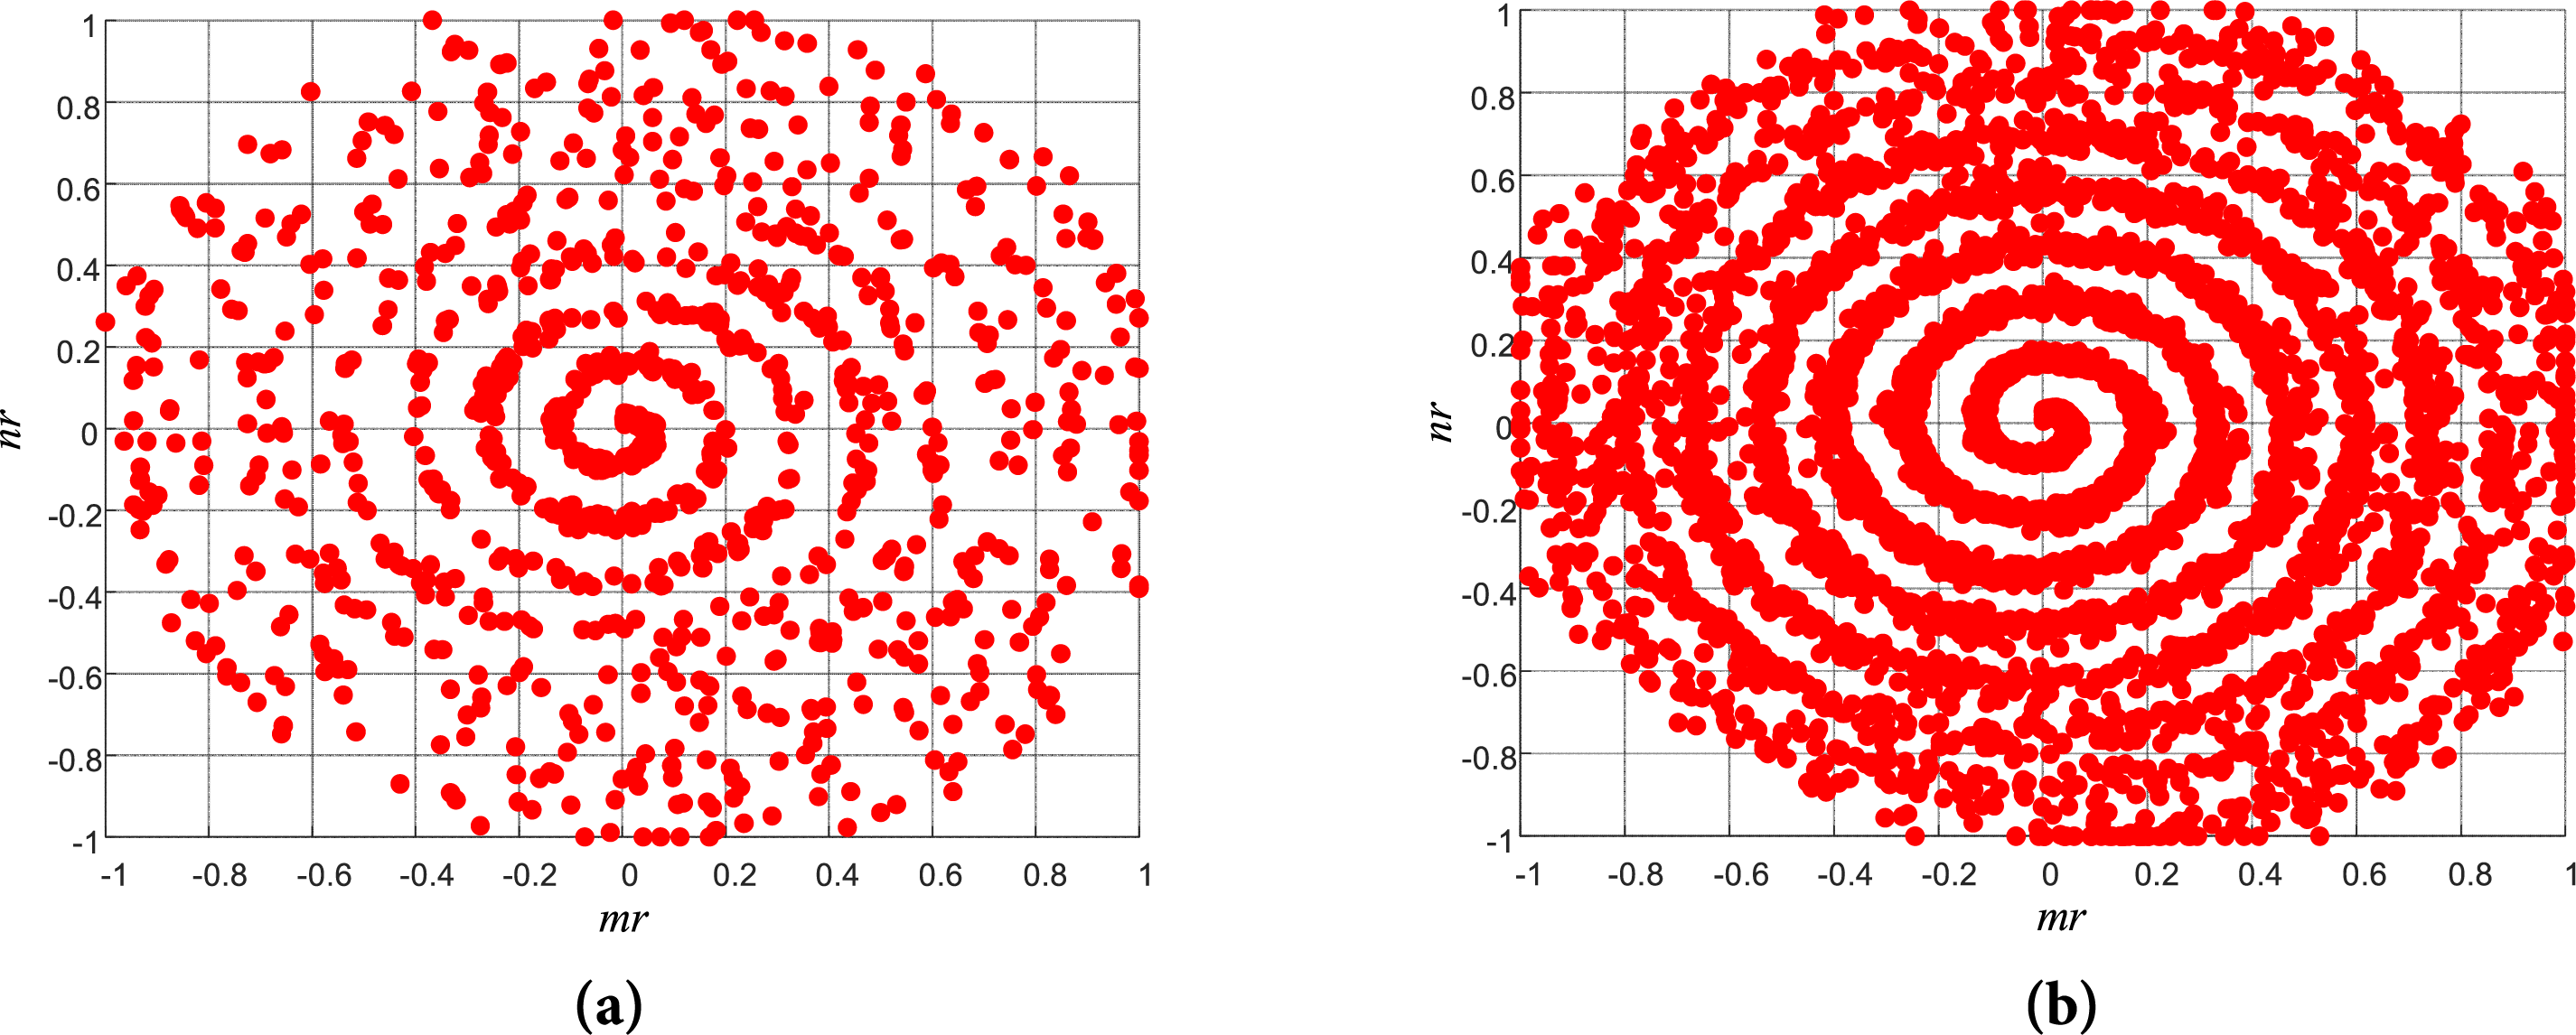
Figure 7: Distribution of bald eagle positions under different iteration times. (a) Results After 10 Iterations; (b) Results After 50 Iterations
4 Objective Function and Constraints
This paper considers renewable energy source such as solar, wind and power generation vehicles as the source of the reconfigurable distribution network, and regards energy storage systems as intermediate stations for energy transfer, with the goal of minimizing the operating costs of distributed resource output. Under the constraints of power generation operation and unit power balance, by reasonably arranging the output of distributed resources, the reconfigurable distribution network can achieve the lowest operating costs without experiencing power outages.
4.1 Objective Optimization Function
The energy optimization objective function is as follows.
The cost coefficients
Cp, as a key parameter for controlling the output power of wind power generation, will vary with changes in power during the energy optimization process, so
where
As an uncontrolled part, the cost coefficient
(1) Power balance constraint
All the power emitted by distributed resources plus the power absorbed by the energy storage system must match the load power demand and meet the power balance constraint.
(2) Wind power generation constraints
Among them,
(3) Photovoltaic power generation constraints
Among them,
(4) Photovoltaic power generation constraints
Among them,
Based on the aforementioned analysis, a simulation model has been developed, comprising four key components: the energy optimization management module, the distributed resource output module, the energy storage module, and the daily load module. The distributed resource output module incorporates the previously described models of photovoltaic systems, wind power generation, and diesel generators.
The daily load model is designed to simulate load variations under different operational scenarios. The energy storage module represents the energy absorption and release capabilities of energy storage vehicles or devices within the reconfigurable distribution network. The energy optimization management module is an optimization module that applies the bald eagle search algorithm. The overall simulation model is illustrated in Fig. 8.
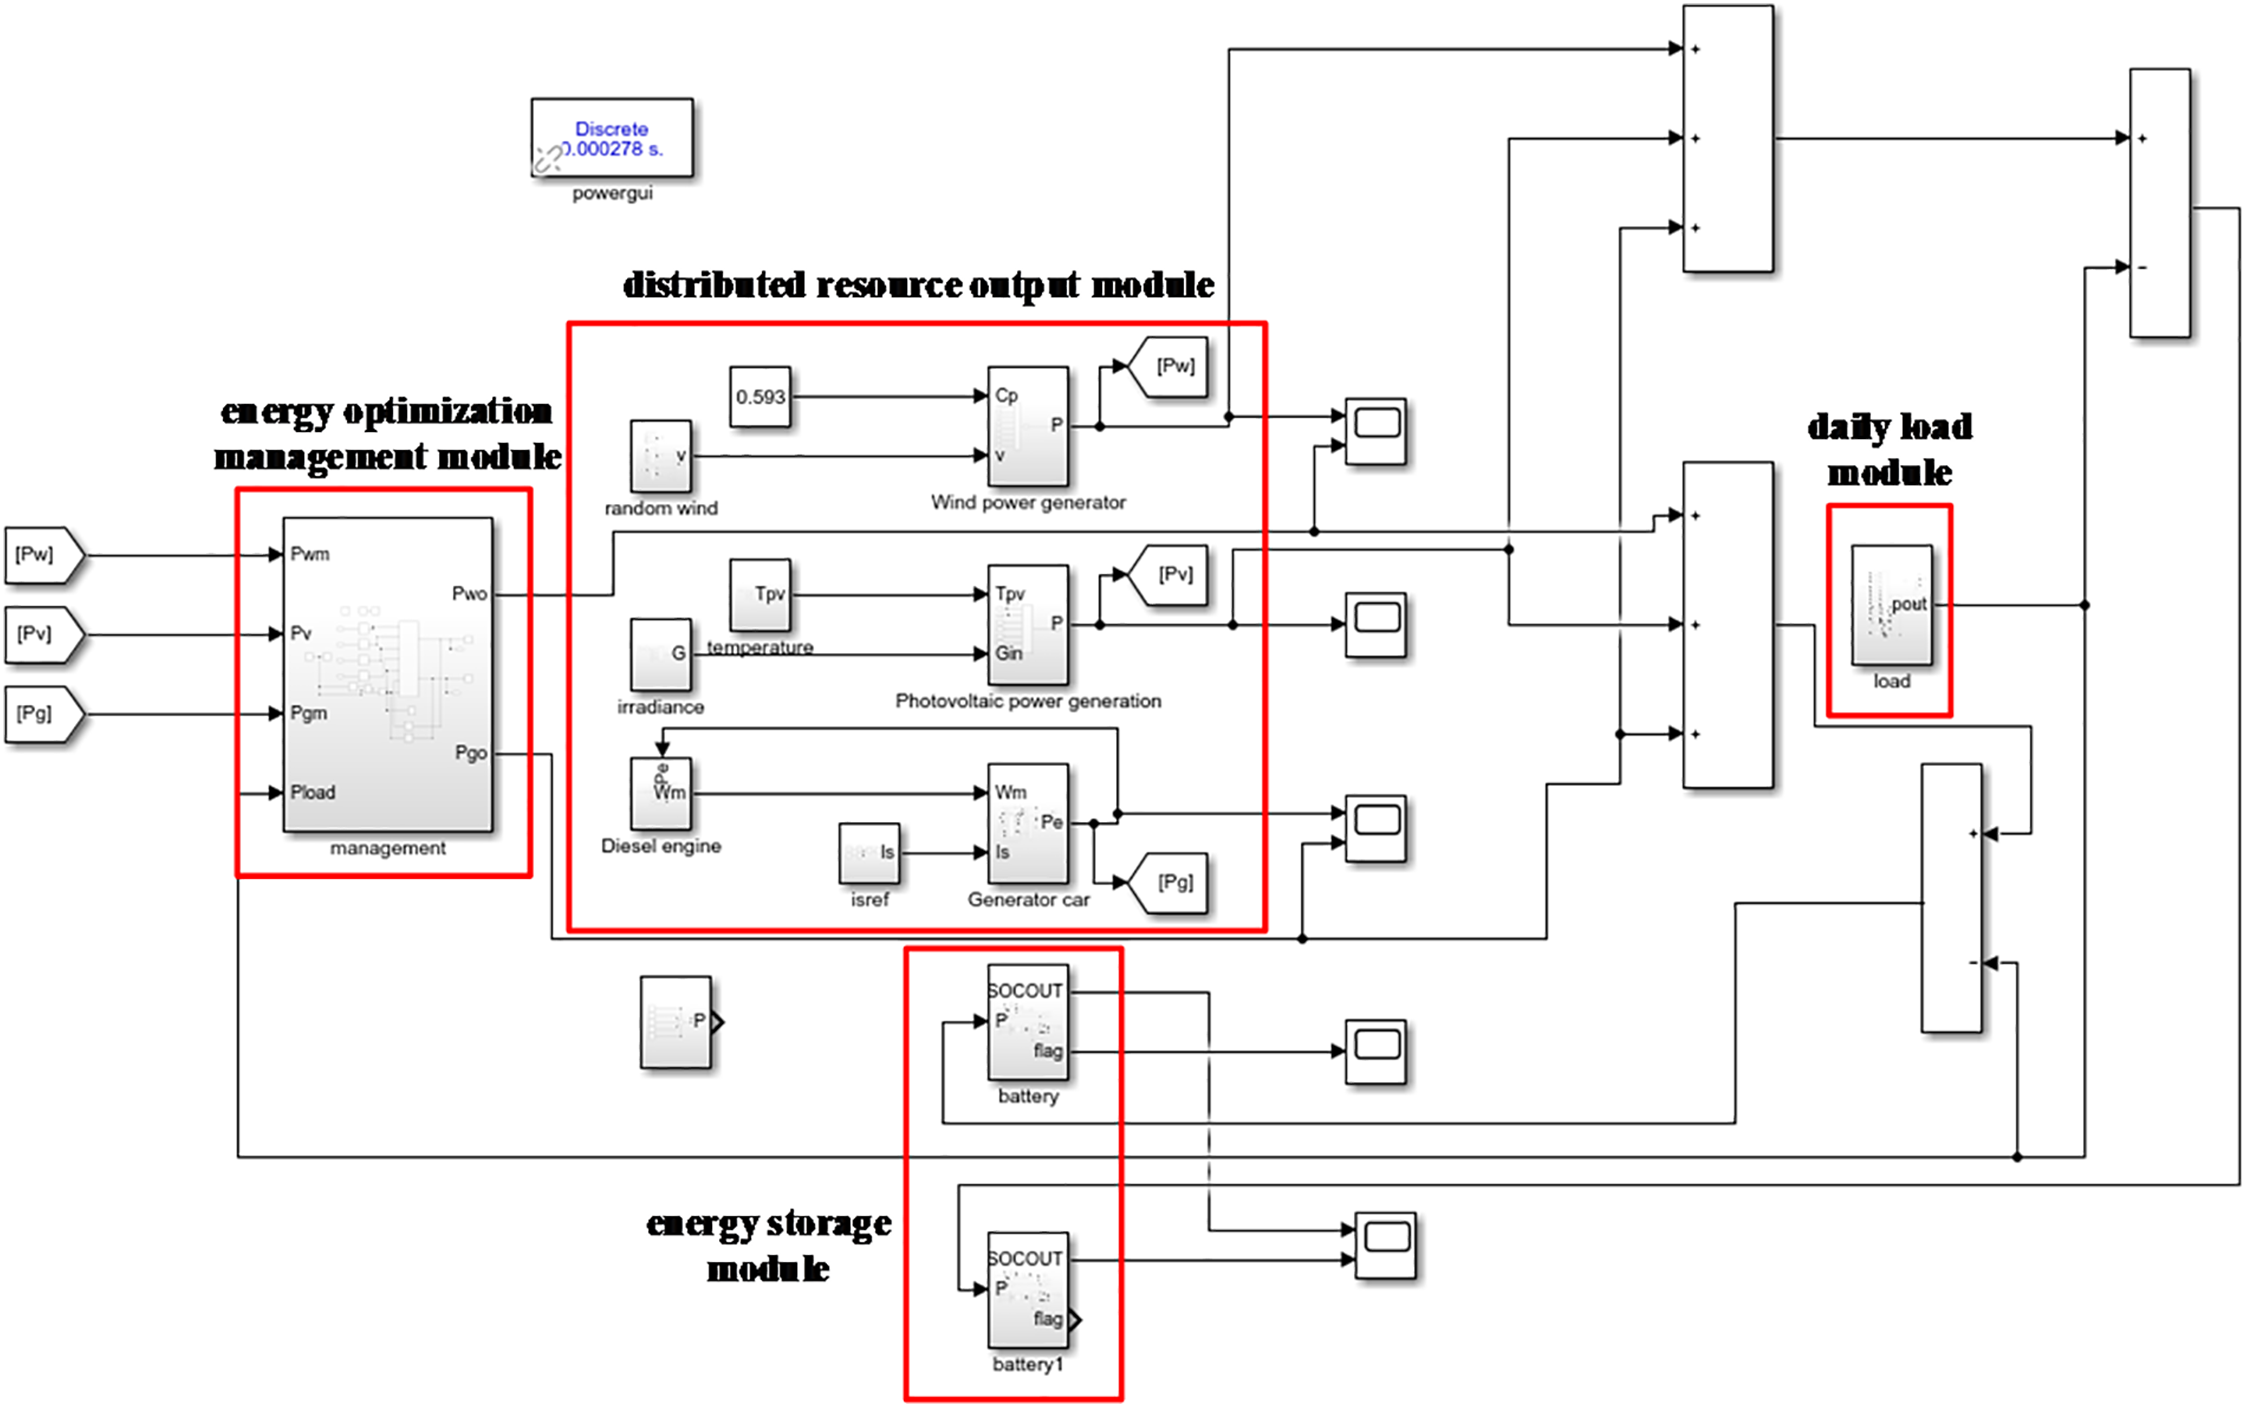
Figure 8: Overall simulation diagram of energy optimization control in the reconfigurable distribution network
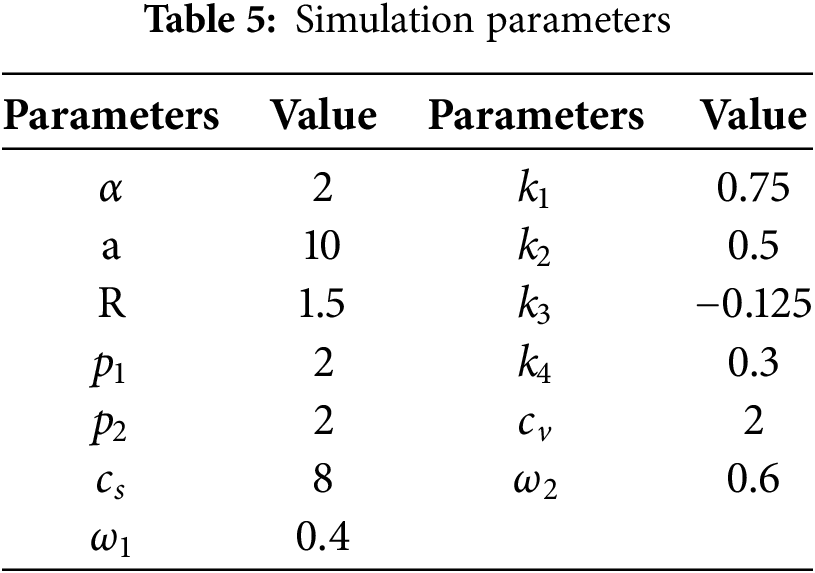
The parameters mentioned above will continue to be used, and the values of the remaining parameters are shown in Table 5. The number of iterations is 50 times.
To investigate the applicability and generalizability of the optimization algorithm under different load conditions, simulation studies were conducted for two scenarios: a typical residential load and an industrial steel plant load. The results are shown in Fig. 9.
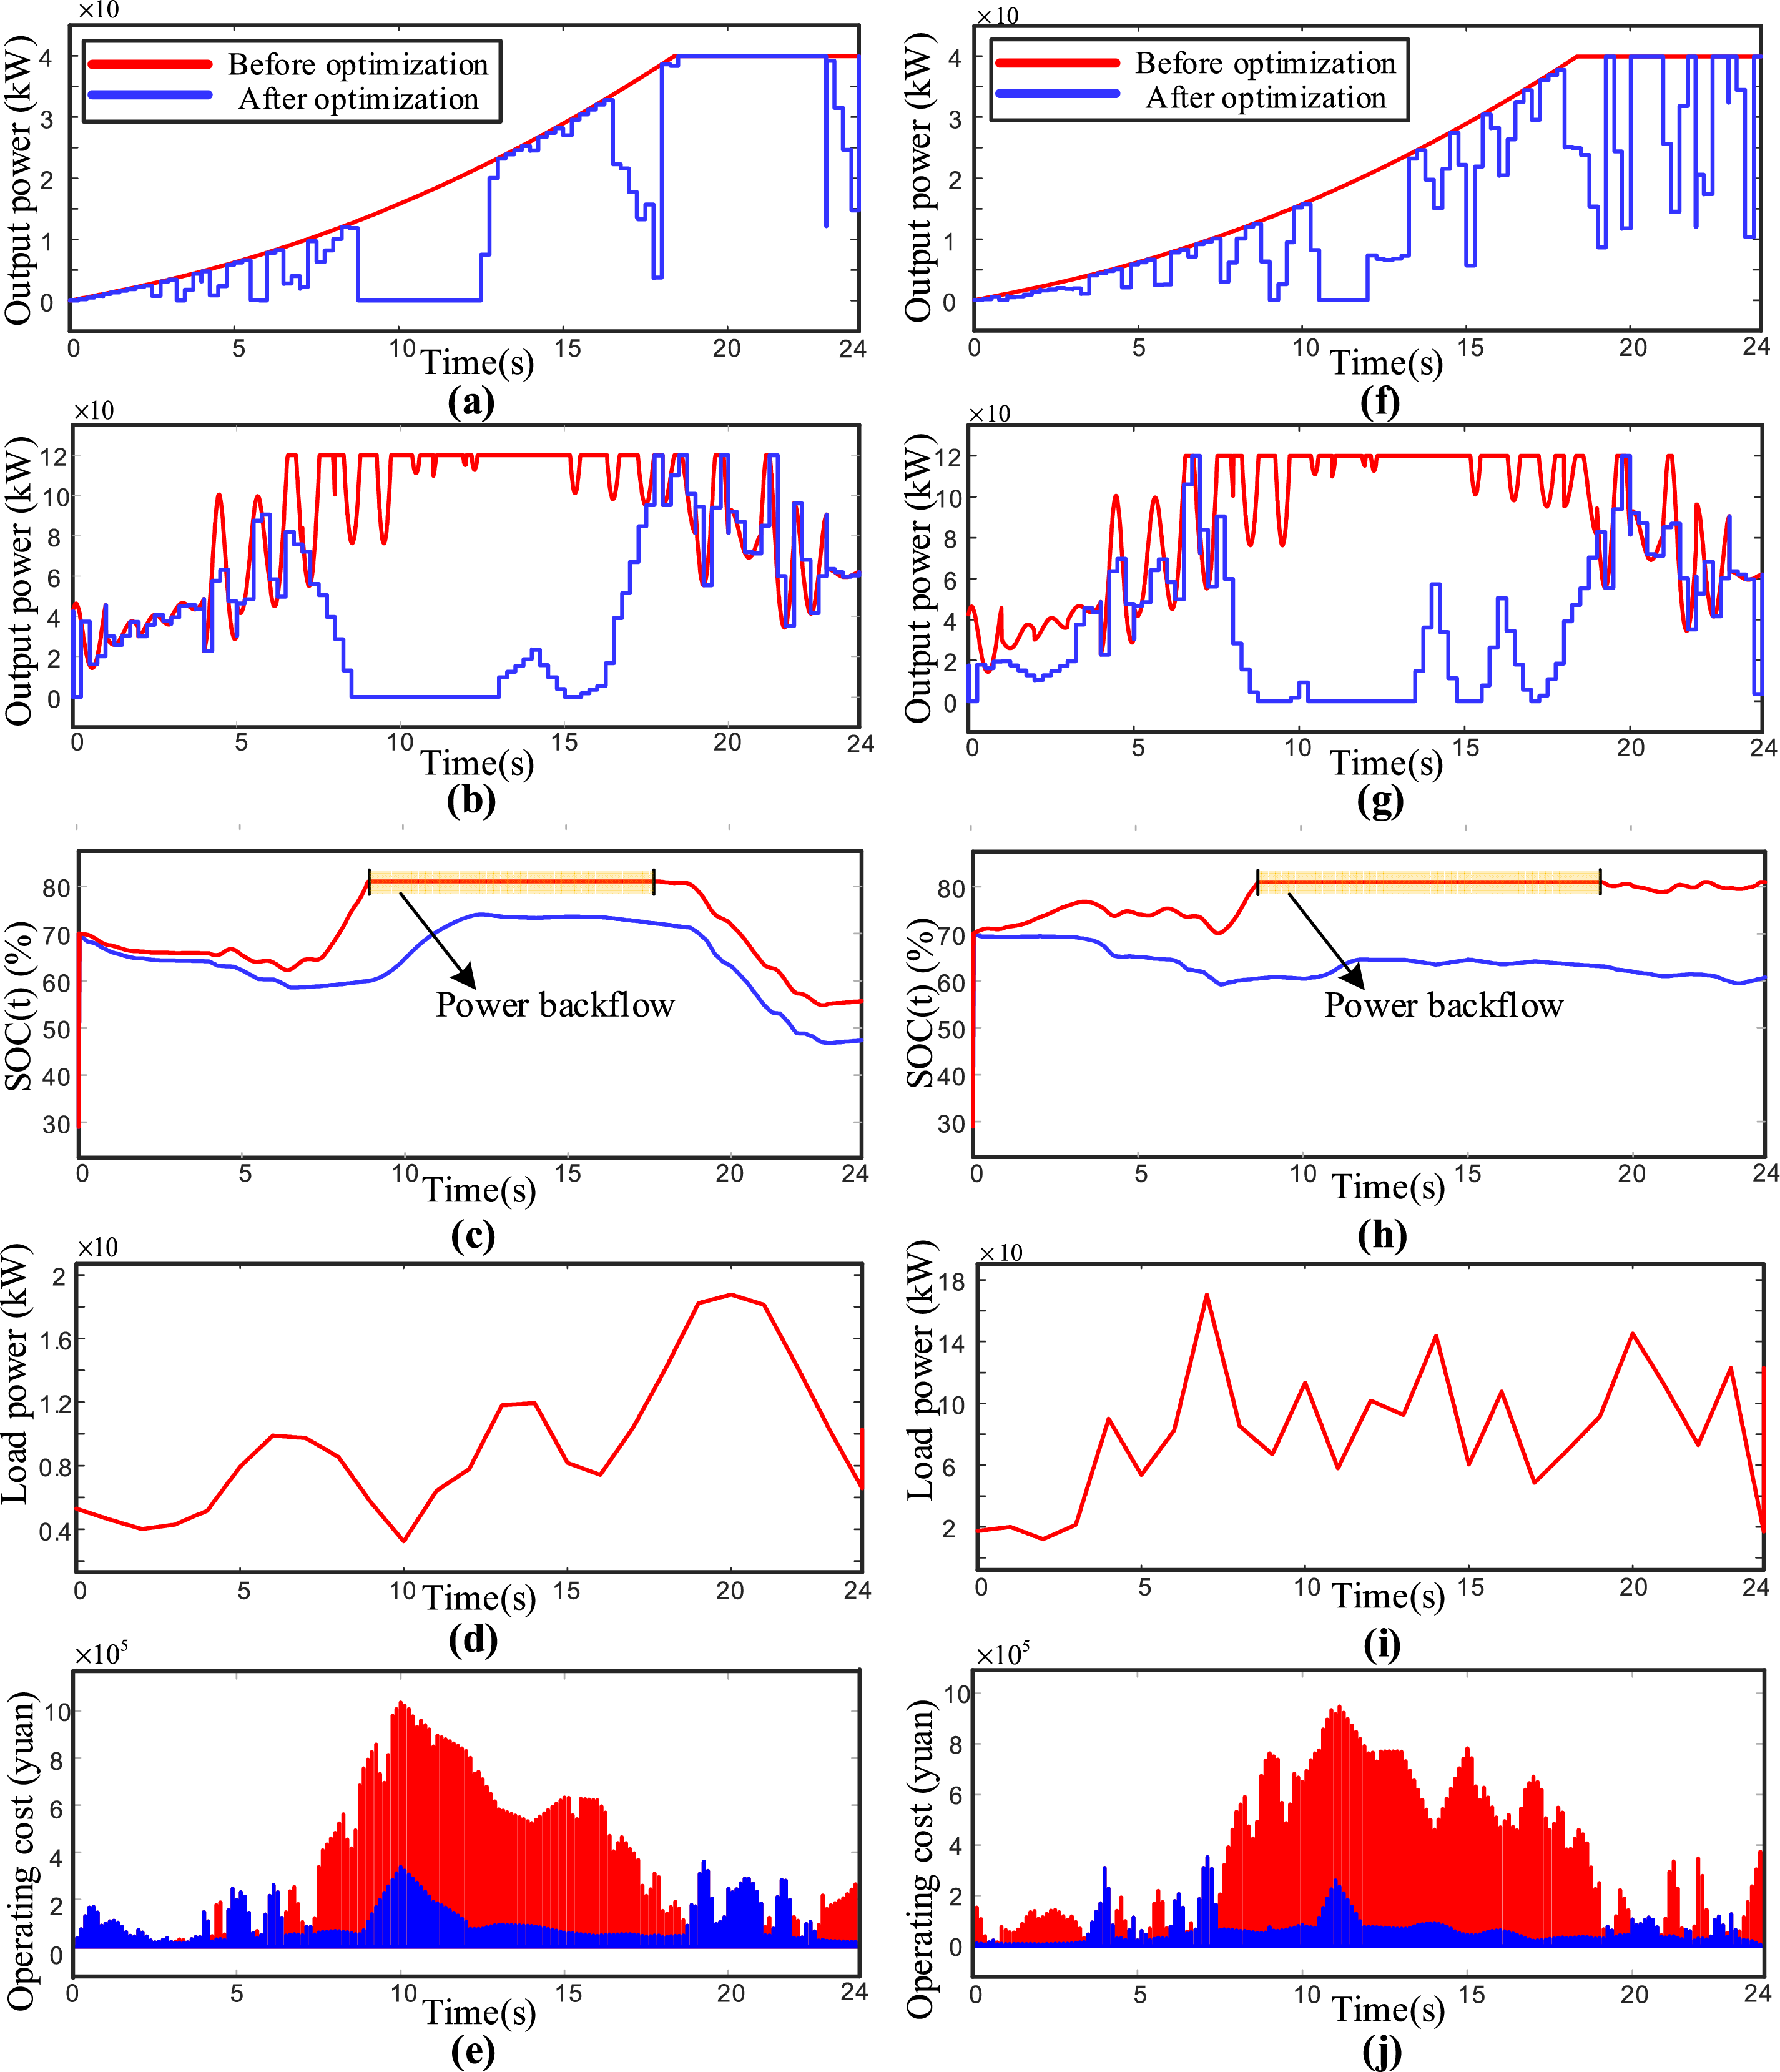
Figure 9: Energy optimization simulation results. (a) Optimization curve of diesel generator output; (b) Optimization curve of wind turbine output; (c) Energy storage system charge state change curve; (d) Ordinary residential load curve; (e) Comparison chart of operating costs of distribution network; (f) Optimization curve of diesel generator output; (g) Optimization curve of wind turbine output; (h) Energy storage system charge state change curve; (i) Steel plant load curve; (j) Comparison chart of operating costs of distribution network (The above figures all adopt a time scaling in which one hour is equivalent to one second)
According to the simulation results, it is observed that before optimization, both wind power and diesel generator outputs operated at their maximum power levels. As shown in Fig. 9c,h, this resulted in the output power from distributed resources exceeding the energy storage system’s capacity during the periods of 9–17 and 8–19 s, respectively. Simultaneously, Fig. 9e,j indicates that due to the high cost coefficient assigned to energy backflow from the storage system, the overall operating cost increased significantly during these intervals. Without appropriate control measures, such conditions may lead to power backflow and other operational issues that could jeopardize the stability of the reconfigurable distribution network.
After applying the optimization algorithm, Fig. 9a,b,f,g demonstrates that the outputs of wind and diesel generators are effectively adjusted in response to load variations. As a result, the energy storage system’s SOC, shown in Fig. 9c,h, remains within the safe operating range of 30% to 80%. This achieves effective energy optimization management, prevents power backflow, and significantly reduces the operating cost of the reconfigurable distribution network. The simulation results confirm the effectiveness of the Bald Eagle Search algorithm in managing energy distribution under complex and dynamic conditions.
This paper applies the BES optimization algorithm to enhance energy management in reconfigurable distribution networks with high penetration of renewable energy, aiming to minimize operating costs while preventing power backflow. The study begins by establishing mathematical models for each component within the reconfigurable distribution network, followed by the formulation of an operating cost objective function that incorporates power backflow penalties. The BES algorithm is then employed to optimize energy redistribution effectively. Simulation results validate the proposed method’s accuracy and effectiveness, demonstrating its potential to enhance both the economic performance and operational safety of high-renewable-penetration distribution networks. In future research, we plan to conduct comparative studies of various mainstream optimization algorithms focusing on aspects such as convergence speed and avoidance of local optima. Moreover, the proposed BES-based optimization framework could be further extended to explicitly address uncertainties in renewable generation and load demand. Potential approaches include scenario generation, which models multiple possible operating conditions; robust optimization, which ensures stable performance under worst-case scenarios; stochastic programming, which incorporates the probabilistic nature of uncertainties; and fuzzy control, which provides a rule-based way to handle imprecise or incomplete information. Integrating such techniques would enhance the adaptability and practical relevance of the proposed strategy in real-world reconfigurable distribution networks with high renewable penetration.
Acknowledgement: This research was supported by State Grid Jiangsu Electric Power Co., Ltd. The author expresses sincere gratitude to all those who participated in this study.
Funding Statement: This study is funded by the Science and Technology Project of State Grid Jiangsu Electric Power Co., Ltd. (Project No. J2024066).
Author Contributions: The authors confirm contribution to the paper as follows: study conception, task division, content planning, simulation validation, and draft manuscript preparation: Jian Wang, Hui Qi; project introduction, progress and direction oversight, funding acquisition, and final manuscript review: Lingyi Ji; data support, practical validation, and final manuscript review: Zhengya Tang, Hui Qian. All authors reviewed the results and approved the final version of the manuscript.
Availability of Data and Materials: The authors confirm that the data used in this study are available on request. Data supporting this study are included in the article.
Ethics Approval: Not applicable.
Conflicts of Interest: The authors declare no conflicts of interest to report regarding the present study.
Abbreviations
| BES | Bald Eagle Search |
| SOC | State of Charge |
| PV | Photovoltaic |
References
1. Behbahani MR, Jalilian A, Bahmanyar A, Ernst D. Comprehensive review on static and dynamic distribution network reconfiguration methodologies. IEEE Access. 2024;12(3):9510–25. doi:10.1109/ACCESS.2024.3350207. [Google Scholar] [CrossRef]
2. Di Fazio AR, Risi C, Russo M, De Santis M. Coordinated optimization for zone-based voltage control in distribution grids. IEEE Trans Ind Appl. 2022;58(1):173–84. doi:10.1109/TIA.2021.3129731. [Google Scholar] [CrossRef]
3. Clavijo-Camacho J, Ruiz-Rodríguez FJ, Sánchez-Herrera R, Alamo AC. Advanced distribution system optimization: utilizing flexible power buses and network reconfiguration. Appl Sci. 2024;14(22):10635. doi:10.3390/app142210635. [Google Scholar] [CrossRef]
4. Mansouri SA, Ahmarinejad A, Nematbakhsh E, Javadi MS, Esmaeel Nezhad A, Catalão JPS. A sustainable framework for multi-microgrids energy management in automated distribution network by considering smart homes and high penetration of renewable energy resources. Energy. 2022;245(2):123228. doi:10.1016/j.energy.2022.123228. [Google Scholar] [CrossRef]
5. Aguila-Leon J, Vargas-Salgado C, Chiñas-Palacios C, Díaz-Bello D. Energy management model for a standalone hybrid microgrid through a particle swarm optimization and artificial neural networks approach. Energy Convers Manag. 2022;267(1):115920. doi:10.1016/j.enconman.2022.115920. [Google Scholar] [CrossRef]
6. Chakraborty A, Ray S. Optimal allocation of distribution generation sources with sustainable energy management in radial distribution networks using metaheuristic algorithm. Comput Electr Eng. 2024;116(1):109142. doi:10.1016/j.compeleceng.2024.109142. [Google Scholar] [CrossRef]
7. Liu LN, Yang GH. Distributed optimal energy management for integrated energy systems. IEEE Trans Ind Inform. 2022;18(10):6569–80. doi:10.1109/TII.2022.3146165. [Google Scholar] [CrossRef]
8. Ye FH, Xiong GJ, Yang ZX, Xu B. AC/DC interconnected distribution network economic dispatch based on EWOA. Mod Electron Tech. 2024;47(18):15–21. (In Chinese). doi:10.16652/j.issn.1004-373x.2024.18.003. [Google Scholar] [CrossRef]
9. Hizarci H, Demirel O, Turkay BE. Distribution network reconfiguration using time-varying acceleration coefficient assisted binary particle swarm optimization. Eng Sci Technol Int J. 2022;35(3):101230. doi:10.1016/j.jestch.2022.101230. [Google Scholar] [CrossRef]
10. Wang Z, Hou H, Wei R, Li Z. A distributed market-aided restoration approach of multi-energy distribution systems considering comprehensive uncertainties from typhoon disaster. IEEE Trans Smart Grid. 2025;16(5):3743–57. doi:10.1109/TSG.2025.3578484. [Google Scholar] [CrossRef]
11. Liang J. Research on distributed optimization method for operation control of active distribution network [master’s thesis]. Guangzhou, China: South China University of Technology; 2019. (In Chinese). doi: 10.27151/d.cnki.ghnlu.2019.001548. [Google Scholar] [CrossRef]
12. Liu DR, Chen SY, Ma M, Wang HH, Hou JX, Ma SY. A Review on models for photovoltaic generation system. Power Syst Technol. 2011;35(8):47–52. (In Chinese). doi:10.13335/j.1000-3673.pst.2011.08.017. [Google Scholar] [CrossRef]
13. Putra JT, Sarjiya, Setyonegoro MIB. Modeling of high uncertainty photovoltaic generation in quasi dynamic power flow on distribution systems: a case study in Java Island. Indones Results Eng. 2024;21(1):101747. doi:10.1016/j.rineng.2023.101747. [Google Scholar] [CrossRef]
14. Jiang J, Chen W, Wu G, Jiao Y. Power supply service: assessing the feasibility and merits of applying electric emergency power vehicles. In: 2019 4th International Conference on Control and Robotics Engineering (ICCRE); 2019 Apr 20–23; Nanjing, China. p. 60–4. doi:10.1109/iccre.2019.8724341. [Google Scholar] [CrossRef]
15. Rauniyar M, Bhujel N, Aryal T, Cicilio P, Tamrakar U, Fourney R, et al. Experimental validation of a diesel genset frequency dynamics model for use in remote area power systems. IEEE Access. 2024;12:86319–32. doi:10.1109/ACCESS.2024.3413788. [Google Scholar] [CrossRef]
16. Zhang W, Zhang Z, Lu J, Li Y, Chen T. Discrete-time position sensorless current control for permanent magnet synchronous motors with an accuracy-improved phase-locked loop. IEEE Trans Ind Electron. 2024;71(7):6677–88. doi:10.1109/TIE.2023.3310030. [Google Scholar] [CrossRef]
17. Alzayed M, Chaoui H, Farajpour Y. Dynamic direct voltage MTPA current sensorless drives for interior PMSM-based electric vehicles. IEEE Trans Veh Technol. 2023;72(3):3175–85. doi:10.1109/TVT.2022.3219763. [Google Scholar] [CrossRef]
18. Wang N. Research on optimal operation of islanded microgrid system including electrochemical energy etorage [Ph.D. thesis]. Lanzhou, China: Lanzhou University of Technology; 2023. (In Chinese). doi:10.27206/d.cnki.ggsgu.2023.000006. [Google Scholar] [CrossRef]
19. Luo F, Bu Q, Ye Z, Yuan Y, Gao L, Lv P. Dynamic reconstruction strategy of distribution network based on uncertainty modeling and impact analysis of wind and photovoltaic power. IEEE Access. 2024;12(4):64069–78. doi:10.1109/ACCESS.2024.3394856. [Google Scholar] [CrossRef]
20. Alsattar HA, Zaidan AA, Zaidan BB. Novel meta-heuristic bald eagle search optimisation algorithm. Artif Intell Rev. 2020;53(3):2237–64. doi:10.1007/s10462-019-09732-5. [Google Scholar] [CrossRef]
Cite This Article
 Copyright © 2025 The Author(s). Published by Tech Science Press.
This work is licensed under a Creative Commons Attribution 4.0 International License , which permits unrestricted use, distribution, and reproduction in any medium, provided the original work is properly cited.
 Downloads
 Citation Tools