
 Submit a Paper
 Propose a Special lssue
 Open Access
ARTICLE

Techno-Economic Analysis for Hydrogen Storage Integrated Grid Electric Vehicle Charging Bays: A Case Study in Kuching, Sarawak
1 Faculty of Engineering, Computing and Science, Swinburne University of Technology, Jalan Simpang Tiga, Kuching, 93350, Malaysia
2 College of Engineering, Faculty of Computing, Engineering and the Built Environment, Birmingham City University, West Midlands, Birmingham, B4 7XG, UK
* Corresponding Author: Hadi Nabipour Afrouzi. Email:
(This article belongs to the Special Issue: Artificial Intelligence-Driven Collaborative Optimization of Electric Vehicle, Charging Station and Grid: Challenges and Opportunities)
Energy Engineering 2025, 122(11), 4755-4775. https://doi.org/10.32604/ee.2025.069980
Received 04 July 2025; Accepted 26 August 2025; Issue published 27 October 2025
 View Full Text
 Download PDF
Abstract
In this article, a hybrid energy storage system powered by renewable energy sources is suggested, which is connected to a grid-tied electric vehicle charging bay (EVCB) in Sarawak and is examined for its techno-economic effects. With a focus on three renewable energy sources, namely hydrokinetic power, solar power, and hydrogen fuel cells, the study seeks to minimize reliance on the electrical grid while meeting the growing demand from the growing electric vehicle (EV) infrastructure. A hybrid renewable energy storage system that combines solar power, hydrogen fuel cells, hydrokinetic power, and the grid was simulated and analyzed. The system design leverages Kuching, Sarawak’s unique geographical and renewable source profile, including abundant hydro and solar potential as well as supportive regional energy policies, to optimize economic and environmental performance. The findings showed that the techno-economic evaluation of the hydrogen storage-integrated EVCB system in Kuching, Sarawak, demonstrates promising performance under current market conditions. The system successfully meets charging demand while generating an annual profit of approximately $51,104.30 through excess energy sales to the grid. Hydrokinetic power dominates generation, contributing 81.4% of the total output, with the hydrogen fuel cell adding a modest 2.84%. The system achieves a cost of electricity of $0.0617/kWh and a Levelized Cost of Hydrogen of approximately $7.33/kg, confirming its economic feasibility. With a total investment of approximately $2.43 million, the hydrogen storage subsystem represents the largest cost share at 55.2% ($1.34 million). A high renewable fraction of 97.2% enhances the system’s sustainability, which is further supported by significant annual emissions reductions of approximately 102,209 kg of carbon dioxide, 8.48 kg of sulfur dioxide, and 43.1 kg of nitrogen oxides. These results demonstrate that the proposed hybrid EVCB exhibits excellent economic and environmental sustainability, making it a viable option for Sarawak’s sustainable electric vehicle charging infrastructure.Keywords
The use of electric vehicles (EVs) and renewable energy systems (RES) has significantly increased due to the growing pressure to adopt sustainable energy technologies and reduce greenhouse gas emissions. According to IRENA’s analysis, more than 90% of the solutions influencing a good outcome in 2050 include energy efficiency, green hydrogen, bioenergy combined with carbon capture and storage (BECCS), electrification, direct supply, and renewable energy [1]. According to the International Energy Agency, announcements regarding battery production capacity delivered by 2030 as of March 2023 are more than enough to meet the demand predicted by government pledges and could even cover the demand for electric vehicles under the scenario of Net Zero Emissions by 2050 [2]. Therefore, it is quite probable that electric car sales shares will be larger than those projected based on the present government policy and national targets [2].
Multiple studies have evaluated the techno-economic analysis of hybrid RES overseas. A case study in Tocantins, Brazil, has examined how a photovoltaic-fuel cell-battery system might be used to provide electricity to a remote settlement in the Amazon region [3]. The results have shown that the best option for storing energy from the PV system is the use of batteries. However, the excessive cost of its components prevents the region’s photovoltaic-fuel cell-battery system from being implemented in the short term. Another study in Iran investigated the techno-economic viability of an off-grid integrated solar, wind, and hydrokinetic plant to co-generate hydrogen and electricity for a remote micro-community [4]. Analysis and comparison of different configurations using one or two energy sources revealed that the most cost-effective system is the one that combines three resources, which are hydrokinetic, wind, and solar energy.
Similarly, recent studies have evaluated the techno-economic analysis of hybrid RES in Malaysia. A study investigates a hybrid RES comprising of photovoltaic, wind turbines, lithium-ion batteries, a hydrogen tank, a fuel cell, and electrolyzers across Pulau Pinang, Johor Bharu, and Kuala Terengganu [5]. The study shows that hybrid systems significantly improve grid independence and energy reliability while varying in cost-effectiveness depending on local conditions. Due to Sarawak’s geographical location, wind turbines are not suitable for implementation in Sarawak due to the dense rainforests, mountain ranges, and valleys that disrupt wind flow, resulting in low and inconsistent wind speeds in the region. Another study in Sri Aman, Sarawak, demonstrated favorable results of utilizing a hybrid RES that utilizes PV [6]. The study investigated different configurations of hybrid RES and concluded that the configuration that uses PV, hydrogen, and a micro-hydro system proved to be the most cost-effective and reliable in Sri Aman.
A key limitation in the current body of research is the lack of comprehensive studies on the integration of hybrid renewable energy systems, specifically those combining solar, hydrokinetic, and sole hydrogen-based storage technologies for decentralized EVCB infrastructure. While various renewable technologies have been explored independently, their combined application for off-grid or partially grid-independent EV charging remains underexplored within the context of Sarawak. Considering the region’s unique resource profile, there is a critical need for technical assessments that evaluate the feasibility, reliability, and energy performance of such integrated systems. This study aims to fill this gap by addressing the techno-operational limitations and deployment challenges of hybrid RES EVCBs in Sarawak.
The growing adoption of EVs may significantly increase the electricity demand. However, the lack of efficient EV charging infrastructure in Sarawak remains a challenge to the widespread adoption of EVs [7]. To address the shortage of EVCB in Sarawak, this study proposes a hybrid RES consisting of the integration of solar energy, hydrokinetic technology, and hydrogen-based storage which not only ensures a high renewable fraction of total energy generation but also reduces the dependence on grid electricity. The key contributions of this study are as follows:
1. Cost-Effectiveness and Economic Viability: The techno-economic analysis shows that hybrid systems reduce levelized energy costs and enhance local energy security by optimizing resource use. Incorporating a hybrid RES consisting of the integration of solar energy, hydrokinetic technology, and hydrogen-based storage not only ensures a high renewable fraction of total energy generation but also reduces the dependence on grid electricity.
2. Environment Sustainability and Clean Energy Transition: Hybrid RES lowers carbon emissions by minimizing reliance on fossil fuels and facilitating the integration of green technologies like hydrogen fuel cells. This aligns with the “clean energy” aspect of Sustainable Development Goal 7, which aims to ensure access to affordable, reliable, sustainable, and modern energy for all.
This section presents the literature review conducted on power generation infrastructure in Sarawak, as well as hydrogen production, electric vehicle charging infrastructure, and technologies in Malaysia and abroad.
2.1 Sarawak’s Renewable Energy Landscape and Potential for Hydrogen-Integrated EV Infrastructure
In today’s time, the main power generation and supplier in Sarawak is Sarawak Energy Berhad (SEB). The main power generation infrastructures run by SEB are diesel power plants with 113.8 MW, gas power plants with 165 MW, coal power plants with 270 MW, and hydroelectric plants with 2400 MW. In SEB’s annual sustainability report 2020, the company has been transformed into a renewable energy developer and power utility by expanding its hydropower power generation infrastructure since 2011. In 2011, the total power generation of hydropower plants was 16.51% at 1247.52 GWh; in 2020, the power generation of hydropower plants has drastically increased to 21,606.36 GWh, constituting nearly 80% of the total power generation of Sarawak [8]. The carbon dioxide (CO2) emission intensities for the main grid, northern grid, and stand-alone grids are 0.203, 0.607, and 0.834 tCO2/MWh, respectively. In 2020, total sulfur oxides (SOx) and nitrogen oxides (NOx) emissions from the main grid were reported at 8.44 × 10⁻⁵ and 1.66 × 10⁻⁵ t, respectively.
Sarawak has numerous rivers, making hydropower a popular source of energy in the state. Hydrokinetic technology offers a viable alternative in smaller rivers that are tributaries to the larger rivers, provided there is a sufficient flow of free-moving water. Hydrokinetic technology generates electricity from the kinetic energy of moving water, such as river currents, tidal flows, ocean currents, or waves, without large dams or elevation differences, offering predictable power, minimal infrastructure, and low environmental impact [9]. Sarawak’s abundant rivers and tidal channels provide consistent flows ideal for such a system, enabling rural electrification, diversifying the renewable mix, and supporting sustainable development.
Building on Sarawak’s grid profile, a broader international perspective reveals hydrogen integration is increasingly recognized as a strategy for enhancing grid stability while advancing decarbonization. Projects demonstrate how renewable-powered hydrogen production can absorb surplus wind and solar energy, while offering grid balancing services [10]. Comparative analyses highlight regional strengths, where hydropower-to-hydrogen in Norway and Canada, achieved near-zero lifecycle emissions, whereas solar-to-hydrogen in high irradiance regions like Australia and Spain have shown significant reduction in production costs [11]. These international experiences suggest that Sarawak, with its hydropower-rich grid, is well-positioned to adopt similar integrated hydrogen pathways to support EV charging infrastructure.
2.2 Hydrogen Production and Technologies in Malaysia in the Context of Global Advancements
From a global perspective, hydrogen is being recognized as a critical pillar in decarbonization strategies. According to the IEA’s Global Hydrogen Review 2024 [12], global hydrogen demand reached nearly 97 Mt in 2023, with low-emission hydrogen remaining under 1 Mt. Encouragingly, announced green-hydrogen projects could yield up to 49 Mt pa by 2030 if fully realized. This projected growth is largely driven by electrolysis projects, with announced electrolysis capacity amounting to 520 GW by 2030. Breaking this deployment down to technology, alkaline electrolysis currently leads in global installations, followed closely by PEM systems. Although direct CAPEX comparisons are complicated by differences in system scope and deployment size, capital expenditure trends are clear. Alkaline systems typically range from USD 500–1400/kW, whereas PEM systems remain at USD 1100–1800/kW [10]. Over recent decades, alkaline electrolysers have achieved only moderate cost reductions due to their technological maturity, while PEM systems have demonstrated steeper cost declines alongside superior flexibility, making them better suited for integration with variable renewable energy sources in the future.
Hydrogen-based storage uses renewable energy to produce hydrogen via electrolyzers, store it in tanks, and convert it back to electricity through fuel cells. It provides high energy density, long-term storage, and environmental benefits by cutting greenhouse gas emissions. This technology is applied in EV charging infrastructures, grid stabilization, transportation, industrial processes, and remote areas, ensuring efficient use of surplus renewable energy and a reliable power supply. By addressing renewable energy variability and grid challenges, hydrogen systems offer scalable, eco-friendly solutions that support global sustainability goals [5].
The Malaysian government has implemented a range of strategies to support initiatives in fuel shifting policies. As part of the 2020 budget, the government extended green technology tax incentives until 2023, signaling a sustained commitment to clean energy transition [13,14]. Although these incentives were initially toward conventional renewable energy technologies such as solar, it is a step toward broader developments, eventually extending to hydrogen as a viable energy carrier.
Between 1997 to 2013, the Ministry of Science, Technology and Innovation (MOSTI) allocated RM40 million for hydrogen fuel cell research and development. Several studies have since explored the economic viability of hydrogen energy in Malaysia, with particular emphasis on its integration into the transport sector and its potential for use in hydrogen fuel cell vehicles [15,16]. However, these investigations have generally overlooked other promising applications of hydrogen energy within the country’s broader energy ecosystem.
In terms of hydrogen production, Malaysia has abundant biomass resources, including palm oil residues, wood waste, and paddy husks [17]. These feedstocks, in combination with the country’s ample solar irradiance, offer strong potential for large-scale hydrogen production via biomass conversion and solar-assisted processes.
Hydrogen storage and distribution present significant challenges. While conventional transportation using trucks is a viable option, it inherently limits the volume of hydrogen that can be carried due to space and pressure constraints. Hence, in [18] they argue that distribution using pipelines favors more large-scale hydrogen production. Given Malaysia’s modest demand of hydrogen, which is still at its initial steps in the hydrogen economy, the compression of hydrogen in pressurized vessels and transportation by trucks is an acceptable approach. However, as the hydrogen economy matures, investments in dedicated hydrogen pipelines will be essential to ensure scalability and efficiency.
To facilitate Malaysia’s transition toward a hydrogen economy, the implementation of a comprehensive development framework is crucial. Ref. [14] proposed a structured three-phase roadmap to accelerate hydrogen adoption. In the first phase, fossil-based hydrogen currently used in sectors such as ammonia production and oil refining would be gradually replaced with renewable hydrogen produced from biogas, biomass, and bio-liquids. This transition can be expedited through government incentives, similar to those successfully implemented in the past. Once the use of hydrogen energy is established, the second phase would expand its applications to include industrial boilers, heating systems, and retrofitted vehicles. The third and final phase envisions the widespread integration of hydrogen fuel cell technologies across the transportation sector, combining heat and power systems, and large-scale energy storage solutions.
Sarawak is leading hydrogen development in all of Malaysia due to its abundance of hydropower resources, which can offer a clean and sustainable energy source for green hydrogen production. In 2019, the state celebrated Southeast Asia’s first integrated hydrogen production plant and refueling station in Kuching, alongside the debut of its inaugural hydrogen powered vehicles. This facility can generate 130 kg of hydrogen per day through electrolysis driven by renewable energy sources [19].
Preliminary assessments indicate that Sarawak’s hydropower potential could reach up to 200,000 MW across more than 50 sites, of which approximately 3452 MW is already harnessed, requiring reservoirs that would only occupy less than 2% of the state’s land area if fully developed [20]. Building on this renewable foundation, Sarawak has secured green hydrogen partnerships totaling US $4.2 billion in 2024, with its two flagship projects, H2ornbill and H2biscus, projected to produce a combined 240,000 t per annum of green hydrogen annually once fully operational [21].
To support the upcoming Autonomous Rapid Transit (ART) network under the Kuching Urban Transportation Systems (KUTS), the Sarawak Economic Development Corporation (SEDC) is also finalizing a dedicated hydrogen production plant and refueling station at the Rambus Depot. Scheduled for completion by the end of 2025, this facility is expected to supply approximately 1900 t of hydrogen per year to the ART fleet [22]. These figures demonstrate the scale of hydrogen output that Sarawak can realistically achieve in the coming decade.
Together, these developments highlight Sarawak’s ambition to become a regional clean-hydrogen hub, setting the stage for the integration of hydrogen-based fuel cells into Malaysia’s broader EV charging infrastructure and targeting its green hydrogen exports to strategic markets in East Asia.
2.3 Electric Vehicle Charging Infrastructure and Technologies in Malaysia
The numbers of existing EVCB in Malaysia has reached 3611, which is 36.11% of the targeted 10,000 EVCBs, proposed in the Low Carbon Mobility Action Plan 2021–2030 [23]. In Sarawak, there is only 77 existing EVCBs, which is merely 2.13% of the total existing EVCBs in Malaysia. Currently, the existing EVCBs in Sarawak are mainly concentrated in major cities and east side towns.
The EVCBs installed in Malaysia provide two types of chargers: AC and DC chargers. The EVCBs in Malaysia strictly follow a specific charging standards for compatibility and safety considerations. In which there are 3 different charging levels for both AC and DC charging. The difference between charger levels is the operating voltage, current and maximum power. For AC charging, Level 1 AC chargers operate at 120 V with current range of 12 to 16 A, providing a maximum power of 1.92 kW, Level 2 AC chargers operate at 240 V with current 80 A, providing power from 1.92–19.2 kW, the highest Level 3 AC chargers operate at 480 V with current larger than 100 A, providing minimum power of 50 kW [24].
For DC chargers, both Level 1 and Level 2 DC chargers operate at voltage range 200–450 V, but at different current of 80 and 200 A, respectively. Level 3 DC chargers operate with slightly larger voltage range from 200 to 600 V with current 400 A [24]. DC chargers provide greater charging power than AC chargers, thus shorter charging time is required when using DC chargers in EVCBs.
3 System Design and Configuration
This section provides a description and modelling of the major system components, including the solar photovoltaic (PV) system, hydrokinetic power system, proton exchange membrane (PEM) electrolyzer, hydrogen fuel cell (FC), and hydrogen storage tank. Each component plays a critical role in energy generation, conversion, and storage, contributing to the overall efficiency and performance of the system.
The PV panels generate electricity based on the level of solar irradiance, the tilting angle and the orientation of the solar panels [5]. These parameters can be adjusted to maximize sunlight capture, thus the power generation of the solar PV panels.
Unlike conventional hydrostatic power systems that rely on gravitational potential energy, hydrokinetic turbines, also known as free-flow turbines, utilize the kinetic energy of naturally flowing water. Hydrokinetic turbines can operate in low-head conditions, making them suitable for deployment in rivers where sufficient flow velocity to generate usable energy [9]. The formula used to estimate the electrical power output from a hydrokinetic system is:
where
The PEM electrolyzer generates electricity by decomposing water into hydrogen (H2) and oxygen (O2), the generated H2 can be stored in a hydrogen tank as a form of energy storage system for future use [5]. The operating power consumption of the electrolyzer is given by:
where
While the PEM electrolyzer decomposes water into hydrogen and oxygen, the FC conducts the reverse process by combining the stored hydrogen and atmosphere oxygen to generate electricity [5]. The output voltage of the FC can be further expressed as:
where E represents the internal voltage,
The hydrogen is produced by the electrolyzer using the surplus electricity, the hydrogen gases will be directed and stored inside the hydrogen tank [5]. The accumulated hydrogen gas inside the tank storage is defined as:
where
where
This section presents the detailed configuration and modeling approach of the proposed EVCB system. It includes the system architecture, electric vehicle charging demand modeling, site selection for renewable energy sources, river flowrate estimation, cost and environmental impact analyses. These components form the basis for evaluating the technical performance and economic viability of the integrated system.
Fig. 1 shows the proposed EVCB system architecture, featuring a DC bus and an AC bus for power distribution and conversion, connected to the AC-DC system converter in between to convert the power between DC and AC. The DC bus is interfaced with the solar PV system (LR6-60PE solar panels), electrolyzer, and hydrogen fuel cell, enabling DC energy exchange and hydrogen production/storage operations. The AC bus is connected to the hydrokinetic system (10 units of HK40), the utility grid, and the EVCB, allowing AC power flow to and from the grid and local generation units.
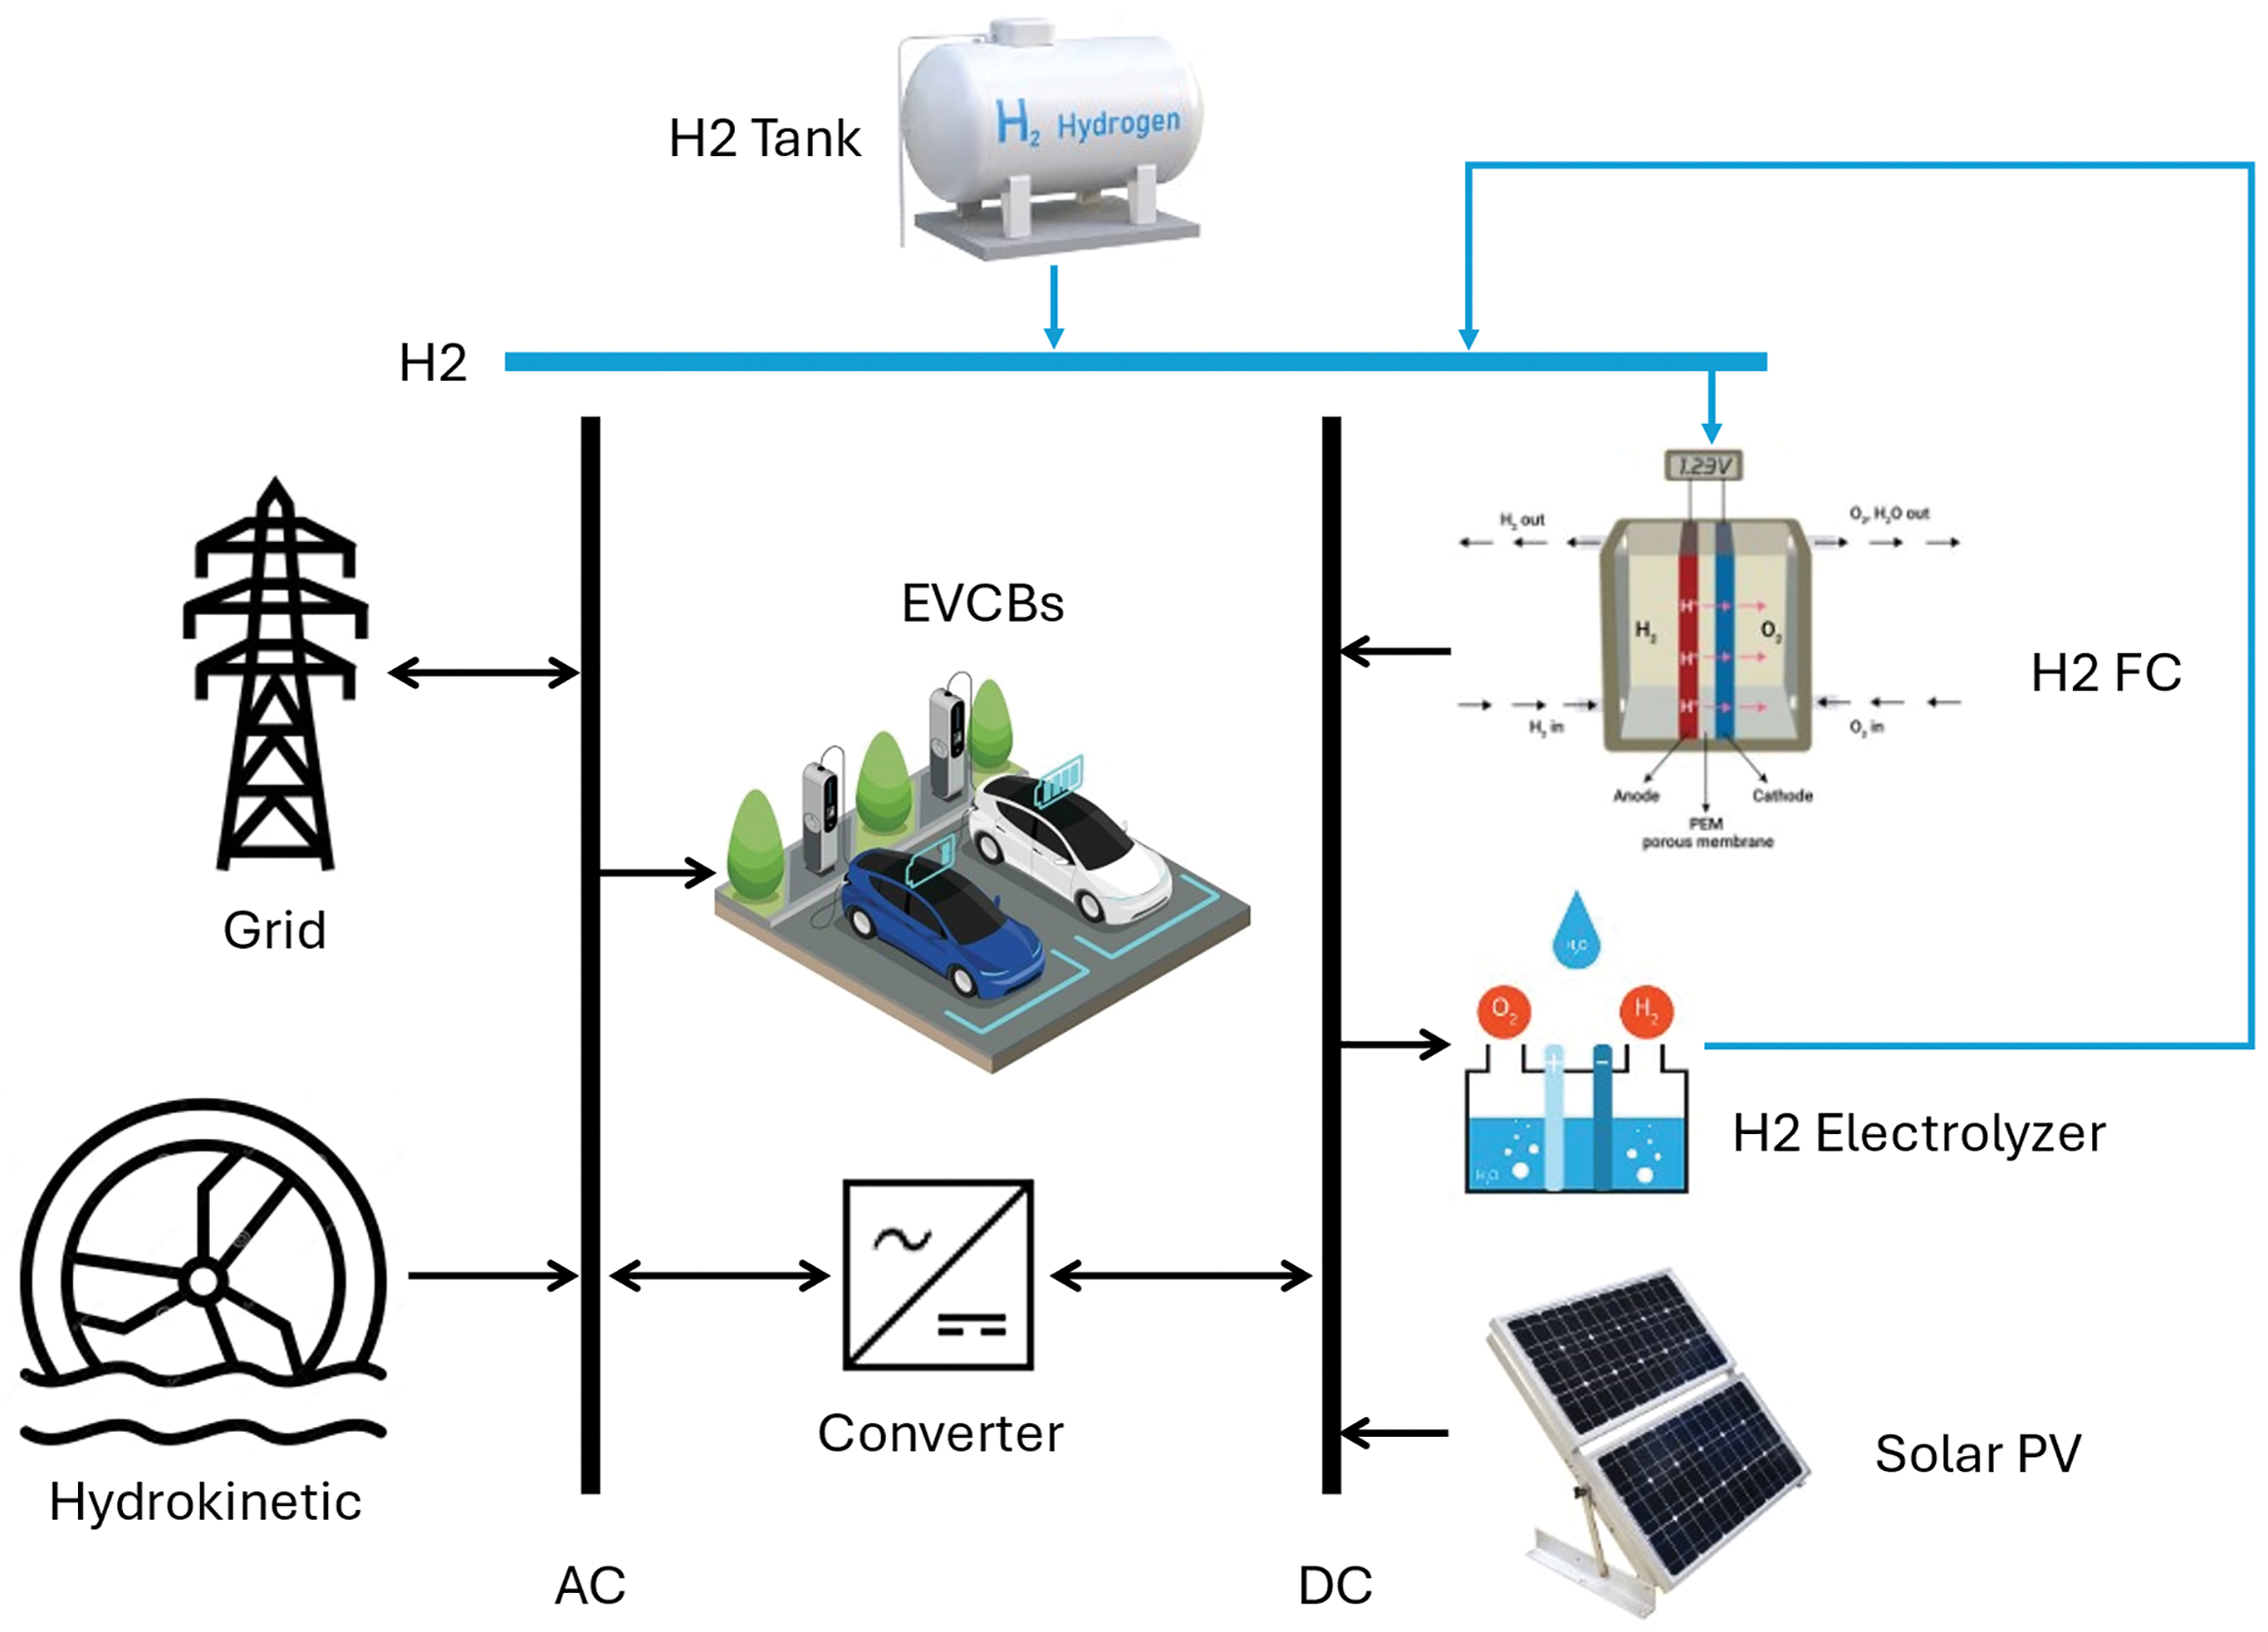
Figure 1: EVCB power supply system setup
The grid power and sellback price are $0.315 and $0.1/kWh, respectively. The emissions factors of the grid is set as 200, 0.02 and 0.08 g/kWh for carbon dioxide, sulfur dioxide, and nitrogen oxides, respectively. The optimal configuration of each system component was determined using an optimization technique. Fig. 2 shows the overall structure of the study methodology. The methodology begins with the system objective definition, that is to reach the goal of fulfilling the load demand while achieving the lowest cost of energy (COE), net present cost (NPC) and levelized cost of hydrogen (LCOH), with emission reduction and high renewable share in power generation.
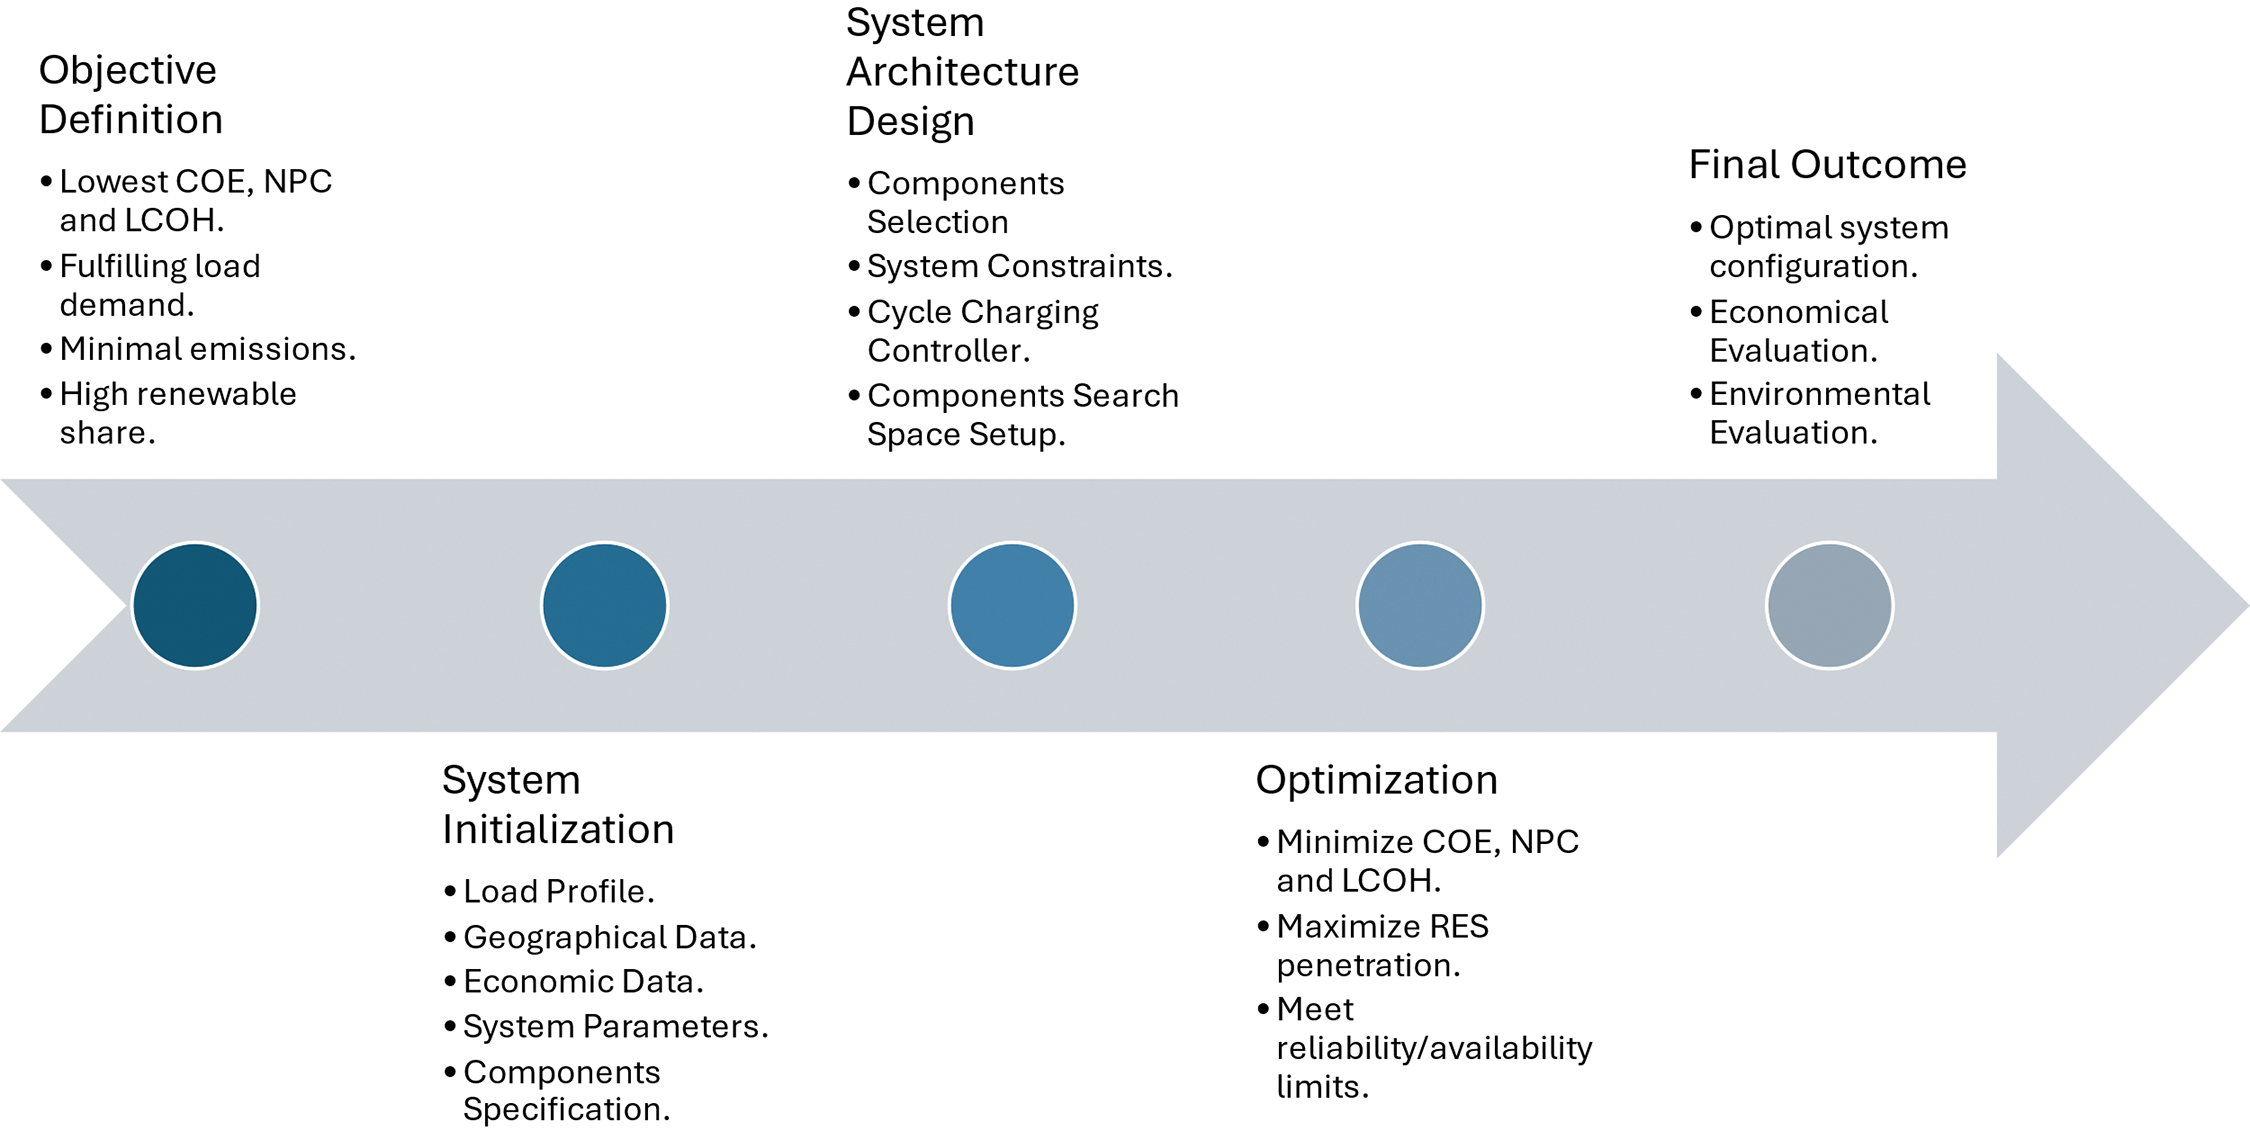
Figure 2: EVCB system optimization process
The proposed algorithm utilizes multiple categories of input data, namely load profile data, geographical data, system-specific parameters, economic data, and component specifications. The load profile characterizes the EV charging demand over the study period, while the geographical data include solar irradiance, ambient temperature, and hydrokinetic resource availability. The system-specific parameters define the grid emission factors for CO2, SO2, and NOx. The economic data encompasses grid electricity purchase and sale tariffs, discount rates, and component-related costs, including capital expenditure, operation and maintenance (O&M) expenses, and replacement costs. Finally, the component specifications outline the efficiency, power ratings, and expected service lifetimes of each system component.
In designing the system architecture for the proposed system, the process begins with the selection of key components, namely the solar PV panels, hydrokinetic turbines, hydrogen tanks, electrolyzer, FC, and system converters. The design must comply with predefined system constraints, particularly the capacity and power limits assigned to each component. In this configuration, the solar PV system and the hydrokinetic system serve as the primary energy generation units, with their output directed first to meet the EV charging demand and any surplus allocated to the electrolyzer for hydrogen production and storage. The system employs a cycle charging controller, whereby the fuel cell, when dispatched, operates at or near full capacity, supplying electricity to the EV chargers and directing any excess to the electrolyzer. This control strategy enhances fuel cell efficiency while ensuring sufficient hydrogen reserves. The component search space in HOMER is then defined to establish the range of capacities and configurations for optimization. For this study, the search space parameters include the installed capacities of the solar PV system, hydrokinetic system, electrolyzer, hydrogen tank, and FC, as well as the system converter ratings.
During the optimization stage, the system seeks to minimize the COE, NPC, and LCOH, while maximizing renewable energy system penetration and ensuring sufficient reliability and availability to meet the EVCB demand. After the optimization stage is completed, the optimal system configuration can be determined, along with the overall system’s economic and environmental evaluation.
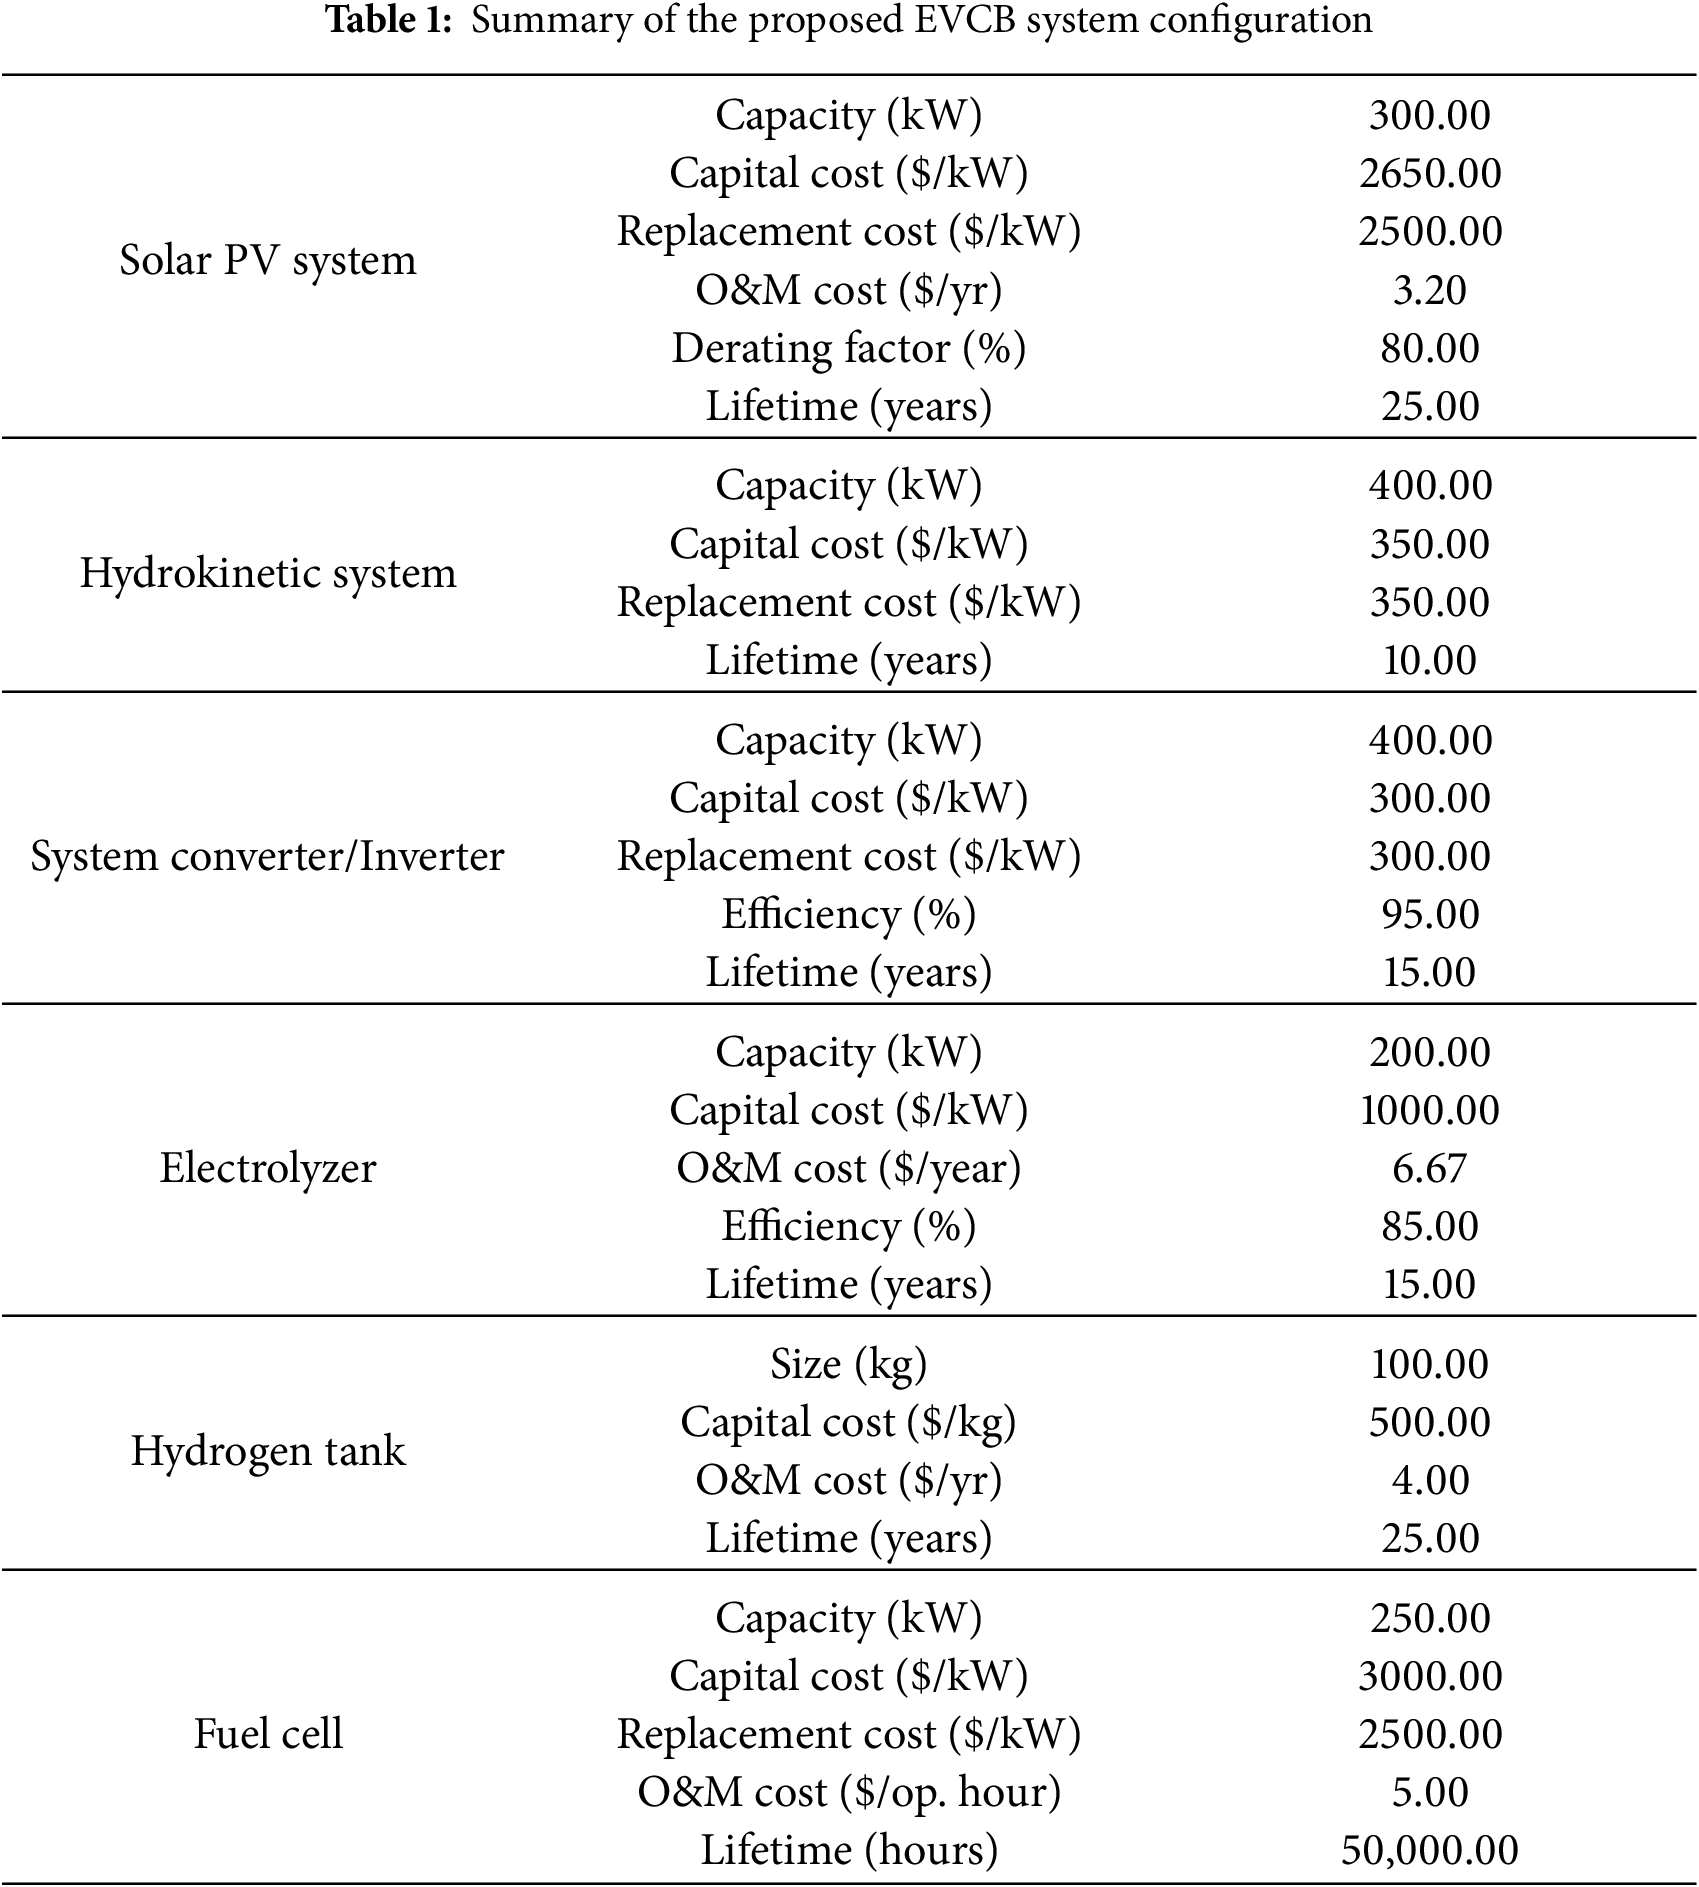
Table 1 summarizes the key specifications and cost parameters of the components selected for the proposed hydrogen-storage EVCB system. The solar PV system is designed with a capacity of 300 kW, featuring a capital cost of $2650 per kW, a replacement cost of $2500 per kW, and an O&M cost of $3.20 per year per kW. It has a derating factor of 80% and an expected lifetime of 25 years. The hydrokinetic system is sized at 400 kW, with both capital and replacement costs set at $350 per kW and a lifetime of 10 years. The system converter/inverter is rated at 400 kW capacity, exhibiting a capital and replacement cost of $300 per kW, an efficiency of 95%, and a lifetime of 15 years. The electrolyzer is specified at 200 kW capacity, with a capital cost of $1000 per kW, an O&M cost of $6.67 per year per kW, and an efficiency of 85%, operating for an expected lifetime of 15 years. Hydrogen storage is provided by a 100 kg capacity tank, incurring a capital cost of $500 per kg and an O&M cost of $4.00 per year, with a 25-year service life. Finally, the fuel cell has a capacity of 250 kW, a capital cost of $3000 per kW, a replacement cost of $2500 per kW, and an O&M cost of $5 per operating hour, with an operational lifetime of approximately 50,000 h. These specifications collectively define the technical and economic framework for system optimization and performance evaluation.
4.2 Electric Vehicle Charging Demand Modelling
A proper EV charging demand profile modelling is needed to assess the proposed EV charging system’s ability to fulfill the user demand. The used model is a log-normal distribution proposed by Nandi, et al. [25]. In this mathematical model, the driving distance dd of the EVs follows a log-normal distribution with μ and σ of 41.5 and 12.1, respectively, its PDF is defined as:
Consequently, the SOC of electric vehicles can be modelled as:
The charging start time model of EVs also follows a normal distribution with μ and σ of 12 and 4, respectively [25], its PDF is defined as:
By combining the charging start time and state of charge functions, the estimate PDF of the charging load demand of the EVs at time
where f(Y) is the PDF of charging start time at time instant
where
The selected site for PV installation is in proximity to the Samajaya Industrial Zone, a major hub for high-technology and manufacturing companies. This strategic location presents a potential market opportunity for direct energy sales through PPA, which can leverage consistent and high energy demand of nearby industrial consumers. Additionally, the site is adjacent to existing roads and transmission infrastructure further enhancing its suitability by facilitating grid integration.
Given the industrial designation of the area, it is highly unlikely to be rezoned for residential purposes in the foreseeable future. One limitation of the site is its separation from the Samajaya zone by a river. While the implementation of floating PV systems on the river’s surface could be considered, such an approach may pose risks to aquatic ecosystems and disrupt natural water flow. Therefore, land-based PV deployment currently offers a more environmentally friendly solution.
4.4 Hydrokinetic Site Selection
The chosen locations for installing hydrokinetic turbines are the smaller rivers that are tributaries to the Sarawak River. Kuching has numerous rivers tributary to the Sarawak River, with the major ones being the Maong River and the Santubong River. This decision is based on the fact that, unlike the Sarawak River, which experiences frequent boat traffic between the Waterfront area and the Sarawak State Legislative Assembly, these rivers see little to no vessel movement, making them safer and more suitable for turbine installation. These rivers were selected because they rarely dry up, ensuring a consistent water flow throughout the year. Utilizing these rivers offers an effective opportunity to harness hydrokinetic energy while avoiding interference with busy river navigation.
A simple non-linear function of air temperature and rainfall was introduced to predict the flow rate of a river, which was established with reference to the monthly flow rate of the Great Morava River in Serbia [26]. The model has a quick and reliable estimation and prediction of monthly flow rates. As the Great Morava showed great similarity to the site selected for hydrokinetic power generation, thus the established prediction model is suitable for this study.
The monthly flow rates Q can be obtained with Eq. (10), where P is the precipitable water (mm) and T is the air temperature (°C). After obtaining the flow rate, the water speed can be easily obtained by dividing the value with cross-sectional area of the river water, which its width and height are assumed to be 10 and 1 m, respectively.
The first factor to be considered is the COE of the system, which is related to the capital recovery factor (CRF) and the NPC of the project. For project I, CRF is defined as:
where i is the real interest rate (%), and Y is the lifetime of the project (years). While the NPC of project I is defined as:
where
where
4.7 Levelized Cost of Hydrogen
Assuming that the PEM electrolyzer operates using 100% renewable energy inside the proposed system, the LCOH is calculated as [5]:
where
In the environmental impact analysis, a major factor to be considered is the total CO2 emissions from the grid [5], which can be determined by the Grid Emission Factor (GEF). GEF is the generation weighted-average greenhouse gas (GHG) per unit of electricity generation of all generating power plants, the calculation of the GEF includes all other renewable energy sources involved inside the system. Another important parameter to be considered is the Renewable Fraction (RF), RF represents the proportion of energy delivered to the load from RES over the total power generation that is delivered to the load, defined as:
where
This section presents the findings of power generation, hydrogen production and storage, economic analysis, and environmental analysis.
The hourly power generation of the solar PV system exhibits consistent patterns throughout the year, with peak output occurring between 10:00 and 15:00, during the peak sun hours. The relatively uniform distribution of high-output hours reflects the steady solar irradiation characteristics of the tropical climate of Sarawak. While the power generated by the hydrokinetic system is consistent at 400 kW per hour, with hydrokinetic turbines at each section of the canal generating 40 kW.
Fig. 3 illustrates the monthly electric production from four sources: solar PV system, hydro kinetic system, power grid, and hydrogen energy and storage system. The hydrokinetic turbines supply the majority of the energy, while the PV and FC provide steady renewable input. Grid contributes a smaller share, dedicated to EV infrastructure.
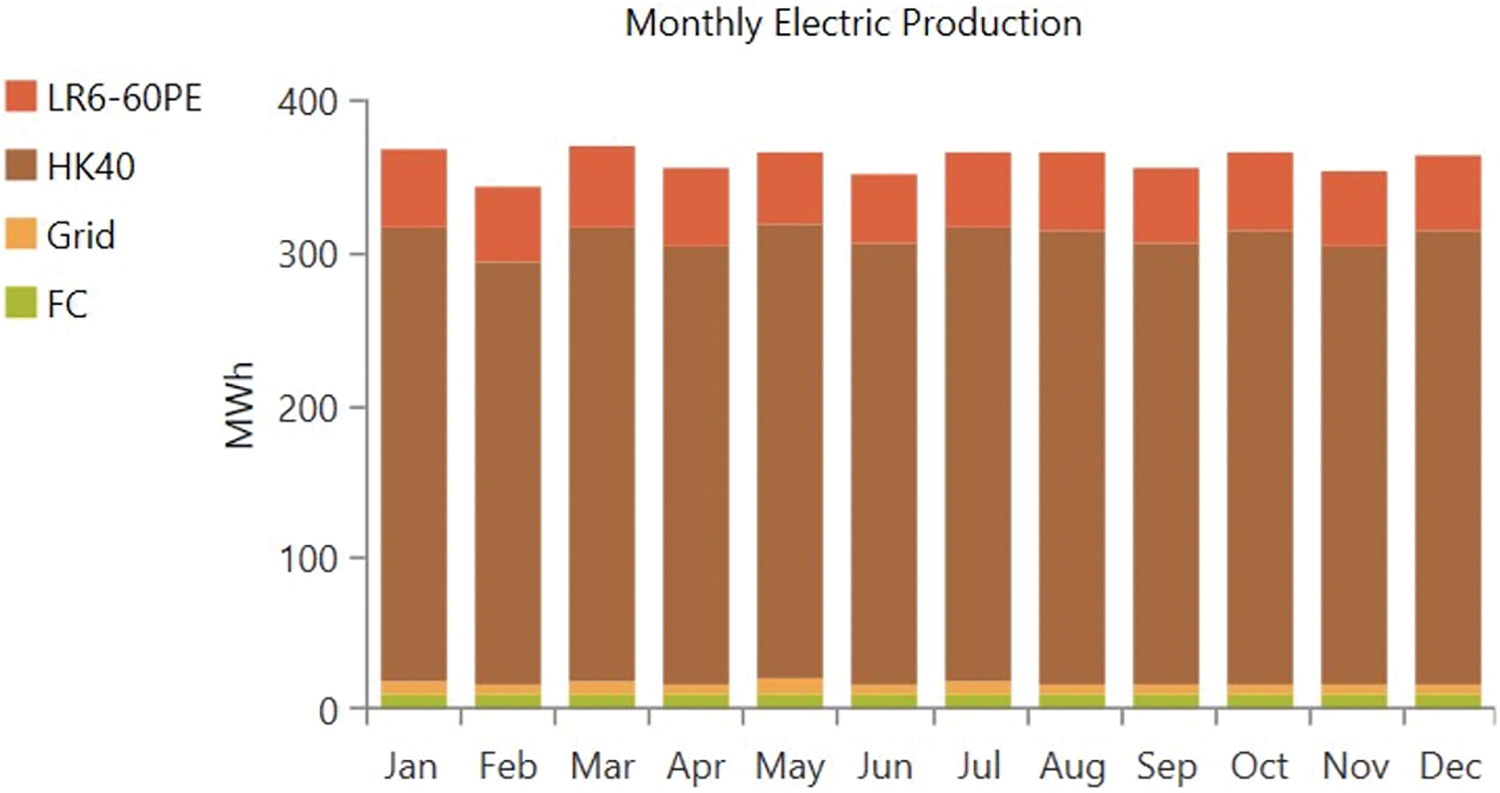
Figure 3: The monthly electric production of the proposed system
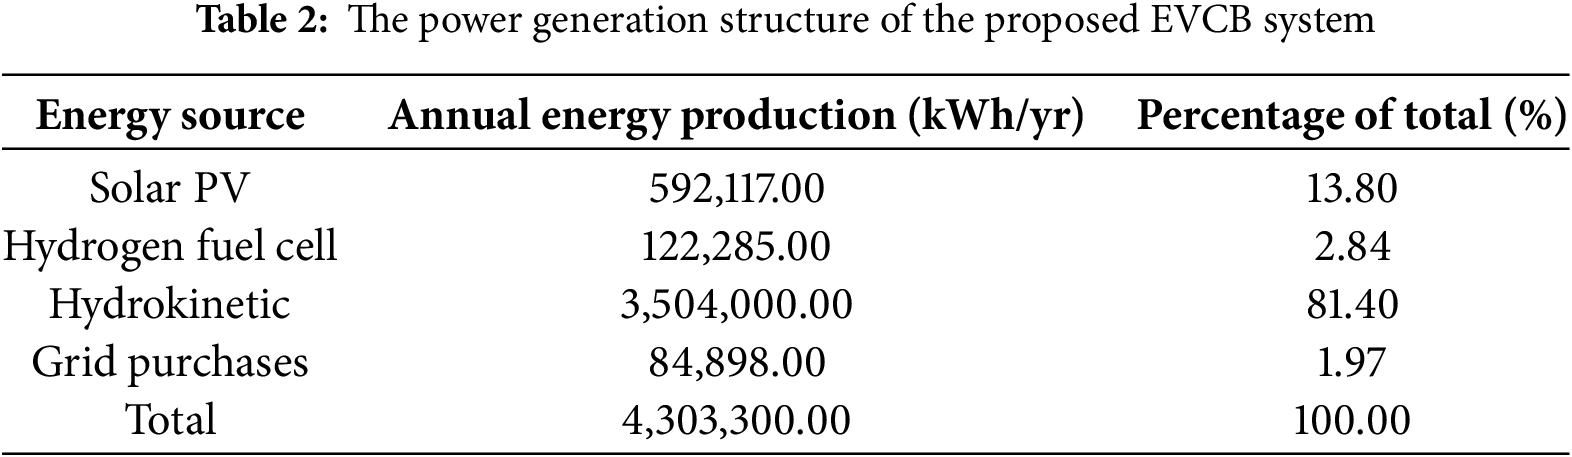
The proposed system produced a total of 4,303,300 kWh per year, as shown in Table 2. The hydrokinetic turbine accounted for the largest share of the annual energy generation, contributing 3,504,000 kWh per year, which represents 81.4% of the total output. The solar PV system contributed 592,117 kWh per year, corresponding to 13.8% of the total, while the FC supplied 122,285 kWh per year, or 2.84% of the system’s overall energy generation. The remaining 1.97% of the energy, equivalent to approximately 84,898 kWh per year, was purchased from the electrical grid to meet the total energy demand of the EVCB.
5.2 Hydrogen Production and Storage
Table 3 shows the operation aspects of the hydrogen production and storage system, including annual hydrogen production and mean production rate, FC capacity factor and mean output power. The total hydrogen production of the hydrogen system is recorded to be 25,634 kg/yr, with mean production rate of 2.93 k/yr and mean operating power of 136 kW, showing the system consistency in production hydrogen. The hydrogen tank achieved a maximum hydrogen storage level of 40% without excessive hydrogen generation. The FC only had a capacity factor of 5.58%, with 731 operation hours and mean power output of 167 kW throughout the entire year.
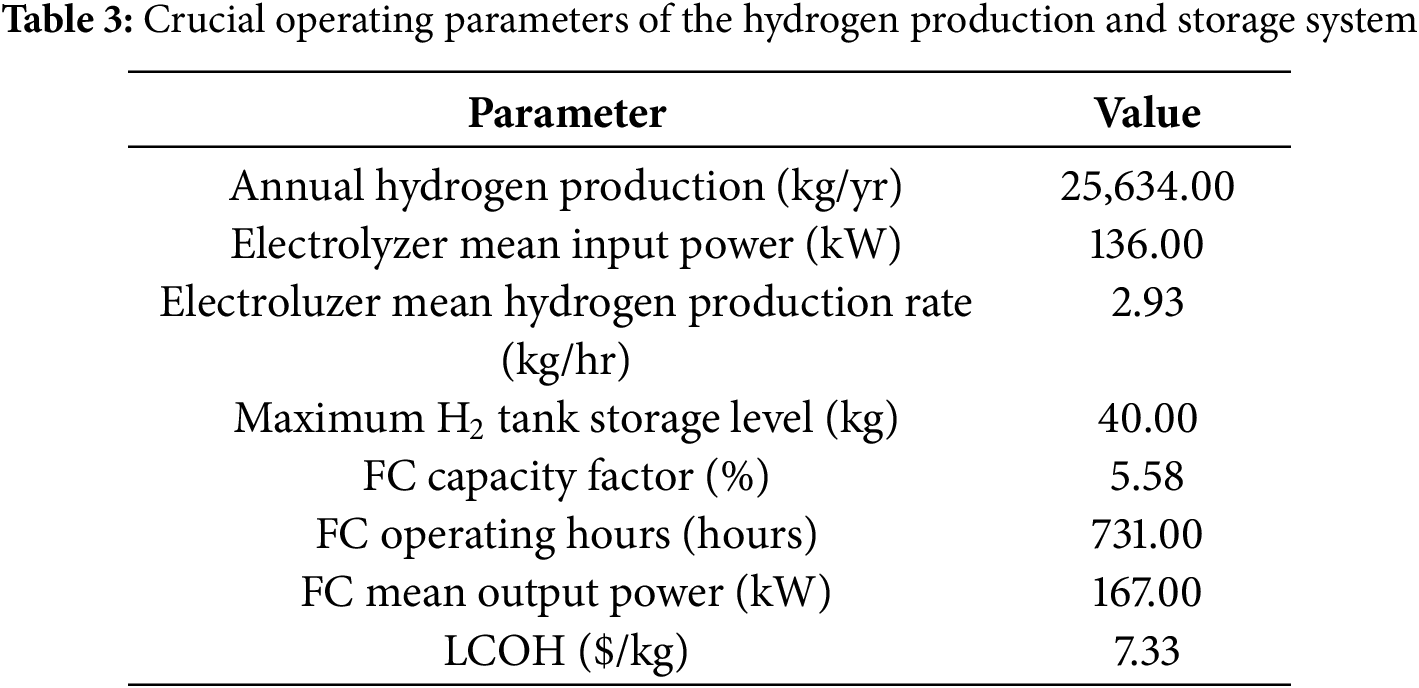
Fig. 4 shows the hydrogen storage level relative to the daily electric load and power consumption of the electrolyzer. The data shows the varying hydrogen storage level based on the power generation availability. Following the daily EV charging load demand profile, the electrolyzer receives the maximum input power of 200 kW from the generation surplus mainly contributed by the hydrokinectic system from 0:00 to 5:00 and 15:00 to 24:00, this was followed with the steady rise of hydrogen storage level during the same intervals. When the EV charging load demand began to rise at 5:00, a noticeable drop in the electrolyzer’s power consumption can be seen, followed with the sharp decrease in hydrogen storage level, showing that the hydrogen storage was being fully utilized to fulfil the power demand by the EVCBs and also verifying the connectivity between the electrolyzer and the hydrogen storage system.
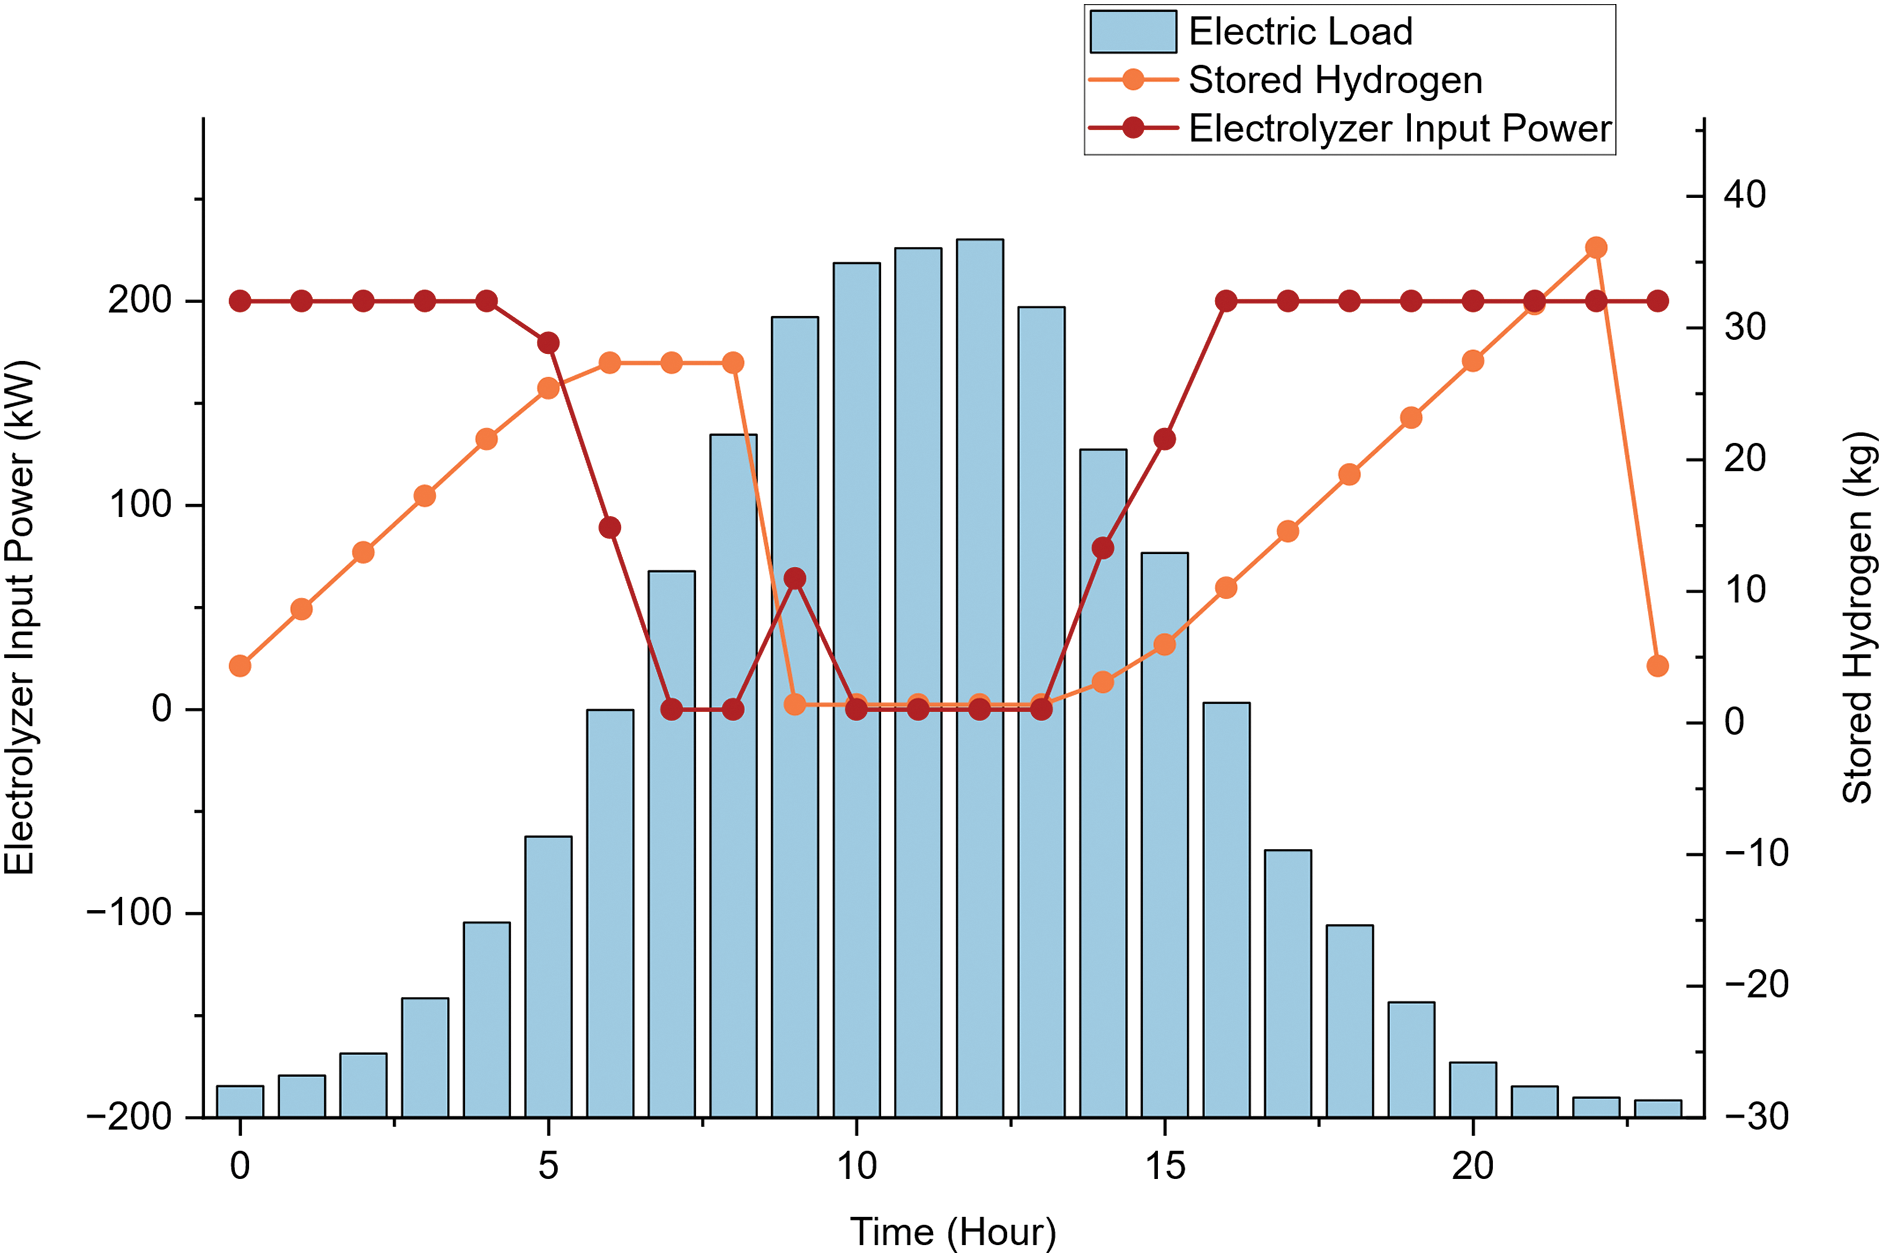
Figure 4: Daily stored H2 production for a year and the relation with electrical load serves and electrolyzer input power
The system’s LCOH was calculated to assess the system’s capability to harness the excess energy for hydrogen production with the system’s electrolyzer. In this simulation, the value of the system’s LCOH was calculated to be $7.33/kg. This indicates that the overall system’s capability to supply the EVCBs’ power demand with the main renewable energy sources with hydrogen storage system as a supplementary power supply and storage system.
The optimal configuration for the hybrid EVCB system relies by identifying the lowest COE and NPC values. Table 4 records the summary of the system’s economic analysis. From Table 4, the COE and NPC of the EVCB system were calculated to be $0.0617/kWh and around $2.43 M, respectively, over the 25-year project lifespan. The total cost of the project comprises the capital cost of $2,055,000, replacement of the equipment of $174,594.13, and operating and maintenance cost of $320,650.24.
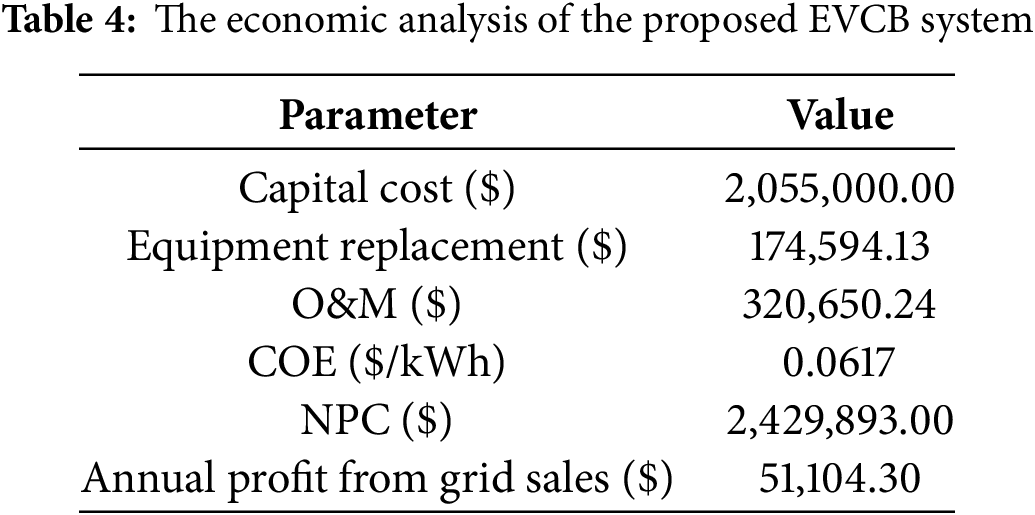
Fig. 5 shows the cost summary of the hybrid EVCB system. Among the power generation systems, the solar PV system has the highest cost, followed by the hydrogen FC, electrolyzer, hydrokinetic system, hydrogen tank and AC/DC converter. There is a profit gained from the proposed system over the 25-year project lifetime, which will be furthered discussed. The total cost of the hydrogen generation and storage system including electrolyzer, fuel cell and hydrogen tank is calculated to be $1,340,075.91, accounting for 55.2% of the entire system cost.
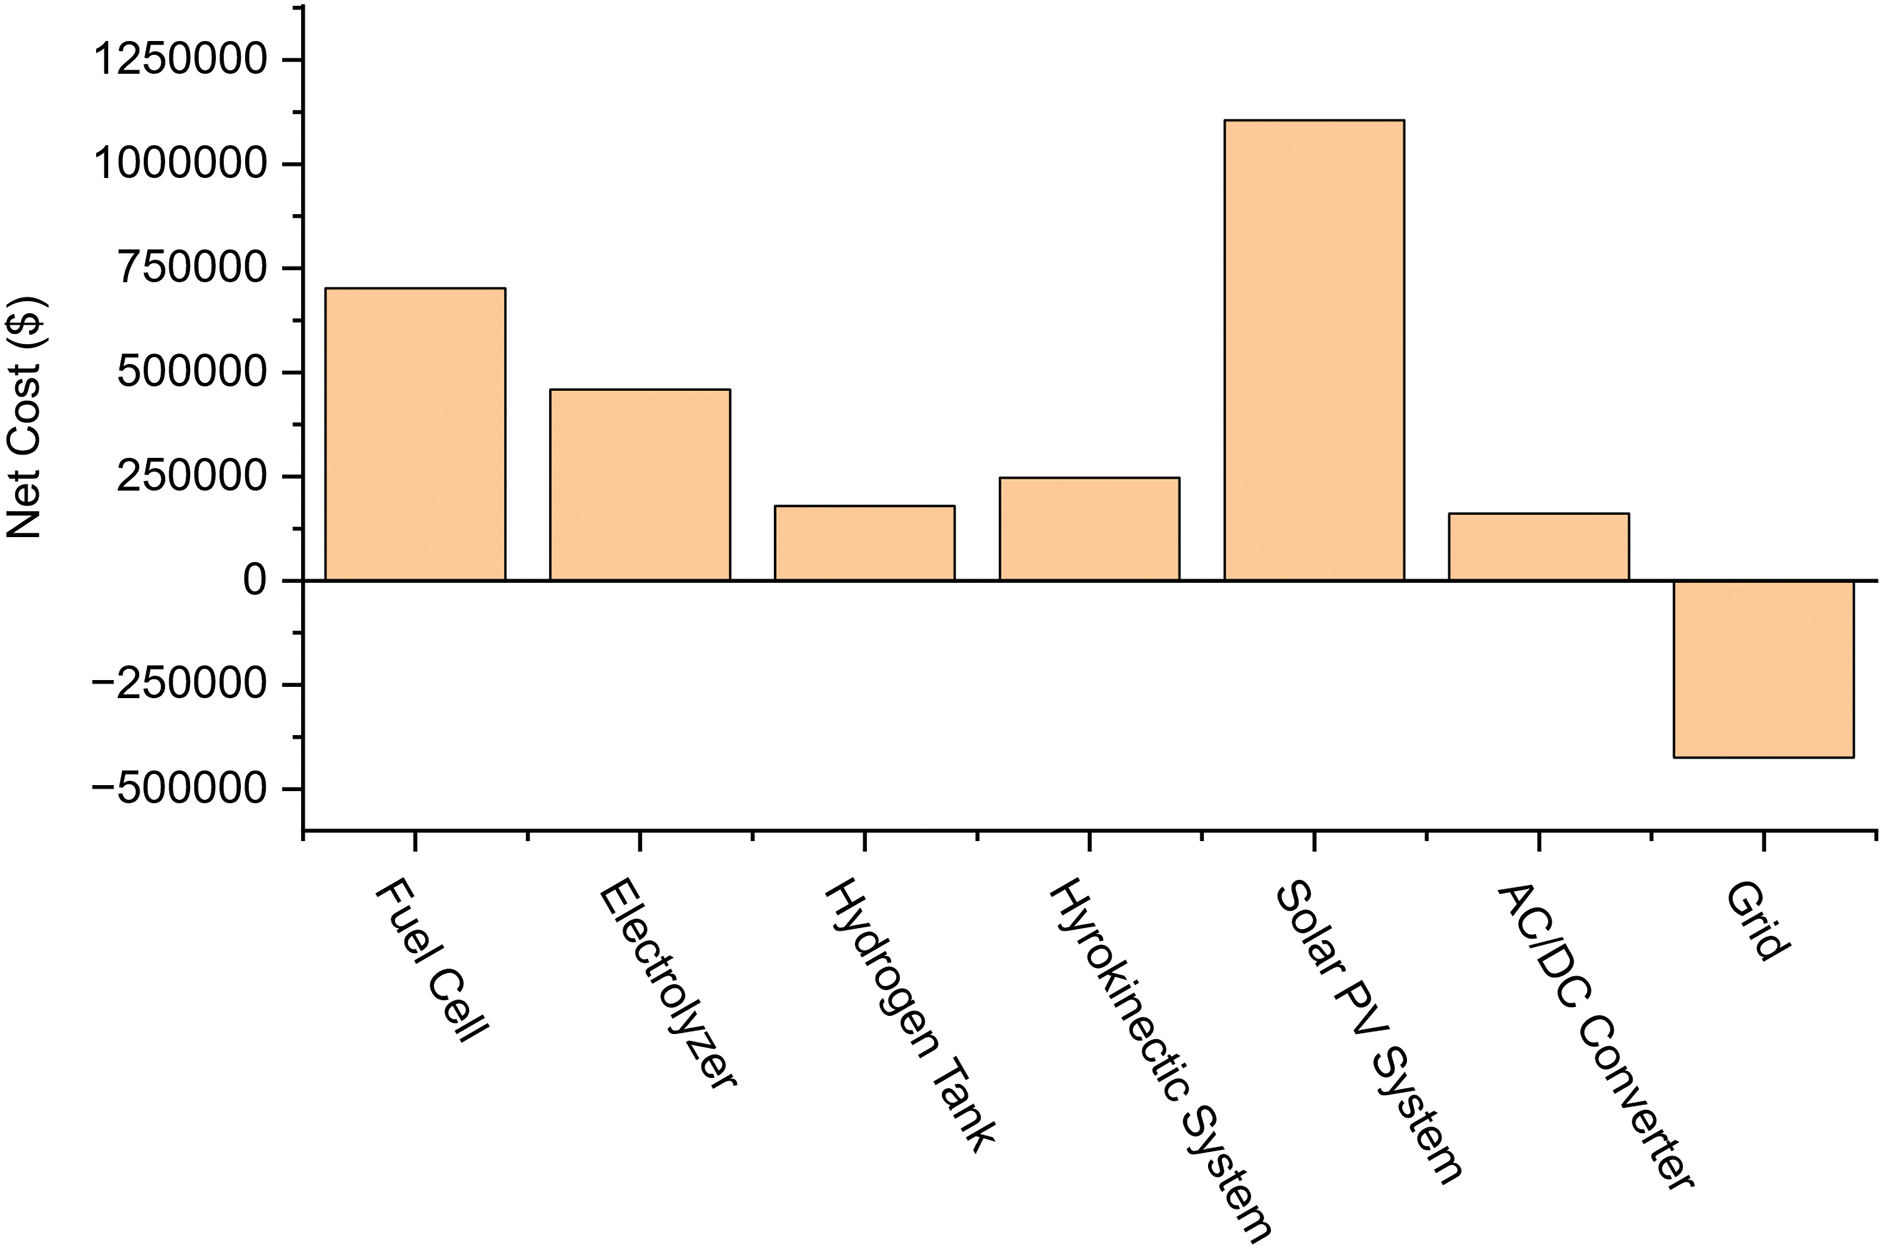
Figure 5: Cost summary of the hybrid EVCB system
Fig. 6 presents the daily grid purchases and sales by the system, from the figure the electricity purchases from the grid occur mainly during peak demand hours between 07:00 and 14:00, with a maximum draw of 100 kW. Outside these periods, the system operates independently with surplus energy generation, primarily from the hydrokinetic system, exported to the grid at a maximum rate of approximately 400 kW. Annually, the system purchases only 84,898 kWh from the grid while exporting 595,940 kWh. This results in a net grid sale revenue of $51,104.30, highlighting the system’s economic viability and potential profitability through grid interaction. The grid independence of the system during off-peak hours and its consistent energy export underscores both the resilience and financial benefits of the proposed hybrid renewable system.
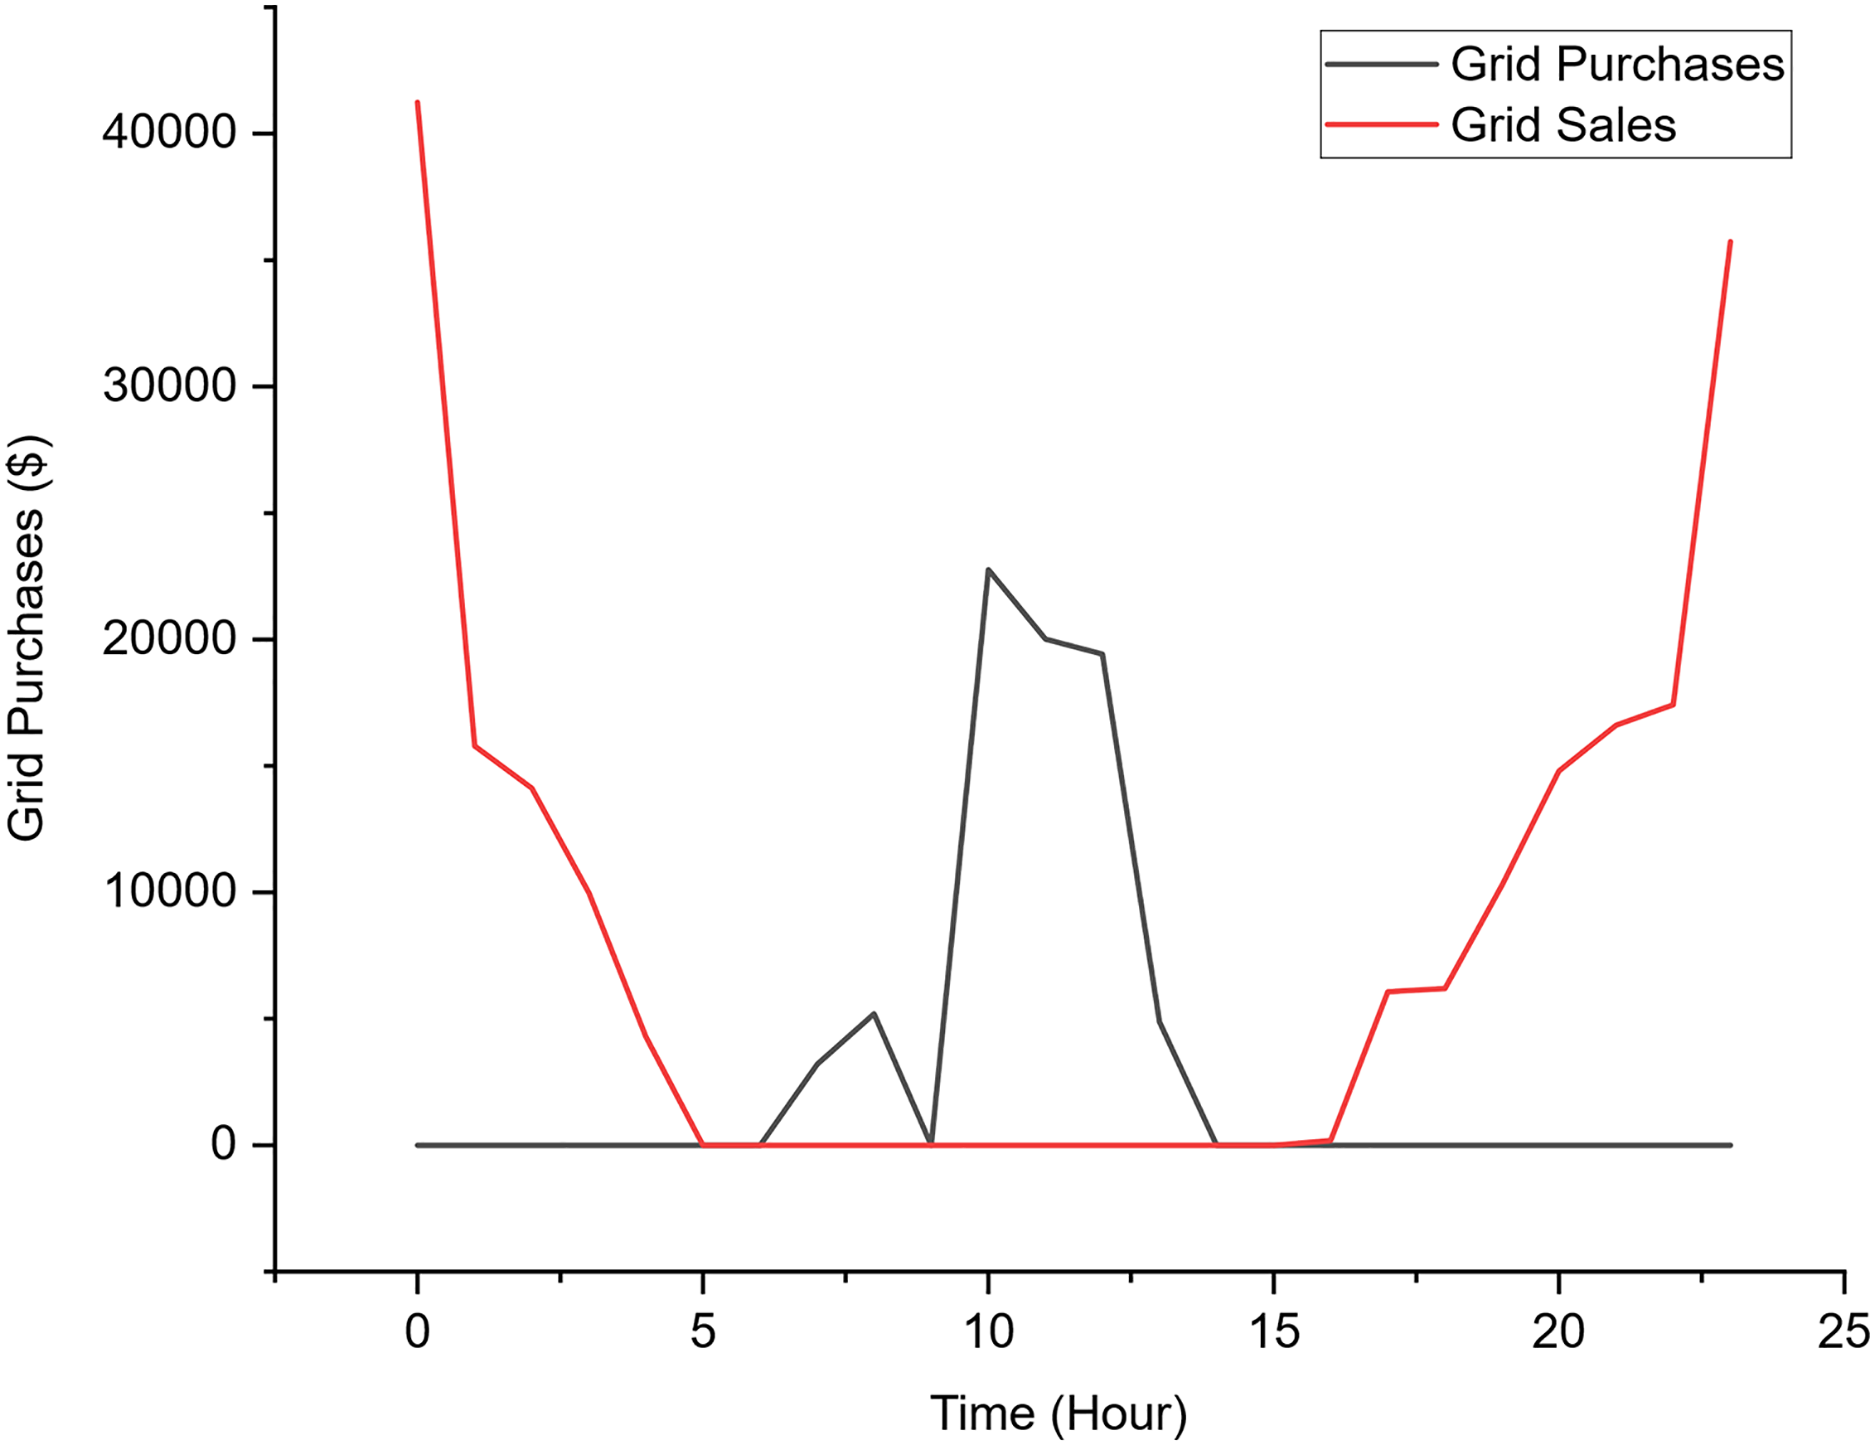
Figure 6: The daily power purchase from the grid and the power sale to the grid
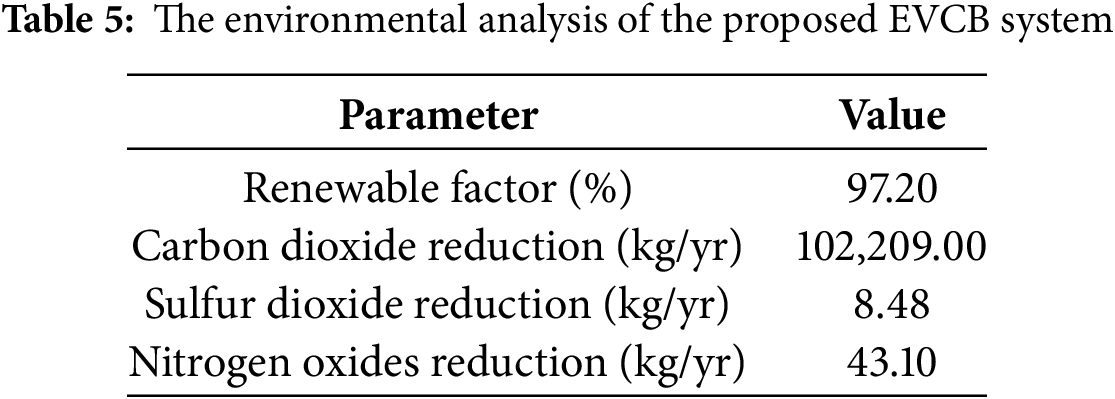
Table 5 presents the environmental analysis of the system. From the environmental analysis of the proposed system, the system’s renewable fraction was calculated to be 97.2%. The proposed system also significantly reduced harmful emissions. The system achieved a net CO2 reduction of 102,209 kg/yr by meeting local demand and exporting surplus power to the grid, which ultimately displaces fossil fuel-based generation. Emissions of SO2 and NO are also lowered by 8.48 and 43.1 kg/yr, respectively, both linked to coal and diesel use. These results highlight the system’s effectiveness in mitigating grid-related emissions and advancing cleaner energy integration in Sarawak.
Hybrid energy systems integrate multiple energy sources to deliver reliable and flexible power generation. The system comprises fully renewable components, utilizing solar PV, hydrokinetic, and hydrogen to generate power. However, a portion of the power supplied to the load may originate from non-renewable energy sources, primarily due to the hybrid system’s integration with the main grid. This connection makes it both possible and inevitable that electricity generated from diesel, gas, or coal-fired plants contributes to the overall energy mix. While SEB has made considerable progress in expanding hydropower, the presence of diesel, gas, and coal-fired power plants continues to contribute to non-renewable energy usage. This is more notable in areas served by the northern and stand-alone grids, which exhibit higher CO2 emission intensities. Therefore, these regional variations in grid composition are important for interpreting the environmental performance of the hybrid energy system. This study evaluates the environmental performance of the hybrid system under the influence of these grid dynamics, focusing on metrics such as the renewable fraction and associated emissions.
Fig. 7 represents the ratio of power generation by renewable energy sources to total power generation. The data reveals a distinct pattern in renewable energy contribution. For most months, the share of renewable generation rose sharply from 0% to 100% between 07:00 to 8:00, corresponding to the start of solar photovoltaic production. However, during January and February, this rise is delayed and attenuated, likely due to reduced solar irradiance caused by Malaysia’s monsoon season. Between 9:00 and 12:00, renewable sources contribute approximately 70% of total generation across all months. From 12:00 onwards, the system consistently achieves 100% renewable generation, highlighting the effective synergy between solar, hydro, and hydrogen resources during peak sunlight hours.
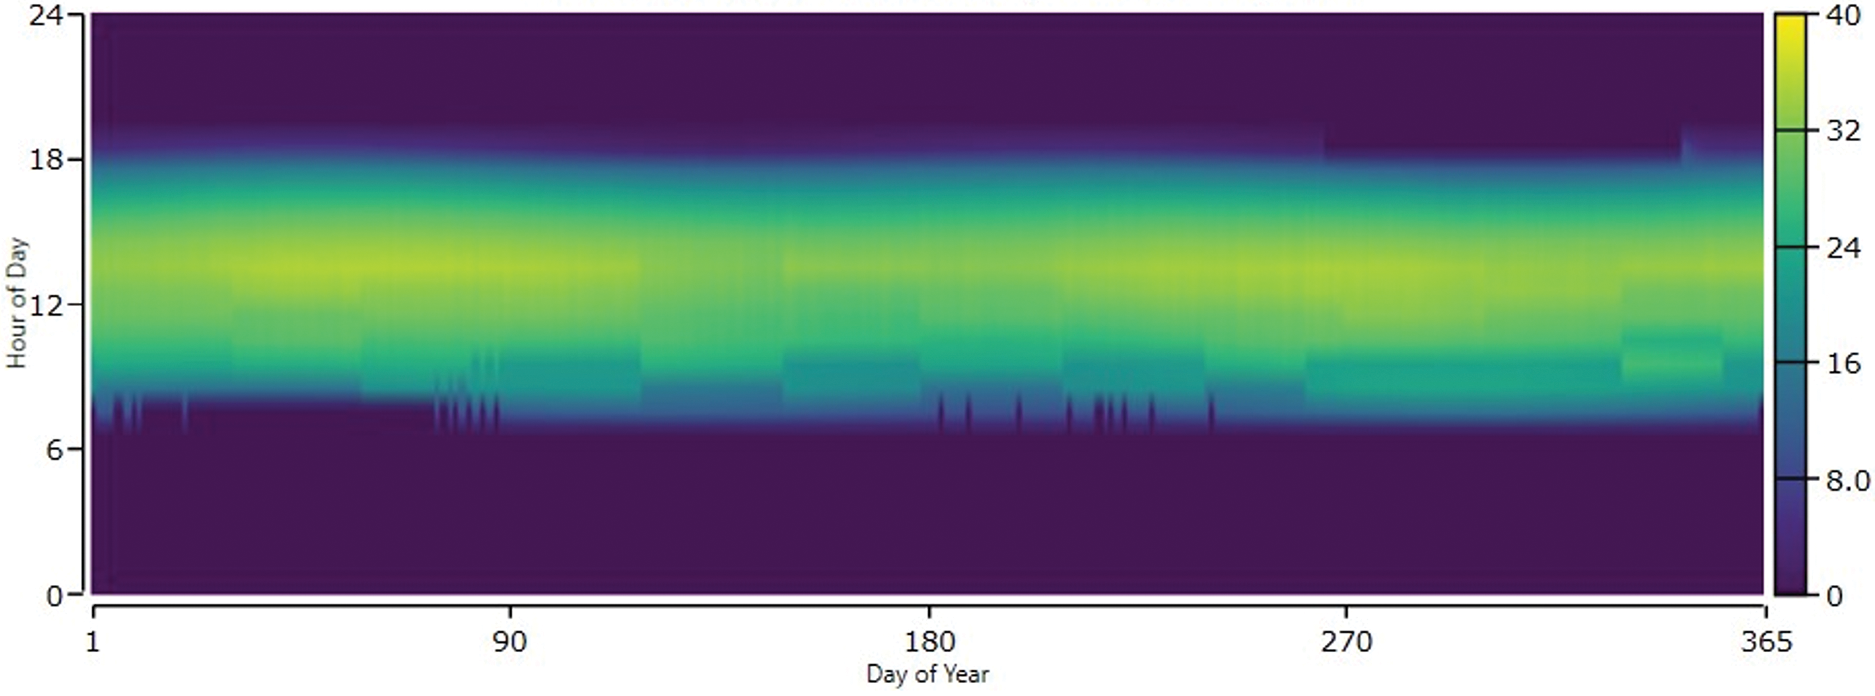
Figure 7: The daily instantaneous renewable output divided by generation
Fig. 8 aims to evaluate the proportion of renewable energy delivered to the load, as opposed to energy supplied from non-renewable sources via the main grid. This assessment is captured by the previously defined renewable fraction metric. Analysis of the simulation results reveals that from 0:00 to 8:00, the load is supplied entirely by renewable sources (100% RF) across all months, except for March. As demand increases later in the day, the renewable contribution to the load stabilizes at an average of approximately 80%. These findings indicate a consistently high renewable fraction, demonstrating that the hybrid system performs effectively in minimizing reliance on non-renewable energy sources. Such performance supports the sustainability and self-sufficiency goals of the system design, even under varying load and environmental conditions.
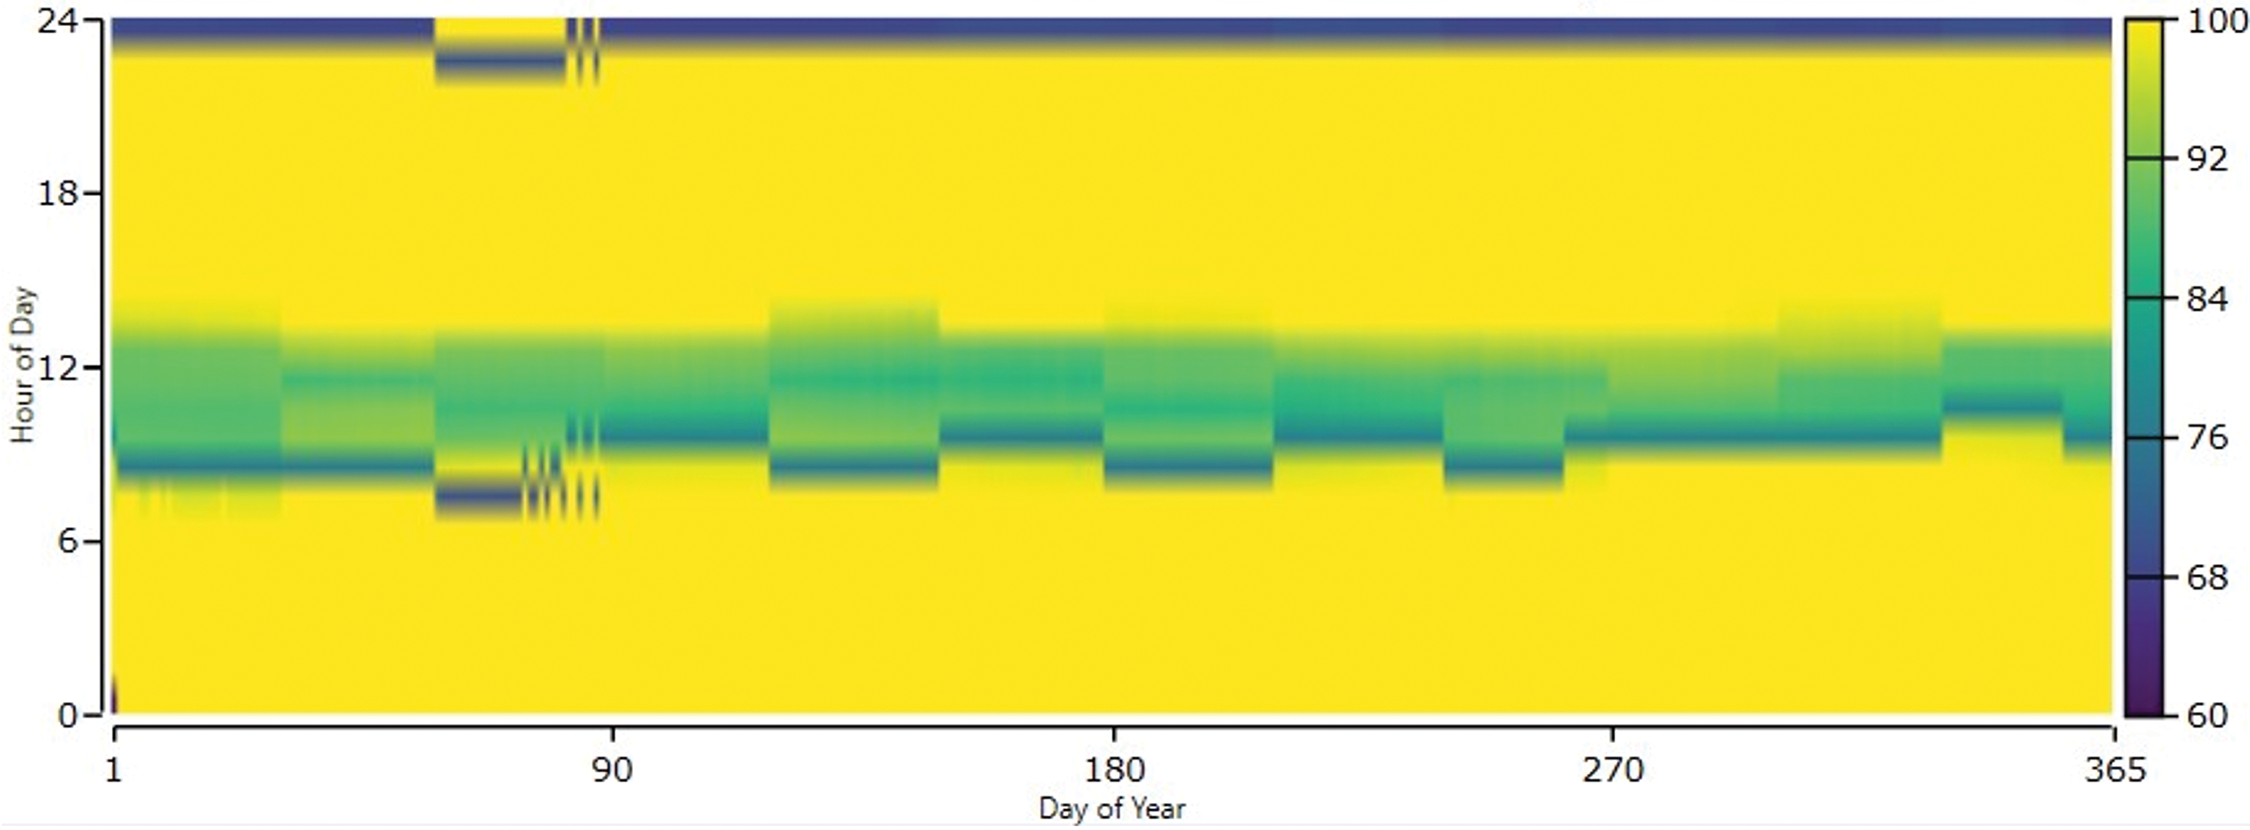
Figure 8: The daily one minus instantaneous renewable output divided by load
To evaluate the techno-economic viability of the proposed EVCB system, a comparison was made against similar hybrid renewable energy systems reported in the literature. Table 6 presents a comparative analysis in terms of COE, NPC, and LCOH. The proposed system, comprising a solar PV system, hydrokinetic resource, hydrogen tank, fuel cell, and electrolyzer components, achieved a COE of $0.0617/kWh, which is highly competitive and lower than most systems that integrate hydrogen production. For example, previous studies in Brazil [3] and Saudi Arabia [27] reported significantly higher COEs of $1.351 and $0.593/kWh, respectively. Even recent studies in India [28] and Malaysia [5] showed higher average COE values ranging from $0.410–0.480/kWh and up to $0.160/kWh, respectively. Notably, only the system in Turkey [29] recorded a comparable COE of $0.064/kWh, though it excluded hydrogen components.
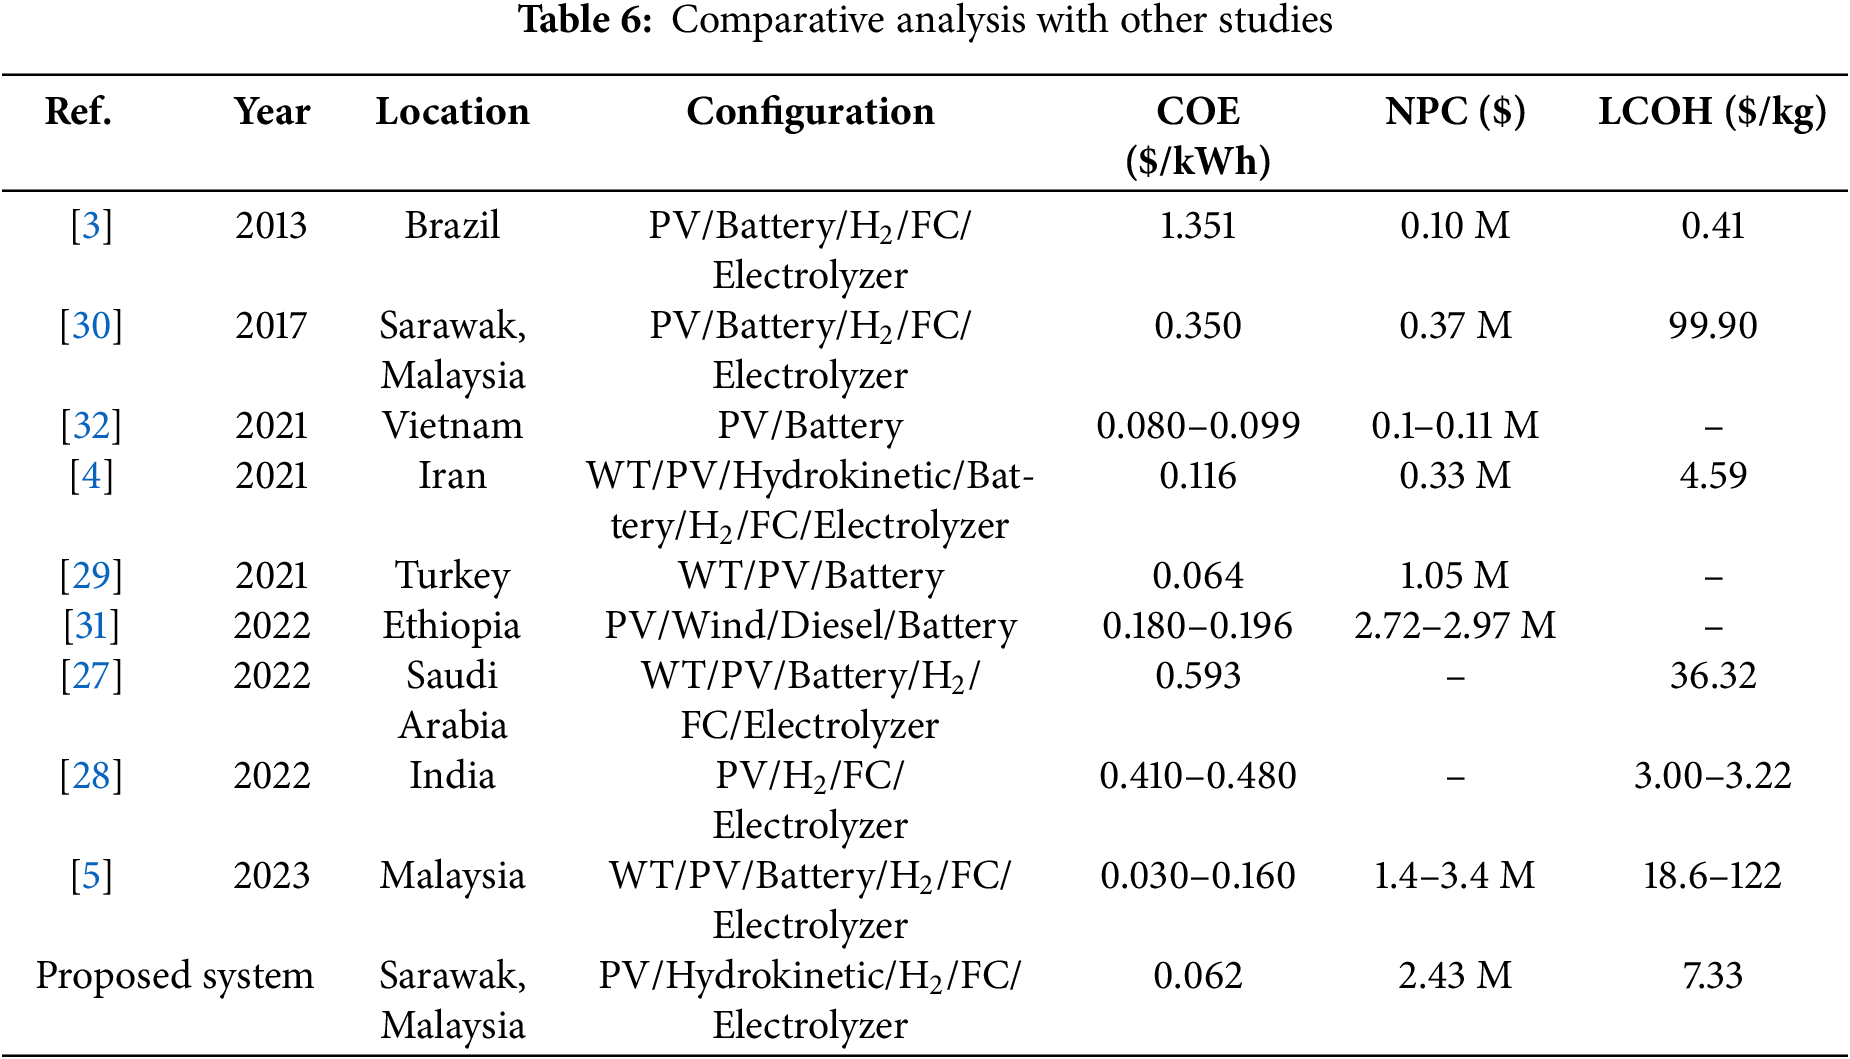
In terms of NPC, the proposed system reported a total of approximately $2.43 million over 25 years. This value is within the mid-range when compared to literature, with lower NPCs observed in earlier configurations such as Turkey at $0.33 M and Sarawak, Malaysia (2017) [30] at $0.37 M, although these configurations were simpler or smaller in scale. More complex and recent systems, like the one in Ethiopia [31], reported NPC values between $2.72 and $2.97 M, similar to the proposed system, suggesting a balanced trade-off between performance and long-term cost.
The LCOH for the proposed system is estimated at $7.33/kg, showing a substantial improvement over earlier Malaysian hydrogen systems, such as the Sarawak study in 2017 which reported an extremely high LCOH of $99.9/kg. While the proposed system’s LCOH is higher than that of advanced hydrogen systems in India ($3–3.22/kg) and Iran ($4.59/kg), it remains reasonable given the inclusion of hydrokinetic energy and its applicability in the local context.
When comparing hydrogen storage systems to battery configurations, the results further underscore the cost-effectiveness of the proposed system. Battery storage systems, such as those studied in Vietnam [32] and Turkey, achieved COEs in the range of $0.064–$0.099/kWh with very low NPC values, as seen in Vietnam at $0.1–$0.11 M. These results reflect the cost advantage of battery storage in smaller or grid-connected systems. However, such systems lack long-duration storage and dispatchability benefits offered by hydrogen-based systems, especially in standalone or off-grid scenarios. Moreover, battery systems do not produce hydrogen fuel and thus cannot support applications beyond short-term power balancing, such as FC vehicle charging or seasonal energy storage for its high energy density over the battery storage system [33,34].
Overall, the proposed EVCB system provides a compelling middle ground, outperforming many hydrogen storage systems in COE, offering moderate NPC, and delivering a significantly improved LCOH, making it a sustainable and context appropriate solution for renewable-powered EV charging infrastructure, particularly in regions with abundant hydrokinetic resources.
This article presents a comprehensive techno-economic evaluation of a hydrogen storage-integrated EVCB system in Kuching, Sarawak. The proposed system successfully meets the charging demand under current market conditions, while also generating an annual profit of approximately $51,104.30 through excess energy sold to the grid. Power generation is primarily dominated by the hydrokinetic component, contributing 81.4% of the total output, whereas the hydrogen fuel cell contributes a modest 2.84%. The system achieves COE at $0.0617/kWh and LCOH $7.33/kg, highlighting its economic feasibility. With a total system cost of around $2.43 million, the hydrogen storage subsystem accounts for the largest share at 55.2% ($1.34 million). Additionally, the system reaches a high renewable fraction of 97.2%, significantly enhancing its sustainability credentials. Notably, it contributes to environmental preservation by achieving annual emissions reductions of 102,209 kg CO2, 8.48 kg SO2, and 43.1 kg NOx. These findings underscore the environmental and economic viability of the proposed system, positioning it as a promising solution for sustainable electric vehicle infrastructure in the region.
Acknowledgement: The authors would like to express their heartfelt gratitude to Swinburne University of Technology Sarawak Campus and Birmingham City University for unwavering encouragement, and endless support throughout this research. The supervisory team expertise and dedication have been instrumental in the successful completion of this study.
Funding Statement: This work was supported by Swinburne University of Technology Sarawak Campus and Birmingham City University. The funders had no role in the study design, data collection, analysis, or decision to publish.
Author Contributions: Jack Kiing Teck Wei: Conceptualization, Methodology, Hydrogen Storage System, Original Draft, Data Curation, Formal Analysis, Visualization, Investigation, Writing, Editing, Review. Mohanad Taher Mohamed Sayed Roshdy: Conceptualization, Writing Solar, Original Draft, Data Curation, Formal Analysis, Investigation, Writing, Editing, Review. Bryan Ho Liang Hui: Conceptualization, Introduction, Hydrokinetic System, Original Draft, Data Curation, Formal Analysis, Investigation, Writing, Editing, Review. Jalal Tavalaei: Review, Supervision, Editing. Hadi Nabipour Afrouzi: Review, Supervision, Project Administration. All authors reviewed the results and approved the final version of the manuscript.
Availability of Data and Materials: The authors confirm that the data used in this study is available on request.
Ethics Approval: Not applicable.
Conflicts of Interest: The authors declare that they have no known competing financial interests or personal relationships that could have appeared to influence the work reported in this paper.
References
1. World Energy Transitions Outlook [Internet]. New York, NY, USA: International Renewable Energy Agency (IRENA). [cited 2025 Aug 1]. Available from: https://www.irena.org/publications/2021/Jun/World-Energy-Transitions-Outlook/DigitalReport. [Google Scholar]
2. Global EV Outlook 2023—Executive Summary. Paris, France: International Energy Agency. [cited 2025 Aug 1]. Available from: https://www.iea.org/reports/global-ev-outlook-2023/executive-summary. [Google Scholar]
3. Silva SB, Severino MM, de Oliveira MAG. A stand-alone hybrid photovoltaic, fuel cell and battery system: a case study of Tocantins. Brazil Renew Energy. 2013;57:384–9. doi:10.1016/j.renene.2013.02.004. [Google Scholar] [CrossRef]
4. Xia T, Rezaei M, Dampage U, Ali Alharbi S, Nasif O, Borowski PF, et al. Techno-economic assessment of a grid-independent hybrid power plant for co-supplying a remote micro-community with electricity and hydrogen. Processes. 2021;9(8):1375. doi:10.3390/pr9081375. [Google Scholar] [CrossRef]
5. Roslan MF, Ramachandaramurthy VK, Mansor M, Mokhzani AS, Jern KP, Begum RA, et al. Techno-economic impact analysis for renewable energy-based hydrogen storage integrated grid electric vehicle charging stations in different potential locations of Malaysia. Energy Strategy Rev. 2024;54:101478. doi:10.1016/j.esr.2024.101478. [Google Scholar] [CrossRef]
6. Afrouzi HN. Design and techno-economic analysis of a hydrogen-based micro hydro-solar hybrid energy system for sustainable energy access: a case study in Sri Aman, Sarawak. Int J Electr Electron Eng Telecommun. 2024;13(1):33–44. doi:10.18178/ijeetc.13.1.33-44. [Google Scholar] [CrossRef]
7. Haidar AMA, Han LW, Ahfock T. Feasibility analysis of implementing hybrid powered electric vehicle charging stations in Sarawak. In: 2022 IEEE Sustainable Power and Energy Conference (iSPEC); 2022 Dec 4–7; Perth, Australia: IEEE; 2022. p. 1–6. doi:10.1109/iSPEC54162.2022.10032990. [Google Scholar] [CrossRef]
8. SEB Annual and Sustainability Report 2020 [Internet]. [cited 2025 Aug 1]. Available from: https://www.sarawakenergy.com/assets/pdf/INTERACTIVE-Sarawak-Energy-ASR20.pdf. [Google Scholar]
9. Yuce MI, Muratoglu A. Hydrokinetic energy conversion systems: a technology status review. Renew Sustain Energy Rev. 2015;43(5):72–82. doi:10.1016/j.rser.2014.10.037. [Google Scholar] [CrossRef]
10. Cozzolino R, Bella G. A review of electrolyzer-based systems providing grid ancillary services: current status, market, challenges and future directions. Front Energy Res. 2024;12:1358333. doi:10.3389/fenrg.2024.1358333. [Google Scholar] [CrossRef]
11. Benghanem M, Mellit A, Almohamadi H, Haddad S, Chettibi N, Alanazi AM, et al. Hydrogen production methods based on solar and wind energy: a review. Energies. 2023;16(2):757. doi:10.3390/en16020757. [Google Scholar] [CrossRef]
12. Global Hydrogen Review 2024. Paris, France: IEA. [cited 2025 Aug 1]. Available from: https://www.iea.org/reports/global-hydrogen-review-2024. [Google Scholar]
13. Malaysia Power Market Size [Internet]. [cited 2025 Aug 1]. Available from: https://www.mordorintelligence.com/industry-reports/malaysia-power-market. [Google Scholar]
14. Mah AXY, Ho WS, Bong CPC, Hassim MH, Liew PY, Asli UA, et al. Review of hydrogen economy in Malaysia and its way forward. Int J Hydrogen Energy. 2019;44(12):5661–75. doi:10.1016/j.ijhydene.2019.01.077. [Google Scholar] [CrossRef]
15. Weber AZ, Balasubramanian S, Das PK. Proton exchange membrane fuel cells. In: Fuel cell engineering. Amsterdam, The Netherlands: Elsevier; 2012. p. 65–144. doi:10.1016/b978-0-12-386874-9.00003-8. [Google Scholar] [CrossRef]
16. Tellez-Cruz MM, Escorihuela J, Solorza-Feria O, Compañ V. Proton exchange membrane fuel cells (PEMFCsadvances and challenges. Polymers. 2021;13(18):3064. doi:10.3390/polym13183064. [Google Scholar] [PubMed] [CrossRef]
17. Overview of The Malaysian Oil Palm Industry 2017 [Internet]. [cited 2025 Aug 1]. Available from: https://bepi.mpob.gov.my/images/overview/Overview_of_Industry_2017.pdf. [Google Scholar]
18. Liu H, Almansoori A, Fowler M, Elkamel A. Analysis of Ontario’s hydrogen economy demands from hydrogen fuel cell vehicles. Int J Hydrog Energy. 2012;37(11):8905–16. doi:10.1016/j.ijhydene.2012.03.029. [Google Scholar] [CrossRef]
19. Sarawak Energy. Sarawak launches south east asia’s first integrated hydrogen production plant and refueling station, unveils hydrogen buses. Sarawak, Malaysia: Sarawak Energy; 2019. [Google Scholar]
20. Sarawak Energy. Greening the grid: accelerating renewable energy development in Sarawak. Sarawak, Malaysia: Sarawak Energy; 2019. [Google Scholar]
21. Stokes F. Sarawak nears completion of $4.2 billion green hydrogen venture. Noida, India: ChemAnalyst; 2024. [Google Scholar]
22. Aubrey S. Progress of ART depot in Rembus progressing steadily, says S’wak Metro [Internet]. [cited 2025 Aug 1]. Available from: https://www.theborneopost.com/2024/05/11/progress-of-art-depot-in-rembus-progressing-steadily-says-swak-metro. [Google Scholar]
23. Malaysia Electric Vehicle Charging Network [Internet]. [cited 2025 Aug 1]. Available from: https://www.planmalaysia.gov.my/mevnet. [Google Scholar]
24. Abdul Karim AH, Abidin Ab Kadir MZ, Azis N, Haziq Norsahperi NM, Khurshid Abda ZM. Impact of electric vehicle charging on distribution networks: a review in Malaysia. In: 2024 IEEE Sustainable Power and Energy Conference (iSPEC); 2024 Nov 24–27; Kuching, Sarawak, Malaysia: IEEE; 2024. p. 676–80. doi:10.1109/iSPEC59716.2024.10892452. [Google Scholar] [CrossRef]
25. Nandi S, Ghatak SR, Sannigrahi S, Acharjee P. Coordinated planning and operation of PV-hydrogen integrated distribution network incorporating daily-seasonal green hydrogen storage and EV charging station. Int J Hydrogen Energy. 2024;90:134–58. doi:10.1016/j.ijhydene.2024.09.402. [Google Scholar] [CrossRef]
26. Kostić S, Stojković M, Prohaska S, Vasović N. Modeling of river flow rate as a function of rainfall and temperature using response surface methodology based on historical time series. J Hydroinf. 2016;18(4):651–65. doi:10.2166/hydro.2016.153. [Google Scholar] [CrossRef]
27. Al-Buraiki AS, Al-Sharafi A. Hydrogen production via using excess electric energy of an off-grid hybrid solar/wind system based on a novel performance indicator. Energy Convers Manag. 2022;254(1):115270. doi:10.1016/j.enconman.2022.115270. [Google Scholar] [CrossRef]
28. Praveenkumar S, Agyekum EB, Ampah JD, Afrane S, Velkin VI, Mehmood U, et al. Techno-economic optimization of PV system for hydrogen production and electric vehicle charging stations under five different climatic conditions in India. Int J Hydrogen Energy. 2022;47(90):38087–105. doi:10.1016/j.ijhydene.2022.09.015. [Google Scholar] [CrossRef]
29. Ekren O, Hakan Canbaz C, Güvel ÇB. Sizing of a solar-wind hybrid electric vehicle charging station by using HOMER software. J Clean Prod. 2021;279(1):123615. doi:10.1016/j.jclepro.2020.123615. [Google Scholar] [CrossRef]
30. Das HS, Tan CW, Yatim AHM, Lau KY. Feasibility analysis of hybrid photovoltaic/battery/fuel cell energy system for an indigenous residence in East Malaysia. Renew Sustain Energy Rev. 2017;76:1332–47. doi:10.1016/j.rser.2017.01.174. [Google Scholar] [CrossRef]
31. Muna YB, Kuo CC. Feasibility and techno-economic analysis of electric vehicle charging of PV/wind/diesel/battery hybrid energy system with different battery technology. Energies. 2022;15(12):4364. doi:10.3390/en15124364. [Google Scholar] [CrossRef]
32. Minh PV, Le Quang S, Pham MH. Technical economic analysis of photovoltaic-powered electric vehicle charging stations under different solar irradiation conditions in Vietnam. Sustainability. 2021;13(6):3528. doi:10.3390/su13063528. [Google Scholar] [CrossRef]
33. Zhou L, Song A, Zhou Y. Electrification and hydrogenation on a PV-battery-hydrogen energy flexible community for carbon-neutral transformation with transient aging and collaboration operation. Energy Convers Manag. 2024;300(24):117984. doi:10.1016/j.enconman.2023.117984. [Google Scholar] [CrossRef]
34. Zhou L, Zhou Y. Study on thermo-electric-hydrogen conversion mechanisms and synergistic operation on hydrogen fuel cell and electrochemical battery in energy flexible buildings. Energy Convers Manag. 2023;277:116610. doi:10.1016/j.enconman.2022.116610. [Google Scholar] [CrossRef]
Cite This Article
 Copyright © 2025 The Author(s). Published by Tech Science Press.
This work is licensed under a Creative Commons Attribution 4.0 International License , which permits unrestricted use, distribution, and reproduction in any medium, provided the original work is properly cited.
 Downloads
 Citation Tools