
 Submit a Paper
 Propose a Special lssue
 Open Access
ARTICLE
Enhanced Efficiency of Solar-Assist Heat Pump Using Tracking PV/T Panel: A TRNSYS Simulation Study
Department of Mechanical and Energy Engineering, Erbil Technical Engineering College, Erbil Polytechnic University, Erbil, 44001, Iraq
* Corresponding Authors: Ashna Abduljabbar Haji. Email: ; Ranj S. Abdullah. Email:
(This article belongs to the Special Issue: Advancements in Energy Resources and Their Processes, Systems, Materials and Policies for Affordable Energy Sustainability)
Energy Engineering 2025, 122(12), 5111-5127. https://doi.org/10.32604/ee.2025.073367
Received 16 September 2025; Accepted 24 October 2025; Issue published 27 November 2025
 View Full Text
 Download PDF
Abstract
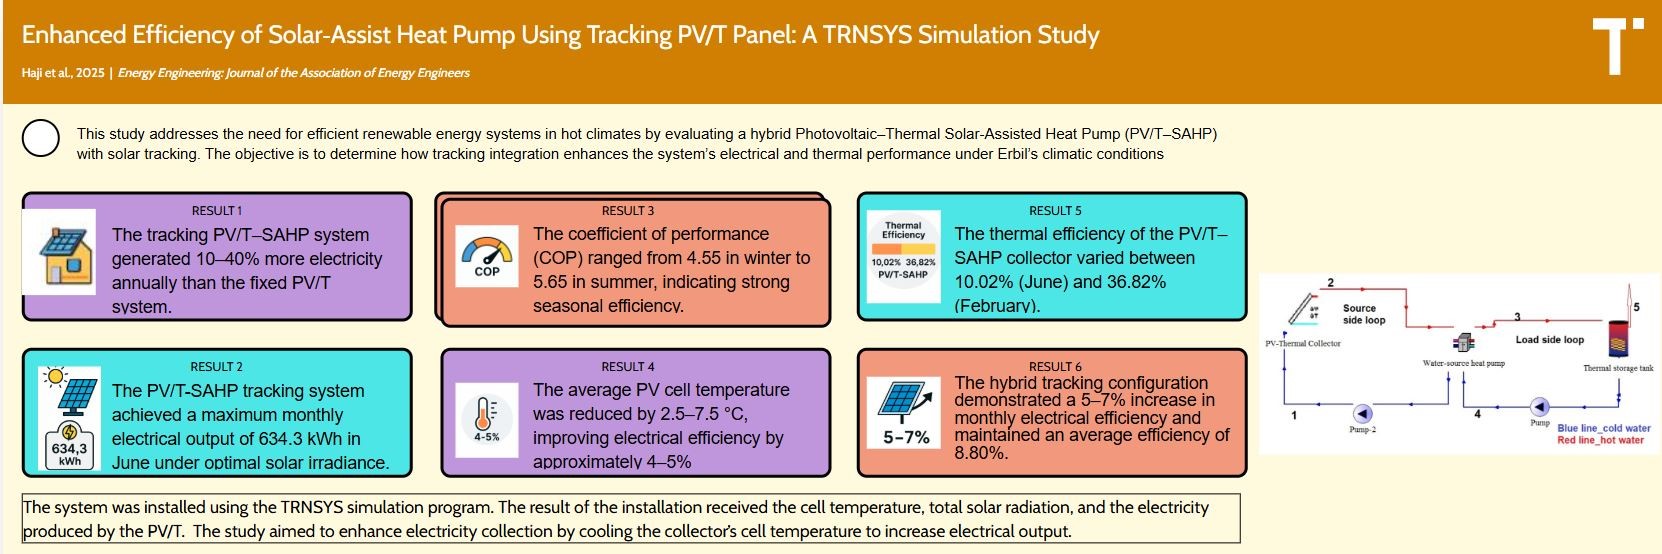
The hybrid photovoltaic solar-assisted heat pump are primarily used to generate electricity and provide thermal energy for heating applications. This study investigates the performance enhancement of a hybrid Photovoltaic Thermal Solar-Assisted Heat Pump (PV/T-SAHP) system integrated with a solar tracking mechanism. The system was simulated using TRNSYS to evaluate its monthly electrical output and coefficient of performance (COP) of the heat pump system over a year. The results showed a significant improvement in energy generation and efficiency compared to a conventional PV/T system without SAHP system. Overall, the solar tracking configuration of the PV/T-SAHP generated 10%–40% more electricity than the fixed system. The system for the tracking mode achieved a maximum monthly average electrical energy output of 634.349 kWh in June. Throughout the year, the tracking mode consistently outperformed the fixed mode. During the winter months of January and December, the tracking system produced 328.7 and 323.6 kWh, respectively, compared to 297.8 and 299.7 kWh for the fixed mode. The highest COP of 5.65 occurred in July, indicating a strong seasonal correlation with solar irradiance. In contrast, the minimum COP of 4.55 was observed in the months, February and March, reflecting reduced solar availability. The solar tracking feature consistently maintained an optimal panel angle, increasing energy gains and improving system efficiency. Overall, the integration of a heat pump and tracking control significantly improved system performance, making the hybrid PV/T-SAHP configuration a promising solution for year-round renewable energy generation.Graphic Abstract
Keywords
Climate change is one of the most pressing challenges facing our planet today. Fueled by human activities, particularly the combustion of fossil fuels that release carbon dioxide and harm the environment, temperatures are rising, resulting in severe environmental, economic, and social repercussions. Renewable energy presents a viable approach to addressing the challenges of climate change, fostering a cleaner and healthier environment. Climate change encompasses profound and enduring changes in the Earth’s temperature and environmental factors. These changes may be caused by natural factors, such as the substantial occurrence of volcanic eruptions or human activities (Sesana et al., 2021 [1], Kabir et al., 2023 [2]). There is an increasing global demand for energy, particularly electricity, which is also prevalent in Iraq. The oil industry is the primary driver of Iraq’s economy, representing over 60% of its GDP and more than 95% of its export revenue. Due to the country’s rich fossil fuel resources, there has been little emphasis on exploring renewable energy sources and alternative power generation methods. Data indicates that fossil fuels, which account for approximately 86.3 percent of the primary electricity grid source, are predominantly used in Iraq for electricity generation. Hydropower accounts for 13.7% of the renewable energy supply (Al-Hamadani, 2020 [3]).
The Kurdistan Region of Iraq faces significant challenges with power outages that can last more than half the day during specific seasons, stemming from inadequate electricity production. While the demand for power in the Kurdistan region has significantly increased over the past decade. According to official data, the overall electricity demand in the Region was 829 mw (Megawatts) in 2004, rising to 3279 mw in 2012 (Al-Din et al., 2017 [4]). Conversely, the Kurdistan region is geographically rich in forests, mountains, rivers, streams, and lakes, offering great potential for renewable energy development. Its two primary water sources are rainfall and snow, with an average annual precipitation range of 325 to 800 mm (Aziz et al., 2023 [5]).
PV cells and modules are well-known components for generating electricity from solar energy. Solar efficiency is a parameter linked to the materials used in the cells and their operating temperature. Generally, the electrical efficiency of photovoltaic (PV) systems ranges from 6% to 18%. The solar electrical efficiency of photovoltaic cells is recognized to decrease with an increase in their operating temperature. (Zhang et al., 2012 [6], Fatima et al., 2024 [7], Dwivedi et al., 2020 [8], Rasool and Abdullah, 2023 [9], Polus and Abdullah, 2025 [10]). The Photovoltaic/Thermal (PV/T) system is a technology that integrates photovoltaic (PV) cells or modules with heat extraction components into a single unit. This configuration facilitates the cooling of the PV cells, enhancing electrical efficiency. The concept of PV/T was documented in the mid-1970s. Wolf, 1976 [11]. Initially, water and air were extensively used to extract heat from the PV modules. Air and water have been used as heat transfer fluids in practical photovoltaic-thermal (PV/T) solar collectors. Due to water’s superior thermophysical characteristics, PV/T/water systems exhibit greater efficiency than PV/T/air systems (Kumar et al., 2015 [12], Dupeyrat et al., 2014 [13], Mostakim and Hasanuzzaman, 2022 [14]).
To enhance the power output of photovoltaic models and maximize the irradiation received by the PV array, many researchers have used tracking systems. A solar tracking system is a device that maximizes energy efficiency by optimally directing the photovoltaic module towards the sun. This can be accomplished through the use of systems with one-axis or two-axis tracking (Elbreki et al., 2016 [15], Kazem et al., 2024 [16], Kumba et al., 2024 [17]). In Iraq, a single-axis east–west solar tracking system and a front-surface water-spray cooling mechanism were evaluated on a monocrystalline photovoltaic (PV) panel. The solar tracking system alone increased power output by 4.19%, while the combination of tracking and cooling systems raised PV efficiency by 25.11% (Polus and Abdullah, 2023 [18]). Based on previous studies, assisting a heat pump with a PV/T (Photovoltaic Thermal) system or other renewable sources is often more efficient than using a conventional cooler. When paired with a PV/T system, it utilizes the waste heat from the PV panel, thereby increasing the overall system efficiency. Heat pumps typically operate with a higher Coefficient of Performance (COP) than standard electric or evaporative cooling systems, indicating they provide more cooling or heating per unit of energy consumed. Heat pumps are considered more eco-friendly than other systems, such as boilers. They emit significantly fewer greenhouse gases.
Leonforte et al., 2022 [19], Hawlader et al., 2001 [20] evaluated the thermal performance of a solar-assisted heat pump water heating system, validated using experimental data from Singapore’s climate. The results showed that the coefficient of performance (COP) varied from 4 to 9, while the collector efficiency fluctuated between 40% and 75%.
Nonetheless, the ideal design and operation of these systems remain intricate, especially in managing fluid temperatures, enhancing heat exchanger efficiency, and maintaining performance under diverse seasonal conditions. These issues require sophisticated modeling and simulation, such as TRNSYS, to assess and improve system performance in real-world situations (Pater, 2021 [21], Abdullah and Polus, 2022 [22]). The study by Abdel-Aziz et al., 2025 [23] employed CFD analysis to evaluate a full-sized hybrid PV/T system integrating a water-based solar collector beneath a conventional PV panel. The configuration achieved a 56.48% thermal efficiency improvement and a 2.13% rise in electrical output, confirming the cooling and heat recovery benefits of integrated PV/T designs.
Dupeyrat et al., 2014 [13] investigated a prototype of flat plate PV/T collector with domestic hot water systems in France, coupled with the TRNSYS simulator to provide the performance of hybrid PV/T, and compared to that of systems operating with standard solar devices. The author found that the use of efficient PV/T collectors in the building envelope can be more advantageous than standard PV and solar thermal components. Reducing our dependence on nonrenewable resources, especially fossil fuels, depends on conserving energy. Utilizing environmentally friendly natural resources, such as solar and wind power, while preserving coal, gas, and oil, is a significant approach to saving energy. Erbil, situated at a latitude of 36.1828 and a longitude of 44.0105, is a city in Iraq that offers a promising location for solar power generation due to its favorable geographical position and climatic conditions. The average energy production from solar installations varies by season, with the highest yield observed in summer at an average of 8.61 kWh per day for each kW of installed solar capacity Robinson, 2023 [24].
Although several studies have examined PV/T systems and SAHP configurations, these works have mainly focused on fixed-tilt collectors or different climatic conditions. To the best of our knowledge, no research has investigated the integration of a tracking PV/T collector with a solar-assisted heat pump under the climate of Erbil. This study addresses this gap by presenting a hybrid PV/T–SAHP tracking system, using TRNSYS simulation software. The objective is to optimize energy efficiency by enhancing PV cooling, producing domestic hot water, and maximizing solar energy utilization for both thermal and electrical applications in the regional context of Erbil. Overall, the PV/T/T-SAHP system not only enhances thermal energy recovery but also achieves notable gains in electrical output, making it a more efficient solution year-round, particularly in regions with high solar irradiance intensity, such as Erbil.
The performance assessment of a Photovoltaic-Thermal Solar-Assisted Heat Pump (PV/T-SAHP) necessitates a comprehensive theoretical analysis to comprehend the system’s energy dynamics under various operational conditions. This section outlines the models that characterize the thermal and electrical efficiency of the PV/T collector, heat pump, and storage system. A computer simulation program attracted researchers because it provided an efficient, cost-effective, and precise method for modeling, analyzing, and optimizing complex systems. Nowadays, a TRNSYS simulation program is the best choice for them because it is a flexible, modular, and accurate simulation software for modelling dynamic energy systems. It enables researchers to evaluate the real-time performance of renewable energy systems under varying weather conditions (Kalogirou, 2001 [25], Arnesson et al., 2025 [26]). The TRNSYS 18 software simulates the hybrid photovoltaic system and its components. According to previous studies, it became clear that the best choice for PV/T-SAHP was a tracking system to enhance its performance (Sumathi et al., 2017 [27], Saeidavi et al., 2025 [28], Salehi Dezfouli et al., 2024 [29]).
The diagram in Fig. 1 shows the schematic of the developed PV/T–SAHP system in TRNSYS 18. The system combines a tracking PV/T collector model with a heat pump cycle and a storage tank. The simulation utilizes a TRNSYS component (Type 50d) flat plate collector. The heat pump type is (Type 927) with a rated heating capacity of 600 W and a power input of 130 W (Pater, 2021 [21]), a storage tank of (Type 156) with 150 L while the weather data processor is (Type 15-6). In addition, other types were added to the system to operate and control the simulation to demonstrate energy balances and control strategies, which allowed for a thorough analysis of thermal and electrical performance. And (Type 14h) used to control the heat pump’s on and off operation, which is on between 6:00 and 19:00.

Figure 1: Schematic diagram of the developed PV/T-SAHP system which is modeled in TRNSYS 18
For comparison between the PVT-SAHP tracking with normal PV tracking, Fig. 2 illustrates the schematic diagram of the PV tracking system without a cooling cycle. This simplified setup was used to assess the effect of SAHP integration on both thermal and electrical outputs. TRNSYS components (Types 15, 24, 50, and 65) represent the weather data input, system monitoring, PV/T collector, and performance outputs, respectively. The system design and the boundary conditions have been selected based on the following facts:
1. The slope of the PV/T panel surface is defined and used to be 36° according to Erbil city (Polus and Abdullah, 2025 [10]). The system uses a single-axis tracking mechanism, which adjusts the panel orientation along one axis to follow the sun throughout the day, thereby enhancing solar radiation capture compared to fixed-tilt systems.
2. The collector area is 6 m2.

Figure 2: Schematic diagram of the reference PV system modeled in TRNSYS 18. In this configuration, the panel operates as a conventional photovoltaic module, generating only electricity. No water circulation or thermal recovery is involved
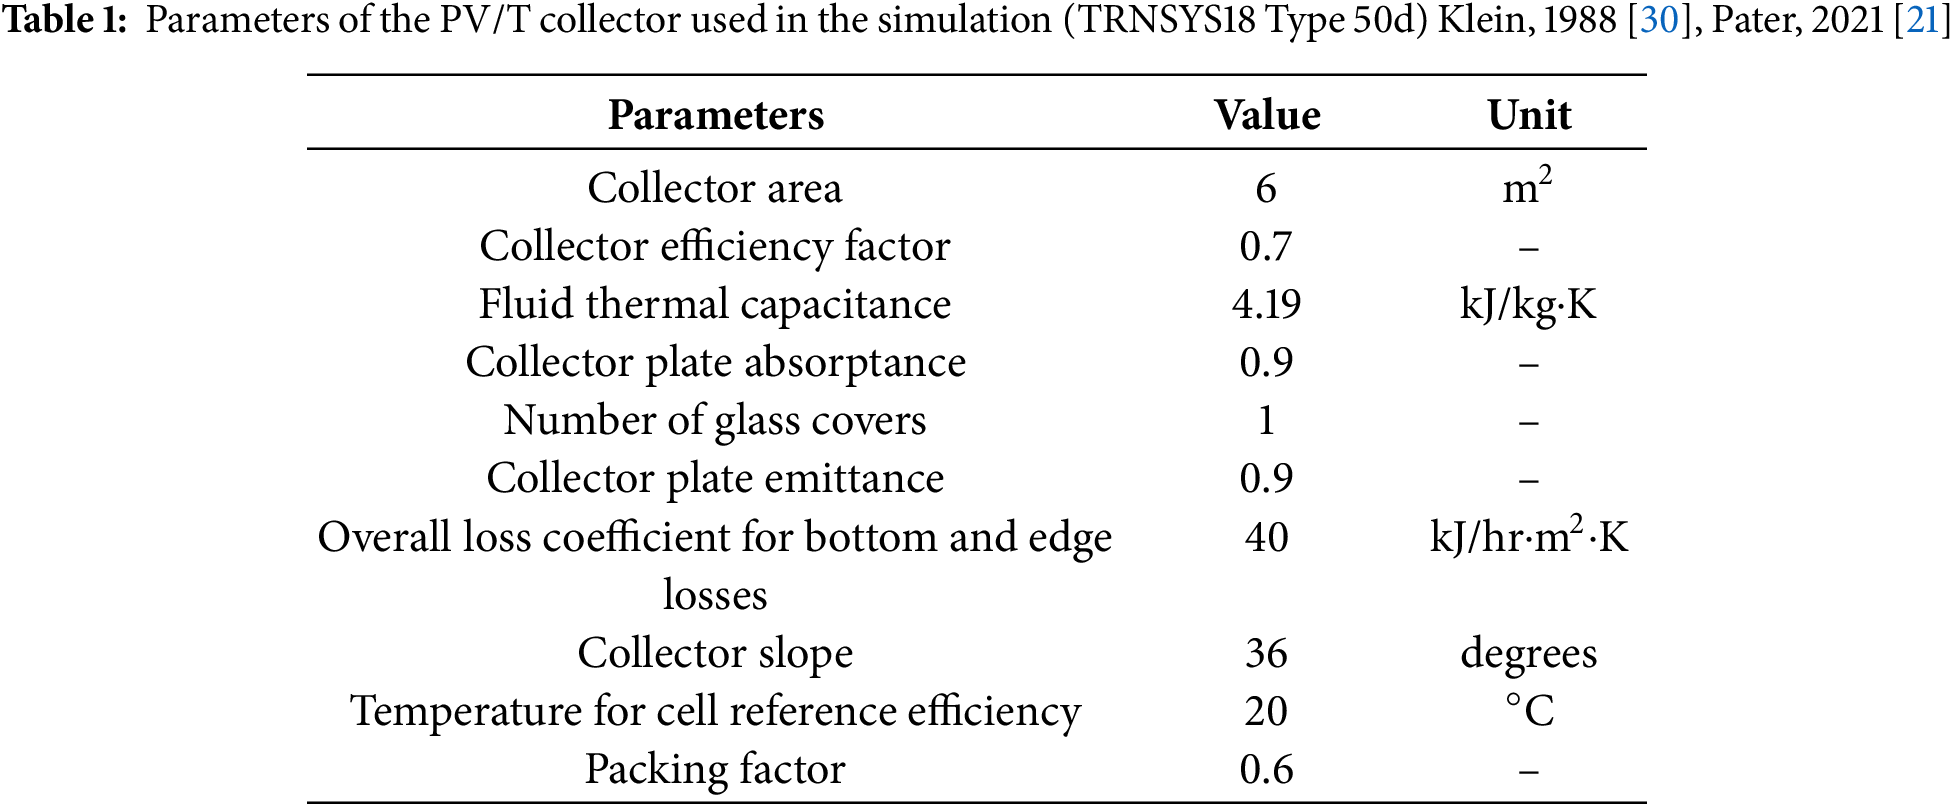
The operation conditions and parameters of the flat plate collector (Type 50d) are also shown in Table 1.
The model integrates a hybrid photovoltaic/thermal (PV/T) system, coupled with a water-to-water heat pump and a thermal storage tank, which was successfully simulated using TRNSYS under the weather conditions of Erbil, Iraq.
The system components include the PV/T collector (Type 50d), heat pump (Type 927), pumps (Type 114 and Type 114-3) to circulate the working fluid, thermal storage tank with an internal heat exchanger (Type 156), and control system (Type 165, Equa-2) controllers/equation components to manage operation based on environmental and performance data. Figs. 1 and 2 show that the PV/T system is modeled with and without a cooling cycle, functioning as PV without cooling, and a comparison is provided. Fig. 3 presents the schematic configuration of the PV/T-SAHP system. As shown in Fig. 1, on the source side, water heated in the PV/T collector circulates to the evaporator side of the water-to-water heat pump. On the load side, water circulates between the condenser side of the heat pump and the heat exchanger coil of the storage tank, transferring and storing useful heat. Pumps regulate the circulation in both loops. Red arrows indicate hot water flows, while blue arrows indicate cold water flows.

Figure 3: Schematic diagram of the PV/T-SAHP system showing the source and load side loops. 1—Collector inlet, 2—Collector outlet, 3—Heat pump outlet, 4—Heat pump inlet
1. Cold water from the heat pump’s evaporator is pumped to the collector, where the heat is rejected from the PV panel surface to the cooled water. At the same time, the hot water cycle flows to the condenser of the heat pump, to get heat and high-water temperature which is the source side of the load.
2. The hot water flows from the heat pump’s condenser to the storage tank’s heat exchanger, transferring heat between the HX’s hot water and the supply water from the building.
3. The storage tank’s water is heated to the desired (designed) temperature through the heating process.
4. Ultimately, we prepare the hot water for loading.
Eq. (1) was used to calculate the solar collector thermal efficiency (Yeung et al., 1992 [31]).
where
where
where
To validate the simulation model developed in this research, a comparative analysis was conducted using data from prior studies that examined the long-term performance of hybrid photovoltaic-thermal (PV/T) systems under specific climatic conditions. Notably, the study by Pater, 2021 [21] highlighted the influence of installation configurations, photovoltaic cell temperature coefficients, and the integration of a heat pump on the annual thermal and electrical performance of PV/T systems in the climate of Kraków, Poland. The trends observed in our simulation, particularly the effects of PV/T cooling on electrical efficiency and the enhanced system performance due to heat pump integration, are consistent with the findings reported in that study. This alignment confirms the reliability and accuracy of the developed simulation methodology. The modeled system by Pater, 2021 [21] includes a PV/T collector (Type 50d) with a surface area of 6 m2, a water-to-water heat pump with a rated heating capacity of 600 W and power input of 130 W, and a domestic hot water (DHW) tank (Type 156) with a volume of 300 L. Additional components such as pumps and controllers are also integrated into the system.
To verify the correctness of the TRNSYS model, we first implemented the system configuration from Pater, 2021 [21]. Fig. 4 illustrates the TRNSYS model of the verified system. Figs. 5 and 6 show comparisons of the COP and PV/T cell temperature, respectively, between the current simulation and the reference study. These comparisons demonstrate that the TRNSYS model accurately reproduces the system behavior reported by Pater, validating the modeling approach and implementation of the heat pump and PV/T components.
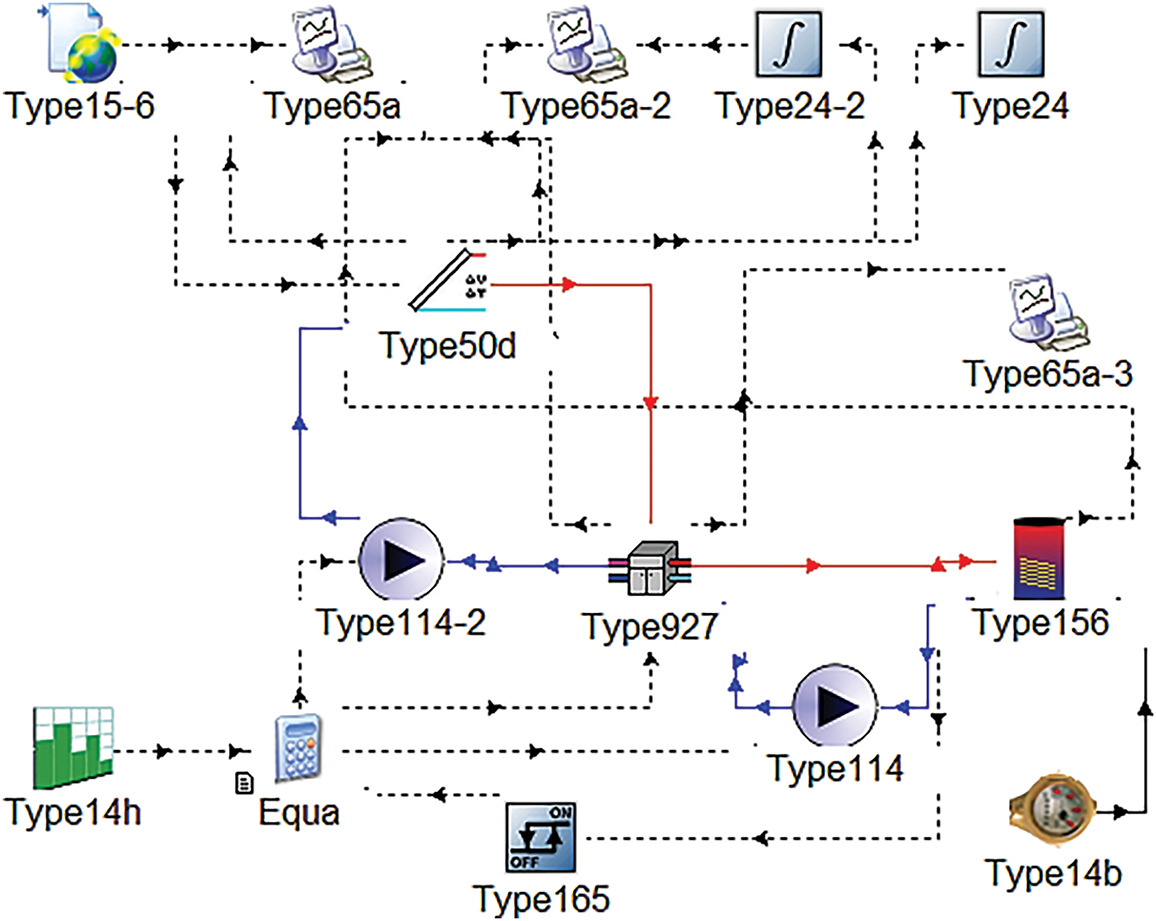
Figure 4: TRNSYS model of the verified system (adapted from Pater, 2021 [21])
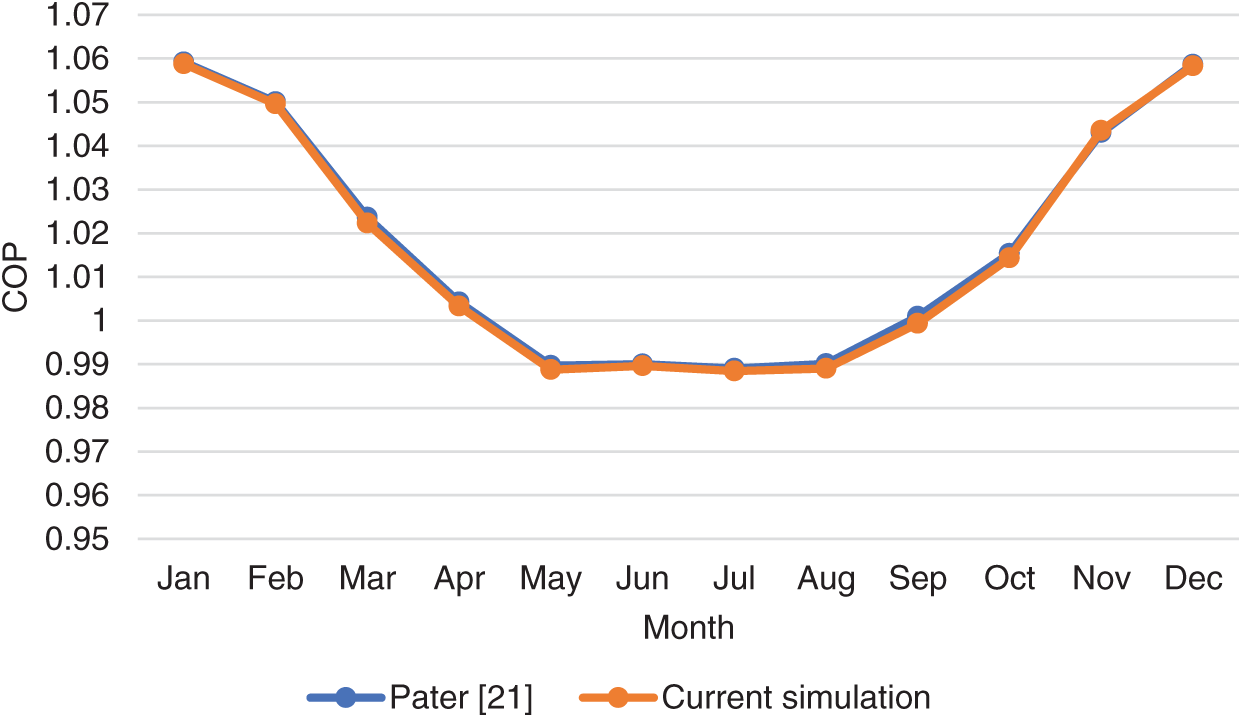
Figure 5: Comparison of the coefficient of performance (COP) of the TRNSYS model with reference data from Pater, 2021 [21]

Figure 6: Comparison of PV/T cell temperature (°C) simulated in the current study with reference results from Pater, 2021 [21]
To verify the accuracy of the TRNSYS model, the results were compared with the findings of Hassan et al., 2023 [32] study. Fig. 7 illustrates the hourly solar irradiation profiles of both studies conducted under Erbil weather conditions, showing a closely matching trend. The irradiation increases from about 200 W/m2 in the morning to nearly 1000 W/m2 at noon, then gradually decreases in the afternoon. The strong agreement, with minor deviations ranging from 0% to 12%, confirms that the developed model reliably represents real solar conditions and is suitable for subsequent performance.

Figure 7: Comparison of hourly solar irradiation between Hassan’s study and the current study
Fig. 8 shows the dry-bulb temperature corresponding to the annual ambient conditions in Erbil city, while Fig. 9 presents the monthly average total solar radiation on a tilted surface (36.1877° N, 44.0107° E). These environmental parameters significantly impact the PV/T-SAHP system’s electrical and thermal performance throughout the year.
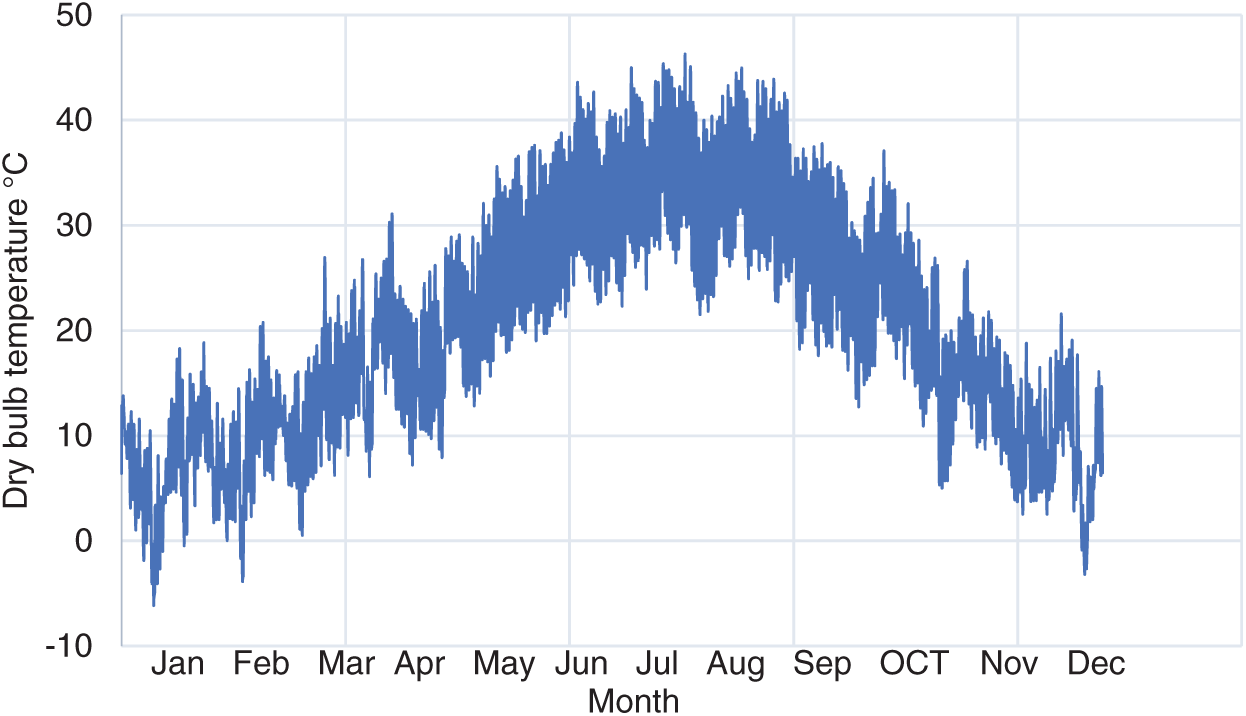
Figure 8: Dry bulb temperature in Erbil City

Figure 9: Monthly average of total solar radiation for tilted surface (kJ/hr·m2)
In Fig. 10, the monthly average electricity production has been shown. The PV with PV/T-SAHP (tracking) configuration consistently achieved higher monthly electrical output than the standalone PV system, recording an increase of 4.63% to 8.81%. The highest production occurred in May and June (617.92–634.34 kWh), mainly due to greater solar irradiance and extended daylight hours. While irradiance is the dominant factor, part of this gain arises from lower operating cell temperatures achieved by the integrated SAHP cooling loop.

Figure 10: Average monthly electricity production in the analyzed systems models with and without SAHP in kWh
The monthly average electrical outputs of the tracking and fixed PV systems are shown in Fig. 11. The tracking configuration consistently outperformed the fixed system, resulting in an annual total that reflected an overall gain of 17.7%. Peak generation occurred in May and June (576–588 kWh) under high irradiance and extended daylight, while December and January recorded the lowest values due to shorter days and lower solar angles.

Figure 11: Monthly variation of average electrical output (kWh) from tracking and fixed photovoltaic (PV) systems in Erbil City
The performance advantage of tracking was most pronounced in late spring and early summer (35%–40% gain), when solar exposure and sun-path alignment were optimal. During winter, the improvement narrowed to 7%–10% as low irradiance limited the tracking benefit. These findings confirm that solar tracking enhances annual energy yield, particularly in high-radiation climates such as Erbil, where optimized sun alignment and temperature regulation significantly improve PV output.
In Fig. 12, the monthly average electrical energy for fixed and tracking modes in the PV/T-SAHP system is presented. The results show that the tracking configuration consistently produces more electricity than the fixed mode throughout the year. During the winter months, specifically January and December, the tracking system generates 328.7 and 323.6 kWh, respectively, while the fixed system produces 297.8 and 299.7 kWh, respectively. Conversely, over the warmer months of May, June, and July, the benefits of tracking become more significant.

Figure 12: Monthly average electrical output (kWh) PV/T-SAHP under tracking and fix modes
Fig. 13 shows that the PV (Tracking) system consistently achieved higher maximum cell temperatures compared to the PV/T-SAHP (Tracking) system across all months. The PV (Tracking) system peaked at 89.9°C in August, while the PV/T-SAHP (Tracking) system reached a maximum of 83.0°C in the same month. This trend continued throughout the year, with the PV (Tracking) system outperforming the PV/T-SAHP (Tracking) system by an average of 5°C–7°C. In the winter months, both systems saw a drop in temperatures, with the PV/T-SAHP (Tracking) system showing the lowest values, reaching 52.8°C in December, compared to 61.3°C for PV (Tracking). The data underscores the effectiveness of the PV/T-SAHP (Tracking) system in reducing cell temperatures through the integration of a heat pump, which helps in cooling the cell.

Figure 13: Maximum cell temperature of PV and PV/T-SAHP systems, all months
Fig. 14 shows the average monthly cell temperature of PV/T-SAHP and PV tracking system. A comparison between the two systems reveals that the PV/T-SAHP configuration consistently has slightly lower cell temperatures than the conventional PV system across most months. This reduction is attributed to the active cooling effect of the heat pump and the thermal loop, which extract heat from the PV surface during operation. The lower operating temperature of the PV/T-SAHP modules indicates improved thermal regulation, which is beneficial for maintaining higher photovoltaic efficiency and system stability.

Figure 14: The average monthly cell temperature of PV/T-SAHP and PV
In July, when abundant solar energy and ideal weather conditions prevailed, the system reached its maximum coefficient of performance (COP) of 5.65. February and March recorded the lowest COP of 4.55, primarily due to lower ambient temperatures and increased heating demand. Lower source temperatures require more energy from the heat pump to achieve the same heating output. As the temperature drops in Erbil, the demand for heating increases, putting more stress on the heat pump system. This can further reduce the COP as the system works harder to maintain desired temperatures. Despite this seasonal variance, the COP remained above 4.55 throughout the year, indicating effective functioning, as shown in Fig. 15.

Figure 15: Coefficient of performance (COP) of a heat pump PV/T-SAHP
Fig. 16 illustrates the thermal efficiency throughout the year, as calculated using Eq. (1). The thermal efficiency of the PV/T-SAHP collector system ranged from a minimum of 10.02% in June to a maximum of 36.82% in February. Higher efficiencies during winter are attributed to lower ambient temperatures and an improved thermal gradient across the collector. Although solar irradiance is lower in winter (as shown in Fig. 8), the larger temperature difference enhances convective heat transfer, resulting in reduced overall losses and a relatively higher efficiency. This indicates that the “useful energy gain” (

Figure 16: Monthly thermal efficiency percentage
The results also reveal an inverse relationship between the collector’s thermal efficiency and the heat pump COP. As shown in Figs. 15 and 16, COP decreases in winter while thermal efficiency increases. This occurs because a lower inlet temperature to the heat pump increases the differences between the condenser and evaporator pressure ratios, demanding more compressor work and reducing COP. Conversely, a higher temperature difference between the collector and ambient air enhances heat transfer, thereby boosting thermal efficiency. During summer, the opposite effect occurs: reduced thermal gradient lowers collector efficiency, while the smaller temperature lift improves COP. Electrical efficiency refers to the ratio of electrical power output generated by the PV or PV/T-SAHP system to the total solar radiation incident on the collector surface. It measures how effectively the system converts solar energy into electricity. As shown in Fig. 17, the PV/T-SAHP system consistently outperformed the conventional PV system in both energy output and electrical efficiency. On an annual basis, the PV/T-SAHP (Tracking) system produced higher electrical energy, with monthly improvements of about 5%–7%, depending on the season. Its peak performance occurred in December (9.22%), while the average electrical efficiency reached 8.80%, compared to 8.45% for the PV (Tracking) system, an overall enhancement of approximately 4.1%.
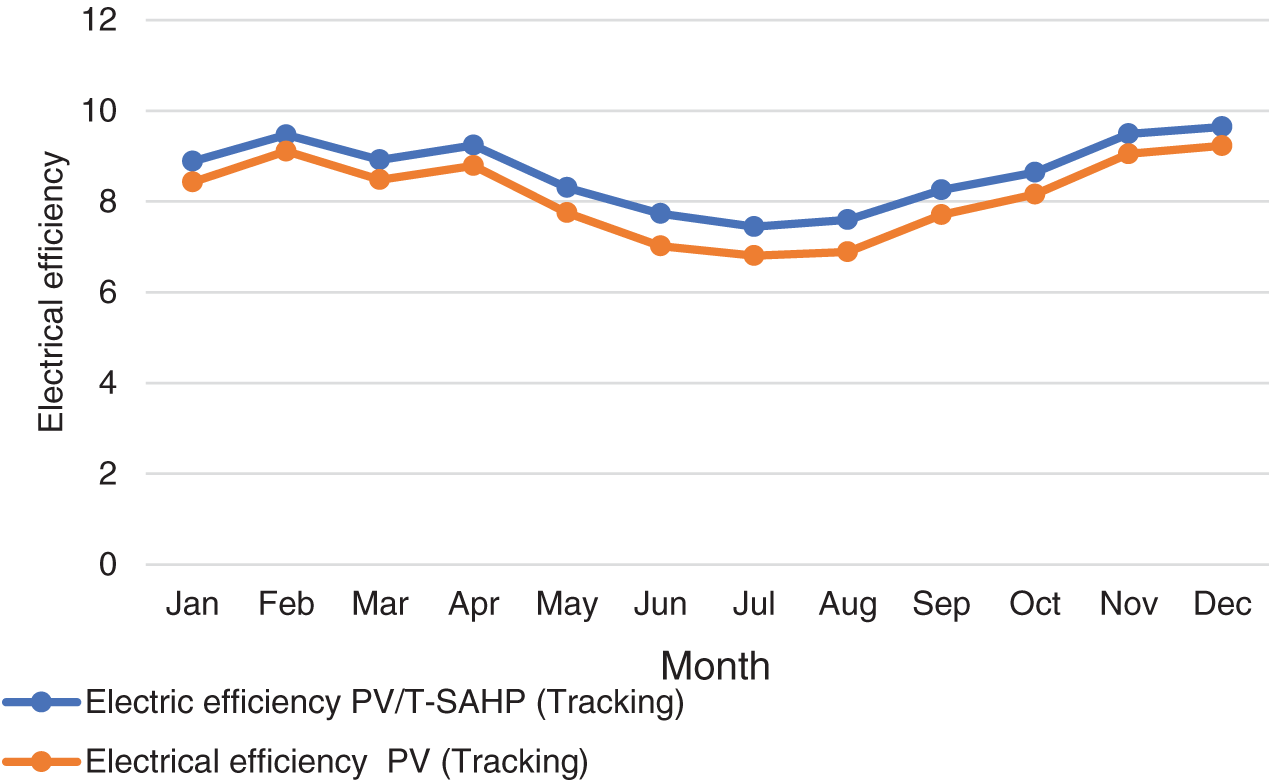
Figure 17: Monthly electrical efficiency percentage
This efficiency gain was especially evident in summer months (June–August) when elevated ambient temperatures typically reduce PV output; the SAHP’s cooling effect minimized thermal losses and maintained stable performance. Overall, integrating the solar-assisted heat pump (SAHP) with PV/T significantly improves both electrical and thermal efficiency, enabling simultaneous electricity and heat generation. This dual functionality enhances the total energy yield, making the PV/T-SAHP system particularly suitable for hot climates, such as Iraq, where high solar irradiation is prevalent.
In this paper, the hybrid photovoltaic solar-assisted heat pump with tracking and photovoltaic cells, excluding cooling, is investigated. The systems were simulated using the TRNSYS simulation program for the selected location, with the corresponding climate conditions in Erbil city, to obtain the outputs. The result of the installation received the cell temperature, total solar radiation, and the electricity produced by the PV/T. The study aimed to enhance electricity collection by cooling the collector’s cell temperature to increase electrical output.
The following are the noticeable results:
• The results demonstrate that coupling the PV/T collector with a solar-assisted heat pump (SAHP) effectively reduced the average PV cell temperature by approximately 2.5°C–7.5°C, depending on seasonal conditions. This temperature reduction improved thermal performance and maintained higher electrical efficiency throughout the year, especially during periods of high solar radiation.
• Model validation with a previously published study showed close agreement, confirming the accuracy and reliability of the simulation approach.
• Lowering cell temperatures led to a 4.6%–8.81% rise in electrical output compared to a standard PV system, with peak monthly generation reaching 617.9 kWh in May and 634.34 kWh in June during tracking operation.
• The difference in monthly electrical output between tracking and fixed PV systems in Erbil City ranges from 20.48 kWh in December to 177.04 kWh in June. This significant variation underscores the clear advantage of tracking systems, particularly during spring and summer when solar radiation is at its strongest. The results confirm that adopting a tracking mechanism greatly enhances energy yield under Erbil’s climatic conditions, making it a more efficient option for maximizing solar power generation throughout the year.
• The tracking mode significantly enhances the electrical performance of the PV/T-SAHP system compared to the fixed mode throughout the year. The improvement is modest during the winter months due to lower solar angles and shorter days. Still, it becomes much more pronounced in the warmer months, when solar radiation is higher and the tracking mechanism can fully utilize the extended daylight hours.
• The thermal efficiency of the PV/T-SAHP tracking collector system ranged from 10.02% in June to 36.82% in February, with higher efficiencies in colder months due to improved thermal gradients. Moreover, the system maintained a COP above 4.55 throughout the year, reaching a peak of 5.65 in June–July and a minimum of 4.55 in February and March.
• The PV/T-SAHP (Tracking) system outperforms conventional PV systems, delivering 5%–7% higher monthly electrical energy and an average efficiency of 8.80% vs. 8.45% for PV alone. The advantage is most notable during hot summer months, where the SAHP’s cooling effect reduces thermal losses and maintains higher conversion efficiency. These results highlight the system’s suitability for hot climates, such as Iraq, by enhancing both energy yield and electrical performance.
Overall Conclusion: Integrating a tracking PV/T system with an SAHP in Erbil’s climate greatly enhances both electrical and thermal energy output compared to standalone PV systems. This work shows that tracking PV/T-SAHP systems can deliver substantial energy gains and maintain high efficiency throughout the year.
• While the current study relies on simulation-based performance analysis, conducting real-world experiments under different climatic conditions would better validate the PV/T-SAHP system’s efficiency and reliability.
• A detailed techno-economic analysis, including cost-benefit and payback period assessments, can help determine the system’s commercial viability. Additionally, evaluating its potential for reducing greenhouse gas emissions could strengthen its environmental impact assessment.
Acknowledgement: We would like to express our sincere thanks to the Research and Development Center at Erbil Polytechnic University for their support and guidance throughout this research.
Funding Statement: The authors received no specific funding for this study.
Author Contributions: First author Ashna Abduljabbar Haji responsible for: methodology, software development, validation of the simulation, formal analysis, investigation resources, data curation, writing—original draft preparation. Second author Ranj S. Abdullah responsible for: conceptualization, review and editing, visualization, supervision. All authors reviewed the results and approved the final version of the manuscript.
Availability of Data and Materials: The data supporting the findings of this study are available from the Corresponding Author, [Ashna Haji], upon reasonable request, since this research is a part of the awarding of a Master of Science in Mechanical and Energy Engineering.
Ethics Approval: Not applicable.
Conflicts of Interest: We hereby declare that this is our original research. All information, data, figures, and results obtained from other sources have been duly cited and acknowledged in accordance with academic integrity guidelines.
Nomenclature
| Collector efficiency | - | |
| Collector useful energy gain | kJ/hr | |
| Incident radiation | kJ/hr·m2 | |
| Collector area | m2 | |
| PV | Photovoltaic panel | - |
| PV/T | Hybrid photovoltaic-thermal collector | - |
| PV/T SAHP | Hybrid photovoltaic-thermal collector solar-assisted heat pump | - |
| COP | Coefficient of performance | - |
| Heat pump heating capacity at current conditions | kJ/hr | |
| Power drawn by the heat pump in heating mode | kJ/hr | |
| TRNSYS | Transient system simulation tool | - |
| HX | Heat exchanger | - |
| GDP | Gross Domestic Product | - |
References
1. Sesana E, Gagnon AS, Ciantelli C, Cassar J, Hughes JJ. Climate change impacts on cultural heritage: a literature review. Wires Clim Change. 2021;12(4):e710. doi:10.1002/wcc.710. [Google Scholar] [CrossRef]
2. Kabir M, Habiba UE, Khan W, Shah A, Rahim S, De los Rios-Escalante PR, et al. Climate change due to increasing concentration of carbon dioxide and its impacts on environment in 21st century; a mini review. J King Saud Univ Sci. 2023;35(5):102693. doi:10.1016/j.jksus.2023.102693. [Google Scholar] [CrossRef]
3. Al-Hamadani S. Solar energy as a potential contributor to help bridge the gap between electricity supply and growing demand in Iraq: a review. Int J Adv Appl Sci. 2020;9(4):302. doi:10.11591/ijaas.v9.i4.pp302-312. [Google Scholar] [CrossRef]
4. Al-Din S, Kuzovic D, Iranfar M. Renewable energy strategies to overcome power shortage in Kurdistan Region of Iraq. Industrija. 2017;45(2):7–21. doi:10.5937/industrija45-12770. [Google Scholar] [CrossRef]
5. Aziz SQ, Ahmed BM, Mahmod AA, Othman S. Improvement of Erbil city environment and increasing irrigated areas through simulated hydraulic design from greater-Zab river water. Acad J Nawroz Univ. 2023;12(4):752–77. doi:10.25007/ajnu.v12n4a1656. [Google Scholar] [CrossRef]
6. Zhang X, Zhao X, Smith S, Xu J, Yu X. Review of R&D progress and practical application of the solar photovoltaic/thermal (PV/T) technologies. Renew Sustain Energy Rev. 2012;16(1):599–617. doi:10.1016/j.rser.2011.08.026. [Google Scholar] [CrossRef]
7. Fatima K, Faiz Minai A, Malik H, García Márquez FP. Experimental analysis of dust composition impact on photovoltaic panel Performance: a case study. Sol Energy. 2024;267:112206. doi:10.1016/j.solener.2023.112206. [Google Scholar] [CrossRef]
8. Dwivedi P, Sudhakar K, Soni A, Solomin E, Kirpichnikova I. Advanced cooling techniques of P.V. modules: a state of art. Case Stud Therm Eng. 2020;21:100674. doi:10.1016/j.csite.2020.100674. [Google Scholar] [CrossRef]
9. Rasool IN, Abdullah RS. Experimental study of PV panel performance using backside water cooling chamber. Int J Energy Prod Manag. 2023;8(2):89–95. doi:10.18280/ijepm.080205. [Google Scholar] [CrossRef]
10. Polus SA, Abdullah RS. Impact of different parameters on power generation from photovoltaic module cooled by three-sided water spray. Int J Heat Technol. 2025;43(1):287–98. doi:10.18280/ijht.430129. [Google Scholar] [CrossRef]
11. Wolf M. Performance analyses of combined heating and photovoltaic power systems for residences. Energy Convers. 1976;16(1–2):79–90. doi:10.1016/0013-7480(76)90018-8. [Google Scholar] [CrossRef]
12. Kumar A, Baredar P, Qureshi U. Historical and recent development of photovoltaic thermal (PVT) technologies. Renew Sustain Energy Rev. 2015;42:1428–36. doi:10.1016/j.rser.2014.11.044. [Google Scholar] [CrossRef]
13. Dupeyrat P, Ménézo C, Fortuin S. Study of the thermal and electrical performances of PVT solar hot water system. Energy Build. 2014;68:751–5. doi:10.1016/j.enbuild.2012.09.032. [Google Scholar] [CrossRef]
14. Mostakim K, Hasanuzzaman M. Global prospects, challenges and progress of photovoltaic thermal system. Sustain Energy Technol Assess. 2022;53(2):102426. doi:10.1016/j.seta.2022.102426. [Google Scholar] [CrossRef]
15. Elbreki AM, Alghoul MA, Al-Shamani AN, Ammar AA, Yegani B, Aboghrara AM, et al. The role of climatic-design-operational parameters on combined PV/T collector performance: a critical review. Renew Sustain Energy Rev. 2016;57:602–47. doi:10.1016/j.rser.2015.11.077. [Google Scholar] [CrossRef]
16. Kazem HA, Chaichan MT, Al-Waeli AHA, Sopian K. Recent advancements in solar photovoltaic tracking systems: an in-depth review of technologies, performance metrics, and future trends. Sol Energy. 2024;282:112946. doi:10.1016/j.solener.2024.112946. [Google Scholar] [CrossRef]
17. Kumba K, Upender P, Buduma P, Sarkar M, Simon SP, Gundu V. Solar tracking systems: advancements, challenges, and future directions: a review. Energy Rep. 2024;12:3566–83. doi:10.1016/j.egyr.2024.09.038. [Google Scholar] [CrossRef]
18. Polus SA, Abdullah RS. Experimental performance evaluation of tracking photovoltaic system based on variable water flow rate with surface temperature. Energy Sources Part A Recovery Util Env Eff. 2023;45(2):5297–309. doi:10.1080/15567036.2023.2209533. [Google Scholar] [CrossRef]
19. Leonforte F, Miglioli A, Del Pero C, Aste N, Cristiani N, Croci L, et al. Design and performance monitoring of a novel photovoltaic-thermal solar-assisted heat pump system for residential applications. Appl Therm Eng. 2022;210(1):118304. doi:10.1016/j.applthermaleng.2022.118304. [Google Scholar] [CrossRef]
20. Hawlader MNA, Chou SK, Ullah MZ. The performance of a solar assisted heat pump water heating system. Appl Therm Eng. 2001;21(10):1049–65. doi:10.1016/S1359-4311(00)00105-8. [Google Scholar] [CrossRef]
21. Pater S. Long-term performance analysis using TRNSYS software of hybrid systems with PV-T. Energies. 2021;14(21):6921. doi:10.3390/en14216921. [Google Scholar] [CrossRef]
22. Abdullah RS, Polus SA. Simulation study of solar assisted absorption cooling system using flat plate collectors at Erbil city-Iraq. In: Proceedings of the 2022 8th International Engineering Conference on Sustainable Technology and Development (IEC); 2022 Feb 23–24; Erbil, Iraq. p. 17–22. doi:10.1109/IEC54822.2022.9807567. [Google Scholar] [CrossRef]
23. Abdel-Aziz MM, Elnaby Kabeel A, Khelifa A, El Hadi Attia M, Bady M. A numerical investigation on improving the thermal efficiency of PV panels through integration with solar water collectors. Sol Energy. 2025;287(11):113259. doi:10.1016/j.solener.2025.113259. [Google Scholar] [CrossRef]
24. Robinson A. Solar PV analysis of Erbil, Iraq [Internet]. 2013[cited 2025 Sep 1]. Available from: https://profilesolar.com/locations/Iraq/Erbil/. [Google Scholar]
25. Kalogirou SA. Use of TRNSYS for modelling and simulation of a hybrid pv-thermal solar system for Cyprus. Renew Energy. 2001;23(2):247–60. doi:10.1016/S0960-1481(00)00176-2. [Google Scholar] [CrossRef]
26. Arnesson H, Olympios AV, Harraz AA, Xu J. Comprehensive energy, economic, and environmental analysis of a hybrid photovoltaic-thermal (PVT) heat pump system. Energy. 2025;331(9):136563. doi:10.1016/j.energy.2025.136563. [Google Scholar] [CrossRef]
27. Sumathi V, Jayapragash R, Bakshi A, Kumar Akella P. Solar tracking methods to maximize PV system output—a review of the methods adopted in recent decade. Renew Sustain Energy Rev. 2017;74:130–8. doi:10.1016/j.rser.2017.02.013. [Google Scholar] [CrossRef]
28. Saeidavi A, Kiani Deh Kiani M, Mashhour E. Simulation and evaluation of a hybrid ground source heat pump system with a photovoltaic thermal collector (PVT) in Ahvaz city using TRNSYS software. J Build Eng. 2025;109:113014. doi:10.1016/j.jobe.2025.113014. [Google Scholar] [CrossRef]
29. Salehi Dezfouli MM, Dehghani-Sanij A, Abdul Kadir K. Modelling and energy analysis of a solar cooling system powered by a photovoltaic (PV) system for a net-zero energy building (NZEB) using TRNSYS-PVsyst. In: Reducing the effects of climate change using building-integrated and building-applied photovoltaics in the power supply. Cham, Switzerland: Springer; 2024. p. 315–50. doi:10.1007/978-3-031-42584-4_14. [Google Scholar] [CrossRef]
30. Klein SA. TRNSYS-A transient system simulation program. In: Engineering experiment station report. Madison, WI, USA: University of Wisconsin-Madison, Engineering Experiment Station Report; 1998. p. 38–12. [Google Scholar]
31. Yeung MR, Yuen PK, Dunn A, Cornish LS. Performance of a solar-powered air conditioning system in Hong Kong. Sol Energy. 1992;48(5):309–19. doi:10.1016/0038-092X(92)90059-J. [Google Scholar] [CrossRef]
32. Hassan ZF, Yaqob BN, Abdullah RS. Enhancing greenhouse thermal management with flat plate solar collectors and Al2O3-water nanofluid. Int J Energy Prod Manag. 2023;8(2):71–9. doi:10.18280/ijepm.080203. [Google Scholar] [CrossRef]
Cite This Article
 Copyright © 2025 The Author(s). Published by Tech Science Press.
This work is licensed under a Creative Commons Attribution 4.0 International License , which permits unrestricted use, distribution, and reproduction in any medium, provided the original work is properly cited.
 Downloads
 Citation Tools