
 Submit a Paper
 Propose a Special lssue
 Open Access
ARTICLE

Study on the Fluid-Solid Coupling Seepage of the Deep Tight Reservoir Based on 3D Digital Core Modeling
1 PetroChina Tarim Oilfield Company, Korla, 841000, China
2 CNPC R&D Center for Ultra-Deep Complex Reservoir Exploration and Development, Korla, 841000, China
3 National Key Laboratory of Deep Oil and Gas, China University of Petroleum (East China), Qingdao, 266580, China
4 Structure and Shipping Department, Offshore Oil Engineering (Qingdao) Co., Ltd., Qingdao, 266520, China
* Corresponding Authors: Haijun Yang. Email: ; Jing Li. Email:
Energy Engineering 2025, 122(2), 537-560. https://doi.org/10.32604/ee.2024.058747
Received 19 September 2024; Accepted 04 December 2024; Issue published 31 January 2025
 View Full Text
 Download PDF
Abstract
Deep tight reservoirs exhibit complex stress and seepage fields due to varying pore structures, thus the seepage characteristics are significant for enhancing oil production. This study conducted triaxial compression and permeability tests to investigate the mechanical and seepage properties of tight sandstone. A digital core of tight sandstone was built using Computed Tomography (CT) scanning, which was divided into matrix and pore phases by a pore equivalent diameter threshold. A fluid-solid coupling model was established to investigate the seepage characteristics at micro-scale. The results showed that increasing the confining pressure decreased porosity, permeability, and flow velocity, with the pore phase becoming the dominant seepage channel. Cracks and large pores closed first under increasing pressure, resulted in a steep drop in permeability. However, permeability slightly decreased under high confining pressure, which followed a first-order exponential function. Flow velocity increased with seepage pressure. And the damage mainly occurred in stress-concentration regions under low seepage pressure. Seepage behavior followed linear Darcy flow, the damage emerged at seepage entrances under high pressure, which decreased rock elastic modulus and significantly increased permeability.Keywords
As conventional oil and gas resources are depleted, attention has shifted towards developing unconventional tight reservoirs due to their vast reserves. Consequently, unconventional reservoirs have emerged as a promising avenue for the extraction and development of oil and gas resources [1,2]. However, tight reservoirs are marked by deep burial, low porosity, low permeability, and intricate pore structures, which challenge reservoir development [3–6]. Generally, the stress field and seepage field of the tight reservoirs are significantly affected by oil and gas extraction, fracking, gas injection, and displacement [7–10]. Meanwhile, the stress field can change the porosity and permeability of the reservoir. The alterations in the seepage field during the oil and gas extraction give rise to variations of effective stress within the reservoir, thereby showcasing a pronounced fluid-solid coupling effect, increasing permeability prediction difficulties [10,11].
Numerous studies have investigated the seepage characteristics and permeability evaluation of tight reservoirs. For instance, the effective stress principle was initially introduced by Biot [12] and subsequently derived or modified to accommodate various working conditions. Gutierrez [13] studied the multiphase flow interactions and rock deformation behaviors within reservoirs. Since fluid injection and extraction influence the reservoir pore pressure, it is essential to consider rock deformation and stress-strain levels in modeling oil and gas reservoirs. Consequently, a Biot multiphase fluid flow model in deformed porous media was proposed. Zhang et al. [14] established a mathematical model using the elastic theory of porous media combined with fluid-solid interactions, thoroughly incorporating the deformation of various porous media and fluid flow within tight reservoirs. However, tight reservoirs contain many pores and fractures ranging from micrometers to meters in scale [15–17]. Due to the differing fluid flow mechanisms at various scales, traditional seepage mechanics based on Darcy’s Law are insufficient for accurately capturing the fluid flow behavior in tight reservoirs [18,19]. Most studies have employed pore-scale flow simulations at the microscopic scale of rock. Specifically, the pore structure network of reservoir rock has been extracted for flow simulations [20–22]. A et al. [23] performed a microscale analysis of oil/gas flow characteristics through molecular dynamics simulations to investigate the wettability and structure of mineral surfaces, as well as the diffusion characteristics of water molecules on the surfaces. Alternatively, constructing a digital core has facilitated the division of rocks into various media components, such as pores, cracks, and matrices. Each component is assigned specific parameters to simulate the overall seepage flow within the rock. Furthermore, the lattice Boltzmann method [24–26] and the finite element method [27,28] are commonly used for seepage flow simulations. Many scholars adopt the pore network model to simplify the pores and fractures in rocks as regular capillaries; and simplify the complex flow of fluids in rocks to flow in capillary tubes of different diameters, which requires less computing power. However, the pore structure of tight reservoir rocks is complicated, especially the existence of fractures, whose size, shape, and direction greatly influence the permeability of the whole rock. Therefore, it is necessary to establish the corresponding flow equation according to the characteristics of various fluid channels in the rock, to describe the natural fluid flow state in the rock more accurately.
The pore structure of a reservoir is essential for oil and gas flow as well as influences the macroscopic physical characteristics of the medium, especially in determining permeability [29–31]. Hence, the pore structure of the rock is significant to the microscopic seepage and mechanical characteristics of the reservoir [32,33]. The digital core has advantages such as non-destructiveness, stability, high resolution, and repeatable utilization, which is a primary research method for rock pore structure [34,35]. The use of digital core technology in studying the micro-permeability and fluid-solid coupling effect of reservoirs provides an accurate and cost-effective research system. However, the 3D digital core reconstruction by CT scanning still faces challenges, such as the limit scanning resolution and insufficient accuracy of the reconstruction algorithm. The precision of standard CT scanners is at the micron level, thus some micropores and throats cannot be detected. As a result, the flow simulation based on the pore structures obtained by CT scanning can not accurately characterize the fluid flow in rocks. Additionally, many existing studies conducted numerical simulations using a single-pore network or small-size model, which was inadequate for analyzing rock mechanics and seepage characteristics. An accurate model was needed to characterize fluid flow in tight rocks and reduce the computational complexity without compromising accuracy.
In the study, rock mechanics and seepage parameters are obtained through rock mechanics and seepage tests. Based on CT scanning, a digital core of tight sandstone is established, and its pore structure is accurately characterized. In light of existing issues, micropores smaller than 40 µm are classified as a mixed matrix phase, resulting in breakthroughs in simulation accuracy and application breadth. A more precise digital core research model is proposed. The coupling model of free flow and seepage and the coupling constitutive equation of flow and solid are also established. The effects of various confining pressures and seepage pressures on seepage characteristics under the fluid-solid coupling effect of the model are studied at the microscale. The study provides an essential foundation for further understanding the seepage characteristics of tight sandstone and its behavior in practical applications.
2 Mechanical and Permeability Test
The rock samples were collected from a well at a depth of 5229.00 m in the oil fields of western China with a size of Φ25 × 50 mm. The triaxial compression test was conducted using a rock testing apparatus designed for high temperature and pressure conditions. Two rock samples were examined under different confining pressures (i.e., 0, 20, 40, and 60 MPa). The confining pressure was applied first during the test, and then the axial pressure was applied with a loading rate of 0.05%/min. The data were recorded until the rock samples were damaged.
The stress-strain curves of the eight rock samples are presented in Fig. 1. Under uniaxial compression (i.e., confining pressure of 0 MPa), the rock sample has a peak strength of less than 80 MPa and an elastic modulus of approximately 10 GPa. The sandstone samples displayed brittle behavior, evidenced by the rapid decrease in the post-peak curve. Furthermore, the strength and elastic modulus of the samples increased significantly as the confining pressure rose. Meanwhile, the decrease in the stress-strain curve after the peak became more gradual, indicating that the tight sandstone samples exhibited increased ductility. The mechanical properties of the rock samples are summarized in Table 1. Fig. 2 shows that a primary diagonal shear fracture of 60° occurred when the tight sandstone sample failed, which is consistent with results from some studies [8,36].
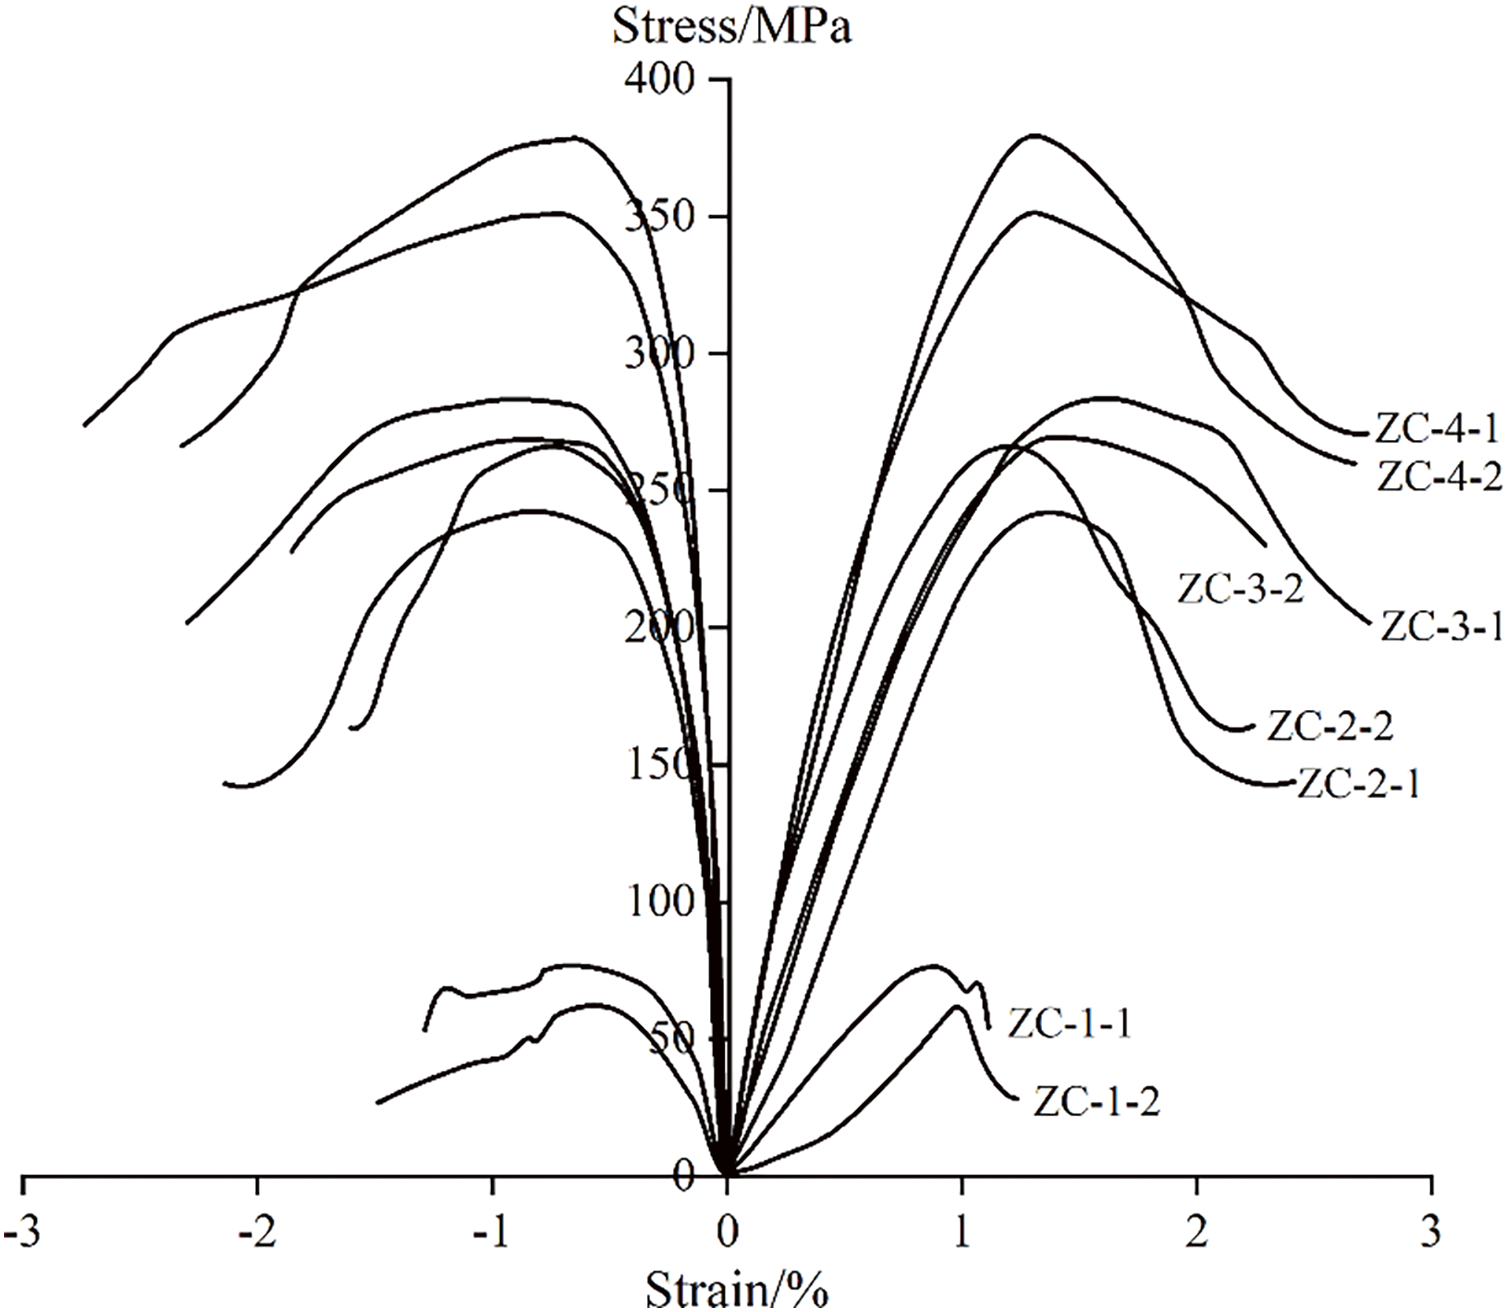
Figure 1: Stress-strain curve
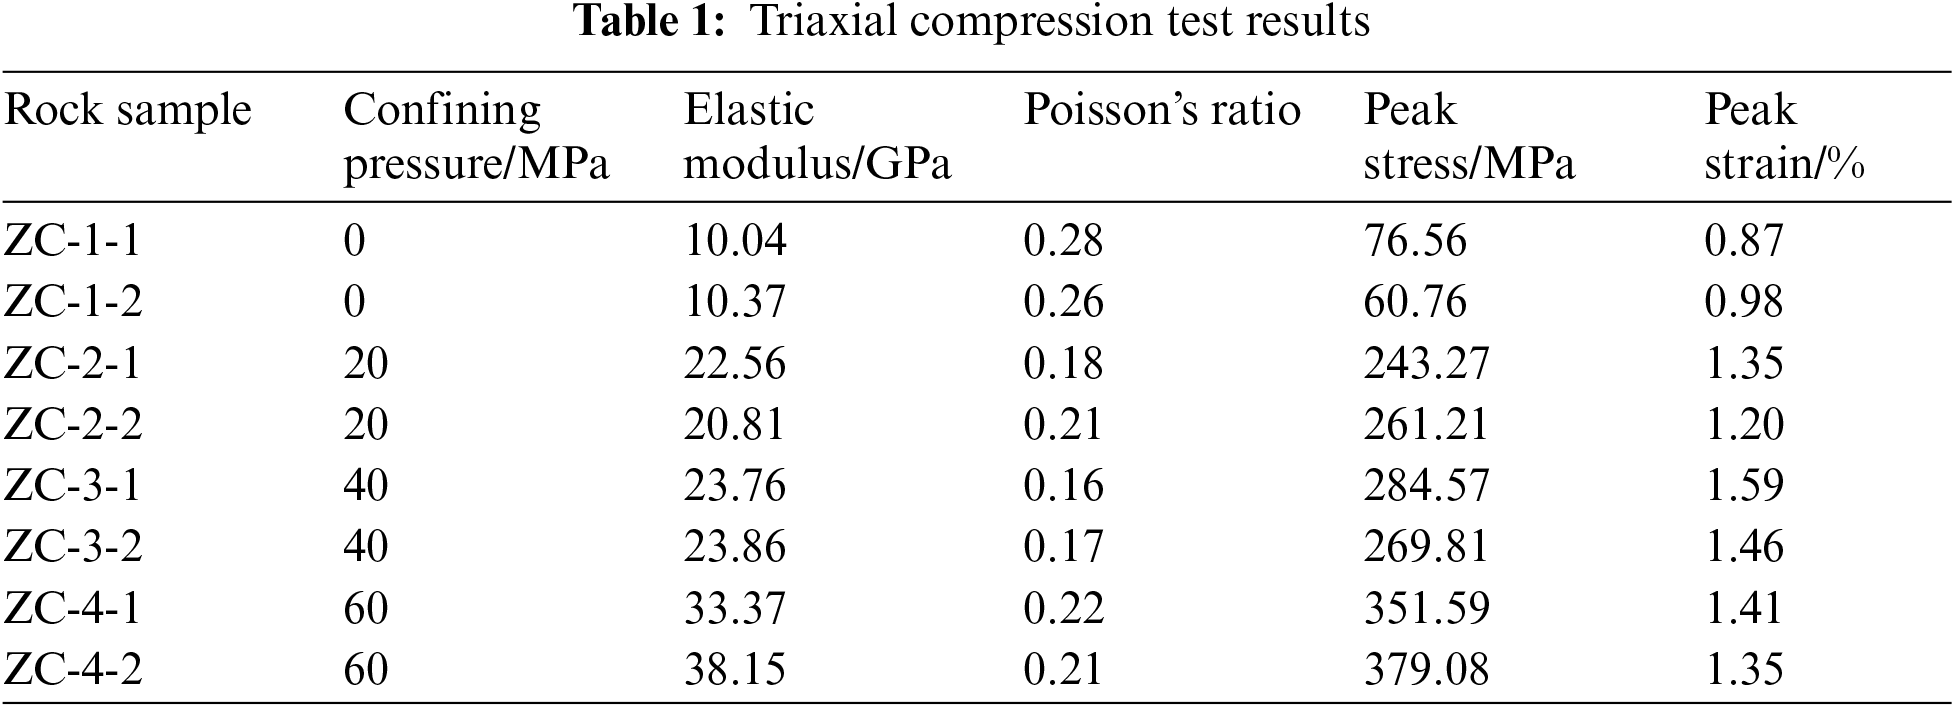
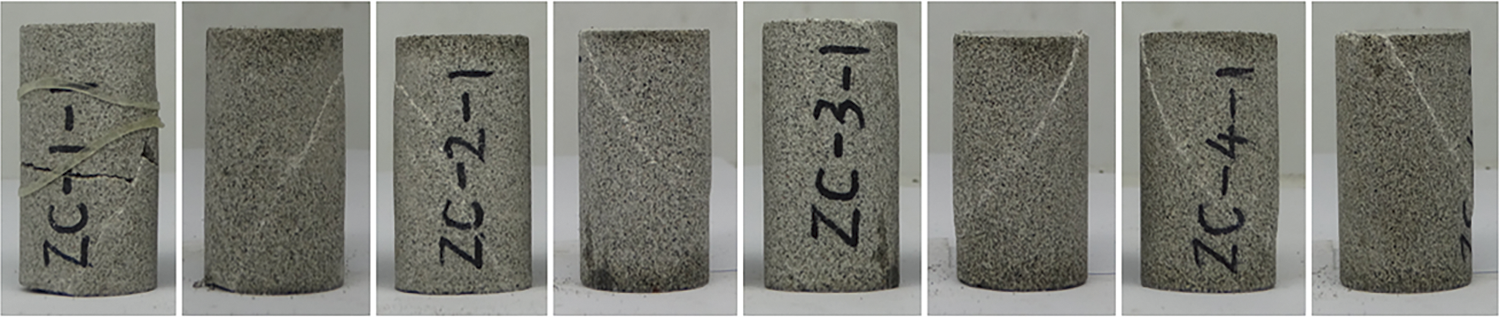
Figure 2: Failure mode of rock sample
In this study, the permeability was measured by the gas permeability test. The sample had a pressure gradient when nitrogen was used due to the pressure difference between the inlet and outlet. The pressure gradually decreased from the inlet to the outlet, resulted in the expanded gas volume and increased flow rate. While Darcy’s law applies to incompressible fluids, gas permeability is expressed using a modified version of Darcy’s law:
where
Due to the slippage effect, the gas-measured permeability is greater than the absolute permeability. This error can be modified as:
where
In the gas permeability test, the permeability Kg at different average pressures
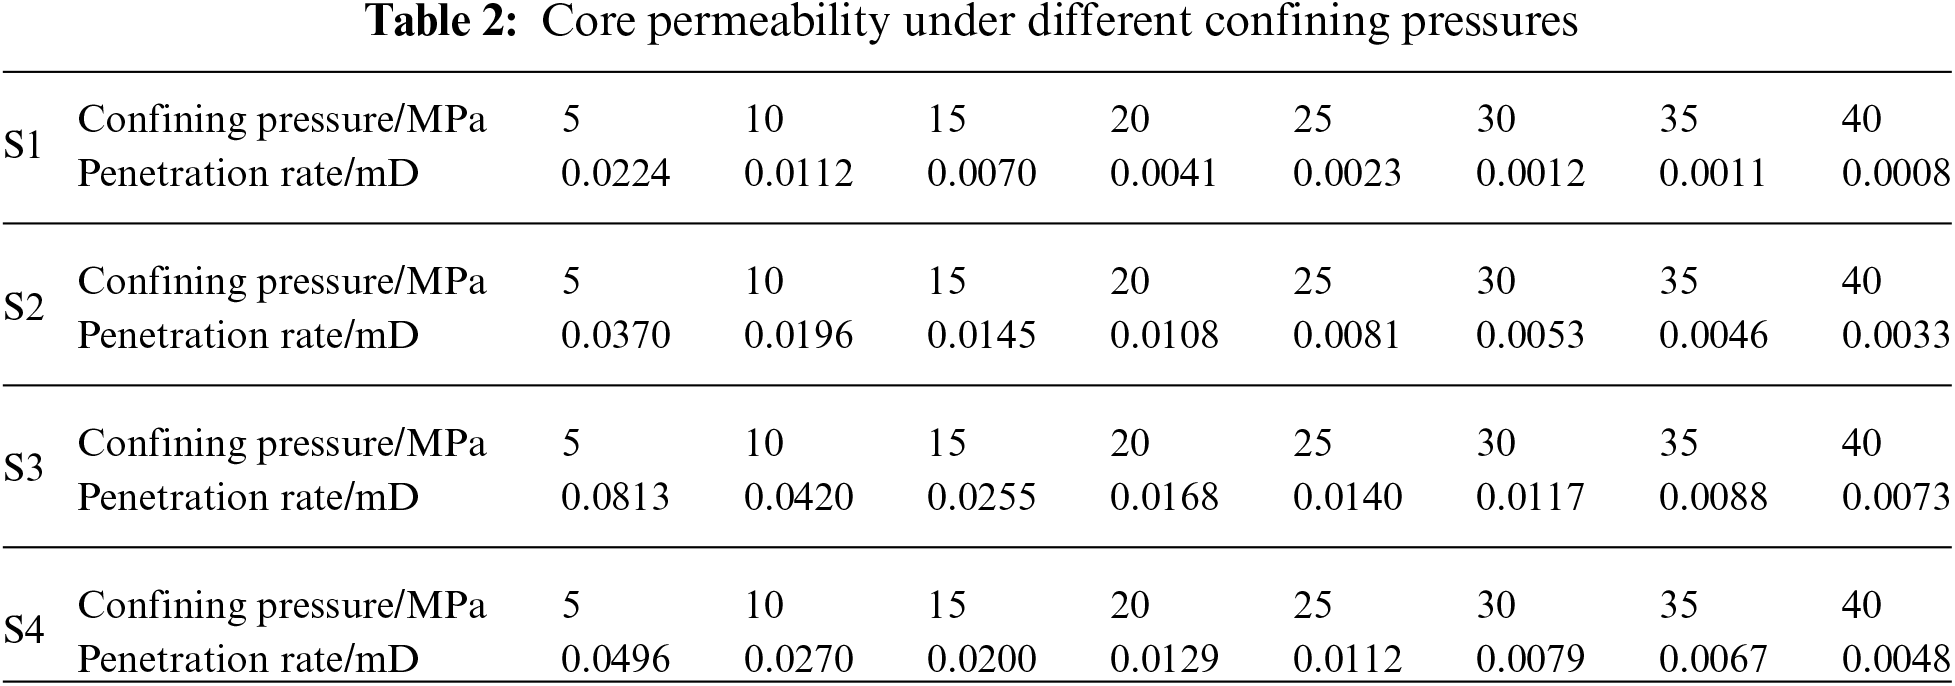
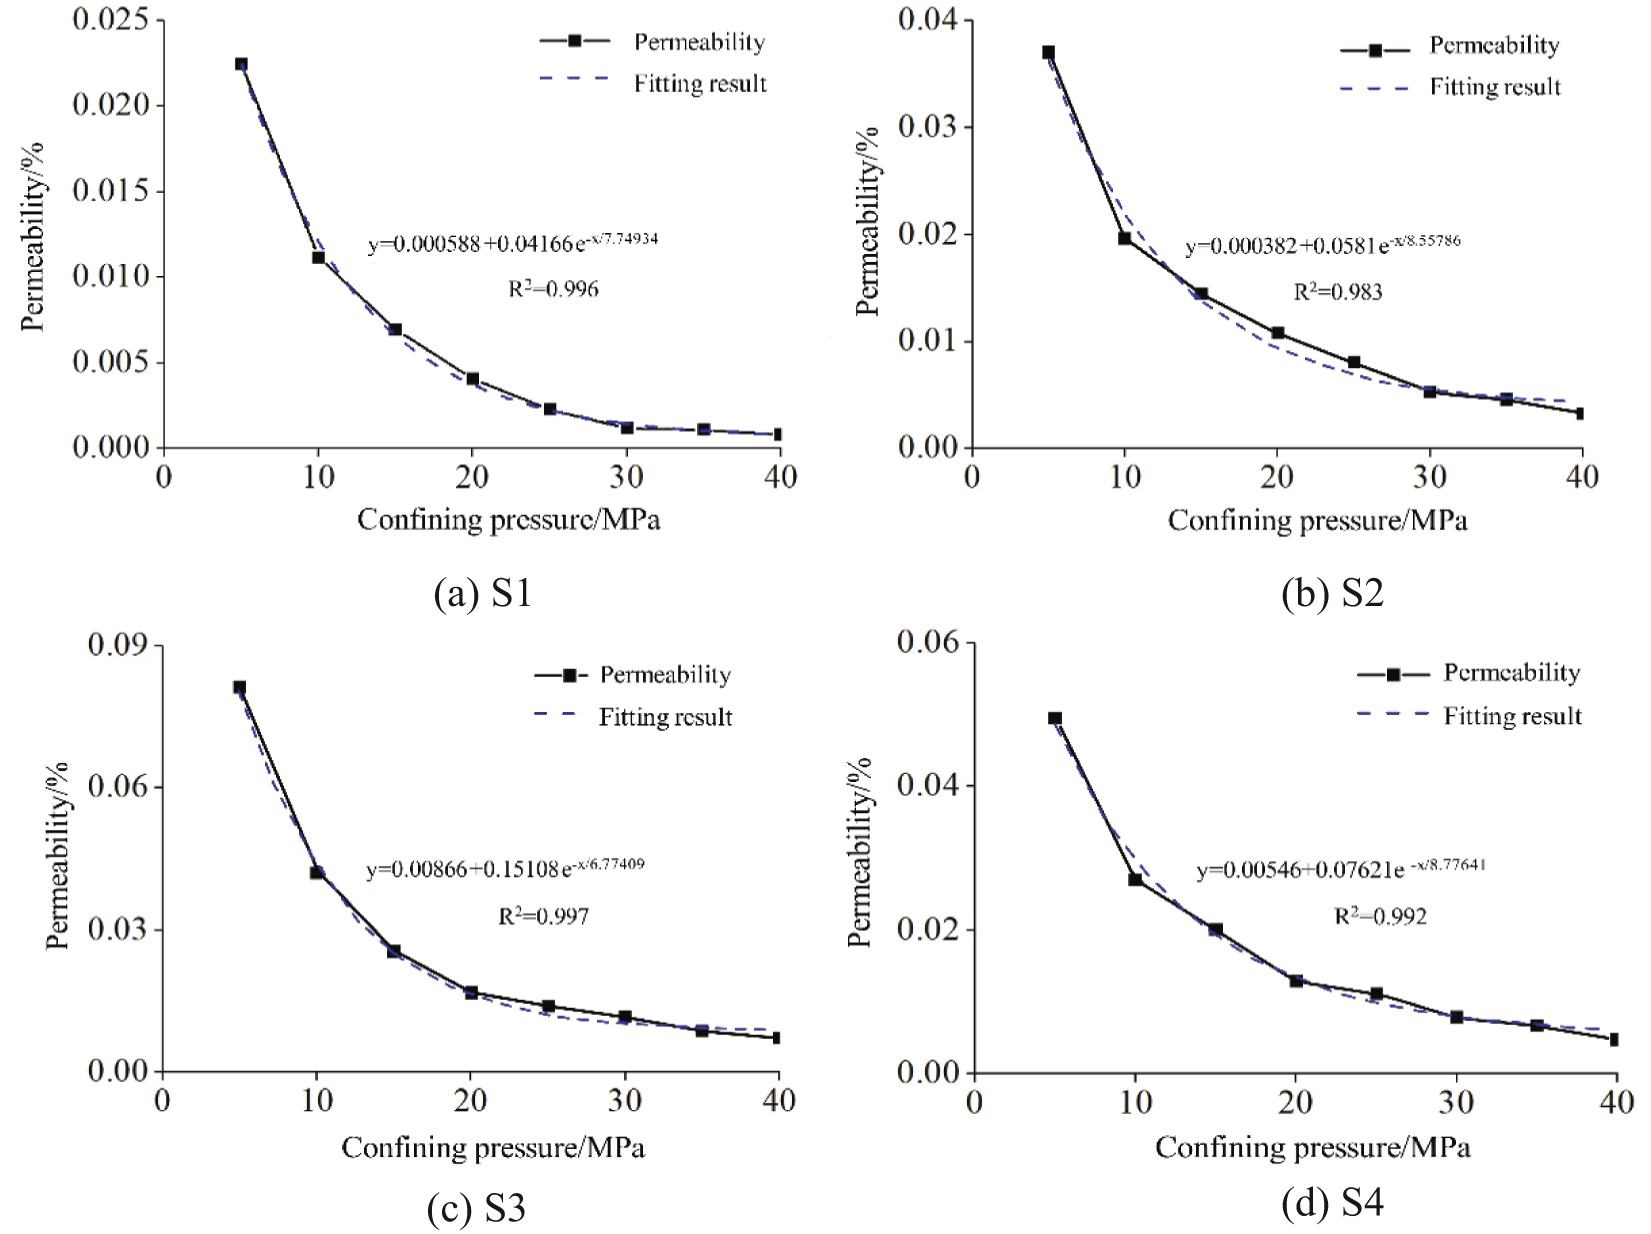
Figure 3: Relationship curve between Klinkenberg permeability and confining pressure
3 Microscopic Numerical Simulation
3.1 3D Reconstruction of Digital Cores
A small cylinder with a diameter of 2.5 mm was drilled by wireline cutting to carry out a CT scanning test. The CT scan test was performed with an Xradia MicroXCT-200 instrument, which could scan samples up to 50 mm in size with a spatial resolution under 2 μm and a pixel resolution below 1 μm. The sample was scanned layer by layer with the image size of 1024 × 1024 pixels, corresponded to the actual rock sample scale of 2.5 μm/pixel, as shown in Fig. 4. A total of 1120 2D grayscale images were obtained. The distribution of grayscale values of CT images ranged from 0 to 255. The part with a grayscale value of 0 was black, which was the pores and cracks in the rock. The part with grayscale values 255 was white, expressing the rock’s high-density mineral. Besides, the gray part between black and white was the rock matrix. However, the original image of the CT scan had low contrast and noise points. Thus, it is difficult to distinguish the media type [37,38]. To characterize the pore structure more accurately, MATLAB software was used in this study to batch process the original gray images.
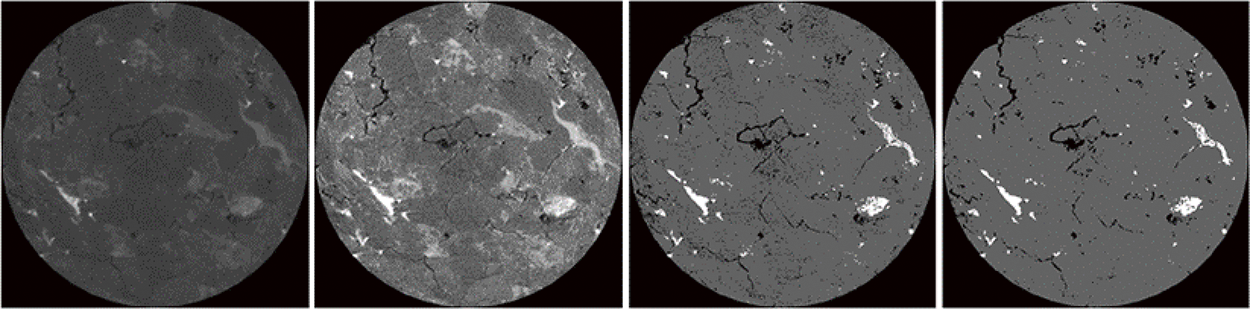
Figure 4: Image processing
The original CT scan images were processed to contain three gray values: 0, 100, and 255. A total of 1220 CT images were used for 3D reconstruction to obtain the digital cores, as shown in Fig. 5a. The pore structure (i.e., pores and cracks) in the digital cores was extracted, as depicted in Fig. 5b.
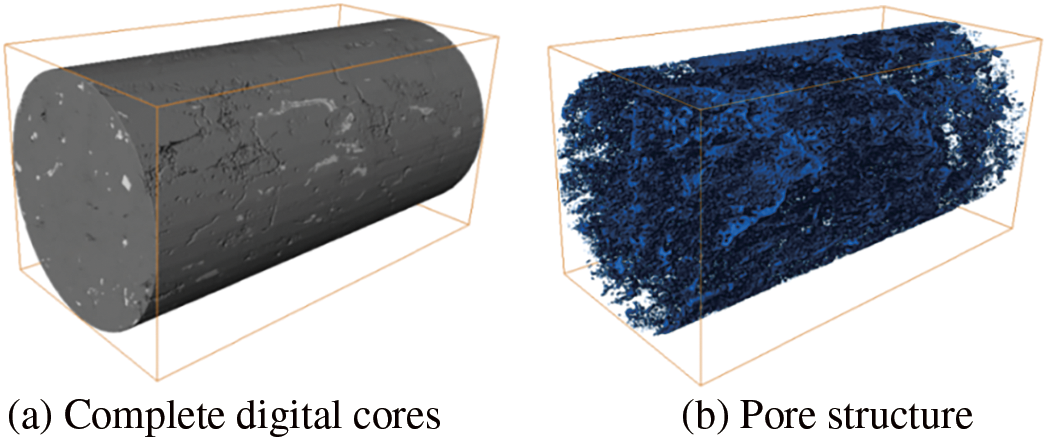
Figure 5: Digital core
Since both the CT scanning test and gas porosity test were non-destructive, the original properties of the rock sample were unchanged [39]. Therefore, the same rock sample can be tested using the gas porosity test after CT scanning. The sample had a measured porosity of 3.72%. The porosity was calculated by dividing the number of pixels with a gray value of 0 in the CT image by the total number of pixels, yielding a value of 3.67%. The possible reasons were: (1) The accuracy of the CT scanner was at the micron scale, which resulted in the pores smaller than the resolution (including nanopores and some of the micron pores) not been identified. (2) During the noise filtering process of the CT images, some of the isolated and closed pores may be removed together with the noise points. Therefore, the porosity of the constructed digital rocks was lower than that of the measured samples. However, these pores were closed, and isolated pores and the percentage of porosity was tiny, which could be ignored.
The pores in the rock are irregular, but the equivalent diameter can characterize the pore size. The equivalent diameter is the diameter of a circle that has the same volume as the pores:
where
Fig. 6 shows the equivalent diameter distribution of pores within sandstone. Since the pore contents of different intervals were not in the same order of magnitude, the logarithmic axis was used to show the number of pores (i.e., vertical axis). It is evident that the pore number decreased with the increase of the equivalent diameter of pores. The number of pores with a diameter smaller than 5 μm exceeded 6 × 10⁴, 32.5% of the total pores. While the content of pores with an equivalent diameter of less than 10 μm reached 73.2%, the pores with an equivalent diameter from 10 to 30 μm had been relatively reduced by more than an order of magnitude. Pores with an equivalent diameter greater than 40 μm comprised less than 1% of the total. Except for nanopores, the pores in tight sandstone were primarily micron-sized, with diameters below 40 μm. Meanwhile, Fig. 6 shows that the little pores were larger than 100 μm.
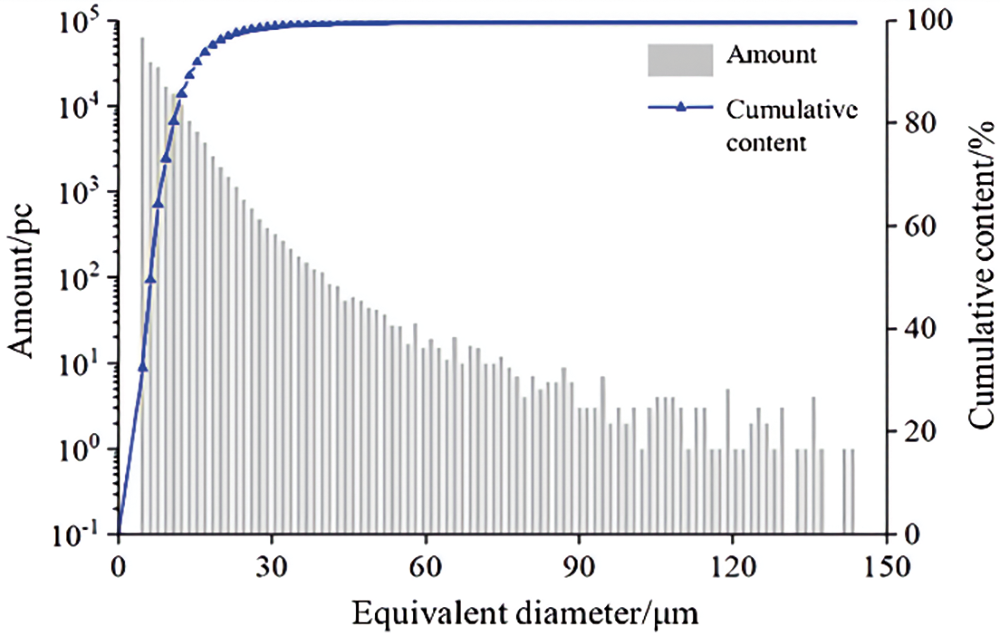
Figure 6: Pore distribution
The volume fraction of pores with various diameters was quantified to discuss the impacts of pore size on rock porosity, as illustrated in Fig. 7. Although the content of pores with an equivalent diameter below 5 μm reached 32.5%, the volume share of these pores remained low. The pore volume peaked around an equivalent diameter of 10 μm. As the equivalent diameter of pores increased from 10 to 50 μm, the pore volume steadily decreased. The cumulative volume share of pores with equivalent diameters less than 40 μm reached 49.8%. And this part was all closed, isolated pores. Using an equivalent diameter of 40 μm as the threshold, the pore structure was divided into micro-pores, large pores, and cracks (Fig. 8). While the large pores and cracks exhibited complex shapes and spatial distributions, the micro-pores with equivalent diameters less than 40 μm were uniformly distributed throughout the rock.
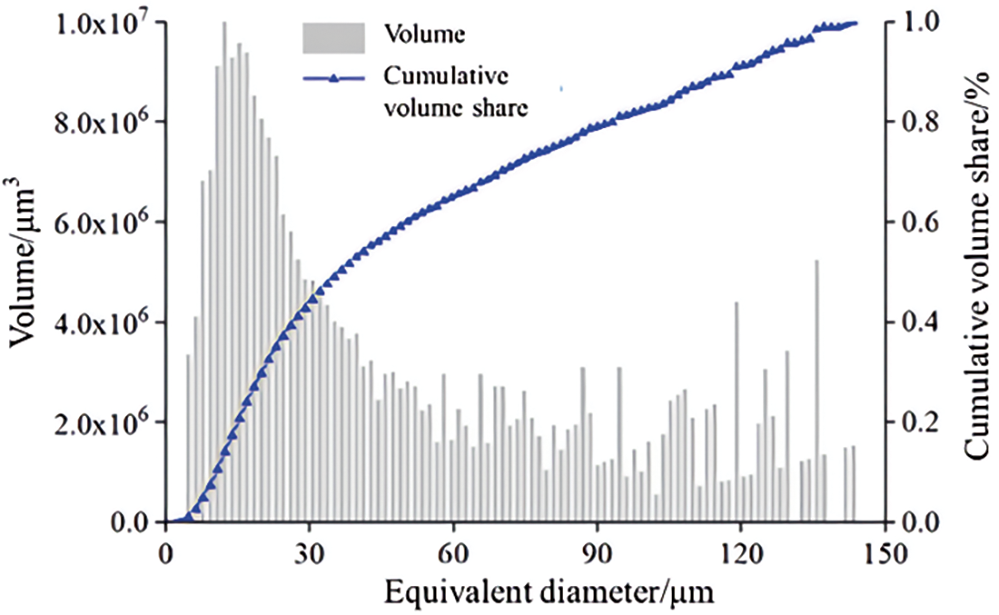
Figure 7: Volume proportion of pores with different diameters
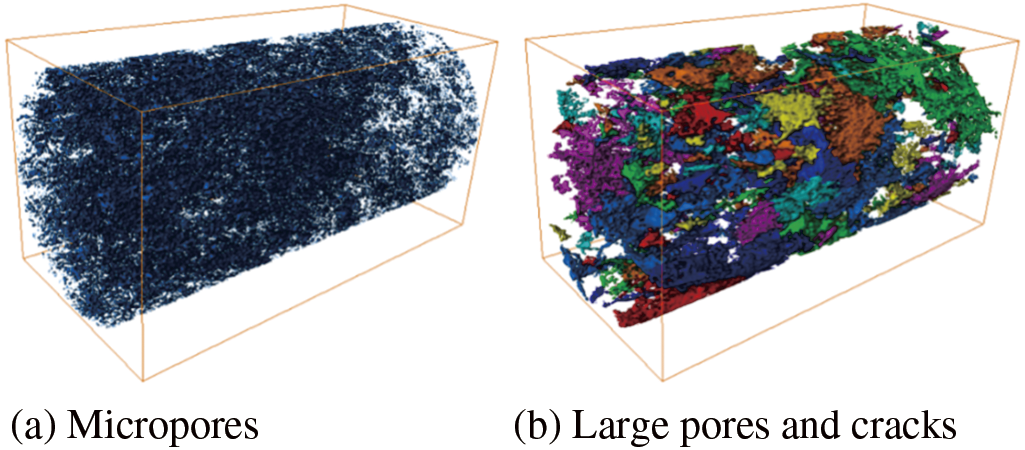
Figure 8: Pore structure decomposition
3.2 Fluid-Solid Coupling Model
The pore distribution in tight sandstone indicates that pores with an equivalent diameter smaller than 40 μm constitute 49.8% of the volume fraction, accounting for 99.3% of all pores. These micro-pores are uniformly distributed throughout the sandstone. In this study, pores with an equivalent diameter smaller than 40 μm, along with any undetected pores, are considered part of the rock matrix (i.e., the matrix phase). Essentially, this matrix phase represents a porous medium that facilitates fluid seepage. The larger pores and cracks are categorized as the pore phase. After modification, the model simplifies more than 99% of the micro-pores in tight sandstone while also considering the undetected pores. Fluid can flow between the matrix and pore phases; however, the flow dynamics within these two phases differ, as illustrated in Fig. 9. Therefore, a constitutive model is necessary to capture the coupling behavior in tight sandstone accurately.
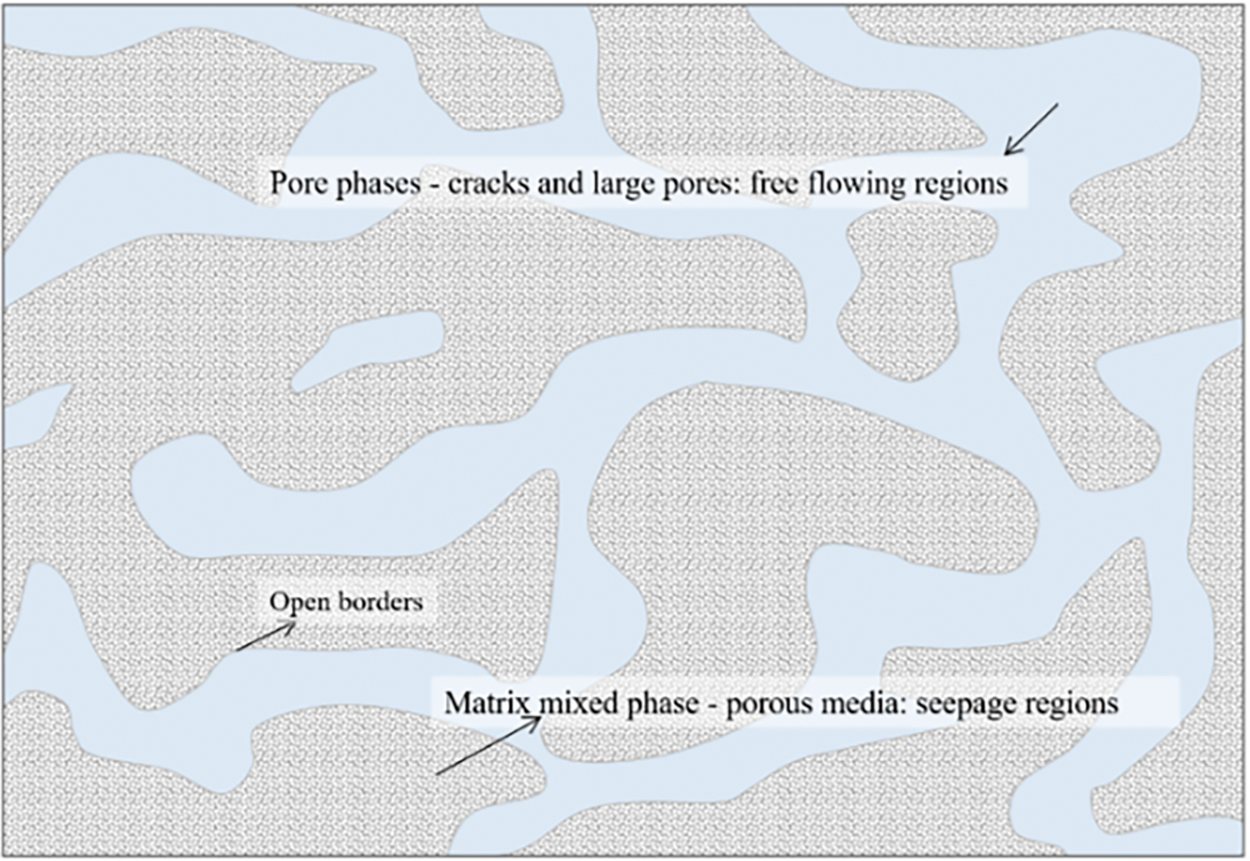
Figure 9: Fluid flow model in rock
Based on the coupled free flow-seepage model, the seepage characteristic was defined in this study as [40]:
where
The parameter K is the Darcy-like permeability, which is a function of
where
The matrix phase with rock matrix and pores is expressed by 0 <
A flow-solid coupling model based on continuous damage theory described the interaction between the stress field and the flow field in tight sandstone [41,42]. Drawing on Hooke’s law and the deformation coordination equation, the deformation governing equation can be expressed as:
where
The Biot coefficient is a key parameter that describe the compressibility of rock under fluid action, primarily used in fluid-structure coupling models. It represents the ratio of the rock’s volumetric strain (volume change due to pressure variation) to the fluid’s volumetric strain. The Biot coefficient can be expressed as:
where
The seepage control equation was defined as [43]:
where
The representative elementary volume (REV) unit with a size of 210 × 210 × 210 voxels was used to build the finite model to represent the physical and mechanical samples. As mentioned above, the pore structure of tight sandstone was classified as pore phase and matrix phase with a threshold of 40 μm equivalent diameter. Specifically, the macropores and cracks with an equivalent diameter greater than 40 μm were considered the pore phase. The micropores with an equivalent diameter smaller than 40 μm that along with the rock matrix were considered as the matrix phase. Fig. 10 shows the construction process of the micro-finite element model. The proposed free-flow and fluid-solid coupling models expressed the seepage and mechanical behaviors.
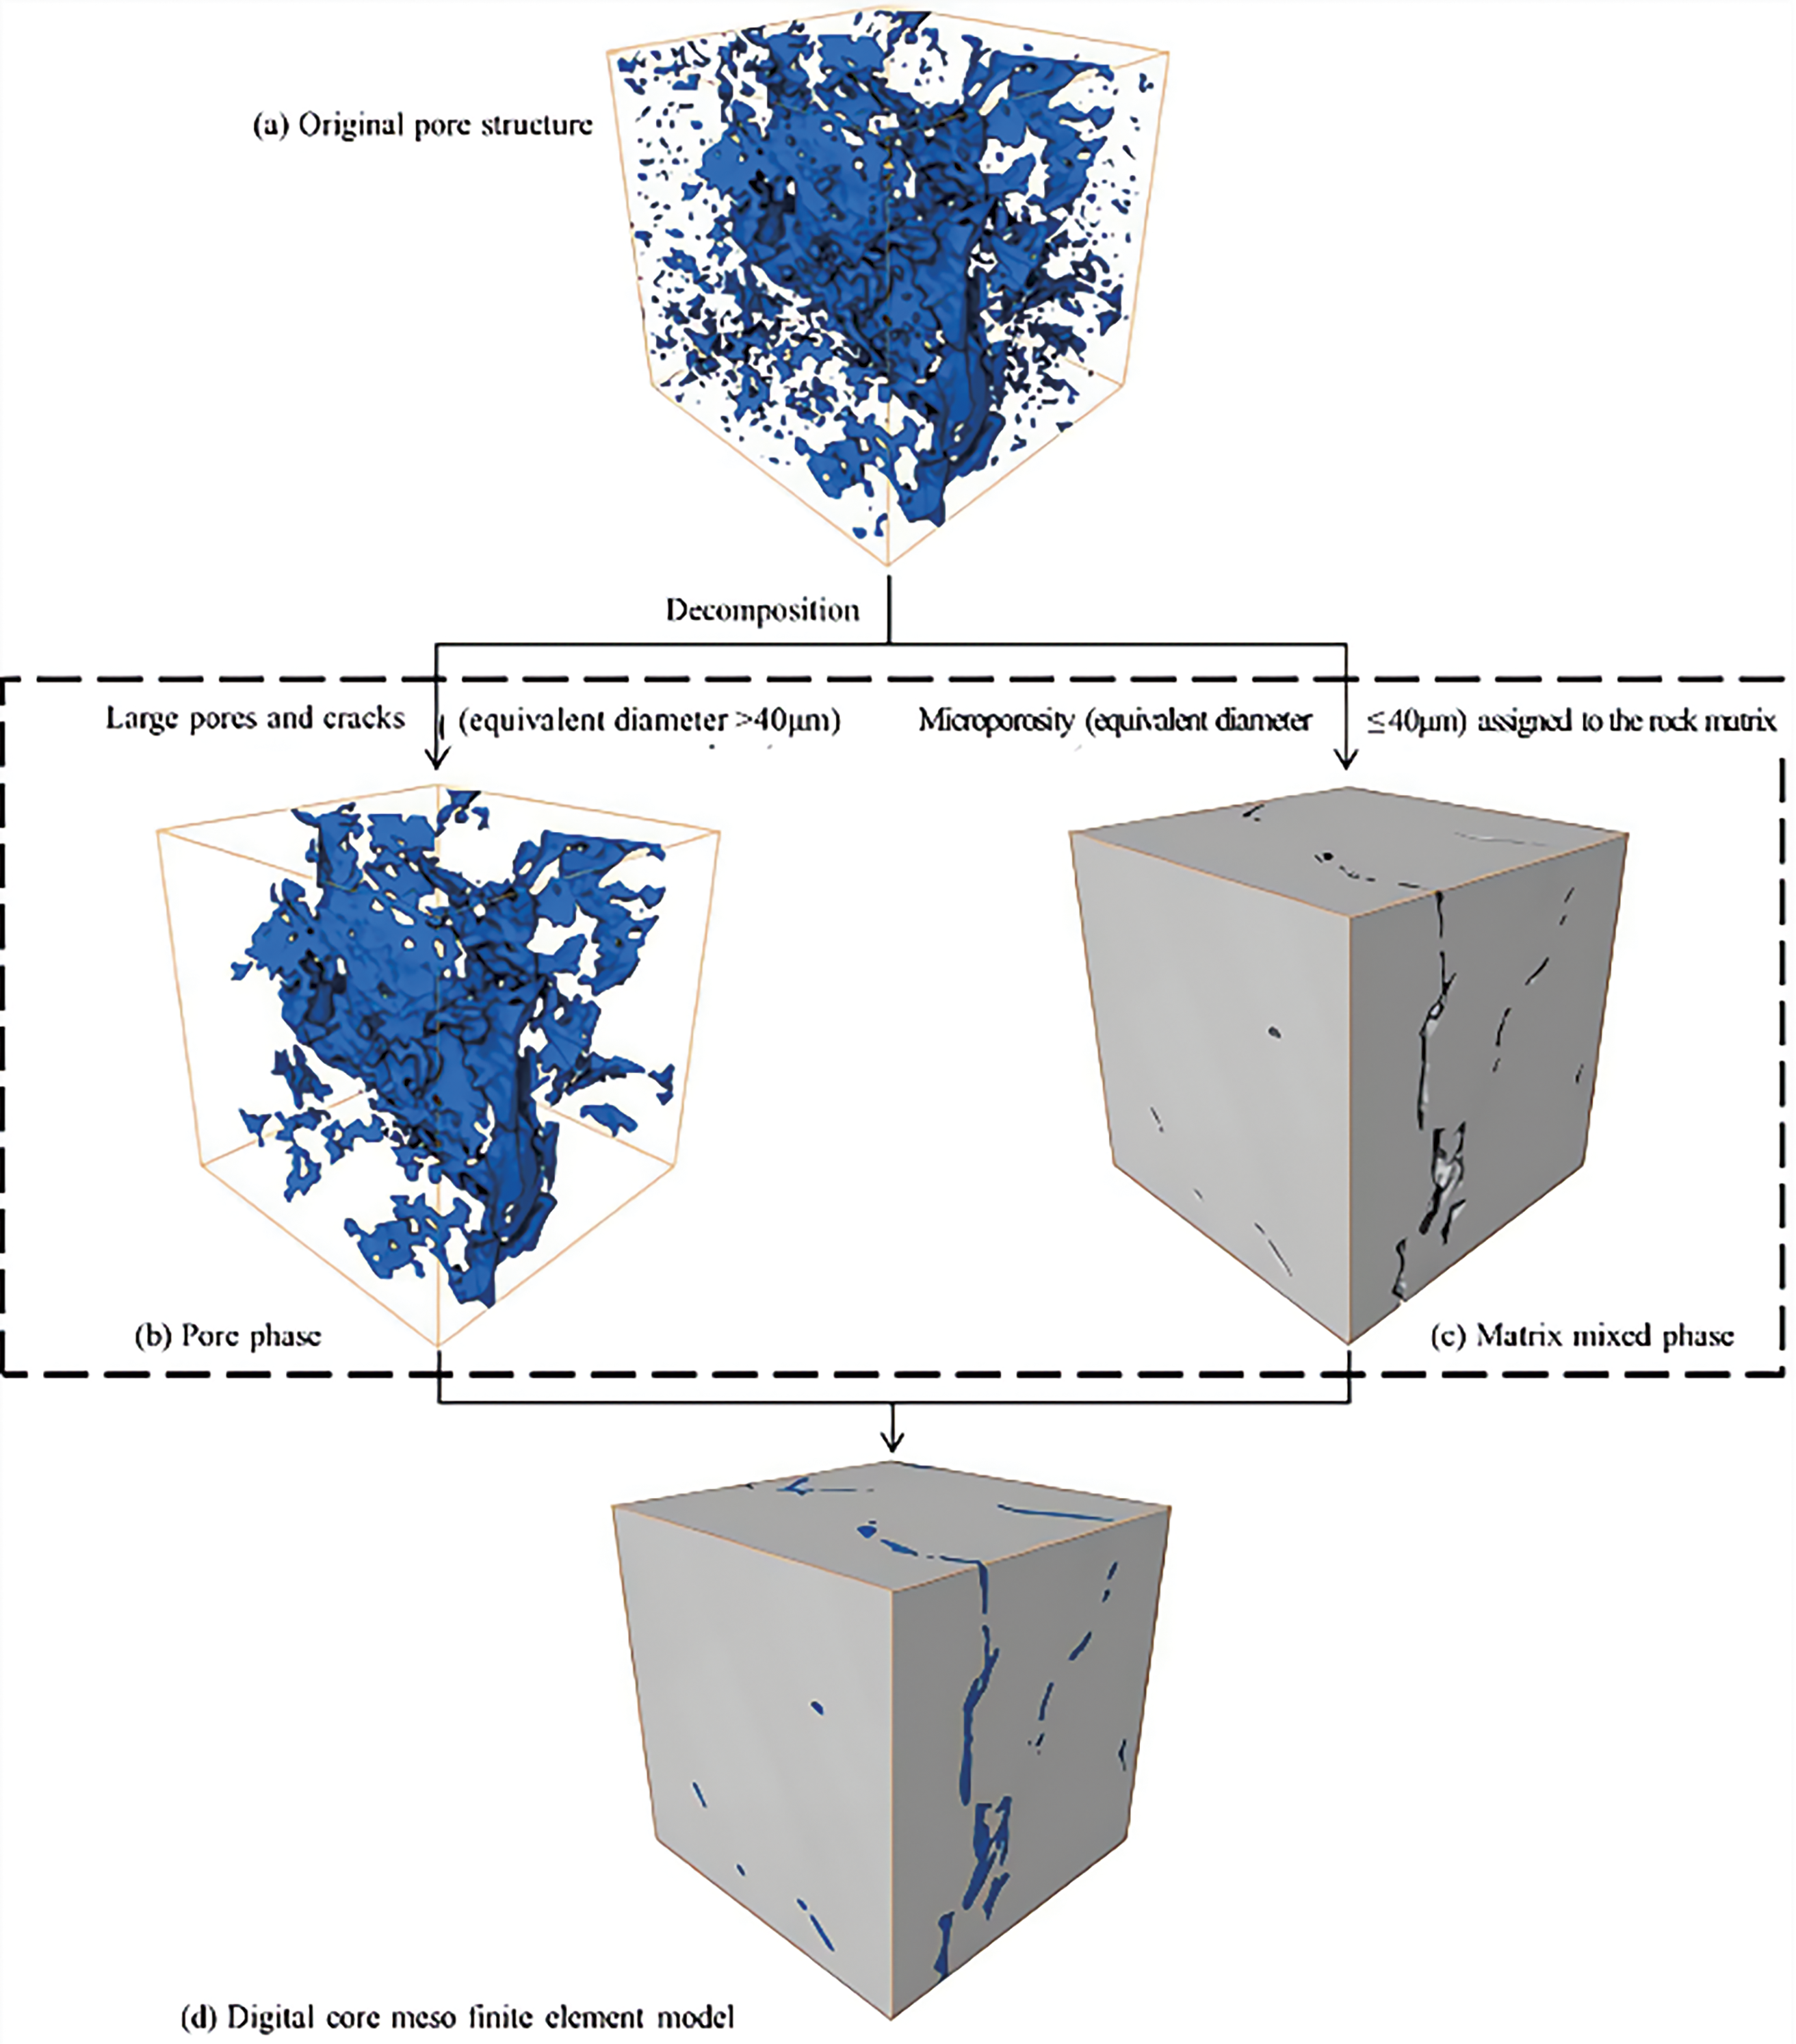
Figure 10: Establishment process of digital core micro finite element model
The boundary conditions were set as Fig. 11 to investigate the effect of confining pressure and seepage pressure on the seepage characteristics of tight sandstone under fluid-solid coupling. The rock sample was enclosed by slipping impermeable walls, and a confining pressure of 10 MPa was applied to the walls. The top and bottom surfaces of the rock sample served as the fluid inlet and outlet. The outlet pressure was set to an atmospheric level. Water was used as fluid in this model. Table 3 shows the parameters of the finite element model. It should be noted that the porosity of the matrix phase does not represent the porosity of the entire rock, but rather the difference between the measured porosity of the rock and the volume fraction of the pore phase. In other words, the total porosity of the rock is the combination of the detected and undetected pore porosity.
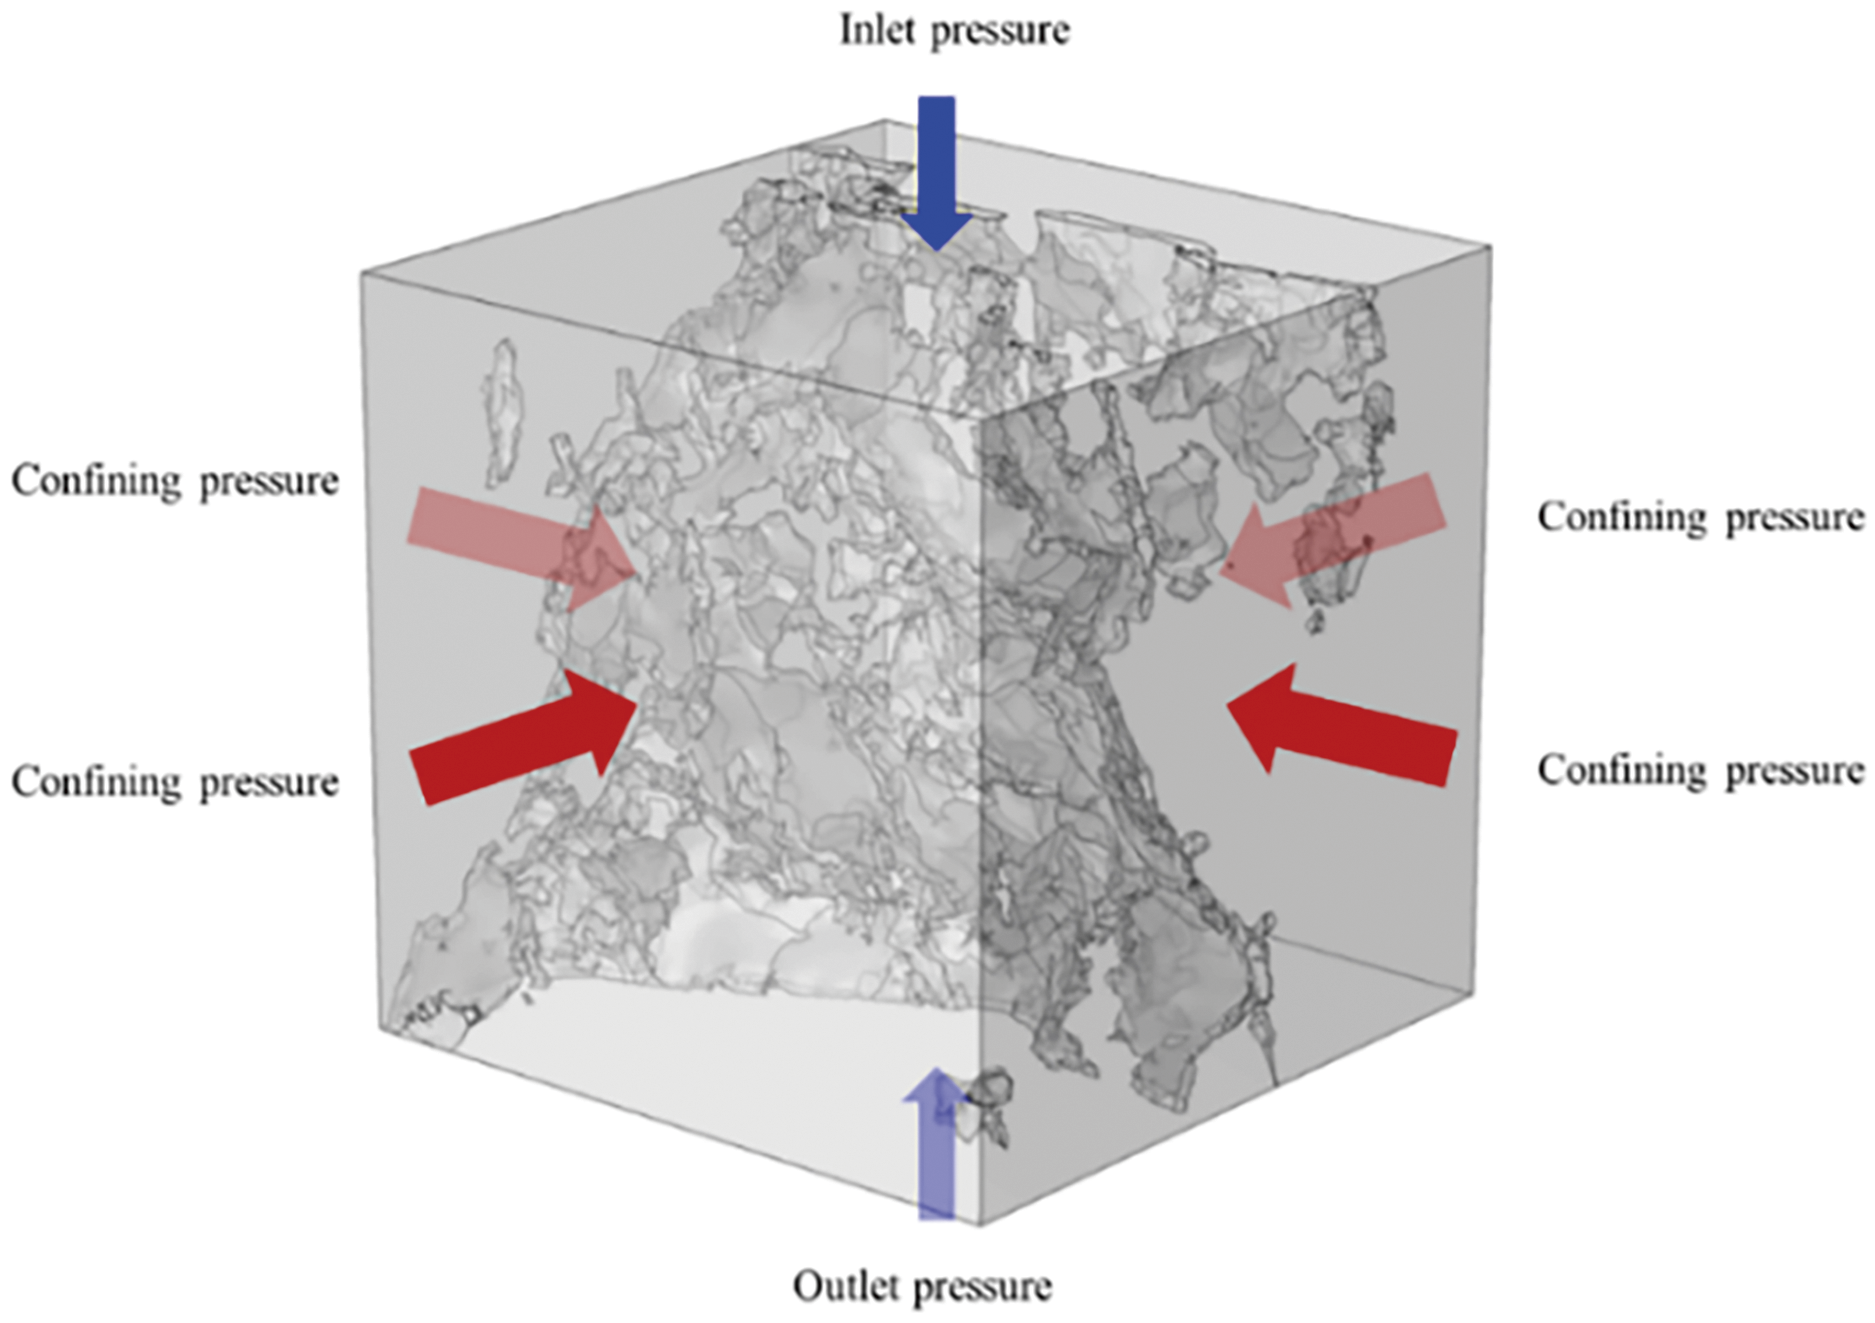
Figure 11: Schematic diagram of boundary conditions
4.1 The Effect of Confining Pressure on Seepage Characteristics
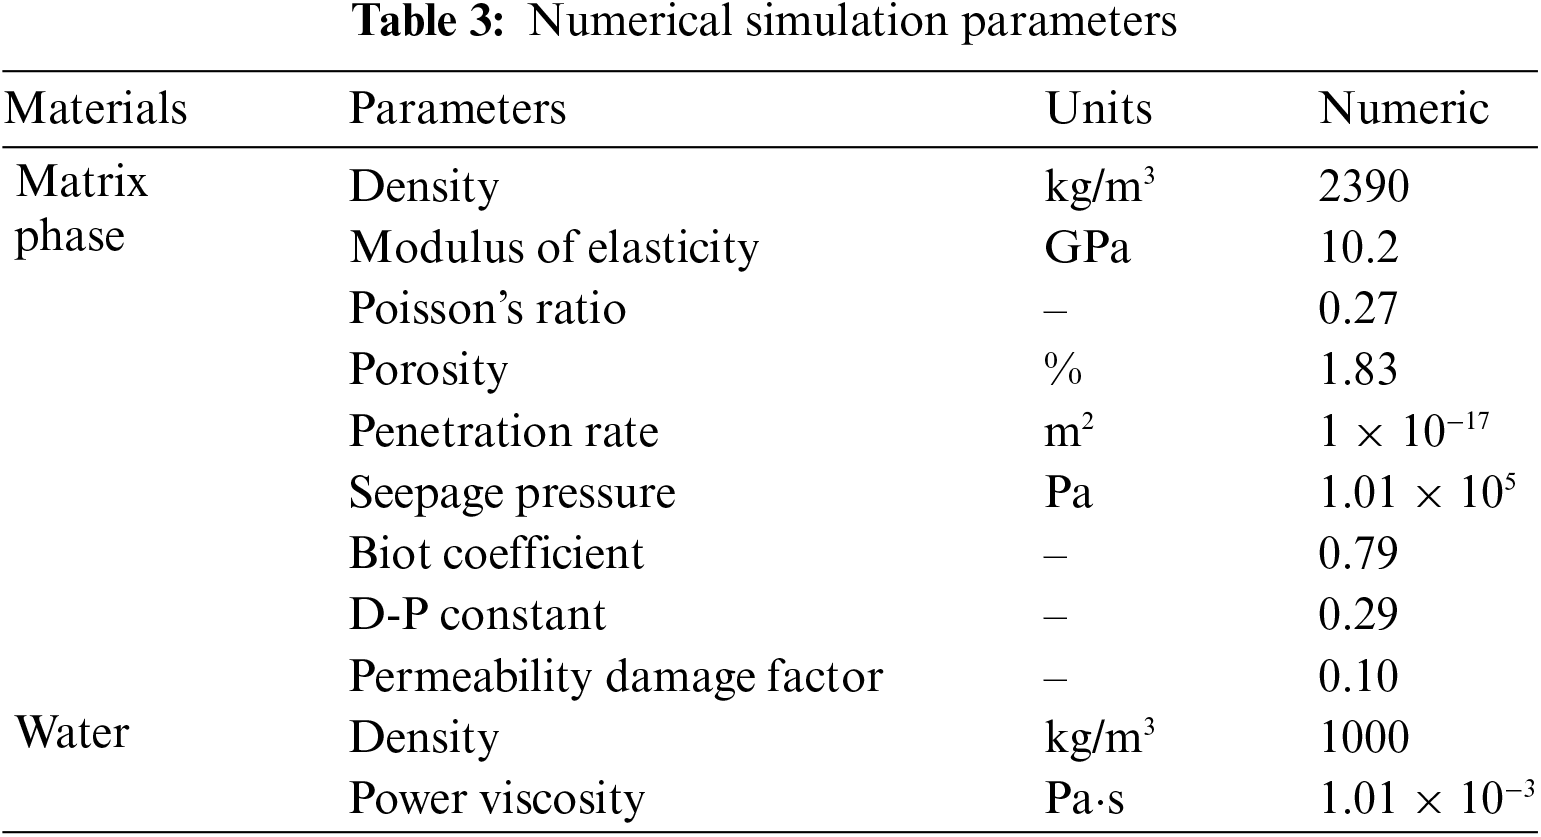
To study the effect of confining pressure on the flow characteristics, the inlet pressure is set to 1 MPa, and the outlet pressure is defined as atmospheric pressure. The confining pressures were then set at 5, 10, 15, 20, 25, 30, 35, and 40 MPa, respectively. The Von Mises stress distribution of the rock cross-section, including cracks and pores, under confining pressures of 10, 20, 30, and 40 MPa is shown in Fig. 12. As the confining pressure increased, the stress level of the sandstone also rose. The stress of the matrix phase was approximately 5 MPa under a confining pressure of 10 MPa. When the confining pressure increased to 40 MPa, the stress of the matrix phase rose to 18 MPa. There was more stress concentration at the junction of the pore phase and matrix phase (including micropores) than in the pure matrix region.
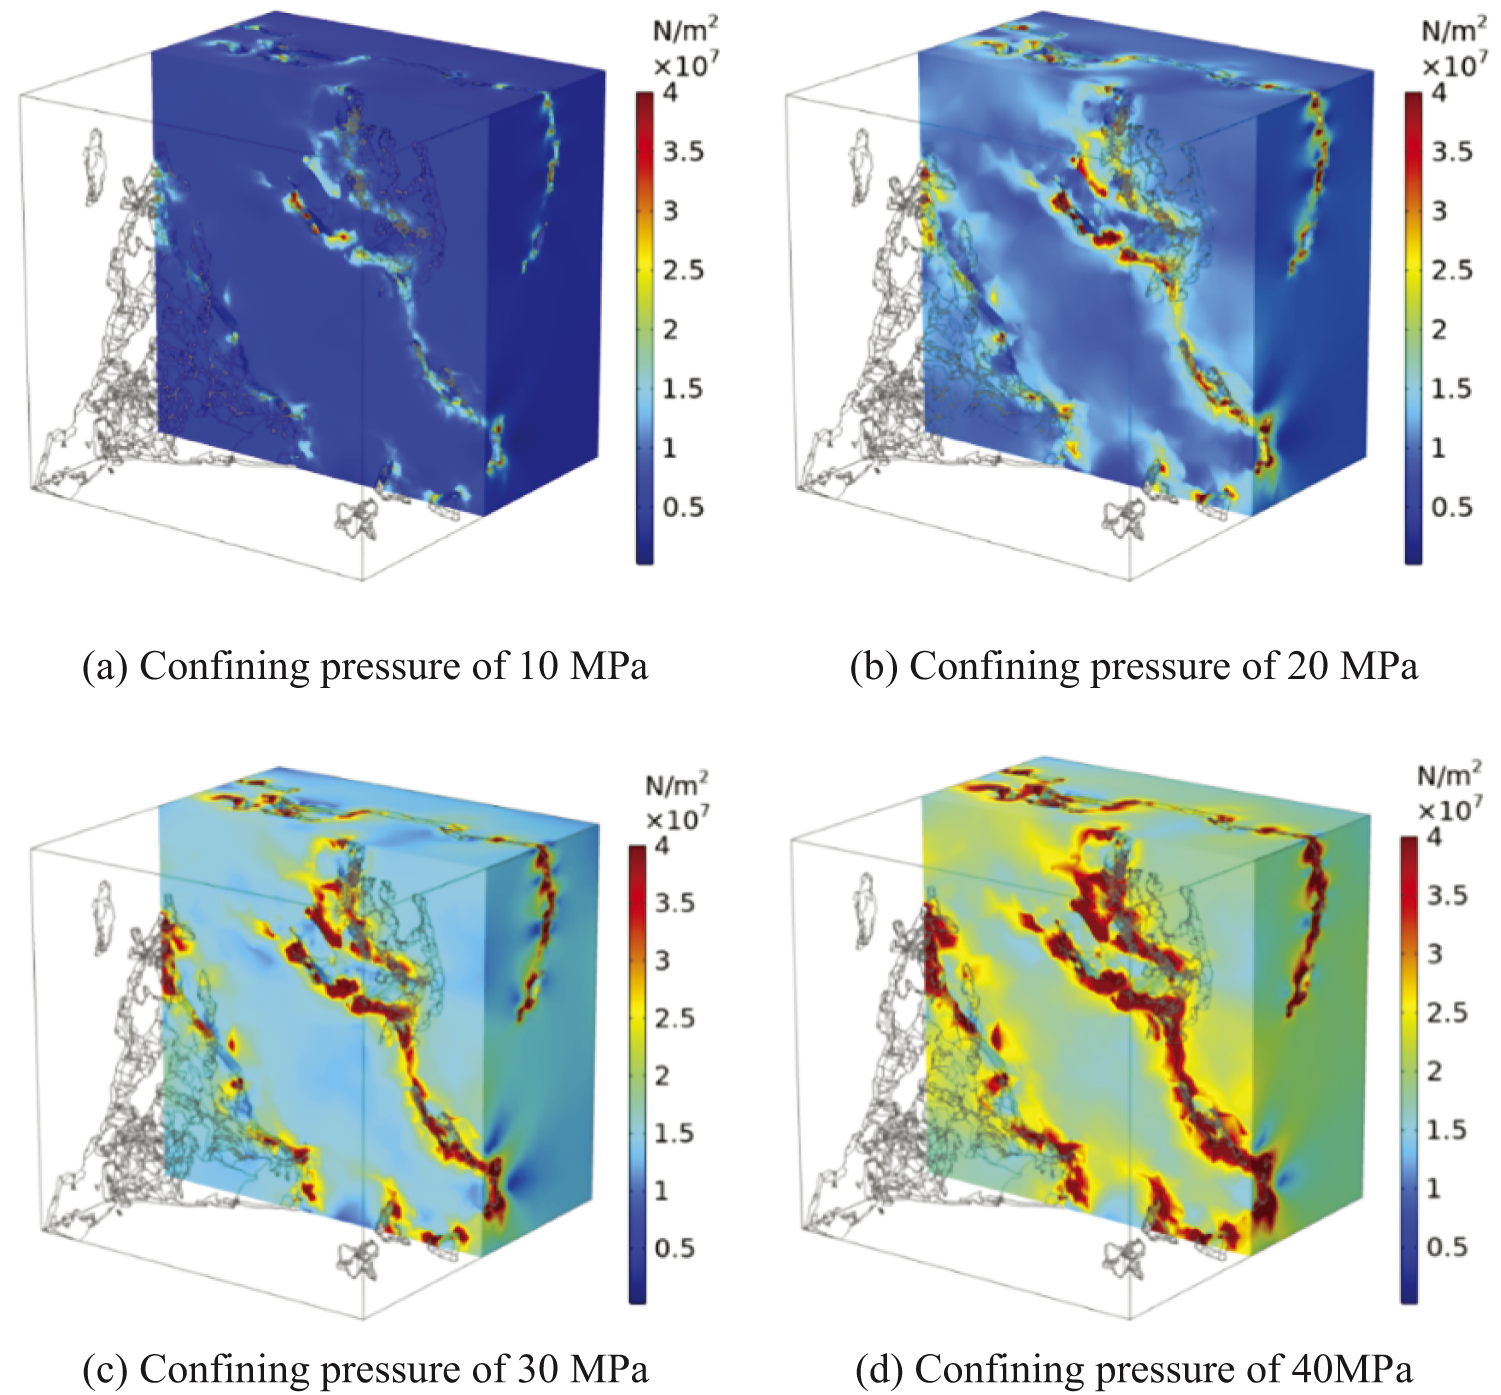
Figure 12: Von Mises stress distribution
Fig. 13 illustrates the fluid flow velocities of tight sandstone at varying confining pressures. Under constant confining pressure, the crack and pore wall had high flow velocity, especially in the regions between cracks or pores. As the confining pressure increased, the overall fluid flow velocity showed a decreasing trend. However, there was a little reduction in the matrix region due to the low initial flow velocity. Notably, with the increase of the confining pressure, a small part of the region had improved flow velocity, resulted from the large damage in this region. In this area, the effect of damage on permeability was more significant than the impact of rock compression, resulting in an increase in local permeability. Although the cracks and large pores tended to close under high confining pressure, the pore phase followed free flow. Thus, the fluid flow velocity in the pore phase changed slightly with the confining pressure increase. Table 4 shows the rock’s permeability, average flow velocity, and mass flow under different confining pressures. As the confining pressure increased, the sandstone’s porosity, permeability, and fluid flow velocity all decreased. Obviously, the generation of damage resulted in only a slight increase in overall permeability. In other words, the effect of rock compression caused by confining pressure on permeability was greater than that of damage.
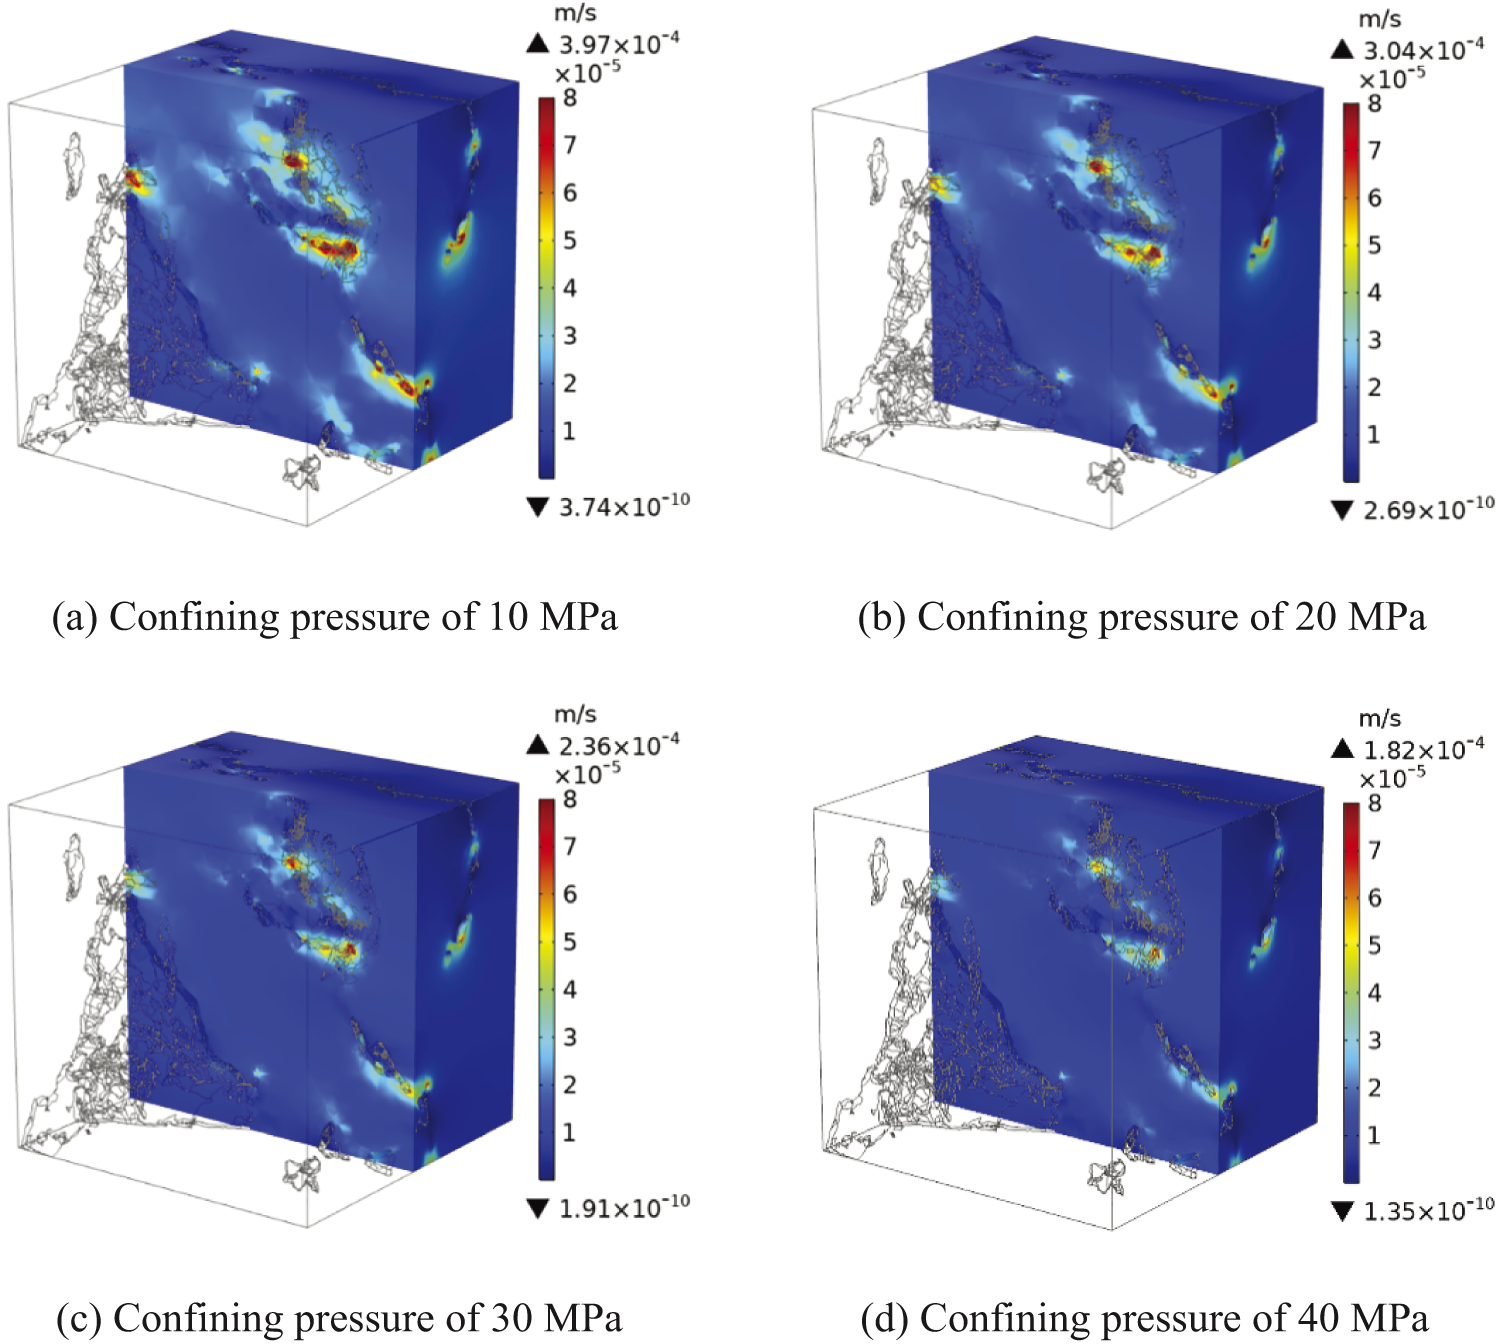
Figure 13: Flow velocity of the matrix phase
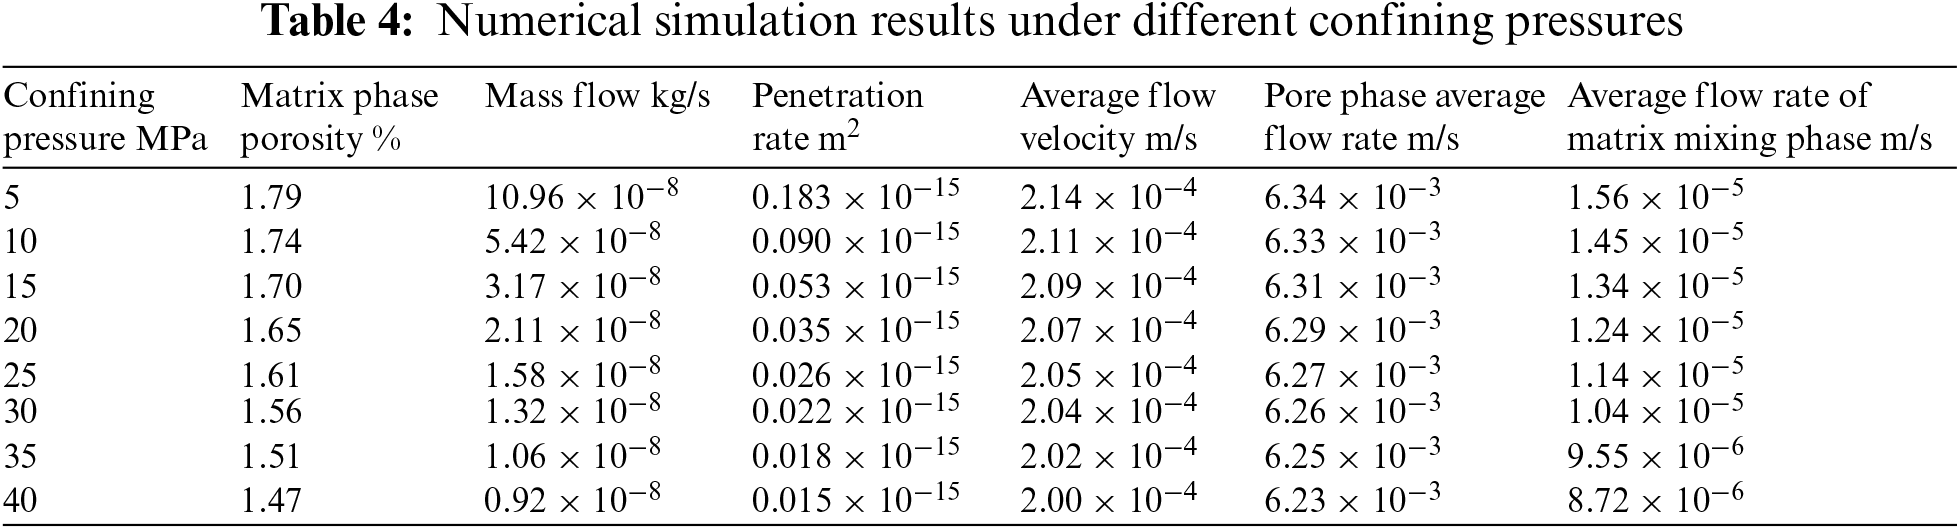
Fig. 14 shows the mass flow of rock at various confining pressures. The mass flow of the pore phase was notably greater than that of the matrix phase. The mass flow of the pore and matrix phases was not the same magnitude under the confining pressure (5 MPa). The mass flow decreased with the increase of confining pressure. When the confining pressure increases from 10 to 40 MPa, porosity decreases by 17.9%, and the average flow rate of the rock declines by 7%. However, in regions with significant damage, there was a localized increase in permeability. Therefore, the pore phase was the dominant channel of seepage. The permeability in the pore phase was more responsive to changes in external pressure than that in the matrix phase. Under low confining pressure, the crack and large pore closed immediately, resulted in a steep drop in rock permeability. Together with the closed cracks and pores, the rock matrix also had limited pressure deformation under high confining pressure. As a result, the permeability tended to be stable once the confining pressure reached 20 MPa.
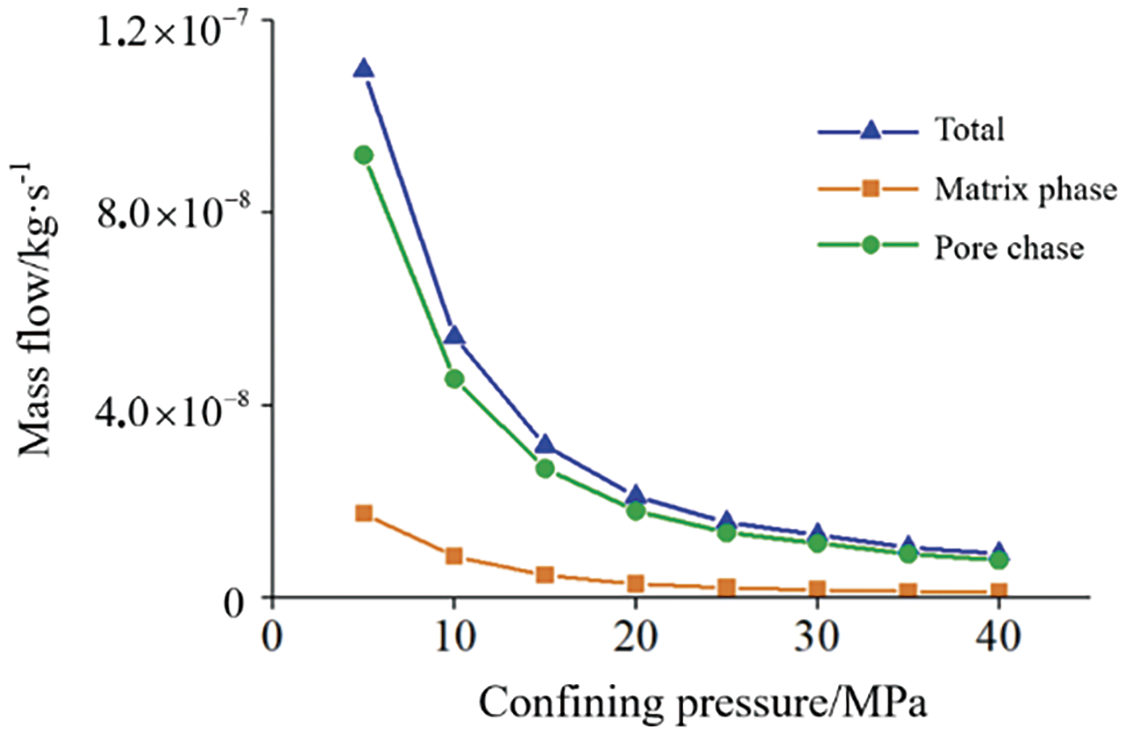
Figure 14: Relationship curve between mass flow and confining pressure
Fig. 15 presents the permeability of the model at various confining pressures. As shown in the fitting curves by the Levenberg-Marquardt least squares algorithm, the relationship between permeability and confining pressure followed the first-order exponential function with decreasing trend (R2 > 0.99). The permeability decreased by 91.8% as the confining pressure was rosed from 10 to 40 MPa. The simulation results aligned well with the permeability test results. The relationship between permeability loss (the ratio of permeability reduction to initial permeability) and confining pressure of the model was shown in Fig. 16. The permeability loss of tight sandstone increased with the confining pressure, which was also consistent with the seepage behaviors observed in the four groups of rock samples tested. The results show the reliability of the finite element model and the fluid-solid coupling model of the digital core in this study.
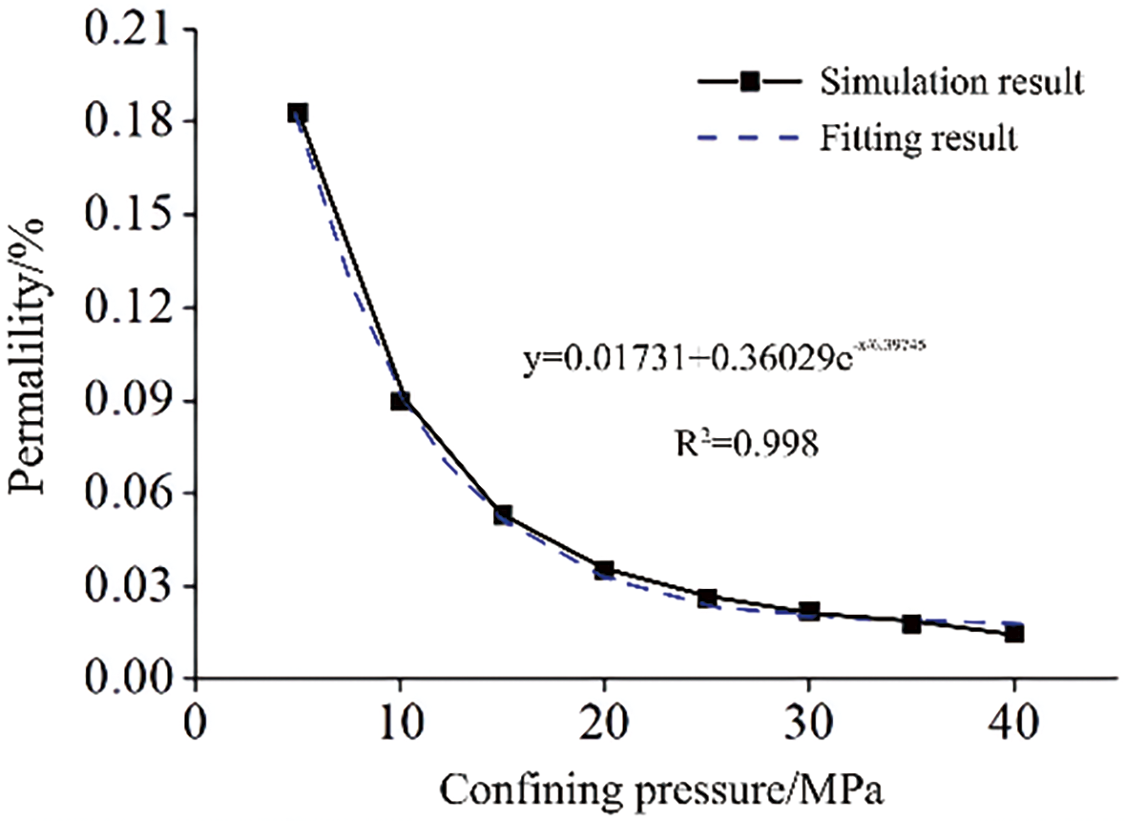
Figure 15: Relation curve between permeability and confining pressure
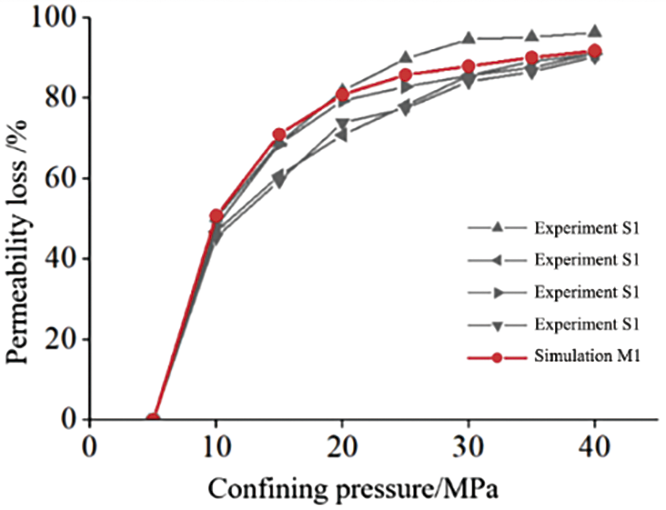
Figure 16: Comparison between experimental and numerical simulation results
4.2 The Effect of Seepage Pressure on Seepage Characteristics
While the outlet pressure was maintained at atmospheric pressure, seven inlet pressures (i.e., 1, 10, 20, 30, 40, 50, and 60 MPa) were used to study the effect of seepage pressure on seepage characteristics. Seepage pressure is regarded as the difference between the inlet and outlet pressure. Since the outlet pressure is atmospheric pressure, the seepage pressure is equivalent to the inlet pressure. Fig. 17 illustrates the Von Mises stress distribution within tight sandstone under a confining pressure of 20 MPa with different inlet pressures (i.e., 10, 20, 30, and 40 MPa). Clearly, there was a uniform stress distribution under low seepage pressure. When the inlet pressure reached 10 MPa, the stress in the matrix phase was approximately 10 MPa. The stress within the sandstone increased with increasing seepage pressure, exceeding 25 MPa when the inlet pressure reached 40 MPa. Meanwhile, the stress decreased gradually with distance from the bottom of the model. Although the inlet fluid pressure gradually increased, the stress at the model’s bottom changed little due to the constant outlet pressure. Additionally, stress is concentrated at the junction of the pore phase and matrix phase, as stated Section 4.1. While the fluid pressure had little impact on the stress in the concentration region, the stress level remained relatively unchanged (above 30 MPa).
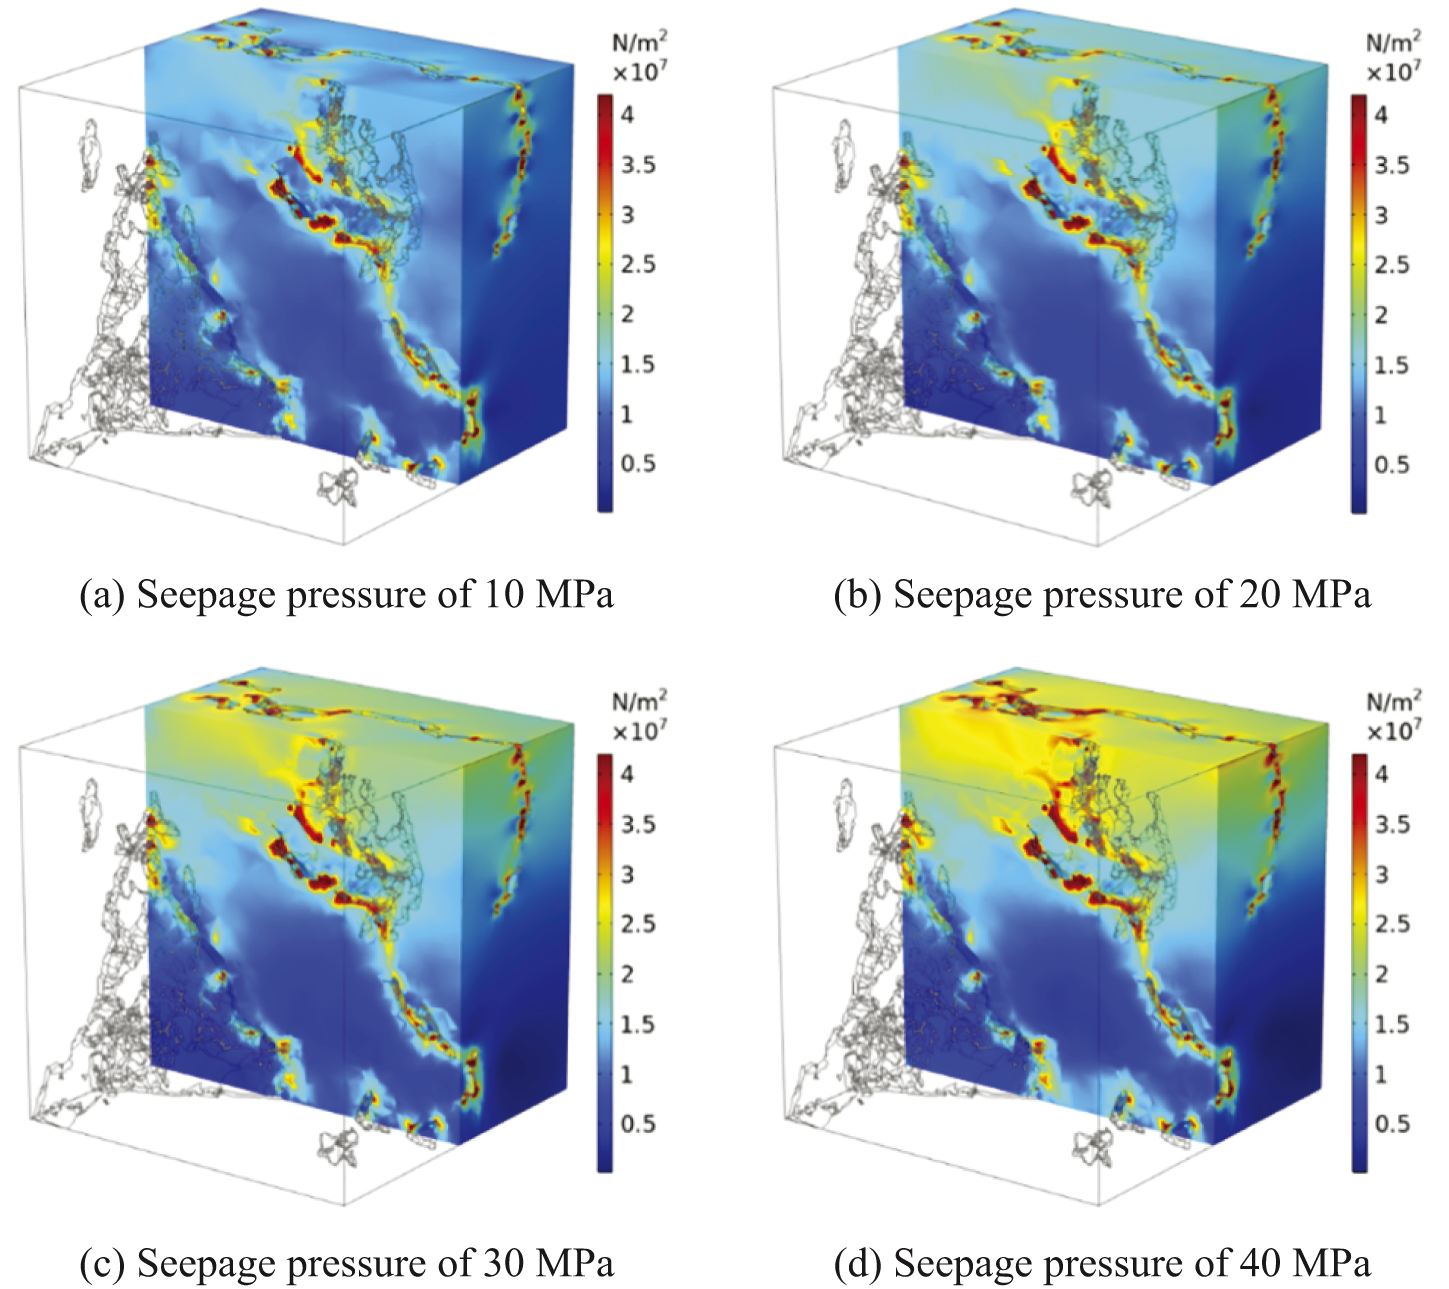
Figure 17: Von Mises stress distribution
Fig. 18 shows the distribution of fluid flow velocity in the matrix phase at different inlet pressures. When inlet pressure was 10 MPa, the maximum fluid flow velocity (i.e., 3.41 × 10⁻³ m/s) occurred in the region with a high-pressure gradient, which close to pore phase. The flow velocity inside the matrix phase was around 2 × 10⁻⁴ m/s. As the seepage pressure increases, the high flow rate region gradually expanded to the matrix phase. Therefore, the flow velocity inside the matrix phase was also improved. The maximum flow velocity reached 1.56 × 10⁻² m/s under the inlet pressure of 40 MPa. And the flow velocity inside the matrix phase was above 5 × 10⁻⁴ m/s. As seepage pressure increased, the overall fluid flow velocity within the sandstone also rose, especially near the pore phase. This observation reinforces the earlier conclusion that fluid flow velocity is positively correlated with the pressure gradient.
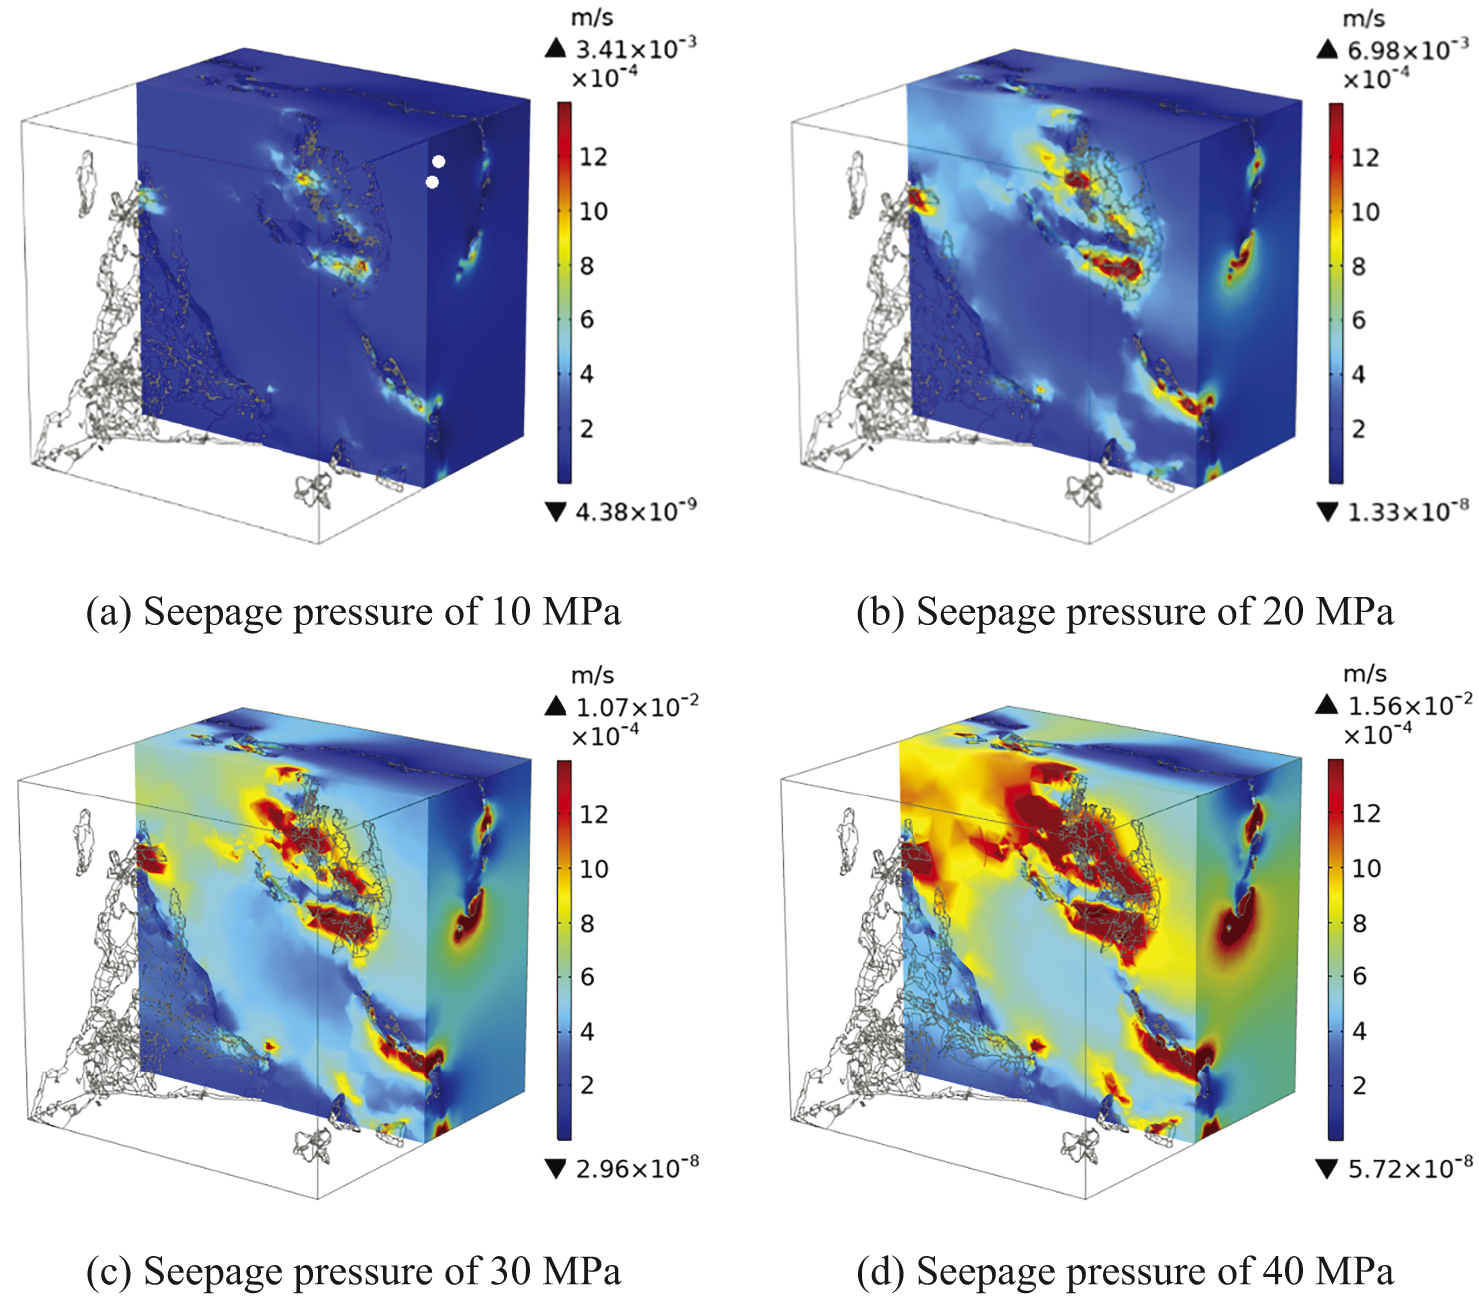
Figure 18: Flow velocity of the matrix phase
The damage and elastic modulus distribution in sandstone at 40 and 50 MPa inlet pressure (i.e., seepage pressure) were shown in Figs. 19 and 20, respectively. The damage was defined by the amount of elements with irreversible deformation divided by the total amount of elements. It can be seen that the damage began to generate at the entrance of the fluid under high seepage pressure, which corresponded to the high-stress region in Fig. 17. With the increase of seepage pressure, the damage propagated along the pore phase wall. The damage penetrated and fully developed at the model’s top under the seepage pressure of 50 MPa, but only existed in the region with high stress. Therefore, the elastic modulus of the sandstone had a significant decrease. The damaged area experienced a 41.1% reduction in elastic modulus. The elastic modulus of the stress concentration region in the pore phase wall and rock top dropped below 8 and 6 GPa, respectively.
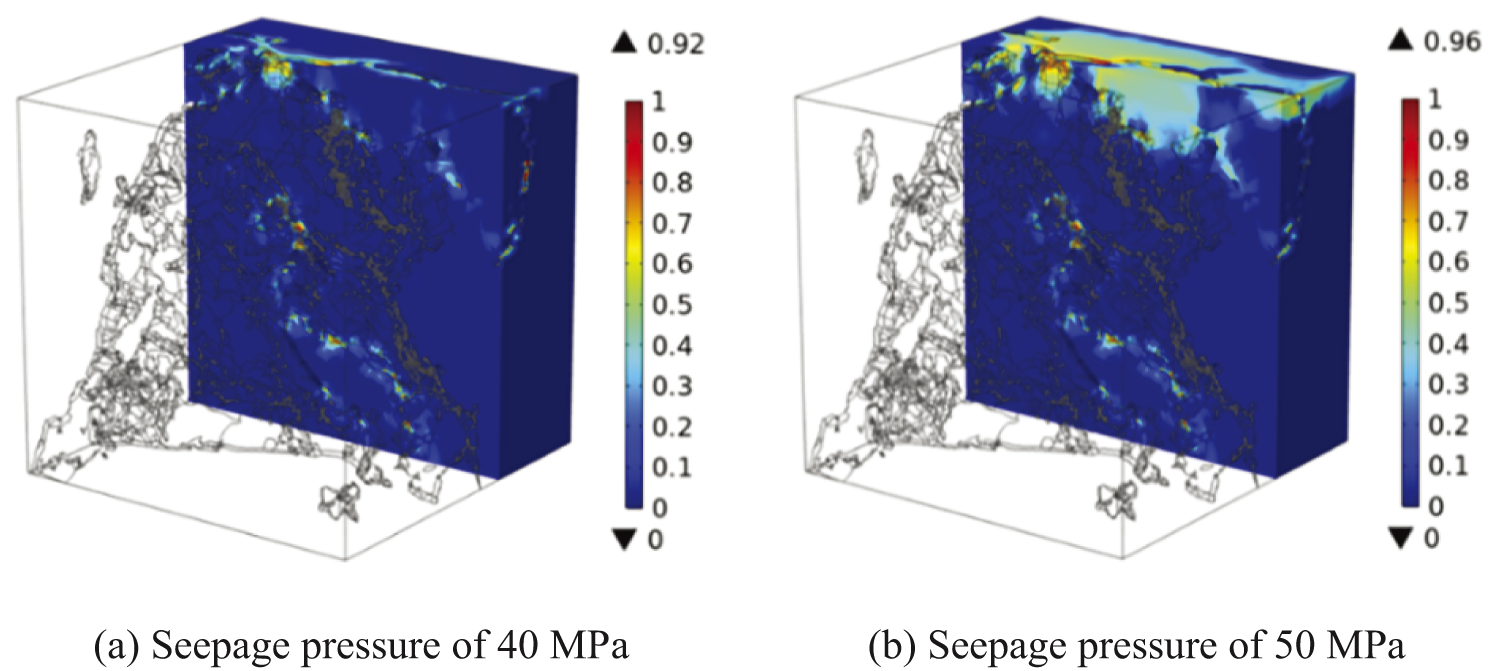
Figure 19: Damage distribution
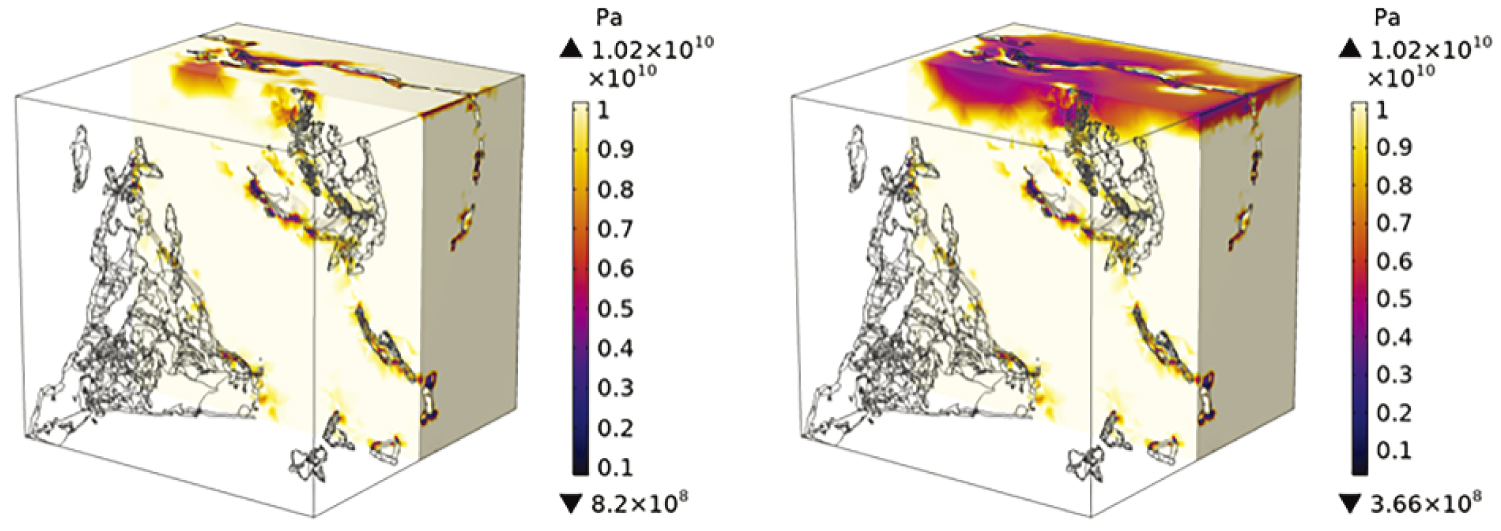
Figure 20: Elastic modulus distribution
Fig. 21 illustrates the correlation between elastic modulus and seepage pressure. There was almost no change in the elastic modulus when the seepage pressure was below 20 MPa. However, the elastic modulus decreased when the seepage pressure exceeded 30 MPa, with the decrease rate increased. As the seepage pressure reached 60 MPa, the elastic modulus of the sandstone decreased to 9.5 GPa. Apparently, the improved seepage pressure caused increased damage under fluid-solid coupling, which resulted in a decrease in the elastic modulus.
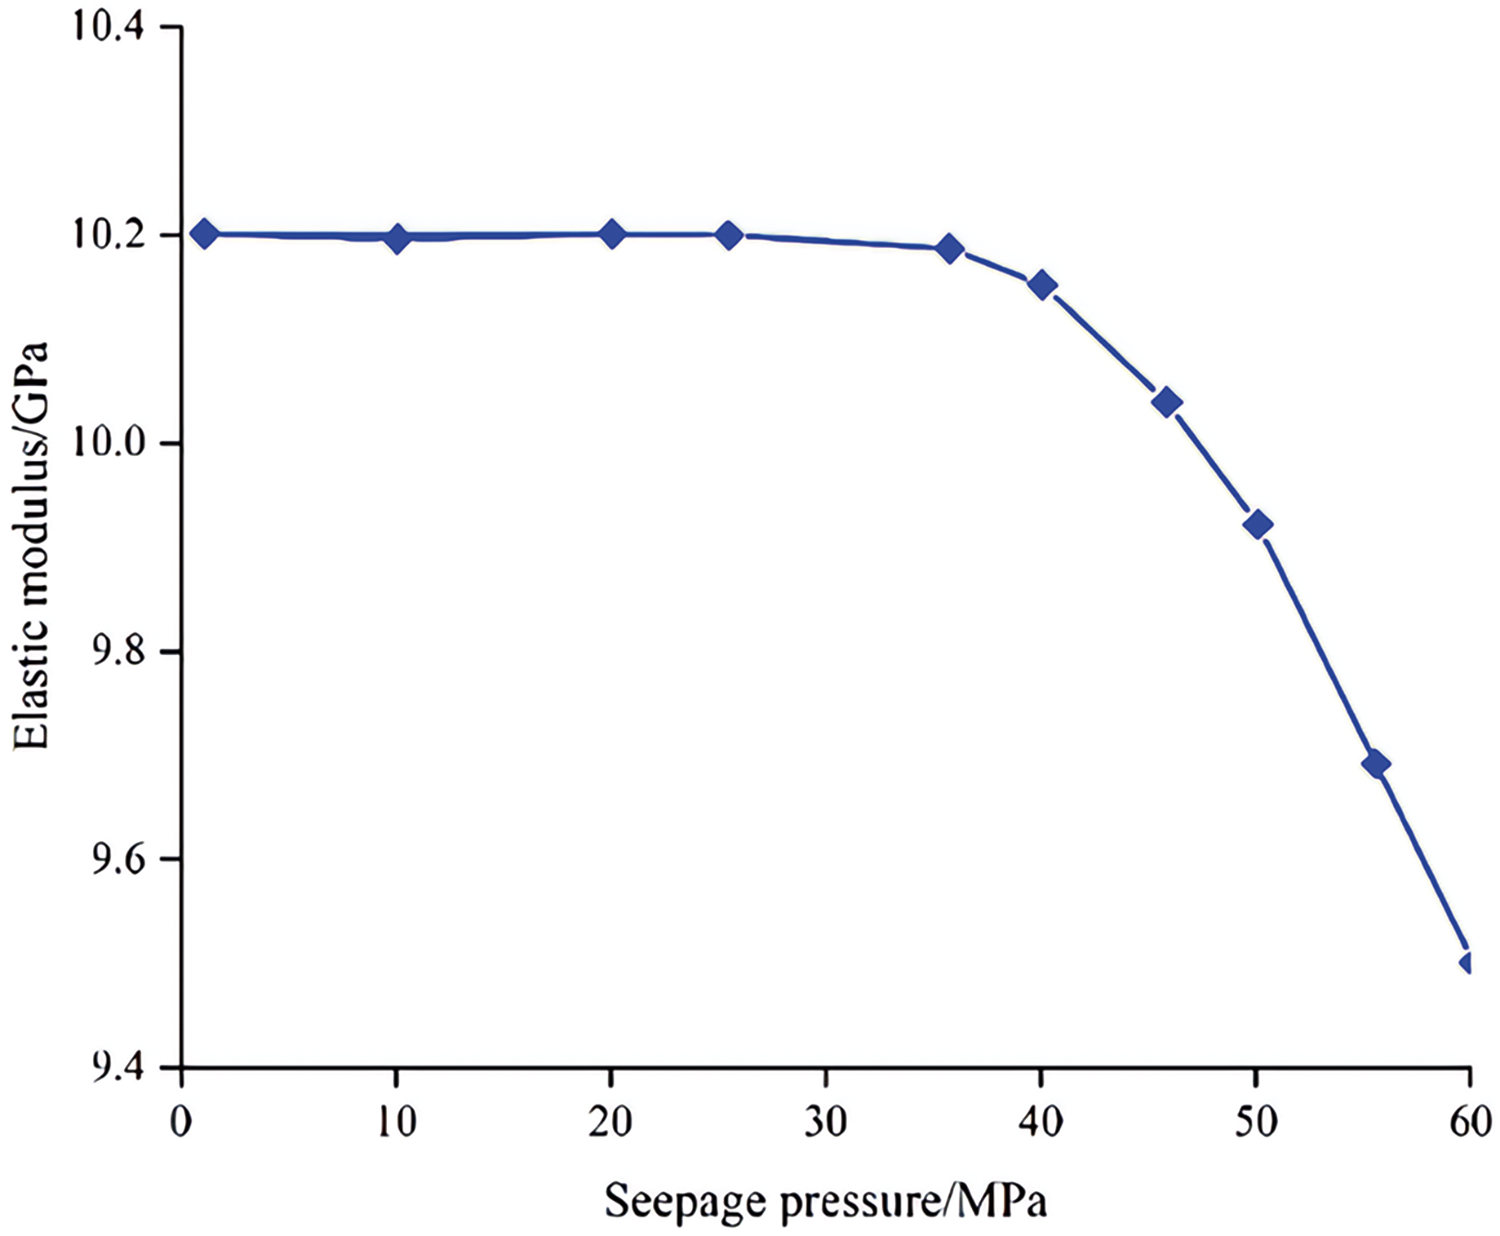
Figure 21: The elastic modulus of rock under different seepage pressure
Fig. 22 shows the rock permeability under different seepage pressure. It demonstrates a gentle increase in rock permeability when the seepage pressure is below 30 MPa. Obviously, the rock permeability had little change during this stage. The seepage behavior followed linear Darcy flow. However, the permeability increased by 18.6% when the seepage pressure exceeded 30 MPa. The increase could be attributed to the generation and propagation of the rock damage. As the seepage pressure increased, the damage propagated to the surrounding regions, significantly increasing permeability.
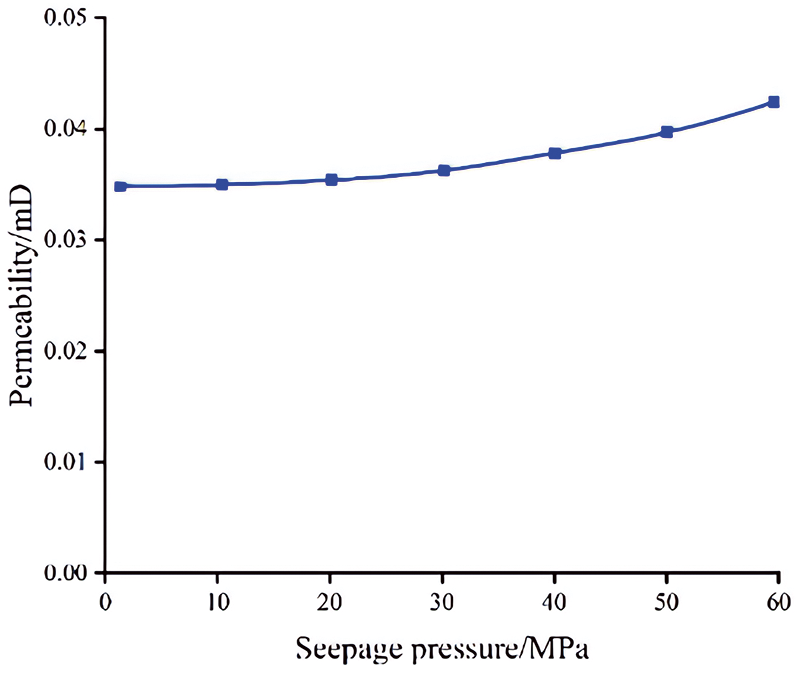
Figure 22: The permeability of rock under different seepage pressure
It is worth noting that the constitutive equation and simulation in this paper simplify the flow as a single-phase flow, whereas the actual reservoir production process involves multiphase flow. Research on the fluid-solid coupling effects of rock in tight reservoirs at the micro level are scarce, and reports based on real pore structures are even rarer. Rock in tight reservoirs typically exhibits low porosity, low permeability, and a complex pore structure. However, the seepage characteristics and the interaction between the seepage field and stress field have not been fully elucidated. Therefore, this represents a critical area for future research on multiphase flow’s downstream solid-state coupling effects at the microscopic scale.
This study proposed a fluid-solid coupling model to explore the micro-scale seepage characteristics of tight sandstone. Triaxial compression and permeability tests were performed to determine the mechanical and seepage characteristics. A digital core was built from CT scanning results and was divided into matrix and pore phases based on a 40 μm threshold for pore equivalent diameter. The effects of confining pressure and seepage pressure on seepage characteristics under fluid-solid coupling were analyzed. The following conclusions can be drawn:
a) The number of pores decreased with the increasing equivalent diameter. Pores smaller than 5 μm in diameter exceed 6 × 10⁴, accounting for 32.5% of the total. Pores smaller than 10 μm in diameter accounted for 73.2% of the total, while pores between 10 and 30 μm in diameter decreased by more than an order of magnitude. Pores larger than 40 μm account for less than 1%. In tight sandstone, excluding nanopores, the primary pores were smaller than 40 μm in diameter, and pores larger than 100 μm are rare. The pore structure was divided into micro-pores (less than 40 μm) together with the larger pores and cracks, with the former uniformly distributed and the latter exhibited complex shapes and distributions.
b) The crack and pore wall exhibiting high flow velocity, especially in the matrix phase between cracks and pores. With the confining pressure increased, the porosity and flow velocity of tight sandstone decreased. When the confining pressure increased from 10 to 40 MPa, the porosity decreased by 17.9%, and the average flow rate of the rock decreased by 7%. However, there was an increase in permeability in the local region with large damage. Compared with the matrix phase, the permeability of the pore phase was more sensitive to the confining pressure.
c) The pore phase was the dominant channel of seepage flow. The cracks and large pores closed first as the confining pressure increased, resulting in a steep drop in permeability. However, the permeability decreased slightly under high confining pressure. The relationship between permeability and confining pressure followed a first-order exponential function with a decay function. As the confining pressure rose from 10 to 40 MPa, the permeability reduced by 91.8%.
d) Flow velocity increased with seepage pressure, extending into the matrix phase, while a notable rise occurred near the pore phase. Damage was primarily concentrated in stress areas under low seepage pressure, resulted in little changes to rock permeability, with the seepage behavior following linear Darcy flow. At high seepage pressure, the damage initiated at the seepage entrance and spread along pore walls, reduced rock elastic modulus and significantly increased permeability. Specifically, as seepage pressure rose from 5 to 50 MPa, the elastic modulus in the damaged area decreased by 41.1%, while permeability increased by 18.6%.
Acknowledgement: The authors received funding from the National Natural Science Foundation of China, the Research Fund of PetroChina Tarim Oilfield Company, and the Research Fund of China National Petroleum Corporation Limited. We gratefully acknowledge these contributions.
Funding Statement: This work was financially supported by the National Natural Science Foundation of China (Nos. 42272153 and 42472195), the Research Fund of PetroChina Tarim Oilfield Company (No. 671023060003) and the Research Fund of China National Petroleum Corporation Limited (No. 2023ZZ16YJ04).
Author Contributions: The authors confirm contribution to the paper as follows: study conception and design: Jing Li, Haijun Yang; data collection: Chen Liu, Zhenzhong Cai; model construction and calculation: Chong Sun, Chengqiang Yang; analysis and interpretation of results: Xiaoyu Meng, Hui Zhang; draft manuscript preparation: Chengqiang Yang, Hui Zhang; manuscript revision: Zhenzhong Cai. All authors reviewed the results and approved the final version of the manuscript.
Availability of Data and Materials: Enquiries about data availability should be directed to the authors. The collected data is available upon request.
Ethics Approval: Not applicable.
Conflicts of Interest: The authors declare no conflicts of interest to report regarding the present study.
References
1. J. Li et al., “Damage of reservoir rock induced by CO2 injection,” Pet. Sci., vol. 19, no. 4, pp. 1674–1681, Aug. 2022. doi: 10.1016/j.petsci.2022.03.016. [Google Scholar] [CrossRef]
2. J. Tian, Q. Chen, Y. L. Kang, Y. J. Wang, and C. Z. Qin, “Rapid assessment of water phase trapping on gas permeability reduction in typical tight gas reservoirs in China,” Geomech Geophys. Geo-Energ. Geo-Resour, vol. 9, no. 1, pp. 1–17, Dec. 2023. doi: 10.1007/s40948-023-00704-2. [Google Scholar] [CrossRef]
3. X. D. Yin et al., “Impact of rock type on the pore structures and sandstone reservoir in the Ordos Basin, NW China,” Pet. Sci., vol. 17, no. 4, pp. 1–16, May 2020. doi: 10.1007/s12182-020-00460-y. [Google Scholar] [CrossRef]
4. S. Yin, A. E. Radwan, X. Feng, G. C. Xie, and P. F. Lai, “Developmental characteristics of vertical natural fracture in low-permeability oil sandstones and its influence on hydraulic fracture propagation,” Geomech. Geophys. Geo-Energ. Geo-Resour., vol. 10, no. 1, Oct. 2024, Art. no. 165. doi: 10.1007/s40948-024-00889-0. [Google Scholar] [CrossRef]
5. S. L. Wang et al., “Densification mechanism of deep low-permeability sandstone reservoir in deltaic depositional setting and its implications for resource development: A case study of the Paleogene reservoirs in Gaoshangpu area of Nanpu sag, China,” Front Earth Sci., vol. 10, Sep. 2022, Art. no. 996167. doi: 10.3389/feart.2022.996167. [Google Scholar] [CrossRef]
6. X. Y. Zhao, M. F. Li, K. Yan, and L. Yin, “Revolutionizing tight reservoir production: A novel dual-medium unsteady seepage model for optimizing volumetrically fractured horizontal wells,” Energy Eng., vol. 120, no. 12, pp. 2933–2949, Nov. 2023. doi: 10.32604/ee.2023.041580. [Google Scholar] [CrossRef]
7. Y. Feng, J. Jones, and K. Gray, “A review on fracture-initiation and-propagation pressures for lost circulation and wellbore strengthening,” SPE Drill. Completion, vol. 31, no. 2, pp. 134–144, May 2016. doi: 10.2118/181747-PA. [Google Scholar] [CrossRef]
8. X. Liu, C. Zhang, H. Xiao, and H. Zhou, “Deformation and failure characteristics of a deeply buried tunnel subjected to creep slip fault movement: Based on the engineering conditions of Yunnan water intake project,” Bull Eng. Geol. Environ., vol. 81, no. 8, Jul. 2022, Art. no. 322. doi: 10.1007/s10064-022-02799-5. [Google Scholar] [CrossRef]
9. C. K. Ma, R. X. Li, C. Zhang, X. G. Guo, and X. T. Li, “A study on compressibility and permeability of tailings with different particle sizes under high pressure,” Bull Eng. Geol. Environ., vol. 82, no. 4, Mar. 2023, Art. no. 106. doi: 10.1007/s10064-023-03117-3. [Google Scholar] [CrossRef]
10. Z. R. Chen, M. Jiang, C. Z. Ai, J. S. Wu, and X. Xie, “A data-oriented method to optimize hydraulic fracturing parameters of tight sandstone reservoirs,” Energy Eng., vol. 121, no. 6, pp. 1657–1669, May 2024. doi: 10.32604/ee.2024.030222. [Google Scholar] [CrossRef]
11. X. X. Zhang, J. G. Wang, F. Gao, and Y. Ju, “Impact of water, nitrogen and CO2 fracturing fluids on fracturing initiation pressure and flow pattern in anisotropic shale reservoirs,” J. Nat. Gas Sci. Eng., vol. 45, no. 1, pp. 291–306, Sep. 2017. doi: 10.1016/j.jngse.2017.06.002. [Google Scholar] [CrossRef]
12. M. A. Biot, “Theory of propagation of elastic waves in a fluid-saturated porous solid. I. low-frequency range,” J. Acoust. Soc. Am., vol. 28, no. 2, pp. 168–178, Mar. 1956. doi: 10.1121/1.1908239. [Google Scholar] [CrossRef]
13. M. Gutierrez, “Petroleum reservoir simulation coupling fluid flow and geomechanics,” SPE Reserv. Eval. Eng., vol. 4, no. 3, pp. 164–172, Jun. 2001. doi: 10.2118/72095-PA. [Google Scholar] [CrossRef]
14. D. X. Zhang, L. H. Zhang, H. Y. Tang, and Y. L. Zhao, “Fully coupled fluid-solid productivity numerical simulation of multistage fractured horizontal well in tight oil reservoirs,” Pet. Explore. Dev., vol. 49, no. 2, pp. 382–393, Apr. 2022. doi: 10.1016/S1876-3804(22)60032-6. [Google Scholar] [CrossRef]
15. S. F. Lu et al., “Classification of microscopic pore-throats and the grading evaluation on shale oil reservoirs,” Petrole. Explor. Develop., vol. 45, no. 3, pp. 452–460, Jun. 2018. doi: 10.1016/S1876-3804(18)30050-8. [Google Scholar] [CrossRef]
16. H. J. Zhu, Y. W. Ju, Y. Qi, C. Huang, and L. Zhang, “Impact of tectonism on pore type and pore structure evolution in organic-rich shale: Implications for gas storage and migration pathways in naturally deformed rocks,” Fuel, vol. 228, no. 11, pp. 272–289, Sep. 2018. doi: 10.1016/j.fuel.2018.04.137. [Google Scholar] [CrossRef]
17. H. J. Zhu et al., “Pore structure variations across structural deformation of Silurian Longmaxi Shale: An example from the Chuandong Thrust-Fold Belt,” Fuel, vol. 241, no. 12, pp. 914–932, Sep. 2019. doi: 10.1016/j.fuel.2018.12.108. [Google Scholar] [CrossRef]
18. Y. T. Xie et al., “Study on hydro-mechanical-damage coupling seepage in digital shale cores: A case study of shale in Bohai Bay Basin,” Energy, vol. 268, no. 9, Apr. 2023, Art. no. 126759. doi: 10.1016/j.energy.2023.126759. [Google Scholar] [CrossRef]
19. J. Zhang and X. D. Wang, “Permeability-increasing effects of hydraulic flushing based on flow-solid coupling,” Geomech. Geoeng., vol. 13, no. 2, pp. 285–300, Jan. 2017. doi: 10.12989/gae.2017.13.2.285. [Google Scholar] [CrossRef]
20. V. Cnudde and M. Boone, “High-resolution X-ray computed tomography in geosciences: A review of the current technology and applications,” Earth-Sci. Rev., vol. 123, no. 4, pp. 1–17, Aug. 2013. doi: 10.1016/j.earscirev.2013.04.003. [Google Scholar] [CrossRef]
21. N. Saxena, G. Mavko, R. Hofmann, and N. Srisutthiyakorn, “Estimating permeability from thin sections without reconstruction: Digital rock study of 3D properties from 2D images,” Comput. Geosci., vol. 102, no. 9, pp. 79–993, May 2017. doi: 10.1016/j.cageo.2017.02.014. [Google Scholar] [CrossRef]
22. T. Li, M. Li, X. Q. Jing, W. L. Xiao, and Q. W. Cui, “Influence mechanism of pore-scale anisotropy and pore distribution heterogeneity on permeability of porous media,” Petroleum Explor. Dev., vol. 46, no. 3, pp. 594–604, Jun. 2019. doi: 10.1016/S1876-3804(19)60039-X. [Google Scholar] [CrossRef]
23. H. A, Z. B. Yang, R. Hu, and Y. F. Chen, “Roles of energy dissipation and asymmetric wettability in spontaneous imbibition dynamics in a nanochannel,” J. Colloid Interface Sci., vol. 607, no. 2, pp. 1023–1035, Feb. 2022. doi: 10.1016/j.jcis.2021.09.051. [Google Scholar] [PubMed] [CrossRef]
24. B. Ferréol and D. Rothman, “Lattice-Boltzmann simulations of flow through Fontainebleau sandstone,” Transp. Porous Media, vol. 20, no. 1–2, pp. 3–20, Aug. 1995. doi: 10.1007/BF00616923. [Google Scholar] [CrossRef]
25. C. Pan, M. Hilpert, and C. Miller, “Lattice-Boltzmann simulation of two-phase flow in porous media,” Water Resour. Res., vol. 40, no. 1, Jan. 2004, Art. no. W01501. doi: 10.1029/2003WR002120. [Google Scholar] [CrossRef]
26. M. L. Porter, M. G. Schaap, and D. Wildenschild, “Lattice-Boltzmann simulations of the capillary pressure saturation-interfacial area relationship for porous media,” Adv. Water Resour., vol. 32, no. 11, pp. 1632–1640, Nov. 2009. doi: 10.1016/j.advwatres.2009.08.009. [Google Scholar] [CrossRef]
27. A. Q. Raeini, M. J. Blunt, and B. Bijeljic, “Direct simulations of two-phase flow on micro-CT images of porous media and upscaling of pore-scale forces,” Adv. Water Resour., vol. 74, no. 2, pp. 116–126, Dec. 2014. doi: 10.1016/j.advwatres.2014.08.012. [Google Scholar] [CrossRef]
28. A. Q. Raeini, B. Bijeljic, and M. J. Blunt, “Modelling capillary trapping using finite volume simulation of two-phase flow directly on micro-CT images,” Adv. Water Resour., vol. 83, no. 2–3, pp. 102–110, Sep. 2015. doi: 10.1016/j.advwatres.2015.05.008. [Google Scholar] [CrossRef]
29. J. C. Qiao et al., “Insights into the pore structure and implications for fluid flow capacity of tight gas sandstone: A case study in the upper Paleozoic of the Ordos Basin,” Pet. Geol., vol. 118, Aug. 2020, Art. no. 104439. doi: 10.1016/j.marpetgeo.2020.104439. [Google Scholar] [CrossRef]
30. G. T. Mao, F. P. Lai, Z. P. Li, H. X. Wei, and A. Q. Zhou, “Characteristics of pore structure of tight gas reservoir and its influence on fluid distribution during fracturing,” J. Pet. Sci. Eng., vol. 193, no. 3, Oct. 2020, Art. no. 107360. doi: 10.1016/j.petrol.2020.107360. [Google Scholar] [CrossRef]
31. J. Li, X. R. Li, M. S. Song, H. M. Liu, Y. C. Feng and C. Liu, “Investigating microscopic seepage characteristics and fracture effectiveness of tight sandstones: A digital core approach,” Pet. Sci., vol. 18, no. 1, pp. 173–182, Dec. 2021. doi: 10.1007/s12182-020-00464-8. [Google Scholar] [CrossRef]
32. Y. Li, J. H. Yang, Z. J. Pan, and W. S. Tong, “Nanoscale pore structure and mechanical property analysis of coal: An insight combining AFM and SEM images,” Fuel, vol. 260, no. 1, Jan. 2020, Art. no. 116352. doi: 10.1016/j.fuel.2019.116352. [Google Scholar] [CrossRef]
33. X. X. Ren, A. Li, S. S. Fu, and W. B. Tian, “Influence of micro-pore structure in tight sandstone reservoir on the seepage and water-drive producing mechanism—A case study from Chang 6 reservoir in Huaqing area of Ordos basin,” Energy Sci. Eng., vol. 7, no. 3, pp. 741–753, Apr. 2019. doi: 10.1002/ese3.302. [Google Scholar] [CrossRef]
34. Y. Wang, C. Zhu, M. He, M. X. Wang, and H. L. Le, “Macro-meso dynamic fracture behaviors of Xinjiang marble exposed to freeze thaw and frequent impact disturbance loads: A lab-scale testing,” Geomech. Geophys. Geo-Energ. Geo-Resour., vol. 8, no. 5, Sep. 2022, Art. no. 154. doi: 10.1007/s40948-022-00472-5. [Google Scholar] [CrossRef]
35. W. Qi, S. Xu, K. G. Hong, P. Zhang, B. Jiang and H. L. Bo, “Energy analysis-based core drilling method for the prediction of rock uniaxial compressive strength,” Geomech. Geoeng., vol. 23, no. 1, pp. 61–69, Oct. 2020. doi: 10.12989/gae.2020.23.1.061. [Google Scholar] [CrossRef]
36. G. Han, C. S. Zhang, H. Zhou, C. Q. Zhang, Y. Gao and K. S. Henmant, “A new predictive method for the shear strength of interlayer shear weakness zone at field scales,” Eng. Geol., vol. 295, no. 20, Dec. 2021, Art. no. 106449. doi: 10.1016/j.enggeo.2021.106449. [Google Scholar] [CrossRef]
37. D. Silin and T. Patzek, “Pore space morphology analysis using maximal inscribed spheres,” Physica A: Stat. Mech. Appl., vol. 371, no. 2, pp. 336–360, Nov. 2006. doi: 10.1016/j.physa.2006.04.048. [Google Scholar] [CrossRef]
38. C. Soulaine and H. A. Tchelepi, “Micro-continuum approach for pore-scale simulation of subsurface processes,” Transp. Porous Med., vol. 113, no. 3, pp. 431–456, May 2016. doi: 10.1007/s11242-016-0701-3. [Google Scholar] [CrossRef]
39. Y. Obara, I. Tanikura, J. Jung, and R. Shintanu, “Watanabe S evaluation of micro-damage of concrete specimens under cyclic uniaxial loading by X-ray CT method,” J. Adv. Concr. Technol., vol. 14, no. 8, pp. 433–443, Aug. 2016. doi: 10.3151/jact.14.433. [Google Scholar] [CrossRef]
40. R. Schulz, N. Ray, S. Zech, A. Rupp, and P. Knabner, “Beyond Kozeny-Carman: Predicting the permeability in porous media,” Transp. Porous Med., vol. 130, no. 2, pp. 487–512, Nov. 2019. doi: 10.1007/s11242-019-01321-y. [Google Scholar] [CrossRef]
41. A. Chorin, “Numerical solution of the Navier-Stokes equations,” Math. Comp., vol. 22, no. 104, pp. 745–762, 1968. doi: 10.1090/S0025-5718-1968-0242392-2. [Google Scholar] [CrossRef]
42. J. Lemaitre, “Coupled elastic-plasticity and damage constitutive equations,” Comput. Meth. Appl. Mech. Eng., vol. 51, no. 1–3, pp. 31–49, Sep. 1985. doi: 10.1016/0045-7825(85)90026-X. [Google Scholar] [CrossRef]
43. Y. T. Xie, H. M. Liu, K. H. Zhang, W. H. Jia, J. Li and X. Y. Meng, “Dynamic evaluation of microscopic damage and fluid flow behavior in reservoir shale under deviatoric stress,” Energy, vol. 283, no. 8, Nov. 2023, Art. no. 128391. doi: 10.1016/j.energy.2023.128391. [Google Scholar] [CrossRef]
Cite This Article
 Copyright © 2025 The Author(s). Published by Tech Science Press.
This work is licensed under a Creative Commons Attribution 4.0 International License , which permits unrestricted use, distribution, and reproduction in any medium, provided the original work is properly cited.
 Downloads
 Citation Tools