
 Submit a Paper
 Propose a Special lssue
 Open Access
ARTICLE

Correlation Analysis of Power Quality and Power Spectrum in Wind Power Hybrid Energy Storage Systems
1 College of Energy and Power Engineering, Inner Mongolia University of Technology, Hohhot, 010051, China
2 Ordos Energy Research Institute, Peking University, Ordos City, 017000, China
3 School of Data Science and Application, Inner Mongolia University of Technology, Hohhot, 010051, China
4 Inner Mongolia Baotou Steel Pipe Co., Ltd., Baotou City, 014010, China
* Corresponding Author: Caifeng Wen. Email:
Energy Engineering 2025, 122(3), 1175-1198. https://doi.org/10.32604/ee.2025.061083
Received 16 November 2024; Accepted 16 January 2025; Issue published 07 March 2025
 View Full Text
 Download PDF
Abstract
Power quality is a crucial area of research in contemporary power systems, particularly given the rapid proliferation of intermittent renewable energy sources such as wind power. This study investigated the relationships between power quality indices of system output and PSD by utilizing theories related to spectra, PSD, and random signal power spectra. The relationship was derived, validated through experiments and simulations, and subsequently applied to multi-objective optimization. Various optimization algorithms were compared to achieve optimal system power quality. The findings revealed that the relationships between power quality indices and PSD were influenced by variations in the order of the power spectral estimation model. An increase in the order of the AR model resulted in a 36% improvement in the number of optimal solutions. Regarding optimal solution distribution, NSGA-II demonstrated superior diversity, while MOEA/D exhibited better convergence. However, practical applications showed that while MOEA/D had higher convergence, NSGA-II produced superior optimal solutions, achieving the best power quality indices (THDi at 4.62%, d% at 3.51%, and at 96%). These results suggest that the proposed method holds significant potential for optimizing power quality in practical applications.Keywords
Nomenclature
| PSD | Power spectral density (W/Hz) |
| RMS | Root mean square |
| THDi | Total harmonic distortion rate of current |
| Effective value of voltage fluctuation | |
| Power factor | |
| N | Signal sequence length |
| Δt | Sampling interval (s) |
| Fs | Sampling frequency (Hz) |
| Amplitude after discrete Fourier transform | |
| Sample frequency (Hz) | |
| Complex conjugate of the frequency domain signal | |
| PSD of wind power fluctuation | |
| Variance of the system frequency deviation PSD | |
| T | System time inertia constant |
| Load-frequency characteristic coefficient | |
| Effective value of fundamental current (A) | |
| RMS of the n-th harmonic current (A) | |
| PSD corresponding to the effective fundamental current | |
| PSD corresponding to the n-th effective harmonic current | |
| Fundamental power factor | |
| Relative amplitude of interharmonics | |
| Fundamental frequency (Hz) | |
| Interharmonic frequency (Hz) | |
| Deviation between | |
| Phase angle | |
| Fundamental period | |
| Fundamental voltage amplitude (V) | |
| n-th interharmonic voltage amplitude (V) | |
| Tip speed ratio | |
| FFT | Fast Fourier transform |
| AR | Modern power spectrum estimation—autoregressive model |
| GA + Pareto | Genetic Algorithm + Pareto frontier search |
| NSGA-II | Non-dominated Sorting Genetic Algorithm-II |
| MOEA/D | Multi-Objective Evolutionary Algorithm Based on Decomposition |
As global energy demand and environmental concerns escalate, developing renewable and clean energy sources has emerged as a crucial direction for global energy transformation. Solar, wind, and hydroelectric power are gradually becoming the primary alternatives to traditional fossil fuels due to their environmental sustainability and other advantages. For instance, the integrated optimization of solar and gas turbine systems can substantially enhance energy efficiency while reducing emissions [1]. Solid oxide fuel cell systems demonstrate excellent power output and low emissions across various current densities [2]. Furthermore, the combination of biomass gasification and solid oxide fuel cells has the potential to improve system energy efficiency [3]. Innovative approaches to converting waste into renewable hydrogen also provide new ideas for clean energy production [4]. Compared to other clean energy sources, integrating wind energy into power systems significantly reduces generation costs and emissions [5] and enhances system scheduling efficiency. Research indicates that wind energy integration demonstrates notable advantages in multi-objective optimization, particularly in large-scale power systems [6].
Many comparative analyses of accuracy and flexibility characteristics in the frequency domain through Fourier transform methods have recently been proposed [7]. Power spectrum analysis based on Fourier transform is extensively utilized across various fields [8,9]. For instance, Leonowicz et al. [10] evaluated power quality using an advanced spectrum approach and found that higher-resolution spectra improved the accuracy of assessed spectral parameters in deformed power system waveforms. Similarly, Wang et al. [11] investigated power quality disruption characteristics using deep learning, achieving a satisfactory accuracy of 98.43% in power evaluation. Narendra Babu [12] conducted an adaptive grid mentor control test for power quality in a microgrid system, demonstrating promising results with direct current (DC) usage in microgrids. Shao et al. [13] reviewed power quality monitoring in offshore wind energy, identifying synchronized waveform detection as having great potential due to its high resolution, availability, and effective time synchronization. Holdynski et al. [14] analyzed the impact of photovoltaic farms on select power quality parameters in medium power grids, observing a 60% decrease in voltage distortion factor with increased power. Tian [15] employed PSD and autocorrelation function analyses to explore chaotic dynamic behavior in wind-electric time series at various time scales. Yao et al. [16] applied the hinge model in PSD analysis to obtain low-pass decomposition frequency, achieving an optimized energy storage scale for single-day energy balance. Qing et al. [17] utilized PSD to capture the frequency and amplitude of state variable fluctuations in heterogeneous power systems with random excitation. Ayon et al. [18] estimated the coherence index from self-PSD and cross-PSD information to identify coherent regions of specific frequencies associated with interregional oscillation patterns. In optimization systems, Morteza et al. [19] proposed a distribution network development and planning model based on electric vehicles and distributed power sources, analyzing electric vehicles’ influence on the technical characteristics of power grids in intelligent environments through scenario simulations. Reference [20] employed the Antlion optimization algorithm to optimize parameters of model predictive control (MPC) and proportional-integral (PI) controllers, adjusting plug-in hybrid electric vehicle (PHEV) battery charging rates to reduce frequency fluctuations caused by wind energy variations.
Power quality is a crucial indicator for assessing the stability and reliability of a power system. Karafotis et al. [21] introduced a wavelet packet transform-based method for power quality analysis in three-phase power systems, considering harmonics and unbalance. Yin et al. [22] evaluated the overall power quality of new energy permeation distribution network systems using the analytic hierarchy process (AHP). Total harmonic distortion (THD), a significant index, is frequently utilized in power quality studies. Higher THD values indicate poorer power quality, potentially leading to issues such as reduced equipment lifespan, increased system losses, and equipment malfunctions. Reference [23] proposed an artificial neural network (ANN)-based excitation current modulation method, which effectively mitigated terminal voltage harmonic distortion in synchronous generators under nonlinear load conditions by optimizing the excitation current. Reference [24] presented a novel multilevel alternating current (AC)/DC/AC multiunit converter topology that significantly reduced THD in wind energy conversion systems and enhanced the voltage output quality of grid-connected wind energy systems.
Despite the prevalence of PSD analysis in various fields, its application in conjunction with power quality indices to examine wind power hybrid energy storage systems remains limited. This study primarily investigates the output power quality of wind power hybrid energy storage systems. Additionally, it explores the relationship between PSD and power quality indices through theoretical derivation of random signal power spectra, which is supported by experimental and simulation verification. Through comprehensive multi-objective optimization comparisons, this research achieves an optimal state of power quality, providing an effective and reliable framework for evaluating and enhancing the output power quality of wind power systems.
2 Related Theory and System Power Spectrum Calculation
Random signals lack the property of Fourier transform, resulting in theoretically infinite total energy when calculated. To apply Fourier transform methods to random signals, energy spectrum calculation involves using an interceptor function. Subsequently, the power spectrum of random signals is derived by linking spectrum analysis with random signals through Parseval’s theorem. Consider a discretized sample x(n) of the random process X(t), with a finite length N and a sampling interval of
According to the calculation method provided by Matlab, the conversion relationship between PSD and spectrum can be obtained through Eq. (2):
where Fs represents the sampling frequency, and
2.2 Mathematical Derivation of System PSD and Power Quality Indices
The subsequent section presents mathematical calculations for the power spectrum and power quality indices of the system. Initially, a mathematical model and corresponding complex domain are established based on the power spectrum concept. This is followed by an examination of the nonlinear characteristics of system components, including the aerodynamic properties of wind turbines and the switching characteristics of electronic control devices. To simplify the analysis, a linearization method is employed to approximate the nonlinear system near a specific operating point, yielding a linear system through frequency deviation.
Frequency deviation:
The PSD can be computed by multiplying the signal’s Fourier transform in the frequency domain with its complex conjugate and averaging the result. Using this method, the PSD of wind fluctuation is calculated [25], and its formula is expressed as follows:
where
Through the application of random signal analysis and frequency-domain analysis of the linear system, the relationship between the input signal
Assuming the input signal x(t) is a zero-mean stochastic stationary process, the PSD corresponding to the variance of the output y(t) can be obtained as
Disregarding the generator governor, the model transfer function of the system frequency characteristic is expressed as
where T denotes the inertia constant of system time, and
Moreover, the study calculates the impact of the synchronous generator and energy storage device when wind power fluctuation
where
The corresponding input signal
Upon substitution of
Additional power quality indices are associated with the power spectrum through the spectrum from Eq. (2), and THDi can be simply expressed by
By multiplying the numerator and denominator of Eqs. (2) and (10), the relationship between THDi and PSD can be expressed as
where
The power factor (
The relationship between
In the case of non-sinusoidal reactive power
where
Establish a signal model formula comprising a fundamental frequency component and a single interharmonic component as follows:
where
By setting
An analysis of the expansion above reveals that the waveform incorporates a harmonic component
The analysis reveals that the deviation between the interharmonic and fundamental frequencies (
where
The above derivation demonstrates that the PSD variance of the system frequency deviation is influenced by several factors: wind power fluctuation, synchronous generator characteristics, energy storage transfer function, system inertia constant, and load frequency coefficient. Notably, a larger PSD
This study demonstrates a correlation between PSD and power quality indices through the development of mathematical derivations for the system. The research also reveals that these factors are influenced by energy storage systems, power electronic devices, wind power fluctuations, and load disturbances.
2.3 Power Spectrum Simulation and Wind Power System Analysis
The wind power hybrid energy storage system model was constructed using the Simulink platform, incorporating components such as wind turbines, energy storage devices (batteries and supercapacitors), power electronic devices (rectifiers), load models, and power electronic control systems. The model development considered several factors, including the system’s dynamic characteristics, control strategies, and component interactions. It simulated wind speed fluctuations, load variations, and charge-discharge processes of the energy storage system. Additionally, the model recorded system spectra and power quality indices, such as the harmonic content and voltage fluctuations. During the simulation, spectrum analysis software calculated the power spectrum of the output power signal, determining the system’s energy distribution across different frequencies and revealing its frequency-domain characteristics. Through analysis of the simulation results, the study established the correlations between power spectrum characteristics and power quality indices of wind power hybrid energy storage systems.
As illustrated in Fig. 1, the single-phase current spectrum diagram of the permanent magnet synchronous generator under random wind conditions reveals that the generator’s THDi is 18.57%. This distortion primarily consists of the 5th, 7th, 11th, and 13th harmonics, which correspond to the typical characteristics of nonlinear loads and switchgears in power systems. The harmonic content decreases progressively with increasing frequency. In terms of spectral energy distribution, the low-frequency range (near 50 Hz) exhibits the highest amplitude ratio, attributable to the fan’s output being predominantly concentrated at the fundamental frequency. In the mid-frequency range (100–400 Hz), several significant harmonic peaks are observed, indicating the influences of wind speed fluctuations and nonlinear control devices on the system. The high-frequency range (above 400 Hz) contains less harmonic content, although some small-value components persist, possibly resulting from rapid switching actions or other high-frequency interferences. The high harmonic content may impact the system’s power quality, potentially causing issues such as equipment heating and power factor reduction.

Figure 1: Single-phase current energy distribution with frequency
Likewise, Fig. 2 indicates the impact of energy storage on voltage fluctuation and frequency stability when wind speed varies. The results demonstrate that wind speed fluctuates at 2 and 4 s, with wind power decreasing from 450 to 380 W, indicating significant volatility. The total harmonic distortion rate of the generator’s three-phase current ranges from 24.81% during the 2–4 s period to 13.45% after stabilizing at 4 s, primarily due to reduced subharmonic and interharmonic wave content. Concurrently, the load voltage fluctuates, decreasing from 55 to 54 V, with increased amplitude compared to the 2–4 s period. This causes the lithium battery power to drop from −300 to −200 W to maintain system balance. In comparison, the supercapacitor’s power decline is minimal, only 5 W, but its energy storage effect in maintaining system energy balance is rapid. Notably, it supplements load power loss in less than 0.1 s, preventing load voltage fluctuations and system instability, thereby enhancing the system’s power quality.

Figure 2: Diagram of the influence of charge and discharge on voltage fluctuation and frequency stability
Furthermore, an unsteady source-storage-load experimental platform revealed variations in the output power quality indices when the wind power system lacked energy storage. Upon incorporating different energy storage devices and utilizing the AR model to estimate the PSD of the data, the frequency-domain transformation trend of the power quality indices in the wind power system decreases. Moreover, this approach provides a more comprehensive understanding of the power quality indices and power spectrum characteristics of wind power hybrid energy storage systems, offering an effective and reliable method for evaluating and enhancing the output power quality of wind power systems.
3 System Power Quality and Power Spectrum Analysis Experiment
This study’s experimental setup was arranged as shown in Fig. 3. The research focused on observing the harmonic mode, frequency changes, and harmonic numbers of the power signal. Additionally, the PSD of the AR model was estimated to verify the relationships between the power quality indices and PSD. The experiment utilized a wind tunnel platform to provide relatively stable incoming air. A wind wheel was connected to the generator through a torque meter, with the output connected to a rectifier and then to a DC load box for no-energy storage experiments. Energy storage experiments were conducted by connecting various devices (including lithium batteries, supercapacitors, and heat storage devices). The generator output voltage, current, and other parameters were recorded using a DH5902 data acquisition and analysis system, a Fluke Norma 5000 power analyzer, and other experimental instruments. The equipment was set to harmonic mode to monitor frequency changes and harmonic frequencies of the power signal. The DC load box and Fluke data recording were adjusted for unsteady state experiments. Tests were conducted within a wind speed range of 8 to 12 m/s, with the generator speed adjusted from 100 to 600 rad/min through the DC load box to examine performance under varying wind speeds.

Figure 3: Experimental test system diagram
3.1 No-Energy Storage Power Quality Index Characteristics Experiment
This study investigated the correlation between power quality and load at varying wind speeds. The experiment was conducted at and above the rated wind speed to explore the relationships among power quality evaluation indices, loads, and wind speeds under different conditions. Four representative power quality evaluation indices were analyzed: THDi, frequency deviation ratio, voltage fluctuation, and power factor

Figure 4: Experimental test diagram of power quality indices without energy storage. (a) THDi; (b) voltage fluctuation; (c) power factor; (d) frequency deviation ratio
Analysis of Fig. 4a reveals that THDi initially decreases and then increases, reaching its lowest value at 150 W under a 10 m/s load. At constant loading, THDi slightly increases when wind speed is at its minimum. THDi is notably influenced by load, with a more pronounced upward trend observed beyond 200 W. Fig. 4b demonstrates that under consistent load conditions, voltage fluctuation exhibits a positive correlation with wind speed, increasing by 0.2%–0.3%. Voltage fluctuation is also affected by load, reaching its minimum between 150 and 200 W at a constant wind speed. Fig. 4c primarily illustrates the impact of load. Under steady wind speed, the trend initially increases before stabilizing. The maximum value of 94% is achieved when the load reaches 200 W. Conversely, at constant load,
However, the corresponding fundamental frequency and nominal voltage value increased more rapidly, resulting in a reduced THDi, d%, and frequency deviation ratio. Upon reaching the rated speed, the output rated power is stabilized, contributing to reduced voltage fluctuations, total harmonic distortion rate, and frequency deviation of the current. The power quality analyses illustrated in Fig. 4a,b,d all reach their lowest points. After exceeding the rated speed, alterations in the electromagnetic field distribution within the generator lead to increased harmonic generation. In variable-speed wind turbines, speed changes affect the response of the control system, potentially increasing the distortion of current and voltage waveforms, thus elevating harmonic content. Nevertheless, it is observed that the growth of fundamental frequency and nominal voltage decelerates.
Conversely, under constant load conditions, an increase in wind speed leads to a decline in power quality, particularly when the wind speed reaches 11–12 m/s. This phenomenon is attributable to several factors. The significant fluctuations in wind speed, combined with the nonlinearity of power electronic devices in the rectifier, result in distortion of the three-phase waveform and generation of harmonics. Consequently, the generator’s output power becomes unstable. The presence of harmonics may increase the system’s reactive power demand and reduce the fundamental wave factor, potentially impeding further improvement of the power factor. Furthermore, without an energy storage system to balance the energy, the load voltage and power are susceptible to instability and fluctuations. These factors collectively contribute to a decrease in the overall system’s power quality.
3.2 Power Quality Index Characteristics Experiment under Different Energy Storage Forms
This paper examined the impact of various energy storage systems, including lithium batteries, heat storage, supercapacitors, and a hybrid of lithium batteries and supercapacitors, on improving power quality. Fig. 5 illustrates that THDi decreases as the blade tip speed ratio (

Figure 5: Comparison of THDi values of different energy storage forms
Similarly, Fig. 6 demonstrates a negative correlation trend between d and

Figure 6: Comparison diagram of voltage fluctuations of different energy storage forms
Fig. 7 illustrates that

Figure 7: Comparison diagram of power factors of different energy storage forms
Fig. 8 demonstrates that, without energy storage, the frequency deviation ratio progressively decreases as

Figure 8: Comparison diagram of frequency deviation ratios of different energy storage forms
In conclusion, the hybrid energy storage system, which combines different energy storage devices such as batteries and supercapacitors, offers distinct advantages over single energy storage solutions. This system enhances the ability to manage load fluctuations and wind power instability, thereby mitigating economic losses associated with power supply interruptions. Moreover, it circumvents the need for higher capacity redundancy often required by single energy storage devices, thus reducing initial investment costs. From a frequency-domain perspective, the hybrid energy storage system minimizes battery cycle depth by allocating high-frequency power fluctuations to rapid-response supercapacitors, while low-frequency fluctuations are managed by the battery. This strategic distribution extends battery service life and reduces long-term operational expenses.
3.3 Correlation Analysis of Power Quality and Power Spectrum Characteristics
This research analyzed the fluctuations of wind power output and their effects on system stability, investigating how energy storage systems could effectively mitigate power fluctuations while enhancing the system’s power quality. The hybrid energy storage system was influenced by the power quality indices, energy storage capacity, and system volatility. The study examined the current signal of the generator at the rated speed and its power spectrum. The figure below shows a comparison between different energy storage modes and the single-phase current spectrum without energy storage. After the generator reaches the rated speed, the fundamental frequency is 50 Hz. Due to wind speed fluctuations, the generator-side power signal produces 5th, 7th, 11th, and 13th harmonics, as well as some interharmonics, under no-storage conditions. Upon introduction of the energy storage system, the harmonic energy decreases due to the energy’s fundamental frequency. Fig. 9 demonstrates that the lithium battery primarily suppresses harmonics in the 0–255 Hz frequency range. Notably, the fifth harmonic is suppressed, with its amplitude decreasing from 0.77 to 0.5, resulting in a harmonic reduction ratio of 60%. In Fig. 10, the suppression range of heat storage is mainly concentrated in the 250–500 Hz range. Similarly, Fig. 11 reveals that after adding the supercapacitor, the highest frequency harmonics are suppressed, the 11th harmonic frequency is reduced, and the 13th harmonic experiences the largest decline, with its amplitude approaching zero. The frequency spectrum characteristics of the generator’s output current signal align with the simulation results of the wind turbine’s three-phase current in the previous simulation system, confirming that energy storage can reduce the signal’s harmonic energy and increase the proportion of fundamental wave energy.

Figure 9: Spectrum comparison between lithium battery and no-energy storage

Figure 10: Spectrum comparison between heat storage and no-energy storage

Figure 11: Spectrum comparison between supercapacitor and no-energy storage
Moreover, Fig. 12 presents the variance comparison of PSD with various energy storage frequencies. Without energy storage, the system frequency deviation exceeds the fluctuation, with the frequency deviation ratio surpassing

Figure 12: Variance comparison of PSD with different energy storage frequency deviations
(1) Following the conversion using Eq. (1), the current signal and THDi of the generator increase, primarily due to the influence of harmonics and frequency. The increase in each harmonic content leads to an increase in overall distortion. This phenomenon is attributed to the converter’s on-off operation, which produces a non-sinusoidal waveform, resulting in a three-phase electric current containing multiple frequency components of the complex waveform, including harmonic components. This process of harmonic generation was previously discussed by Reference [30]. Notably, the harmonic amplitude decreases as the harmonic order increases [31]. Concurrently, wind speed variability causes fluctuations in wind power, which subsequently affects the wind turbine’s output power. These rapid fluctuations in power output contribute to the distortion of the system’s harmonic current and voltage waveforms.
(2) The impact of voltage fluctuation primarily manifests in wind speed variations, which subsequently affect wind turbine power output. After rectification, the bus voltage also changes, increasing interharmonic content corresponding to the rise of
(3) The energy storage device rapidly responds to wind power system demands, balancing fluctuations by absorbing or releasing energy, thereby reducing system frequency deviations. As illustrated by the power spectrum analysis in Figs. 9–12, the incorporation of energy storage redistributes energy across frequency bands, enhancing fundamental frequency energy while decreasing the variance of the system frequency deviation PSD. This results in improved system frequency stability and power quality. Consequently, effective configuration and control strategies for the energy storage system are critical for maintaining power grid frequency stability.
(4) The generation of harmonics in the system leads to distortion power D, resulting in a significant phase offset between the terminal voltage and current. This offset causes the power factor to decrease below the neutral value of 0.9. The power factor is a crucial characteristic of power users, as a lower value can unnecessarily burden synchronous generators and electric transmission lines [33]. In wind power hybrid energy storage systems, odd harmonics are frequently generated due to wind power fluctuation and converter influences. A higher harmonic content leads to a lower
4 Multi-Objective Optimization
This section elucidated the relationships between the system signal value and the power quality indices by modifying the order of the AR model in power spectrum estimation parameters. Through Matlab algorithm programming, this relationship was applied to NSGA-II, MOEA/D, and GA + Pareto optimization algorithms to optimize the power quality indices. This process enabled the system to explore multiple solution combinations, aiming to achieve optimal performance across various power quality metrics. The specific optimization process is illustrated in Fig. 13.

Figure 13: NSGA-II multi-objective optimization flow chart
The optimization algorithm incorporated four power quality indices: frequency deviation, THDi,
The specific decision variables encompassed the AR model order, wind speed, and wind power.
Simultaneously, several constraints were implemented to ensure the accuracy and stability of power spectrum estimation. The order
THDi was calculated using the following equation:
The voltage fluctuation was determined based on
The wind speed range was calculated using Eq. (23) to ensure the feasibility, practicability, and safety of the power quality optimization results.
The algorithm iterated 500 times, with the distance between individuals reflecting the algorithm’s diversity and convergence. A higher number of individuals with large distances indicates greater diversity, while a higher number of individuals with small distances and high aggregation suggests stronger correlation and improved convergence. Tables 1 and 2 illustrate the diversity and convergence of the three algorithms for orders 45 and 75, respectively. Following multi-objective optimization, the distribution of optimal solutions for different objective functions was depicted in three-dimensional space, as shown in Fig. 14.
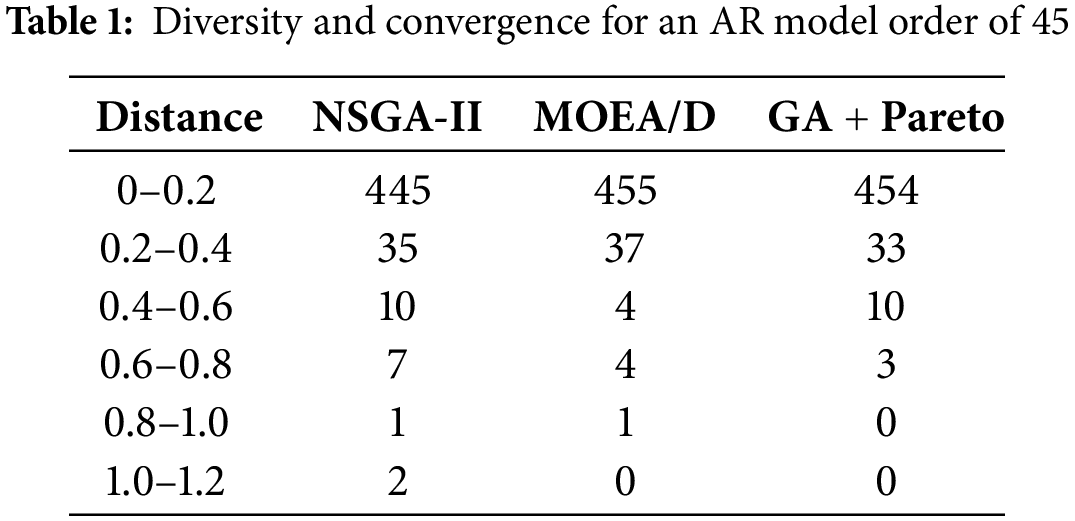
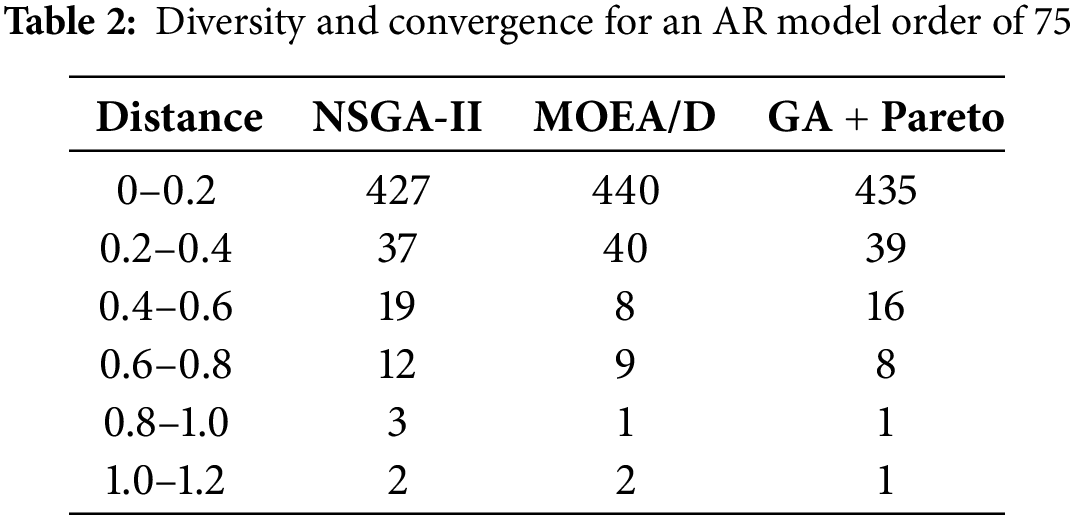

Figure 14: Distribution of optimal solutions of the three algorithms
(1) Diversity analysis results
As the order of the AR model increases from 45 to 75, the number of high-distance individuals utilized to measure the relative differences in the target space significantly increases. This observation indicates that the algorithm can explore more diverse solutions, thereby enhancing the likelihood of identifying the global optimal solution. Irrespective of the AR model order, NSGA-II consistently demonstrates a higher number of individuals in the high-distance interval (0.6–1.2) compared to MOEA/D and GA + Pareto. This suggests that NSGA-II maintains superior diversity in its solution set.
(2) Convergence analysis results
At an order of 45, NSGA-II exhibits marginally fewer individuals in the 0–0.2 distance range compared to MOEA/D while showing similar performance to GA + Pareto. When the order increases to 75, MOEA/D performs superior to NSGA-II in the low-distance range. Overall, the MOEA/D algorithm displays higher convergence.
(3) Optimal solution analysis results
Fig. 14 shows the distribution of optimal solutions for different objective functions in a three-dimensional space. In Fig. 14a, the AR model has an order of 45, while in Fig. 14b, the AR model has an order of 75. The results indicate that when the order of the AR model increases from 45 to 75, the number of optimal solutions for each power quality index increases by 36%, and the clustering degree of different solutions is also higher. Compared to the other two algorithms, NSGA-II demonstrates greater diversity, with a more uniform distribution of different solutions. The number of NSGA-II’s solutions with
This study employed the correlation theory of spectra, PSD, and random signal power spectra to derive the relationships between the system’s output power quality indices and PSD. These relationships were subsequently validated through experimental and simulation methods. Ultimately, the established relationships were utilized for multi-objective optimization, where various optimization algorithms were compared to achieve optimal system power quality. The specific conclusions are as follows:
(1) Correlation between power quality and power spectrum
Wind power variability contributes to power quality fluctuations by influencing the PSD. This impact manifests as increased frequency deviation, heightened voltage fluctuation, elevated THDi, and reduced power factor (
(2) Optimization effect of energy storage system on power quality
Lithium batteries and supercapacitors substantially enhance system stability by swiftly responding to power fluctuations induced by wind speed variations, effectively mitigating THDi and d%. The hybrid energy storage system integrates the long-term energy regulation capacity of lithium batteries with the rapid response capability of supercapacitors. This combination achieves notable improvements in power quality across multiple time scales, particularly in diminishing harmonic distortion rates and voltage fluctuations.
(3) Comparison of multi-objective optimization algorithms
As the order of the AR model increases, the diversity and convergence of the three algorithms significantly improve. From the perspective of optimal solution distribution, NSGA-II demonstrates the best diversity performance, while MOEA/D exhibits superior convergence. However, practical applications reveal that despite its enhanced convergence, MOEA/D is less effective than the NSGA-II algorithm in obtaining the optimal solution. The optimum power quality indices achieved by NSGA-II are as follows: THDi of 4.62%, d% of 3.51%, and
This study uniquely combines PSD theory with power quality optimization, proposing a multi-objective optimization framework. This approach not only addresses the impact of wind power fluctuation on power quality but also offers a novel perspective for optimal energy storage system configuration. Future research directions include: (1) investigating the integration of wind, solar, and other renewable energy sources with energy storage systems to optimize overall power quality and operational efficiency in multi-energy systems; (2) developing more efficient energy management strategies and equipment optimization models to extend the lifespan of energy storage devices while considering the impact of frequent harmonic suppression; (3) exploring optimization algorithms in complex, multi-objective environments to address high-dimensional and real-time dynamic power quality optimization challenges; and (4) comprehensively evaluating the environmental and economic benefits of energy storage systems to provide multi-dimensional decision support for energy storage equipment deployment.
Acknowledgement: Sincere thanks are due to Professor Caifeng Wen of Inner Mongolia University of Technology for providing lots of constructive suggestions.
Funding Statement: This research was funded by: the Inner Mongolia Nature Foundation Project, Project number: 2023JQ04.
Author Contributions: The contributions to this paper are as follows: research idea and design: Jian Gao, Caifeng Wen; data collection: Hongliang Hao, Yongsheng Wang, Yuwen Zhang; results analysis and interpretation: Jian Gao, Zhanhua Han, Edwin E. Nyakilla; first draft: Jian Gao, Caifeng Wen. All authors reviewed the results and approved the final version of the manuscript.
Availability of Data and Materials: Data is available on request from the authors. The data that support the findings of this study are available from the corresponding author, upon reasonable request.
Ethics Approval: Not applicable.
Conflicts of Interest: The authors declare no conflicts of interest to report regarding the present study.
References
1. Mahdavi N, Mojaver P, Khalilarya S. Multi-objective optimization of power, CO2 emission and exergy efficiency of a novel solar-assisted CCHP system using RSM and TOPSIS coupled method. Renew Energy. 2022;185(1–2):506–24. doi:10.1016/j.renene.2021.12.078. [Google Scholar] [CrossRef]
2. Mojaver P, Khalilarya S, Chitsaz A. Combined systems based on OSOFC/HSOFC: comparative analysis and multi-objective optimization of power and emission. Int J Energy Res. 2021;45(4):5449–69. doi:10.1002/er.6173. [Google Scholar] [CrossRef]
3. Tan L, Dong X, Gong Z, Wang M. Investigation on performance of an integrated SOFC-GE-KC power generation system using gaseous fuel from biomass gasification. Renew Energy. 2017;107(7):448–61. doi:10.1016/j.renene.2017.02.012. [Google Scholar] [CrossRef]
4. Al-Qadri AA, Ahmed U, Ahmad N, Abdul Jameel AG, Zahid U, Naqvi SR. A review of hydrogen generation through gasification and pyrolysis of waste plastic and tires: opportunities and challenges. Int J Hydrog Energy. 2024;77:1185–204. doi:10.1016/j.ijhydene.2024.06.207. [Google Scholar] [CrossRef]
5. Lalhmachhuana R, Deb S, Datta S, Singh KR, Cali U, Ustun TS. Multi-objective-based economic and emission dispatch with integration of wind energy sources using different optimization algorithms. Front Energy Res. 2024;12:1421212. doi:10.3389/fenrg.2024.1421212. [Google Scholar] [CrossRef]
6. Xie M, Yan Y, Ke S, Liu M. Vector ordinal optimization theory based large-scale multi-objective unit commitment considering stochastic wind power. IEEJ Trans Electr Electr Eng. 2018;13(3):463–71. doi:10.1002/tee.22589. [Google Scholar] [CrossRef]
7. Arshad M, Beik O, Manzoor MO, Gholamian M. Stability analysis via impedance modelling of a real-world wind generation system with AC collector and LCC-based HVDC transmission grid. Electronics. 2024;13(10):1917. doi:10.3390/electronics13101917. [Google Scholar] [CrossRef]
8. Elenets MV, Nemirovich-Danchenko MM. Application of the Prony method for biometric data analysis. J Phys: Conf Ser. 2021;1862(1):012007. doi:10.1088/1742-6596/1862/1/012007. [Google Scholar] [CrossRef]
9. Xu Y, Fan SS, Xie S, Lu M. Power quality dectection and classification in active distribution networks based on improved empiricial wavelet transform and disperson entropy. CSEE J Power Energy Syst. 2020;8(6):1646–58. [Google Scholar]
10. Leonowicz Z, Lobos T. Power quality evaluation using advanced spectrum estimation methods. In: 2006 International Conference on Power System Technology; 2006 Oct 22–26; Chongqing, China. p. 1–6. doi:10.1109/ICPST.2006.321955. [Google Scholar] [CrossRef]
11. Wang N, Sun M, Xi X. Identification of power quality disturbance characteristic based on deep learning. Electr Power Syst Res. 2024;226(3):109897. doi:10.1016/j.epsr.2023.109897. [Google Scholar] [CrossRef]
12. Narendra Babu P. Adaptive grid-connected inverter control schemes for power quality enrichment in microgrid systems: past, present, and future perspectives. Electr Power Syst Res. 2024;230(3):110288. doi:10.1016/j.epsr.2024.110288. [Google Scholar] [CrossRef]
13. Shao H, Henriques R, Morais H, Tedeschi E. Power quality monitoring in electric grid integrating offshore wind energy: A review. Renew Sustain Energy Rev. 2024;191:114094. doi:10.1016/j.rser.2023.114094. [Google Scholar] [CrossRef]
14. Hołdyński G, Skibko Z, Firlit A, Walendziuk W. Analysis of the impact of a photovoltaic farm on selected parameters of power quality in a medium-voltage power grid. Energies. 2024;17(3):623. doi:10.3390/en17030623. [Google Scholar] [CrossRef]
15. Tian Z. Analysis and research on chaotic dynamics behaviour of wind power time series at different time scales. J Ambient Intell Humaniz Comput. 2023;14(2):897–921. doi:10.1007/s12652-021-03343-1. [Google Scholar] [CrossRef]
16. Yao L, Wang W, Cai W, Liu J. Storage size determination for grid-connected wind power system based on power spectral density analysis. J Clean Prod. 2021;325(2):129247. doi:10.1016/j.jclepro.2021.129247. [Google Scholar] [CrossRef]
17. Qing X, He W, Zhou M, Du W. Quantifying fluctuations for dynamical power systems with stochastic excitations: a power spectral density-based method. Chaos. 2023;33(5):053113. doi:10.1063/5.0147018. [Google Scholar] [PubMed] [CrossRef]
18. Ayon JJ, Barocio E, Cabrera IR, Betancourt R. Identification of coherent areas using a power spectral density algorithm. Electr Eng. 2018;100(2):1009–19. doi:10.1007/s00202-017-0564-9. [Google Scholar] [CrossRef]
19. Nasab MA, Al-Shibli WK, Zand M, Ehsan-maleki B, Padmanaban S. Charging management of electric vehicles with the presence of renewable resources. Renew Energy Focus. 2024;48(3):100536. doi:10.1016/j.ref.2023.100536. [Google Scholar] [CrossRef]
20. Azimi Nasab M, Ali Dashtaki M, Ehsanmaleki B, Zand M, Azimi Nasab M, Sanjeevikumar P. LFC of smart, interconnected power system in the presence of renewable energy sources using coordinated control design of hybrid electric vehicles. Renew Energy Focus. 2024;50(1):100609. doi:10.1016/j.ref.2024.100609. [Google Scholar] [CrossRef]
21. Karafotis PA, Georgilakis PS. Power quality monitoring and evaluation in power systems under non-stationary conditions using wavelet packet transform. High Volt. 2019;4(3):186–96. doi:10.1049/hve.2019.0062. [Google Scholar] [CrossRef]
22. Chen Y, Tang Z, Weng X, He M, Zhang G, Yuan D, et al. A novel approach for evaluating power quality in distributed power distribution networks using AHP and S-transform. Energies. 2024;17(2):411. doi:10.3390/en17020411. [Google Scholar] [CrossRef]
23. Karakaya O, Balci ME, Hocaoglu MH. Minimization of voltage harmonic distortion of synchronous generators under non-linear loading via modulated field current. Energies. 2023;16(4):1789. doi:10.3390/en16041789. [Google Scholar] [CrossRef]
24. Merabet Boulouiha H, Khodja M, Rahiel D, Allali A, Kaddour F, Denaï M. Power quality enhancement in electricity grids with wind energy using multicell converters and energy storage. J Renew Sustain Energy. 2019;11(1):013302. doi:10.1063/1.5043292. [Google Scholar] [CrossRef]
25. Guo Y, Wang Q, Zhang D, Yu D, Yu J. A stochastic-process-based method for assessing frequency regulation ability of power systems with wind power fluctuations. J Environ Inform. 2018;32(1):45–54. doi:10.3808/jei.201800394. [Google Scholar] [CrossRef]
26. Lin BR, Hou YL, Chiang HK. Implementation of a three-level rectifier for power factor correction. IEEE Trans Power Electron. 2000;15(5):891–900. doi:10.1109/63.867678. [Google Scholar] [CrossRef]
27. Tayjasanant T, Wang W, Li C, Xu W. Interharmonic-flicker curves. IEEE Trans Power Deliv. 2005;20(2):1017–24. doi:10.1109/TPWRD.2004.838639. [Google Scholar] [CrossRef]
28. Wen C, Zhang B, Dai Y, Wang W, Xie W, Du Q. The correlation between the power quality indicators and entropy production characteristics of wind power + energy storage systems. Energy Eng. 2024;121(10):2961–79. doi:10.32604/ee.2024.041677. [Google Scholar] [CrossRef]
29. Wen C, Wang Q, Cao Y, Zhang L, Wang W, Zhang B, et al. Correlation analysis of wind turbine temperature rise and exergy efficiency based on field-path coupling. Energy Eng. 2023;120(7):1603–19. doi:10.32604/ee.2023.027074. [Google Scholar] [CrossRef]
30. Hong X, Tian L, Yin X, Xu M, Han L, Liu X. Influence of large-scale distributed photovoltaic access on harmonic characteristics of distribution network. J Phys: Conf Ser. 2023;2592(1):012076. doi:10.1088/1742-6596/2592/1/012076. [Google Scholar] [CrossRef]
31. García H, Segundo J, Madrigal M. Harmonic analysis of power systems including thyristor-controlled series capacitor (TCSC) and its interaction with the transmission line. Electr Power Syst Res. 2014;106(3):151–9. doi:10.1016/j.epsr.2013.08.013. [Google Scholar] [CrossRef]
32. Zhang Y, Sun H, Tan J, Li Z, Hou W, Guo Y. Capacity configuration optimization of multi-energy system integrating wind turbine/photovoltaic/hydrogen/battery. Energy. 2022;252(7):124046. doi:10.1016/j.energy.2022.124046. [Google Scholar] [CrossRef]
33. Spunei E, Piroi I, Protea B, Piroi F. The power factor and the upper harmonics. J Phys: Conf Ser. 2021;1781(1):012037. doi:10.1088/1742-6596/1781/1/012037. [Google Scholar] [CrossRef]
Cite This Article
 Copyright © 2025 The Author(s). Published by Tech Science Press.
This work is licensed under a Creative Commons Attribution 4.0 International License , which permits unrestricted use, distribution, and reproduction in any medium, provided the original work is properly cited.
 Downloads
 Citation Tools