
 Submit a Paper
 Propose a Special lssue
 Open Access
ARTICLE

Energy-Efficient Air Conditioning System with Combined a Ceiling Fan for Thermal Comfort in an Office
1 Graduate Institute of Precision Manufacturing, National Chin-Yi University of Technology, Taichung, 41170, Taiwan
2 Department of Refrigeration, Air Conditioning and Energy Engineering, National Chin-Yi University of Technology, Taichung, 41170, Taiwan
3 Department of Refrigeration and Air Conditioning Engineering, Politeknik Negeri Bandung, Bandung, 40559, Indonesia
* Corresponding Author: Fujen Wang. Email:
Energy Engineering 2025, 122(5), 1771-1787. https://doi.org/10.32604/ee.2025.062209
Received 12 December 2024; Accepted 24 February 2025; Issue published 25 April 2025
 View Full Text
 Download PDF
Abstract
Heating, Ventilation, and Air Conditioning (HVAC) systems are critical for maintaining thermal comfort in office environments which also crucial for occupant well-being and productivity. This study investigates the impact of integrating ceiling fans with higher air conditioning setpoints on thermal comfort and energy efficiency in office environments. Field measurements and questionnaire surveys were conducted to evaluate thermal comfort and energy-saving potential under varying conditions. Results show that increasing the AC setpoint from 25°C to 27°C, combined with ceiling fan operation, reduced power consumption by 10%, achieving significant energy savings. Survey data confirmed that 85% of participants reported consistent thermal sensations across all conditions, with ceiling fans effectively compensating for higher setpoints through enhanced air circulation. CFD simulations revealed that medium-speed ceiling fan operation produced the most uniform airflow distribution, with an average air velocity of 0.45 m/s, and minimized temperature variations, ensuring balanced thermal conditions. Temperature analysis showed a reduction in hotspots and cold zones, maintaining an average temperature deviation of less than ±0.5°C. Predicted Mean Vote (PMV) evaluations at a 27°C setpoint indicated improved thermal comfort, with average PMV values around −0.3, corresponding to a “neutral” thermal sensation. These findings demonstrate the effectiveness of integrating ceiling fans with HVAC systems in achieving energy efficiency and occupant comfort, offering a sustainable approach to reducing AC energy consumption in office environments.Keywords
Most people, especially office workers, spend the majority of their time indoors, making thermal comfort a critical factor for productivity and well-being. Air conditioning systems play a central role in achieving this comfort, but they are the highest contributors to a building’s energy consumption [1]. Effective control of HVAC systems in office buildings is vital for maintaining human comfort and productivity [2]. ASHRAE Standard 55 [3] provides comprehensive guidelines on thermal environmental conditions, defining thermal comfort as a subjective state of satisfaction with the thermal environment. Six key parameters influence thermal comfort: air velocity, air temperature, mean radiant temperature, and relative humidity (environmental parameters), as well as metabolic rate and clothing insulation (personal parameters). Achieving thermal comfort typically involves cooling strategies such as lowering temperature [4] or increasing air velocity for a “wind chill” effect [5].
Thermal comfort is often assessed through questionnaire surveys and field studies. For instance, a study involving 20 students in a classroom found significant satisfaction levels with thermal comfort when ceiling fans were used [6,7]. Similar investigations in office buildings revealed the importance of outdoor air temperature and velocity, emphasizing careful window control strategies to maintain comfort [8]. Standards like ANSI/ASHRAE 55-2017 and EN 15251:2007 are commonly referenced for evaluating thermal comfort [9]. Recent studies have observed notable differences in thermal comfort preferences between males and females, though these differences are often considered minor. For instance, the preferred comfort temperature for females is approximately 24.0°C, while for males, it is 23.2°C [10–14]. Other research, such as that by T.T. Chow [15], emphasizes how air velocity affects thermal sensation and comfort levels.
Buildings consume 72% of total electricity, with HVAC systems accounting for 40% of this consumption [16,17]. Adjusting thermostat setpoints by even small increments can yield substantial energy savings, such as 27% energy reduction achieved by extending the setpoint by 2.8°C [18]. Studies by Aghniaey et al. [19] and Shan et al. [20] highlight methods for reducing energy consumption, including temperature resets and coupling CFD with building energy modeling. Furthermore, thermal comfort optimization can offer energy-saving through deep Q learning, and it was tested in a classroom [21]. CFD has emerged as a powerful tool for analyzing and optimizing thermal comfort in indoor environments. It offers cost-effective solutions compared to extensive field measurements, allowing for detailed analysis of parameters like PMV values and air velocity distributions [22]. Studies by Oh et al. [23], Mohamed Kamar et al. [24], and Omrani et al. [25] validate CFD’s utility in improving thermal comfort through hybrid ventilation systems, smart window-integrated designs, and other innovative approaches.
Ceiling fans are widely recognized as an effective and energy-efficient solution for enhancing thermal comfort. They improve air velocity, create uniform temperature distribution, and enhance convective heat transfer around the body [26–29]. Studies, such as those by Alizadeh and Sadrameli demonstrate how ceiling fan-assisted ventilation systems improve airflow and temperature distribution. Ceiling fans also offer a low-energy cooling strategy, significantly contributing to occupant comfort in working environments [30]. Combining traditional HVAC systems with natural or mechanical ventilation strategies enhances thermal comfort and energy efficiency [31]. For example, Zhang et al. [32] found that sidewall supply and return configurations improved indoor thermal comfort by up to 36%. Yang et al. [33] demonstrated the effectiveness of ceiling fans in reducing vertical temperature differences during heating. Additionally, Gupta et al. [34] showed that automatic ceiling fans offer comparable comfort to manual ones while being more energy-efficient. Innovative fan-based cooling strategies continue to evolve. Suresh Bhuvad et al. [35] recommended table fans over ceiling fans during heat waves, while Li et al. [36] observed that high-level fan settings improved air velocity and reduced CO2 levels. Guo et al. [37] found that fans enabled higher radiant surface temperatures without compromising comfort, allowing for more energy-efficient HVAC operation. Hasama et al. [38] demonstrated that ceiling fans reduced energy consumption in low-energy buildings by increasing air movement and enabling higher room air temperatures.
While prior research has investigated HVAC control strategies to enhance thermal comfort and energy efficiency, the effects of different duty cycling modes on long-term energy consumption and occupant comfort in office buildings remain underexplored. Notably, there is limited research on the dynamic interactions between HVAC systems and occupant comfort in hot and humid climates, such as Taiwan, where achieving a balance between energy efficiency and thermal comfort poses unique challenges. Taiwan was chosen as the case study location due to its subtropical climate, characterized by high temperatures and humidity for most of the year, which necessitates the extensive use of air conditioning systems in office environments [39]. This reliance highlights the urgency of developing energy-efficient strategies that reduce energy consumption without compromising occupant well-being. Furthermore, Taiwan’s proactive approach to energy conservation and sustainability—reflected in government policies [40] promoting green building practices and energy-efficient technologies—makes it an ideal setting to test innovative solutions, such as integrating air conditioning systems with ceiling fans. These solutions aim to enhance thermal comfort while simultaneously reducing energy usage.
This study’s findings have broad implications, extending beyond Taiwan to other regions with similar climatic conditions, particularly in Southeast Asia, where the demand for energy-saving measures in cooling systems continues to grow. While CFD simulations are widely used to model airflow and thermal conditions, few studies have combined these simulations with field measurements and questionnaire surveys. Such integration is essential for improving predictive accuracy and optimizing strategies for both energy efficiency and occupant comfort. This study bridges this gap by offering a comprehensive analysis of duty cycling modes in office AC systems, integrating CFD simulations with empirical data and surveys to explore how these methods can be refined for thermal comfort, energy savings, and sustainability. Additionally, the study examines the effectiveness of combining ceiling fans with elevated air conditioning setpoints, revealing a practical approach to balancing energy use and occupant satisfaction in hot and humid environments.
The investigated office is located on the second floor of the College of Engineering building on campus in central Taiwan, which experiences a subtropical climate with hot and humid conditions. The office, shown in Fig. 1, is a typical faculty office designed for academic use and has internal dimensions of 5.3 m in length, 3.3 m in width, and 3.5 m in height. The office has a split-type air conditioning (AC) system installed on the wall, with a cooling capacity of 3.1 kW. This system serves as the primary cooling device for maintaining indoor thermal comfort. Additionally, a ceiling fan is installed in the central part of the room to enhance airflow circulation and distribute temperature and velocity more evenly across the office. The ceiling fan is compact with dimensions of 496 mm × 421 mm in diameter. Other office features include two external windows that provide natural light and ventilation when required and internal windows that connect to adjacent spaces. There are two fluorescent lamps for artificial lighting, multiple pieces of furniture, a computer workstation, and three occupants who use the space during the study period. These elements collectively contribute to the office thermal environment, influencing both the thermal comfort of the occupants and the energy performance of the HVAC system. The configuration of the office, with its layout of cooling and ventilation devices, human activity, and heat-generating equipment, provides a practical setting to investigate the interplay between energy efficiency and thermal comfort in a real-world academic workspace.
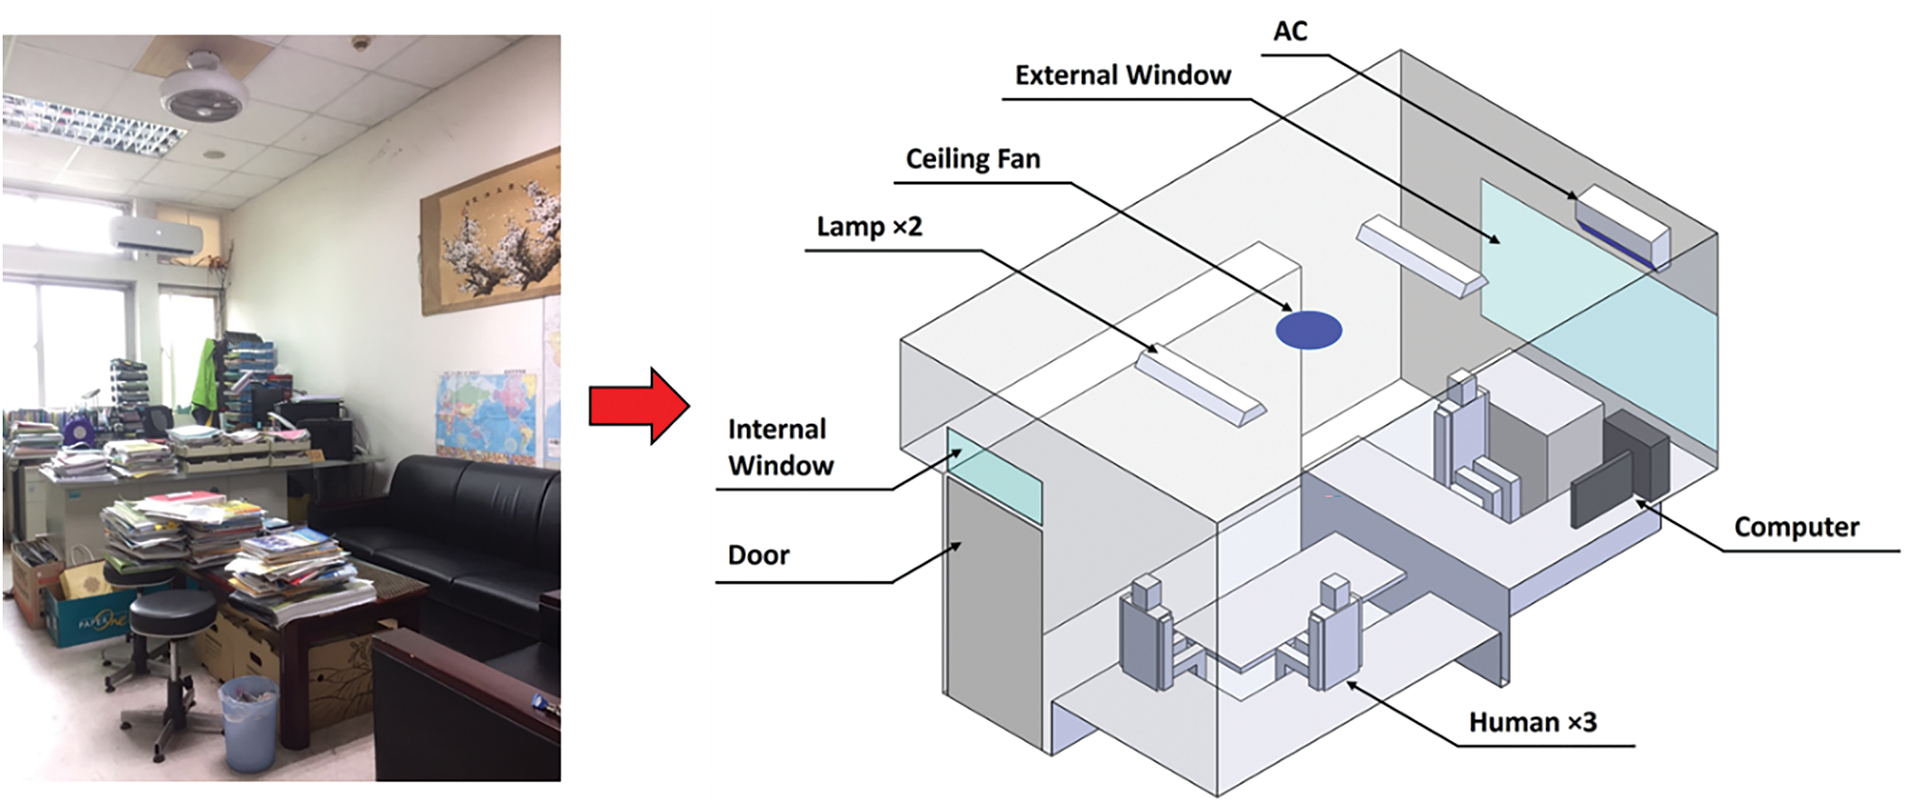
Figure 1: The investigated office room and geometry model for CFD simulation
During the measurement period, the ambient temperature remained relatively stable, with an hourly average of 28.9°C and a relative humidity of 75.3%. These consistent external conditions provided a reliable baseline to evaluate the indoor environment and the performance of the HVAC system under different operational modes.
Indoor environment parameters measured included temperature, air velocity, humidity, and power consumption. These measurements were essential to assess thermal conditions, airflow distribution, moisture levels, and energy efficiency. Data collection was divided into two stages. In Stage 1, the AC system was set to a temperature of 25°C without operating the ceiling fan, following the ASHRAE Standard 55 for thermal comfort zones. In Stage 2, the AC setpoint was increased to 27°C, and the ceiling fan was operated at three speeds: low, medium, and high. Data were recorded over 9 h during typical office hours for both stages to ensure consistency and accuracy. Fig. 2 depicts the measurement and questionnaire survey process.
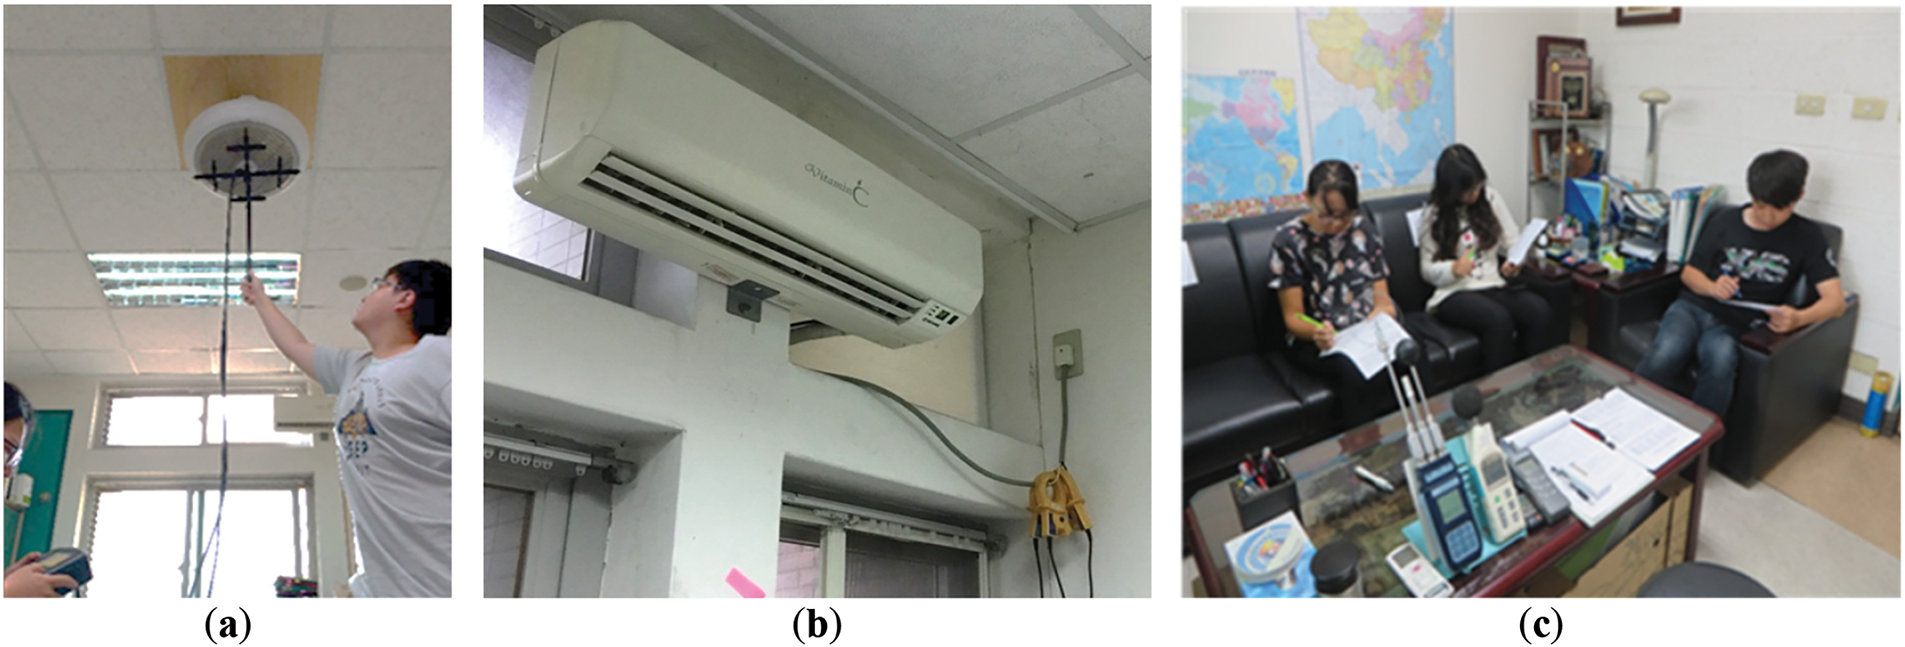
Figure 2: The experimental setup, (a) air velocity measurement, (b) power consumption measurement, (c) thermal comfort instrument and questionary survey
Measurements were taken using high-precision instruments. All measurement instruments were calibrated annually to ensure their accuracy and reliability. Calibration was performed according to the guidelines and industry standards, ensuring the instruments provided precise readings throughout the measurement process. This regular calibration process helped minimize potential errors and maintained the integrity of the data collected during the field measurements. The Delta OHM HD 32.3 was employed to measure black-globe temperature, air temperature, humidity, and air velocity, with accuracies ranging from ±0.2 m/s for velocity to ±2.0% for relative humidity. The TSI 9565P was used for higher velocity measurements, capable of recording air velocity up to 50 m/s with an accuracy of ±3%. The airflow measurement is shown in Fig. 2a. Noise levels were measured using the TES 1357, while energy consumption was monitored with the HIOKI 3169-20, ensuring accurate voltage and current readings (Fig. 2b). The detailed specifications of the measurement equipment are shown in Table 1.

A comprehensive questionnaire survey was conducted simultaneously with on-site measurements to assess the thermal comfort of the office occupants (Fig. 2c). The survey involved 57 participants, all of whom were regular office occupants. The objective of the survey was to gather subjective feedback from the occupants regarding their perception of the thermal environment during the data collection period. This approach allowed for the collection of objective measurements and subjective assessments, offering a more holistic understanding of the thermal comfort conditions in the office.
The questionnaire was designed following the ASHRAE Standard 55, a widely recognized guideline for evaluating thermal comfort. It consisted of two main sections. The first section gathered general demographic and situational information, including the participants’ age, gender, health condition, and clothing and activity levels. These factors significantly influence thermal comfort, impacting an individual’s heat retention and personal perception of temperature. Understanding these variables helped contextualize the participants’ thermal comfort responses.
The second section of the questionnaire addressed the thermal environment itself. Participants were asked to provide thermal sensation votes using the ASHRAE 7-point scale, ranging from “cold” to “hot”, a common method for assessing personal comfort with indoor temperature. In addition to thermal sensation, the questionnaire also asked about air movement sensation, specifically whether the airflow was perceived as too little, just right, or too much. Lastly, participants were asked to rate the overall acceptability of the indoor environment, ranging from “very uncomfortable” to “very comfortable”. The questionnaire survey point is shown in Table 2.

This dual approach, combining objective environmental measurements with subjective occupant surveys, thoroughly assessed the thermal comfort conditions within the office. By analyzing the measurable parameters and the occupants’ personal experiences, the study offered a more comprehensive evaluation of the factors contributing to thermal comfort in the workspace.
The CFD simulation of the office environment was conducted using ANSYS Fluent Workbench 2020 R2 to analyze airflow distribution, temperature profiles, and thermal comfort under varying air-conditioning and ceiling fan settings. The primary objective was to replicate field measurement conditions and evaluate the combined impact of HVAC and ceiling fan operations on energy efficiency and occupant comfort. The geometry model, shown in Fig. 1, was developed based on the actual office layout, including workstations, air-conditioning vents, and ceiling fans. Key parameters such as airflow patterns, temperature distribution, and thermal comfort indices, including PMV were analyzed in detail.
The evaluation process of the environmental conditions in the office followed four distinct stages, each representing different operational settings of the air conditioning and ceiling fan, as shown in Table 3. These stages represent variations in the air conditioning setpoint and fan speeds, enabling the study to assess how different thermal conditions would affect the overall comfort of the occupants. Stage 1 air conditioning was set to 25°C without the ceiling fan operation. In contrast, in the subsequent stages, the setpoint was increased to 27°C and ceiling fan operation was introduced at low, medium, and high speeds. These stages allowed for comparing the effects of varying airflow and temperature on occupant comfort.

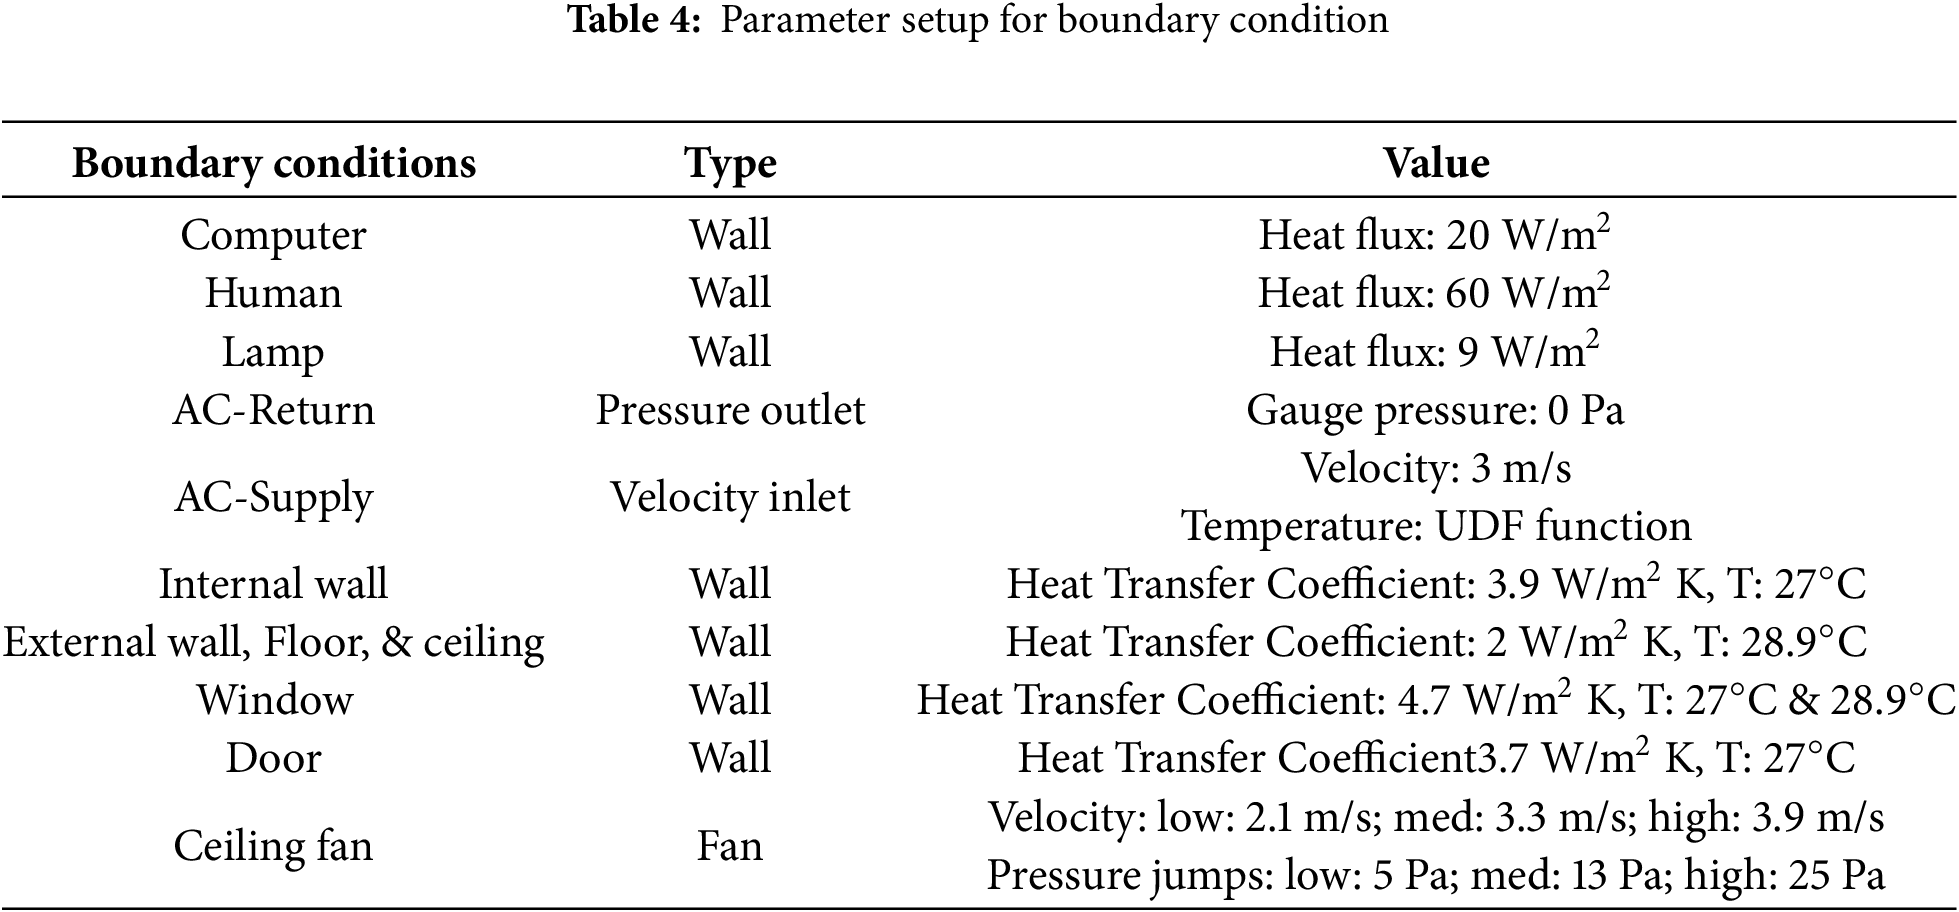
The boundary conditions were derived from the field measurements, which provided accurate data on air velocity from the ceiling fan, air temperature from the air conditioning system, and ambient conditions. These conditions were essential for modeling the airflow and temperature distribution within the office. The heat sources within the room, such as the seated occupants, lamps, and electronic devices, were modeled to represent their impact on the overall thermal environment. Each heat source was assigned a specific heat flux: 60 W/m2 for the seated people, 70 W for each lamp, and 20 W/m2 for the monitor and CPU.
The internal walls, windows, and doors were modeled with specific heat transfer coefficients to account for the convective heat transfer between the indoor environment and the external conditions. The external walls had a heat transfer coefficient of 2 W/m2 K, with an ambient temperature of 28.9°C. In contrast, the internal surfaces had slightly different heat transfer coefficients, reflecting their exposure to the controlled indoor temperature.
The ceiling fan was modeled with varying fan speeds (low, medium, and high) to simulate the effects of air movement on thermal comfort. Each fan speed was associated with a specific air velocity (2.1 m/s for low, 3.3 m/s for medium, and 3.9 m/s for high) and corresponding pressure jumps (5, 13, and 25 Pa, respectively). The fan’s contribution to improving thermal comfort by promoting air circulation and mitigating heat buildup in the room was a key focus of the simulation. This simulation served as a powerful tool for analyzing airflow patterns, temperature distribution, and the overall impact of the ceiling fan and air conditioning settings on thermal comfort in the office space. The detailed boundary conditions are shown in Table 4.
Proper solver and parameter setup in ANSYS Fluent is critical to achieving accurate and reliable CFD simulations. A pressure-based solver was chosen for this study due to its computational efficiency and stability, making it suitable for simulating airflow and heat transfer within the office environment. The turbulence effects were modeled using the RNG k-epsilon turbulence model, which offers improved accuracy for flows with high strain rates and recirculation zones. The office setup included three seated occupants, representing typical conditions for airflow and thermal analysis. To simulate airflow and temperature distribution, a steady-state approach was adopted. The governing equations solved during the simulation include the continuity equation, momentum equation, and energy equation, as follows:
The conservation of mass is described by the continuity equation, as shown in Eq. (1). This equation is applicable for both compressible and incompressible flows and accounts for the mass added to the continuous phase from dispersed phases (e.g., vaporization of liquid droplets) and any user-defined mass sources.
The conservation of momentum in an inertial (non-accelerating) reference frame is expressed in Eq. (2). It accounts for the effects of p static pressure,
The thermal energy transfer within the fluid domain is governed by the energy equation, shown in Eq. (3). It includes terms for convection, diffusion, and external heat sources or sinks, capturing the conductive and convective heat transfer within the domain. where,
The RNG k-ε turbulence model was employed to simulate airflow and analyze the ventilation effects of various design choices. The airflow turbulence model is provided in Eq. (4).
In this context,
The Semi-Implicit Method for Pressure-Linked Equations (SIMPLE) algorithm was used for pressure-velocity coupling. This algorithm is widely recognized for its robustness and effectiveness in handling steady-state flows, ensuring numerical stability during the simulation. The mesh was refined in critical areas, such as around the occupants, air supply outlets, and ceiling fan region, to capture detailed flow dynamics. The simulation was executed for 5000 iterations, with convergence criteria defined by residuals reaching values between 10−4 to 10−6. This ensured the numerical solution met the required accuracy to analyze airflow patterns, temperature distribution, and thermal comfort effectively.
During the simulation setup, a grid independence test was conducted to determine the optimal mesh density that balances accuracy and computational efficiency. Mesh density directly affects the precision of simulation results; a finer mesh generally provides higher accuracy but requires significantly more computational resources and time. In this study, three different mesh densities were tested: coarse (583,267 elements), medium (1,460,631 elements), and fine (3,522,215 elements). The results from these simulations were validated against field measurements at four specific points, where points 1 and 2 measured temperature, and points 3 and 4 measured air velocity, as shown in Fig. 3.
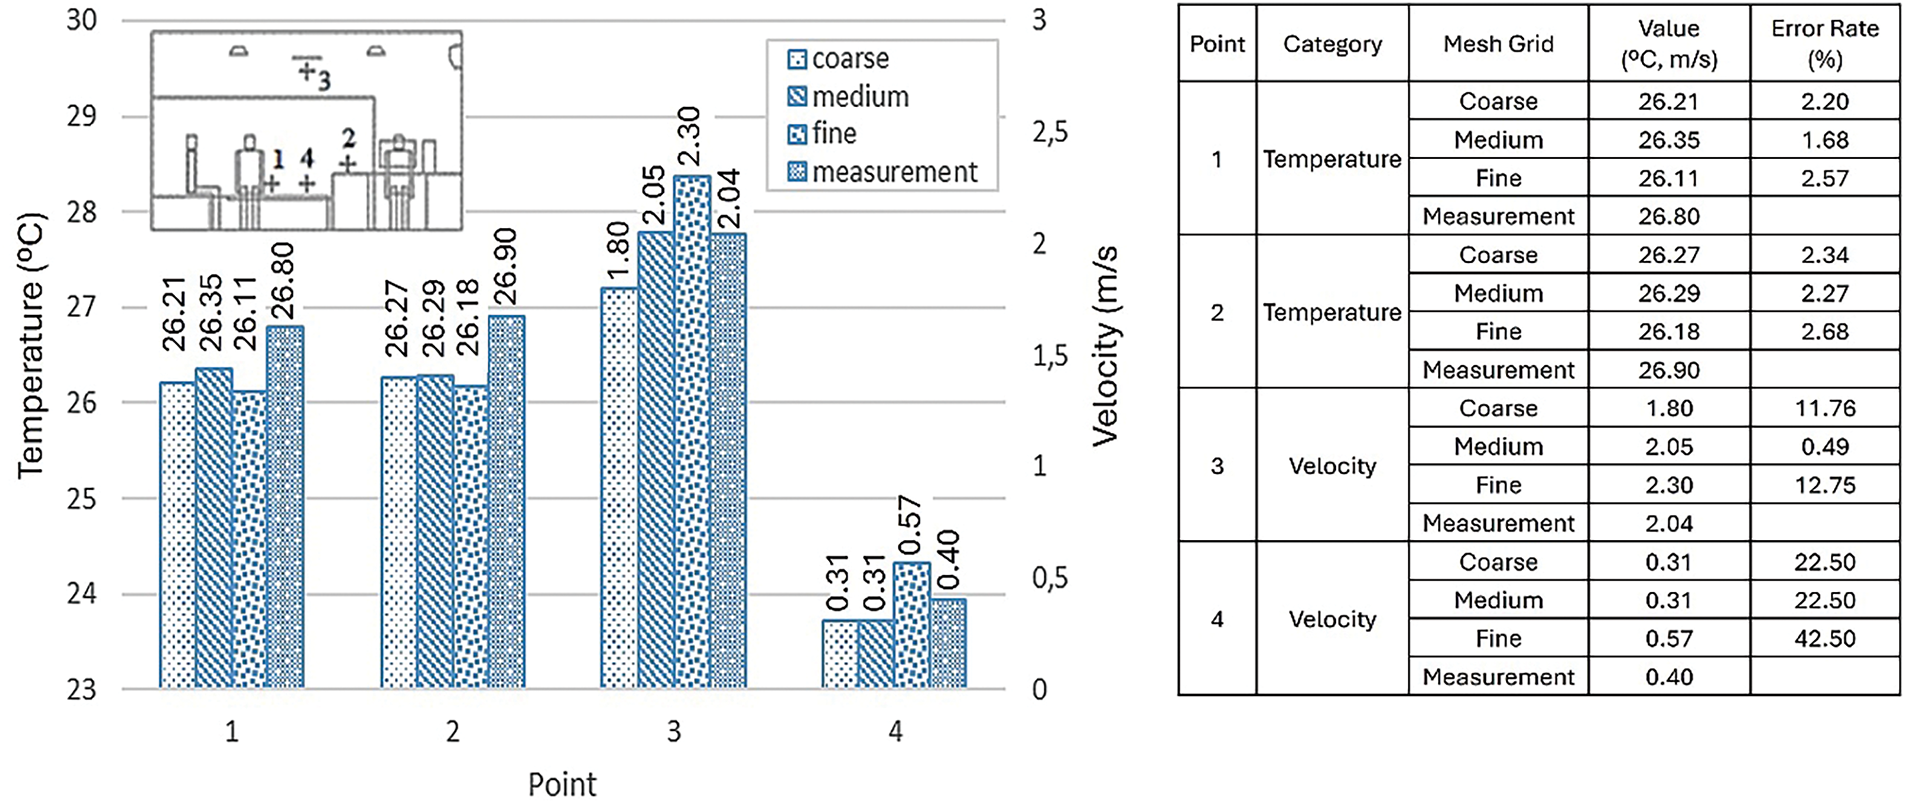
Figure 3: Validation of between measurement and simulation
The validation results for temperature measurements at points 1 and 2 showed that all three mesh configurations closely matched the field data. However, the medium mesh yielded the most accurate results, with error rates of 1.68% and 2.27%, respectively. The coarse mesh had slightly higher error rates, while the fine mesh, despite its higher element count, also exhibited slightly larger discrepancies compared to the medium mesh. This suggests that the medium mesh strikes a balance between accuracy and efficiency for temperature predictions.
For air velocity measurements at points 3 and 4, the medium mesh also outperformed the other configurations. It provided the smallest error rates, such as 0.49% at point 3, closely aligning with the field data. In contrast, the fine mesh, despite its higher density, demonstrated significant errors at these points, with deviations as high as 12.75% and 42.50%, likely due to over-refinement that can lead to numerical instability. The coarse mesh performed moderately but was less accurate than the medium mesh.
Based on these results, the medium mesh was selected for subsequent simulations. It offered the best balance between accuracy and computational efficiency, consistently providing results that closely aligned with field measurements for both temperature and air velocity. This choice ensures reliable simulation outcomes while avoiding unnecessary computational costs.
Fig. 4 illustrates the power consumption patterns of the air conditioning system at two different set points: 25°C and 27°C. The data shows that when the temperature is set to 25°C (represented by the blue line), the air conditioning system operates continuously for approximately six hours before reaching the set point. At this stage, the compressor shuts down, resulting in a temporary drop in power consumption. After a 20-min pause, the compressor restarts, resuming operation to maintain the temperature.
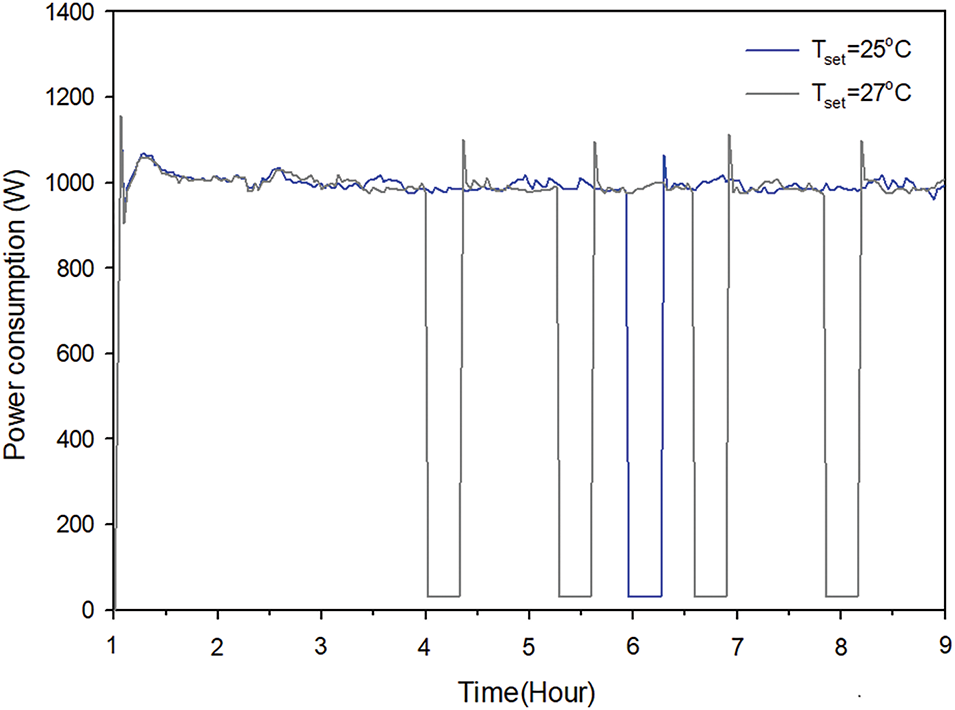
Figure 4: Comparison of power consumption variation
In contrast, when the set point is adjusted to 27°C (represented by the black line), the compressor shuts down four times throughout the period as the system more easily reaches the higher set point. It indicates that with a higher set point, the air conditioning system does not need to run as continuously, leading to more frequent compressor shutdowns.
The power consumption at the lower set point (25°C) averages around 1.0 kW, while at the higher set point (27°C), the consumption reduces to approximately 0.9 kW. This data suggests that a 10% reduction in energy consumption can be achieved by increasing the temperature set point by 2°C. This finding highlights the potential for energy savings in air conditioning systems by optimizing the set point. It is a cost-effective strategy for reducing overall power usage while maintaining reasonable thermal comfort.
The results from the questionnaire surveys and PMV-PPD analysis highlight the potential for ceiling fans to enhance thermal comfort while enabling energy-saving strategies in indoor environments. Fig. 5a shows that the thermal sensation votes during Stage 1 (Tset = 25°C, no ceiling fan) and Stage 2 (Tset = 27°C, with a ceiling fan) were quite similar. In both stages, most participants reported feeling “neutral” or “slightly cool”, suggesting that the 2°C increase in the air conditioning setpoint did not significantly impact thermal perception. This consistency in comfort levels can be attributed to the ceiling fan’s ability to generate airflow, compensating for the higher temperature. Fig. 5b further supports this observation, showing that participants in Stage 2 reported a higher number of “moderate” airflow sensation votes than Stage 1. It indicates that the use of the ceiling fan noticeably improved air circulation, thereby enhancing thermal comfort even at a higher temperature setpoint.

Figure 5: Questionary survey. (a) thermal sensation votes; (b) airflow sensation votes
The PMV-PPD analysis, shown in Fig. 6, reinforces these findings by illustrating that thermal conditions remained acceptable in both stages. Most participants rated their thermal sensation as “neutral”, with a small number feeling “slightly cool” in Stage 2, likely due to the fan’s airflow effect. Importantly, the percentage of dissatisfied participants (PPD) remained below 10% in both stages, within the acceptable threshold for indoor thermal comfort. This demonstrates that using a ceiling fan not only maintains comfort but also reduces air conditioning energy consumption by allowing a higher temperature setpoint. These results underline the practical feasibility of combining ceiling fans with setpoint adjustments as a sustainable approach to achieving energy efficiency and occupant comfort in office environments. This strategy is particularly beneficial in reducing energy costs while promoting a thermally comfortable and acceptable indoor environment.

Figure 6: Thermal comfort calculation of field measurement and questionary survey
3.3 Airflow and Temperature Distribution
The simulation results in Fig. 7 illustrate the air velocity distribution in the room under four cases: without a fan and with low-speed, medium-speed, and high-speed ceiling fan settings. Without the fan (Fig. 7a), the airflow in the room is mostly stagnant, except for areas near the air conditioning (AC) supply, where the velocity reaches up to 1.8 m/s. It indicates that, without additional airflow support, the air circulation in the room is uneven, with localized high-speed air near the AC supply but minimal air movement elsewhere.

Figure 7: Velocity vector under different temperature setpoints and fan mode. (a) 25°C Without-fan; (b) 27°C Low-speed fan; (c) 27°C Medium-speed fan; (d) 27°C High-speed fan
When the ceiling fan operates at a low-speed setting (Fig. 7b), the airflow improves, with an average air velocity of 0.3 m/s across the room. This setup also reduces the intensity of the high-velocity air near the AC supply, resulting in a more balanced airflow pattern. The medium-speed fan setting (Fig. 7c) further enhances the airflow distribution and magnitude, achieving an average velocity of approximately 0.45 m/s. This setting provides the most uniform air velocity throughout the room, representing the optimal balance between airflow distribution and magnitude. On the other hand, the high-speed fan setting (Fig. 7d) increases the average air velocity to 0.6 m/s, slightly higher than the medium-speed setting. However, it introduces a small localized area in the center of the room where the air velocity reaches up to 1.5 m/s, potentially causing discomfort due to excessive airflow in that region. These results highlight that while higher fan speeds improve airflow magnitude, medium-speed operation offers the best balance between velocity and uniform distribution, making it the most favorable option for ensuring thermal comfort.
Fig. 8 illustrates the temperature distribution in a room under different fan operation scenarios, highlighting the effect of ceiling fan speeds on temperature uniformity. In Fig. 8a, the simulation results for a setpoint temperature of 25°C without fan operation show uneven temperature distribution, with a notable region of lower temperature near the air conditioning vents. This localized cooling results in thermal discomfort for occupants in those areas while leaving other parts of the room relatively warmer. This lack of uniformity underscores the limitations of relying solely on air conditioning without additional airflow mechanisms.

Figure 8: Temperature distribution under different temperature setpoints and fan mode. (a) 25°C Without-fan; (b) 27°C Low-speed fan; (c) 27°C Medium-speed fan; (d) 27°C High-speed fan
Fig. 8b–d displays the temperature distribution for scenarios with a setpoint temperature of 27°C and low, medium, and high-speed fan operations, respectively. The introduction of a ceiling fan significantly improves temperature distribution across the room. The low-speed fan (Fig. 8b) begins to mitigate the localized cold spots by redistributing the cool air more evenly, though some variation in temperature remains. The medium-speed fan (Fig. 8c) achieves a notably balanced temperature profile, minimizing hotspots and cold zones effectively. It offers an optimal balance of uniformity and comfort at this setpoint. The high-speed fan (Fig. 8d) also ensures a relatively even temperature distribution but introduces a slightly higher mixing effect that may result in minor variations. Overall, using a ceiling fan at any speed helps to smooth out temperature gradients in the room, enhancing occupant comfort while enabling energy savings by allowing for a higher temperature setpoint without compromising thermal comfort. These results emphasize the importance of ceiling fans in achieving a thermally comfortable and energy-efficient indoor environment.
3.4 Thermal Comfort PMV Distribution
Fig. 9 presents the PMV distribution in a room under varying temperature setpoints and ceiling fan speeds, emphasizing the combined impact of air velocity and temperature on thermal comfort. According to ASHRAE Standard 55, PMV values indicate occupants’ thermal sensations, ranging from cold (−3) to hot (+3). The simulation without a fan (Fig. 9) at a 25°C setpoint shows a localized area where the PMV value drops to −3, indicating excessive cold. This extreme value corresponds to the uneven temperature distribution and high air velocity near the air conditioning outlet, as seen in Figs. 7 and 8. Such conditions create discomfort for occupants in the coldest zones.

Figure 9: PMV distribution under different temperature setpoints and fan mode. (a) 25°C Without fan; (b) 27°C Low-speed fan; (c) 27°C Medium-speed fan; (d) 27°C High-speed fan
In contrast, simulations with ceiling fans at a 27°C setpoint exhibit significantly improved PMV distributions. The low-speed fan (Fig. 9b) achieves the most balanced thermal comfort, with an average PMV value of −0.3, which aligns closely with the “neutral” thermal sensation in ASHRAE’s scale. The medium-speed (Fig. 9c) and high-speed fans (Fig. 9d) result in slightly cooler average PMV values of around −1, indicating a “slightly cool” sensation. These results highlight the ceiling fan’s critical role in enhancing thermal comfort by mitigating cold spots and distributing air more effectively, even at higher temperature setpoints. Importantly, the magnitude of air velocity from the fan influences PMV significantly, demonstrating the ceiling fan’s effectiveness as an energy-efficient solution for maintaining occupant comfort.
This study underscores the critical balance between thermal comfort, energy efficiency, and indoor airflow dynamics in optimizing air conditioning and ceiling fan operations. The simulation results demonstrate that increasing the temperature setpoint from 25°C to 27°C can reduce power consumption by approximately 10%, offering a clear pathway toward energy-efficient climate control. The integration of ceiling fans further enhances air circulation, resulting in improved temperature distribution and more uniform PMV values, essential for occupant thermal comfort.
Among the fan speed modes tested, the low-speed fan provided the most balanced thermal comfort, with a PMV value of −0.3, closely aligning with the optimal thermal comfort zone defined by ASHRAE Standard 55. Although higher-speed fan modes (medium and high) also improved airflow distribution, their diminishing returns in PMV improvements indicate that excessive fan speeds may not yield substantial comfort benefits beyond a certain point. Combining higher temperature setpoints with appropriate fan operation thus offers significant energy savings without sacrificing comfort, highlighting the importance of system optimization in achieving sustainable and effective climate control.
While the study’s reliance on short-term measurements, questionnaire surveys, and simulations provides valuable insights, it also presents limitations, such as the need for more extensive real-world validation. Despite these constraints, the findings establish a solid foundation for understanding the potential of integrating ceiling fans with higher temperature setpoints to improve both energy efficiency and thermal comfort in office environments.
Future research should investigate the long-term performance of integrated HVAC and ceiling fan systems under diverse environmental conditions, particularly in hot and humid climates such as Taiwan. It would allow for a more thorough evaluation of the sustained energy savings, occupant comfort, and system durability over extended periods. Moreover, incorporating these systems with building energy management systems could optimize operation by dynamically adjusting settings based on real-time occupancy and environmental variables, further enhancing energy savings.
Additionally, examining user preferences and developing adaptive comfort models could provide valuable insights into personalizing HVAC systems for different occupants, which would improve both energy efficiency and satisfaction. Extending this research to include different building types, regions, and climates could broaden the applicability of the findings, allowing for the adoption of these strategies in diverse environments and contributing to more sustainable and comfortable building designs.
Acknowledgement: Not applicable.
Funding Statement: The authors would like to express great appreciation for the financial support by the National Science and Technology Council under Grant No. NSTC 112-2221-E-167-017-MY3.
Author Contributions: The authors confirm contribution to the paper as follows: study conception and design: Linlan Chang, Win-Jet Luo, Fujen Wang; data collection: Linlan Chang, Indra Permana, Alya Penta Agharid; CFD modeling and validation: Bowo Yuli Prasetyo, Indra Permana; analysis and interpretation of results: Linlan Chang, Indra Permana, Bowo Yuli Prasetyo; supervision and funding acquisition: Win-Jet Luo, Fujen Wang; draft manuscript preparation: Linlan Chang, Indra Permana, Bowo Yuli Prasetyo, Alya Penta Agharid. All authors reviewed the results and approved the final version of the manuscript.
Availability of Data and Materials: Data available on request from the authors.
Ethics Approval: Not applicable.
Conflicts of Interest: The authors declare no conflicts of interest to report regarding the present study.
References
1. Pang Z, Chen Y, Zhang J, O’Neill Z, Cheng H, Dong B. Nationwide HVAC energy-saving potential quantification for office buildings with occupant-centric controls in various climates. Appl Energy. 2020;279(1):115727. doi:10.1016/j.apenergy.2020.115727. [Google Scholar] [CrossRef]
2. Tejero-González A, Esquivias PM. Personalized evaporative cooler to reduce energy consumption and improve thermal comfort in free-running spaces. Sustainability. 2019;11(22):6451. doi:10.3390/su11226451. [Google Scholar] [CrossRef]
3. ANSI/ASHRAE Standard 55. Thermal environmental conditions for human occupancy. Atlanta, GA, USA: American Society of Heating, Refrigerating, and Air-Conditioning Engineer Inc.; 2017. [Google Scholar]
4. Han J, Bae J, Jang J, Baek J, Leigh SB. The derivation of cooling set-point temperature in an HVAC system, considering mean radiant temperature. Sustainability. 2019;11(19):5417. doi:10.3390/su11195417. [Google Scholar] [CrossRef]
5. Ho SH, Rosario L, Rahman MM. Thermal comfort enhancement by using a ceiling fan. Appl Therm Eng. 2009;29(8–9):1648–56. doi:10.1016/j.applthermaleng.2008.07.015. [Google Scholar] [CrossRef]
6. Xia Y, Lin W, Gao W, Liu T, Li Q, Li A. Experimental and numerical studies on indoor thermal comfort in fluid flow: a case study on primary school classrooms. Case Stud Therm Eng. 2020;19(7):100619. doi:10.1016/j.csite.2020.100619. [Google Scholar] [CrossRef]
7. Zhang G, Zheng C, Yang W, Zhang Q, Moschandreas DJ. Thermal comfort investigation of naturally ventilated classrooms in a subtropical region. Indoor Built Environ. 2007;16(2):148–58. doi:10.1177/1420326X06076792. [Google Scholar] [CrossRef]
8. Deng X, Tan Z. Numerical analysis of local thermal comfort in a plan office under natural ventilation. Indoor Built Environ. 2020;29(7):972–86. doi:10.1177/1420326X19866497. [Google Scholar] [CrossRef]
9. Fabozzi M, Dama A. Field study on thermal comfort in naturally ventilated and air-conditioned university classrooms. Indoor Built Environ. 2020;29(6):851–9. doi:10.1177/1420326X19887481. [Google Scholar] [CrossRef]
10. Karjalainen S. Thermal comfort and gender: a literature review. Indoor Air. 2012;22(2):96–109. doi:10.1111/j.1600-0668.2011.00747.x. [Google Scholar] [PubMed] [CrossRef]
11. Molliet DS, Mady CEK. Exergy analysis of the human body to assess thermal comfort conditions: comparison of the thermal responses of males and females. Case Stud Therm Eng. 2021;25(6):100972. doi:10.1016/j.csite.2021.100972. [Google Scholar] [CrossRef]
12. Fanger P. Thermal comfort: analysis and applications in environmental engineering. New York, NY, USA: McGraw-Hill Medical; 1970. [Google Scholar]
13. Maykot JK, Rupp RF, Ghisi E. Assessment of gender on requirements for thermal comfort in office buildings located in the Brazilian humid subtropical climate. Energy Build. 2018;158(4):1170–83. doi:10.1016/j.enbuild.2017.11.036. [Google Scholar] [CrossRef]
14. Maykot JK, Rupp RF, Ghisi E. A field study about gender and thermal comfort temperatures in office buildings. Energy Build. 2018;178(113):254–64. doi:10.1016/j.enbuild.2018.08.033. [Google Scholar] [CrossRef]
15. Chow TT, Fong KF, Givoni B, Lin Z, Chan ALS. Thermal sensation of Hong Kong people with increased air speed, temperature and humidity in air-conditioned environment. Build Environ. 2010;45(10):2177–83. doi:10.1016/j.buildenv.2010.03.016. [Google Scholar] [CrossRef]
16. Cao X, Dai X, Liu J. Building energy-consumption status worldwide and the state-of-the-art technologies for zero-energy buildings during the past decade. Energy Build. 2016;128(10):198–213. doi:10.1016/j.enbuild.2016.06.089. [Google Scholar] [CrossRef]
17. Xu Z, Liu S, Hu G, Spanos CJ. Optimal coordination of air conditioning system and personal fans for building energy efficiency improvement. Energy Build. 2017;141(1):308–20. doi:10.1016/j.enbuild.2017.02.051. [Google Scholar] [CrossRef]
18. Hoyt T, Arens E, Zhang H. Extending air temperature setpoints: simulated energy savings and design considerations for new and retrofit buildings. Build Environ. 2015;88(1):89–96. doi:10.1016/j.buildenv.2014.09.010. [Google Scholar] [CrossRef]
19. Aghniaey S, Lawrence TM, Sharpton TN, Douglass SP, Oliver T, Sutter M. Thermal comfort evaluation in campus classrooms during room temperature adjustment corresponding to demand response. Build Environ. 2019;148(3):488–97. doi:10.1016/j.buildenv.2018.11.013. [Google Scholar] [CrossRef]
20. Shan X, Luo N, Sun K, Hong T, Lee YK, Lu WZ. Coupling CFD and building energy modelling to optimize the operation of a large open office space for occupant comfort. Sustain Cities Soc. 2020;60(3):102257. doi:10.1016/j.scs.2020.102257. [Google Scholar] [CrossRef]
21. Yu KH, Chen YA, Jaimes E, Wu WC, Liao KK, Liao JC, et al. Optimization of thermal comfort, indoor quality, and energy-saving in campus classroom through deep Q learning. Case Stud Therm Eng. 2021;24(2):100842. doi:10.1016/j.csite.2021.100842. [Google Scholar] [CrossRef]
22. Buratti C, Palladino D, Moretti E. Prediction of indoor conditions and thermal comfort using CFD simulations: a case study based on experimental data. Energy Proc. 2017;126:115–22. doi:10.1016/j.egypro.2017.08.130. [Google Scholar] [CrossRef]
23. Oh W, Kato S. The effect of airspeed and wind direction on human’s thermal conditions and air distribution around the body. Build Environ. 2018;141(Part 1):103–16. doi:10.1016/j.buildenv.2018.05.052. [Google Scholar] [CrossRef]
24. Mohamed Kamar H, Kamsah NB, Ghaleb FA, Idrus Alhamid M. Enhancement of thermal comfort in a large space building. Alex Eng J. 2019;58(1):49–65. doi:10.1016/j.aej.2018.12.011. [Google Scholar] [CrossRef]
25. Omrani S, Matour S, Bamdad K, Izadyar N. Ceiling fans as ventilation assisting devices in buildings: a critical review. Build Environ. 2021;201:108010. doi:10.1016/j.buildenv.2021.108010. [Google Scholar] [CrossRef]
26. Wang H, Luo M, Wang G, Li X. Airflow pattern induced by ceiling fan under different rotation speeds and blowing directions. Indoor Built Environ. 2020;29(10):1425–40. doi:10.1177/1420326X19890054. [Google Scholar] [CrossRef]
27. Alizadeh M, Sadrameli SM. Numerical modeling and optimization of thermal comfort in building: central composite design and CFD simulation. Energy Build. 2018;164(3):187–202. doi:10.1016/j.enbuild.2018.01.006. [Google Scholar] [CrossRef]
28. Lin HH. Improvement of human thermal comfort by optimizing the airflow induced by a ceiling fan. Sustainability. 2019;11(12):3370. doi:10.3390/su11123370. [Google Scholar] [CrossRef]
29. Zhai Y, Zhang Y, Zhang H, Pasut W, Arens E, Meng Q. Human comfort and perceived air quality in warm and humid environments with ceiling fans. Build Environ. 2015;90(3–4):178–85. doi:10.1016/j.buildenv.2015.04.003. [Google Scholar] [CrossRef]
30. Rissetto R, Schweiker M, Wagner A. Personalized ceiling fans: effects of air motion, air direction and personal control on thermal comfort. Energy Build. 2021;235(11):110721. doi:10.1016/j.enbuild.2021.110721. [Google Scholar] [CrossRef]
31. Park DY, Chang S. Effects of combined central air conditioning diffusers and window-integrated ventilation system on indoor air quality and thermal comfort in an office. Sustain Cities Soc. 2020;61:102292. doi:10.1016/j.scs.2020.102292. [Google Scholar] [CrossRef]
32. Zhang Y, Yu W, Li Y, Li H. Comparative research on the air pollutant prevention and thermal comfort for different types of ventilation. Indoor Built Environ. 2021;30(8):1092–105. doi:10.1177/1420326X20925521. [Google Scholar] [CrossRef]
33. Yang B, Li H, Zhou B, Li Z, Guo R, Wang F. Airflow and temperature characteristics of diffuse ceiling ventilation with ceiling fan under heating mode: an experimental study. Energy Build. 2025;329:115258. doi:10.1016/j.enbuild.2024.115258. [Google Scholar] [CrossRef]
34. Gupta A, Torriani G, Torresin S, Pistore L, Pellegatti M, Piazza L, et al. Thermal comfort and perceived air quality (PAQ) using automatic ceiling fans in residential buildings. Energy Build. 2025;330(6):115317. doi:10.1016/j.enbuild.2025.115317. [Google Scholar] [CrossRef]
35. Suresh Bhuvad S, You R, Chen Q. Evaluation of physiological and thermal comfort effectiveness of ceiling fan and table fan during a heat wave. Energy Build. 2024;322(7):114706. doi:10.1016/j.enbuild.2024.114706. [Google Scholar] [CrossRef]
36. Li L, He Y, Chen W, Ji Y, Fung JCH, Lau AKH. An integrated experimental and CFD analysis of ceiling-fan-integrated air conditioning system: indoor air quality and air velocity. Build Environ. 2024;258(8–9):111633. doi:10.1016/j.buildenv.2024.111633. [Google Scholar] [CrossRef]
37. Guo X, Wan S, Chen W, Zhang H, Arens E, Cheng Y, et al. Numerical simulation of cooling performance of radiant ceiling system interacting with a ceiling fan. Energy Build. 2023;297(10):113492. doi:10.1016/j.enbuild.2023.113492. [Google Scholar] [CrossRef]
38. Hasama T, Mihara K, Sekhar C, Cheong KWD, Tham KW. Assessment of airflow and heat transfer around a thermal manikin in a premise served by DOAS and ceiling fans. Build Environ. 2022;214(2):108902. doi:10.1016/j.buildenv.2022.108902. [Google Scholar] [CrossRef]
39. Chen WA, Fang PL, Hwang RL. Calibrating the UTCI scale for hot and humid climates through comprehensive year-round field surveys to improve the adaptability. Urban Clim. 2025;59(10):102267. doi:10.1016/j.uclim.2024.102267. [Google Scholar] [CrossRef]
40. Ministry of Environment Taiwan. Marking Taiwan’s new chapter toward sustainable development 2023. [cited 2025 Jan 1]. Available from: https://www.moenv.gov.tw/EN/375192F88A851A76/19216f66-ae23-448e-9ccd-45381e1a3b19. [Google Scholar]
Cite This Article
 Copyright © 2025 The Author(s). Published by Tech Science Press.
This work is licensed under a Creative Commons Attribution 4.0 International License , which permits unrestricted use, distribution, and reproduction in any medium, provided the original work is properly cited.
 Downloads
 Citation Tools