
 Submit a Paper
 Propose a Special lssue
 Open Access
ARTICLE

Stackelberg Game for Bilateral Transactions between Energy Storage and Wind Farms Considering the Day-Ahead Electricity Market
1 Key Laboratory of Modern Power System Simulation and Control & Renewable Energy Technology, Ministry of Education (Northeast Electric Power University), Jilin, 132012, China
2 Electric Power Research Institute of State Grid Jilin Electric Power Co., Ltd., Jilin, 130021, China
* Corresponding Author: Junhui Li. Email:
Energy Engineering 2025, 122(5), 1645-1668. https://doi.org/10.32604/ee.2025.063192
Received 08 January 2025; Accepted 06 March 2025; Issue published 25 April 2025
 View Full Text
 Download PDF
Abstract
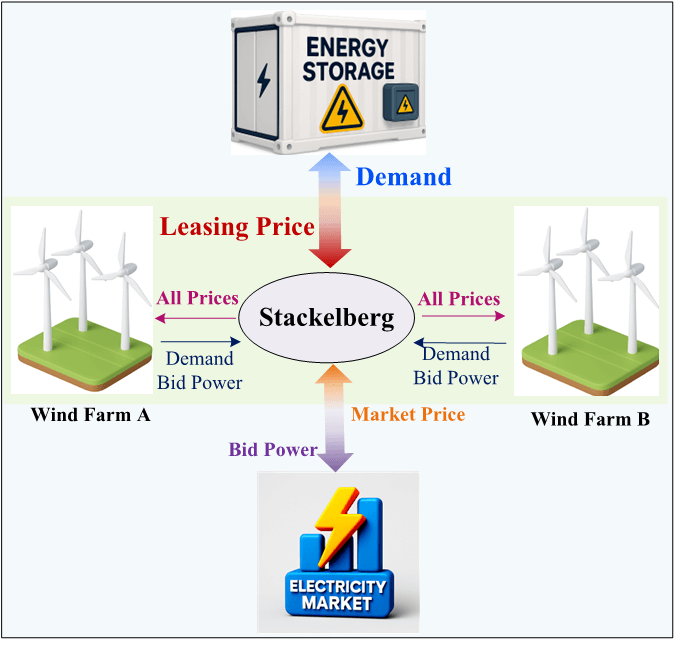
The participation of wind farms in the former energy market faces challenges such as power fluctuations and energy storage construction costs. To this end, this paper proposes a joint energy storage operation scheme for multiple wind farms based on a leasing model, which assists wind farms in bidding for participation in the former energy market through leasing services, thereby enhancing energy storage efficiency and maximizing economic benefits. In this paper, based on the Weibull probability distribution to portray the uncertainty of wind power, and considering the lifetime capacity loss caused by charging and discharging of energy storage, we construct a bilateral transaction model aiming at maximizing the multi-objective revenue of wind farms and shared energy storage. The trading strategy is designed based on the Stackelberg game framework and solved jointly by the improved genetic algorithm and interior point method. By exploring the effects of different lease price intervals on the overall system performance, and analyzing the system state under multiple charging and discharging scenarios. The results show that a reasonable lease price range can significantly improve the energy storage system utilization and wind farm revenue. The program provides new ideas to enhance the economic benefits of wind farms and promote the application of shared energy storage, and promotes the wide application of shared energy storage systems.Graphic Abstract
Keywords
The large-scale development of renewable energy is crucial for achieving the goals of “carbon neutrality” and “carbon emission reduction” [1,2]. However, as the penetration of renewable energy increases, traditional power systems face significant challenges in managing its variability and uncertainty [3,4]. Energy storage systems, with their flexible regulation capabilities, have become a core technology to address these issues and are widely deployed in practical applications [5,6]. Currently, energy storage primarily generates revenue by participating in ancillary service markets such as peak shaving. However, due to high construction costs and limited revenue streams, its profitability is gradually constrained [7]. Therefore, there is an urgent need for innovative operational mechanisms to enhance the utilization and economic benefits of energy storage systems, while effectively addressing the volatility of renewable energy.
Existing studies have extensively explored the role of energy storage systems in addressing the uncertainty of renewable energy generation and have in-depth analyzed their potential applications in leasing markets. Reference [8] indicates that energy storage systems, as backup capacity, can effectively optimize the operation of renewable energy generation, thereby enhancing system reliability. References [9,10] further highlight the significant potential of energy storage in addressing the intermittency issues of renewable energy generation. Reference [11] suggests that large-scale integration of energy storage can significantly improve the reliability and performance of power systems, while also providing wind farms with more opportunities for profit and arbitrage. Studies [12,13] demonstrate that energy storage systems can effectively participate in arbitrage operations in the day-ahead energy market. By optimizing bidding strategies in the day-ahead market, energy storage systems not only provide diversified services to the grid but also achieve expected investment returns [14]. Regarding bilateral trading between wind farms and energy storage, Reference [15] maximizes economic benefits by optimizing energy storage capacity allocation, effectively mitigating wind power fluctuations. However, Reference [16] does not account for the probabilistic distribution uncertainty of wind power, using a simple uniform distribution model, and overlooks the pricing range issues that may arise when wind farms and energy storage systems jointly participate in the day-ahead energy market. Reference [17], based on the aggregation scenario method, designs energy storage capacity allocation and volatility penalty mechanisms for optimal scheduling. However, this approach struggles to capture the dynamic changes in the real-time market and the need for immediate bidding strategies, while failing to fully consider the impact of pricing ranges on strategy optimization. Reference [18] represents the uncertainty of wind and solar power generation in the form of uncertainty sets and develops a two-stage robust model. Another critical issue to note is the capacity of energy storage [19,20]. Reference [21] does not adequately address the life degradation issues caused by frequent charging and discharging under the volatility of wind power. In contrast, Reference [22] proposes a scheduling strategy that accounts for energy storage life degradation, optimizing the trading model between wind power and energy storage. Reference [23] establishes a two-stage trading mechanism for the shared interaction between wind farms and energy storage. References [24,25] employ the Nash bargaining model to achieve a win-win situation for wind-storage leasing payments and energy transactions through negotiation. Utilizing the Nash game management mechanism, this approach not only enhances the benefits of the energy storage system but also ensures a fair distribution of interests among all parties. Reference [26] proves that the equilibrium solution of Stackelberg game exists uniquely.
Existing research still falls short in addressing the uncertainties of renewable energy markets and dynamic market demands through energy storage, particularly in handling wind power uncertainty and energy storage degradation. While current trading models facilitate revenue distribution, they have not effectively improved storage utilization, overall profitability, or the fairness of energy storage market mechanisms, thereby limiting the flexible and efficient application of energy storage. Furthermore, research on price ranges in wind-storage bilateral transactions and energy markets remains relatively underdeveloped. Most existing models assume fixed market prices, neglecting the impact of price fluctuations on leasing prices, bidding strategies, and capacity allocation. Therefore, future research should focus on the role of price volatility in wind-storage trading strategies, especially in dynamic markets, and explore ways to optimize energy storage leasing and bidding strategies to enhance economic benefits and system reliability.
1.3 Research Gaps and Contributions
To address the aforementioned issues, this paper proposes a leasing model that simultaneously leases both the energy storage capacity and the charging/discharging power, thereby achieving precise scheduling and optimized utilization of energy storage resources. By modeling the uncertainty of wind power using the Weibull distribution, this approach can describe multiple potential scenarios probabilistically, ensuring the reliability of wind power output forecasts. Furthermore, considering the degradation that may occur in energy storage systems due to frequent charging and discharging across multiple markets, this paper incorporates loss costs caused by charging and discharging into the revenue model, thereby enhancing the accuracy of economic evaluations. The main contributions of this paper are as follows:
(1) An innovative energy storage operation model based on independent energy storage stations is designed to maximize revenue through energy storage leasing services. This mechanism supports wind farms in leasing storage capacity, increasing energy storage system utilization, effectively reducing the construction and operation costs of wind farms, and thus enhancing overall economic benefits.
(2) By setting multiple leasing price intervals, the crucial role of reasonable price ranges in wind-storage bilateral trading is further demonstrated. The analysis indicates that price fluctuations significantly affect leasing strategies and market performance.
(3) Stackelberg game theory is introduced to construct a trading strategy model with the goal of maximizing revenue. This model designs the game relationship between energy storage systems and wind farms, optimizing decision-making regarding key parameters, such as leasing prices, to achieve cooperation and competition between both parties, enhancing market competitiveness and increasing overall profits.
(4) A wind power uncertainty model based on stochastic optimization is constructed, combining the energy storage system’s Percentage of Rental Capacity (PRC), state of charge (SoC), and life degradation costs. This model dynamically optimizes energy storage capacity and peak-shaving participation strategies. The method effectively addresses wind power fluctuations, reduces wind curtailment, and ensures the maximization of energy storage resource allocation benefits.
The structure of this paper is arranged as follows: Chapter 2 first introduces the overall framework of the energy storage service system, with a focus on the roles and positioning of the various participants under different market conditions. Additionally, this chapter analyzes the bidding strategy of wind farms in the day-ahead market and explores in detail the role of joint energy storage in mitigating wind power fluctuations. Chapter 3 considers the various types of revenues and costs in the system and establishes profit models for both the energy storage system and the wind farm. Chapter 4, based on Stackelberg game theory, constructs a trading model and process between the energy storage system and the wind farm, proposes improvements to the game framework, optimizes the objective function, and provides a method for determining equilibrium solutions. Chapter 5 validates the model through practical examples, setting parameters for the wind farm, energy storage system, and related trading parameters. This chapter also analyzes and compares the differences in revenues, leasing prices, capacity, and power, as well as the operational strategies of the wind farms under different scenarios. Finally, Chapter 6 summarizes the research findings of this paper and looks forward to future research directions.
2 System Framework for Wind-Storage Collaborative Participation in the Day-Ahead Energy Market Based on Bilateral Trading
The proposed wind-storage collaborative participation service system in the day-ahead energy market consists of several key components, including the Energy Storage (ES), Wind Farm (WF), and the Day-Ahead Energy Market (DAEM), as shown in Fig. 1. The bilateral trading between the ES and WF mainly includes the leasing power to mitigate wind power fluctuations and the leasing game information. Specifically, ES provides leasing services to WF by adjusting the rental capacity and charging/discharging power to reduce wind curtailment and grid deviation. WF uses the leased capacity to smooth power fluctuations and participates in the bidding process of the Day-Ahead Energy Market.
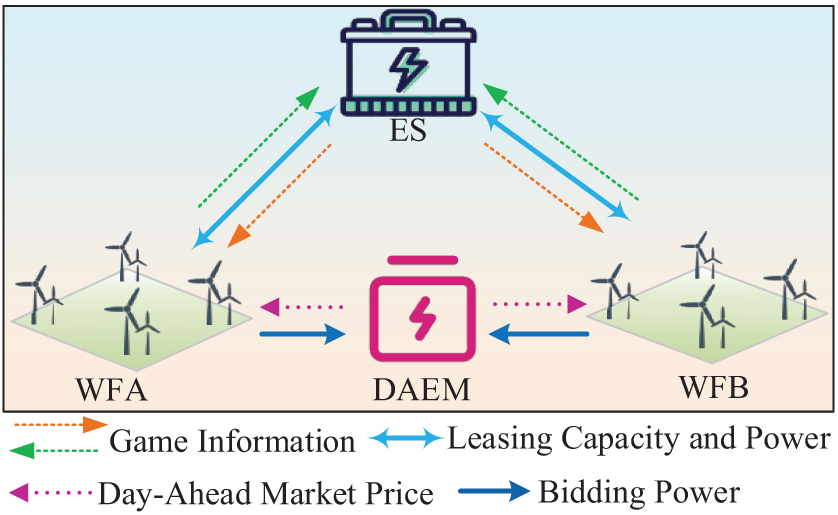
Figure 1: Schematic diagram of the ES service system structure
Based on the market clearing price, leasing capacity and power prices, shortage penalty price, and wind curtailment penalty price, WF determines its bidding strategy in the DAEM by combining the expected power with the Weibull probability distribution curve. The specific power calculation is shown in Fig. 2. The integral regions are as follows: ① Grid deviation power integral region, ② Expected discharge power integral region, ③ Expected charge power integral region, and ④ Wind curtailment power integral region. Based on this information, WF’s maximum revenue objective function is established, and the bidding power
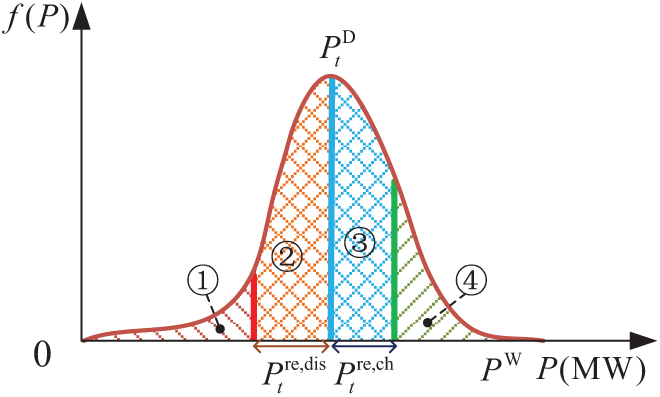
Figure 2: Schematic diagram of WF bidding decisions at each time
The bilateral trading mechanism between ES and WF functions similarly to co-located ES systems, aiming to stabilize wind power integration into the grid by mitigating power fluctuations. When the real-time wind power is insufficient, ES compensates for the deficit; conversely, it absorbs surplus power when the wind power exceeds demand, ensuring a stable grid feed-in profile. Specifically, the content and magnitude of leasing services at each time step are dynamically adjusted based on profit-optimization strategies, as illustrated in Fig. 3. In periods
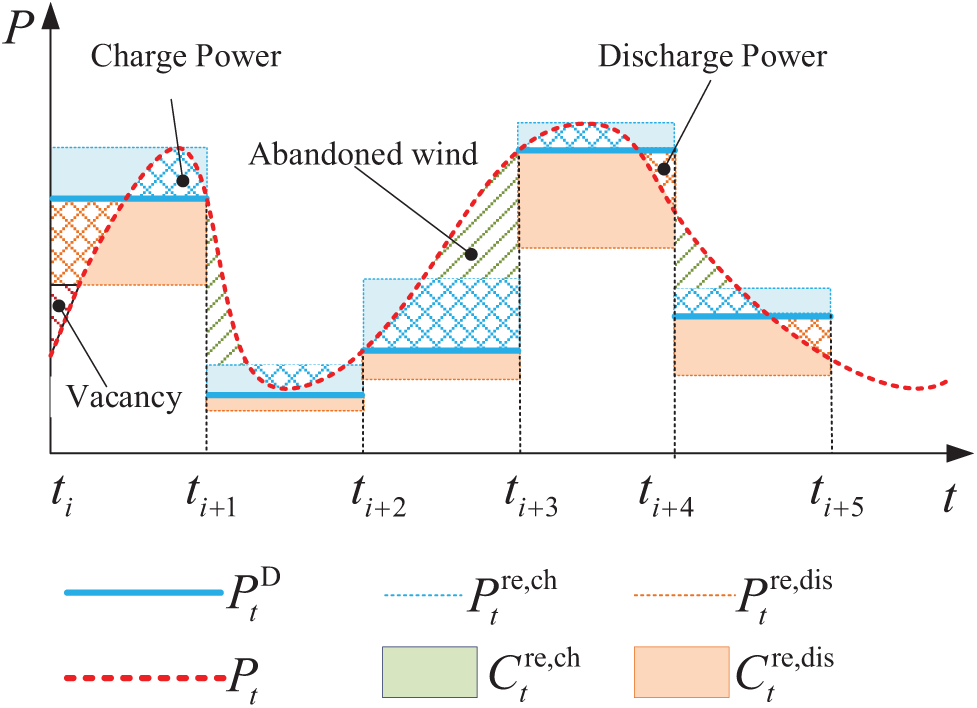
Figure 3: Schematic diagram of ES assisting WF in mitigating power fluctuations
3 Collaborative Modeling of WF and ES System Joint Participation in the DAEM
Optimization Objective Function: In game theory and optimization models, the objective function is used to quantify the decision goals of the parties involved, typically represented as the quantity to be maximized or minimized. In this study, our optimization objective function is primarily used for the joint optimization of wind farms and energy storage systems, with the goal of maximizing the combined profit of both.
Specifically, the objective of the wind farm is to maximize its market revenue, which includes income generated from bidding in the day-ahead energy market, as well as revenue from leasing energy storage capacity to mitigate wind power fluctuations and reduce curtailment losses. The objective of the energy storage system is to maximize the profit from its leasing services, including income from leasing storage capacity and revenue generated from charging and discharging operations. The optimization of the objective function needs to consider multiple factors, such as the generation fluctuations of the wind farm, the charging and discharging efficiency of the storage system, and the fluctuations in market electricity prices.
3.1 Bidding Model for WF Participating in the DAEM with Capacity Leasing Consideration
The Weibull probability density function for the known wind speed is given by:
where, k is the shape parameter, c is the scale parameter, and v is the wind speed.
The formula for the wind turbine output power is given by Eq. (2).
where,
From Eqs. (1) and (2), the probability density function of the WF power with respect to wind speed v is calculated as shown in Eq. (3).
The objective revenue function of the WF includes: DAEM revenue, leasing capacity and power costs, ES charging revenue, and grid deviation penalty costs. The optimization goal is to maximize the revenue, as expressed below:
where, T is the total number of time periods, which in this paper refers to 24 h in a day;
where,
The calculation of the power shortage, discharging power, charging power, and curtailed wind power of the WF at time t is given by Eqs. (10)–(15):
The rated power constraints for charging and discharging power are given by Eqs. (16) and (17).
where,
The leasing capacity constraints at each time period are given by Eqs. (18) and (19).
where,
The charging and discharging power is also subject to SoC constraints, as shown in Eqs. (20) and (21).
where,
To prevent the leased contract capacity from exceeding the bidding power range and to ensure the proper utilization of ES resources, a reserve power constraint is imposed:
where, in the equation,
3.2 Energy Storage Revenue Model Based on Bilateral Trading
The benefits of ES include leased capacity, power gains, and storage action costs, and the objective function is shown in Eq. (24).
here, the leasing gain is the same as above and will not be repeated. Considering the effect of the depth of charge and discharge on the stora1ge capacity loss during the charging and discharging process of the ES, and considering the cost of life depreciation caused by a single charging and discharging, the life of the storage is terminated by default when the actual capacity of the storage is equal to 80% of the initial capacity [27]. The ES action cost is as follows:
where,
In order to ensure the rationality of the transaction, the ES power sale price at the same moment should be higher than the power purchase price to obtain positive returns; in order to ensure the incentive of WF leasing, the expected discharge power price of storage ES should be lower than the penalty price. The price constraints are as follows:
where,
4 Bilateral Trading between WF and ES Based on Stackelberg Game
Stackelberg Game: The Stackelberg game is an asymmetric game model in which participants have roles as leaders and followers. Specifically, the leader makes the first decision, while the follower reacts to the leader’s decision. This game model is widely applied in areas such as market competition, pricing strategies, and production decisions, particularly in situations where there are different decision-making priorities.
In this study, we adopt the Stackelberg game framework to describe the interaction between the WF and the ES. Specifically, the wind farm, as the leader, first determines its bidding strategy for participation in the DAEM, while the energy storage system, as the follower, adjusts its charging and discharging strategy in response to the wind farm’s decision. In this way, the Stackelberg game accurately models the strategic relationship between the two parties and optimizes their respective benefits.
4.1 Stackelberg Game Framework between WF and ES
For the above transaction model, the bilateral transaction between ES and WF is described as a game, which can be represented as:
The above game model contains three elements, participants, strategies and payoffs, which are denoted as:
(1) Participants: ES, WFA and WFB are the three participants of the game and the set of participants is denoted as
(2) Bilateral trading strategy: the leader ES’s strategy for 24-h bilateral trading of capacity price, power price, in the form of vectors can be expressed as
(3) Revenue: The revenue of each participant is calculated using the objective functions defined in the previous section, as determined by Eqs. (5) and (24).
The roles of the game participants and the information exchanged between them are shown in Fig. 4.
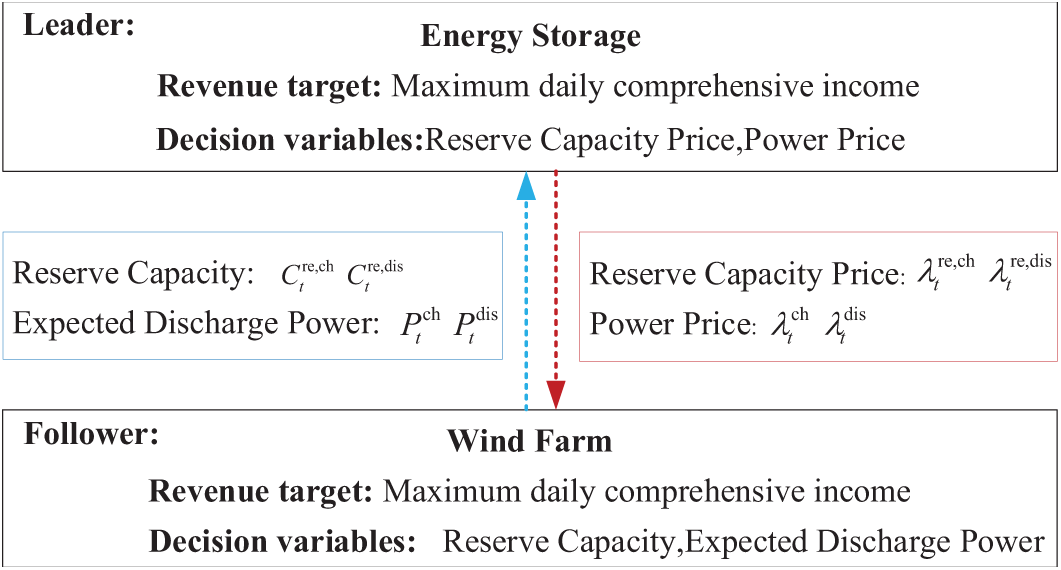
Figure 4: Schematic diagram of the game between ES and WF
4.2 Solution Process of WF and ES Trading Based on Improved Genetic Algorithm and Interior Point Method
To avoid the influence of poor initial individuals on the evolution direction and to increase the differentiation in the later stages, the objective function has been improved, as expressed below:
where,
Crossover probability and mutation probability are key factors in the convergence of the genetic algorithm. The speed of new individual generation is positively correlated with the crossover probability, but too high a value can destroy individual structure, while too low a value can reduce the search ability.
where,
To improve the utilization of wind power and reduce wind curtailment in WF, a wind curtailment penalty is added to the objective function (5), establishing a wind farm revenue fitness evaluation objective function:
where,
To satisfy constraints (30) and (31), it is necessary to establish the state functions corresponding to PRC and SoC. Let the initial SoC state of the ES be
Considering that the information between WF is opaque, when multiple WF simultaneously participate in bilateral trading, it may lead to leasing power exceeding the ES’s capacity or power limits. The calculation of the excess part is shown in Eq. (40). To satisfy the constraints of ES charging and discharging power Pt, capacity PRC, and SoC, corresponding penalty functions for the excess are established, as shown in Eqs. (41)–(43).
where,
In the ES revenue model, to minimize the difference in SoC at the beginning and end of the cycle caused by charging and discharging, a penalty is imposed on the SoC difference at the cycle’s start and end. The penalty mechanism is shown in Eq. (44).
where,
The penalty cost for the SoC state deviation before and after ES is added to the daily revenue objective function to construct the ES fitness evaluation objective function, as shown in Eq. (45).
where,
To address the dependency of traditional centralized optimization methods on detailed participant information (such as equipment parameters and energy usage preferences), especially in the context of competitive electricity markets where information is opaque and participants must independently optimize, this paper proposes an equilibrium solution method based on the combination of an Improved Genetic Algorithm and Interior-Point Method (IGA-IPM) to solve the above issues. This game is a large-scale nonlinear optimization problem, and the application of the genetic algorithm helps reduce the solving complexity and enhance global optimization capability. The solution flow of the above algorithm is shown in Fig. 5.
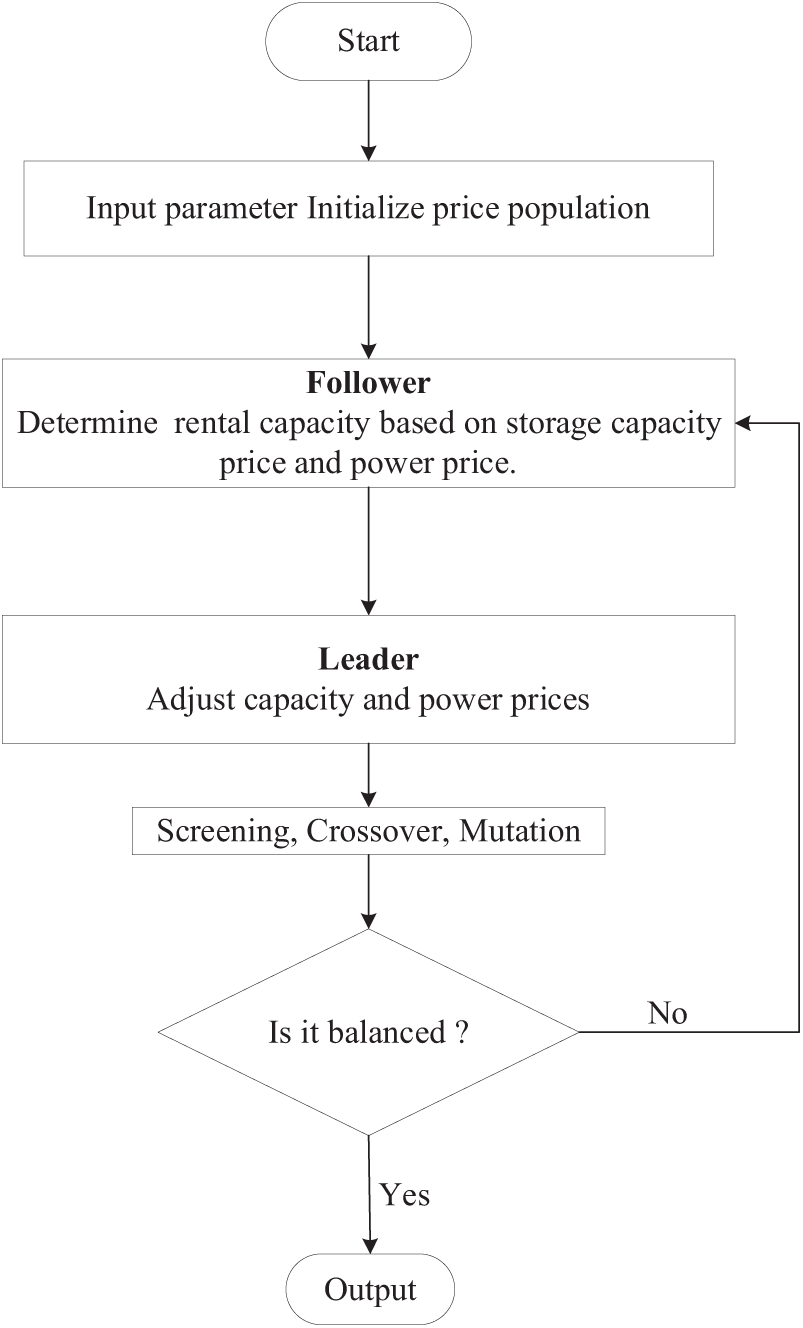
Figure 5: IGA-IPM computation flowchart
A case study is conducted using one ES station and two wind farms in a region of Jilin, China, to simulate the ES service system proposed in this paper.
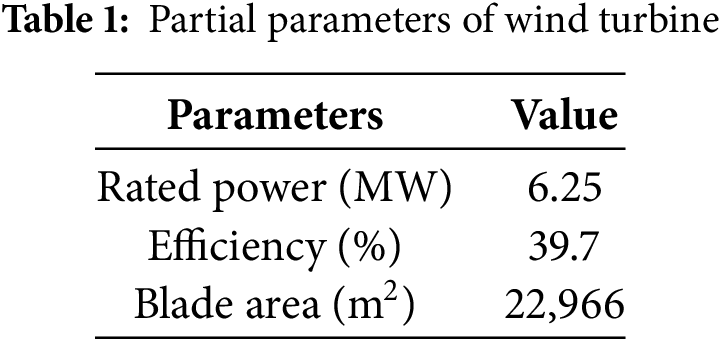
The installed capacities of Wind Farm A (WFA) and Wind Farm B (WFB) are 200 MW and 150 MW, respectively. Some parameters of these wind turbines are shown in Table 1.
The Weibull probability distributions of the predicted power at each time step for WFA and WFB on a typical day are shown in Fig. 6a,b, respectively. In the figure, the x-axis represents the predicted power, the y-axis represents the time of day, and the z-axis represents the power’s probability density. The power values are generated based on meteorological forecast data and are assumed to follow a Weibull distribution. These data will determine the wind farm’s bidding power in the day-ahead market and the capacity and power to be leased for energy storage.
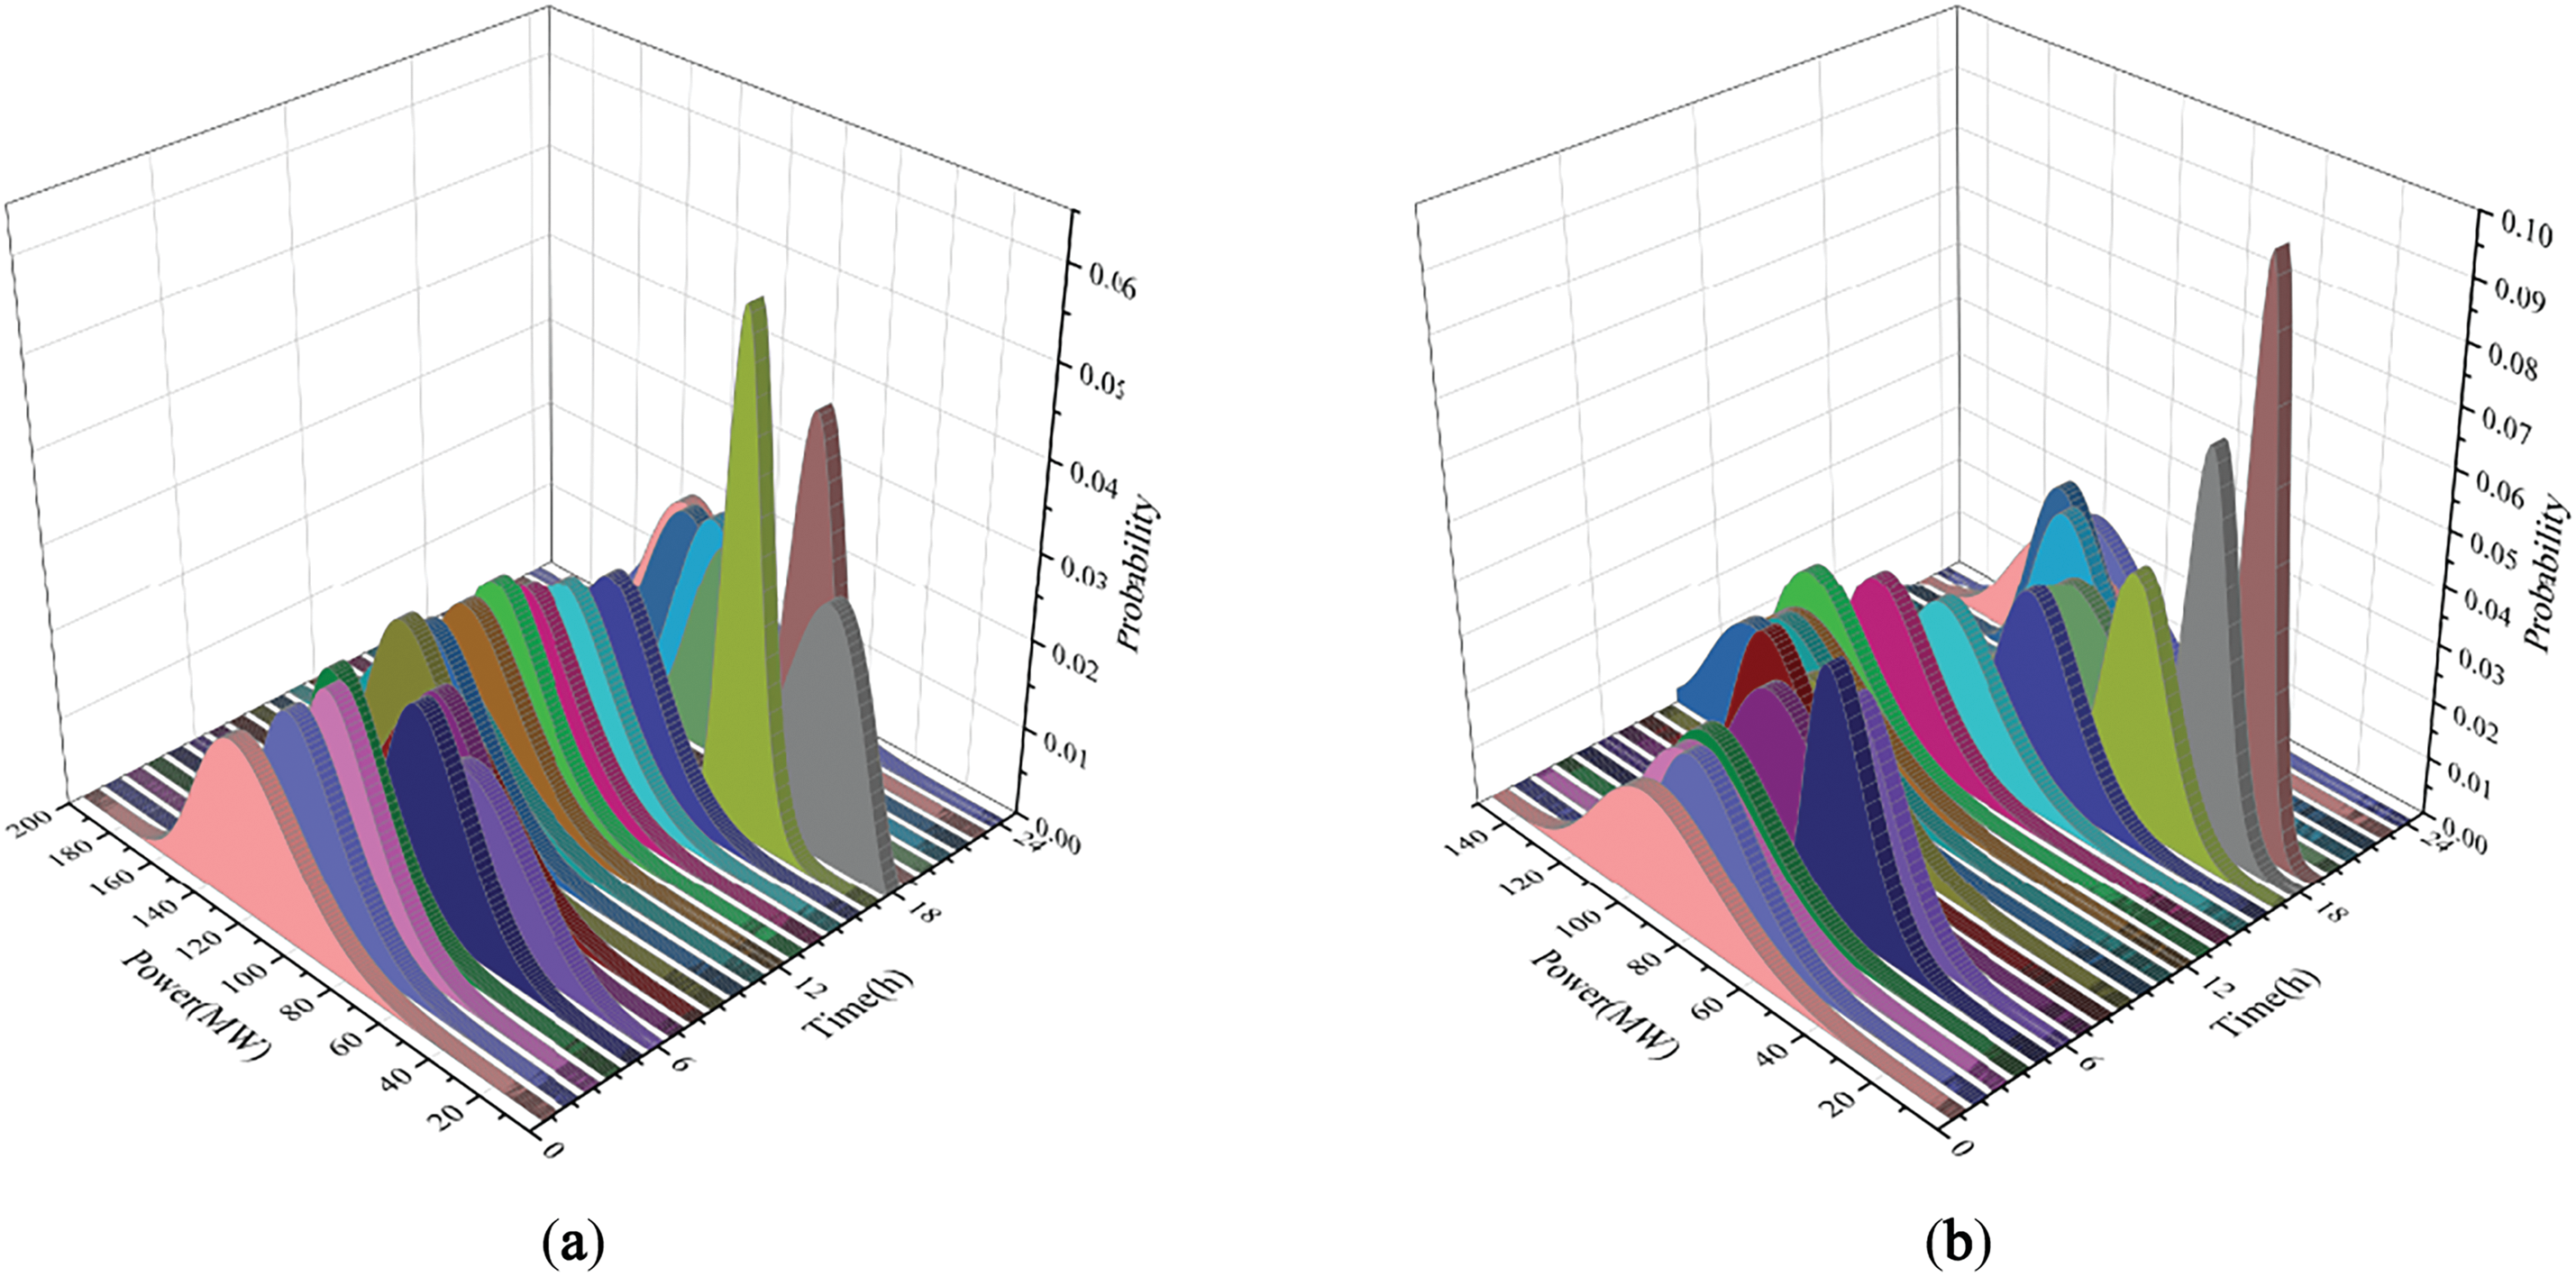
Figure 6: Daily power prediction of wind farm. (a) Wind Farm A; (b) Wind Farm B
Here, it is assumed that the market clearing price is known, based on the actual transaction price of the wind farm. The predicted clearing prices for WFA and WFB in the DAEM over a 24-h period are shown in Fig. 7.
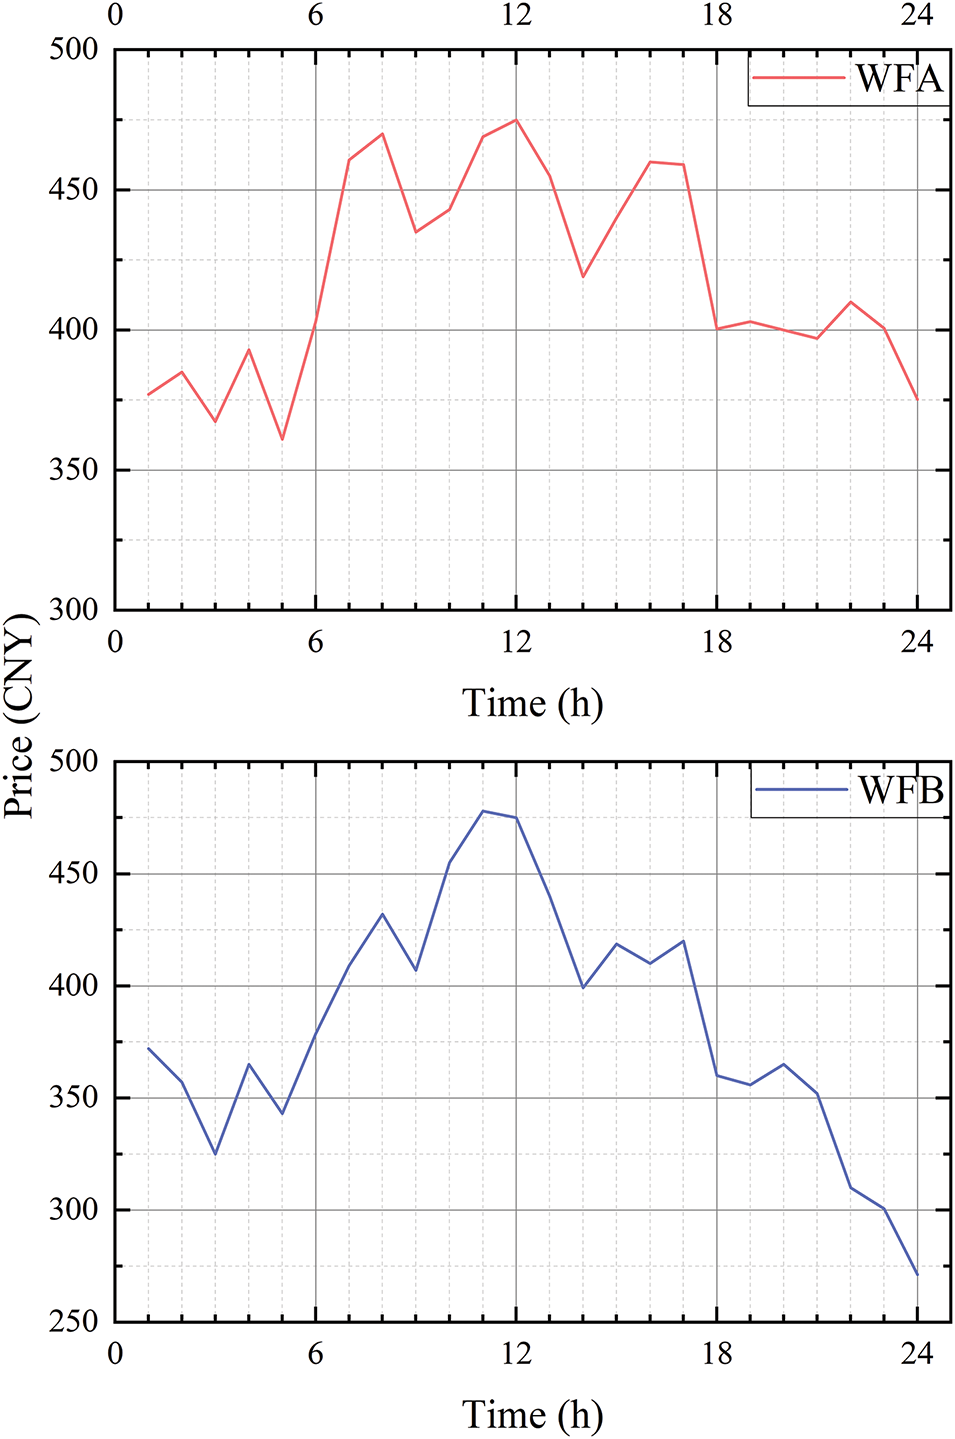
Figure 7: Day-Ahead price forecast curve
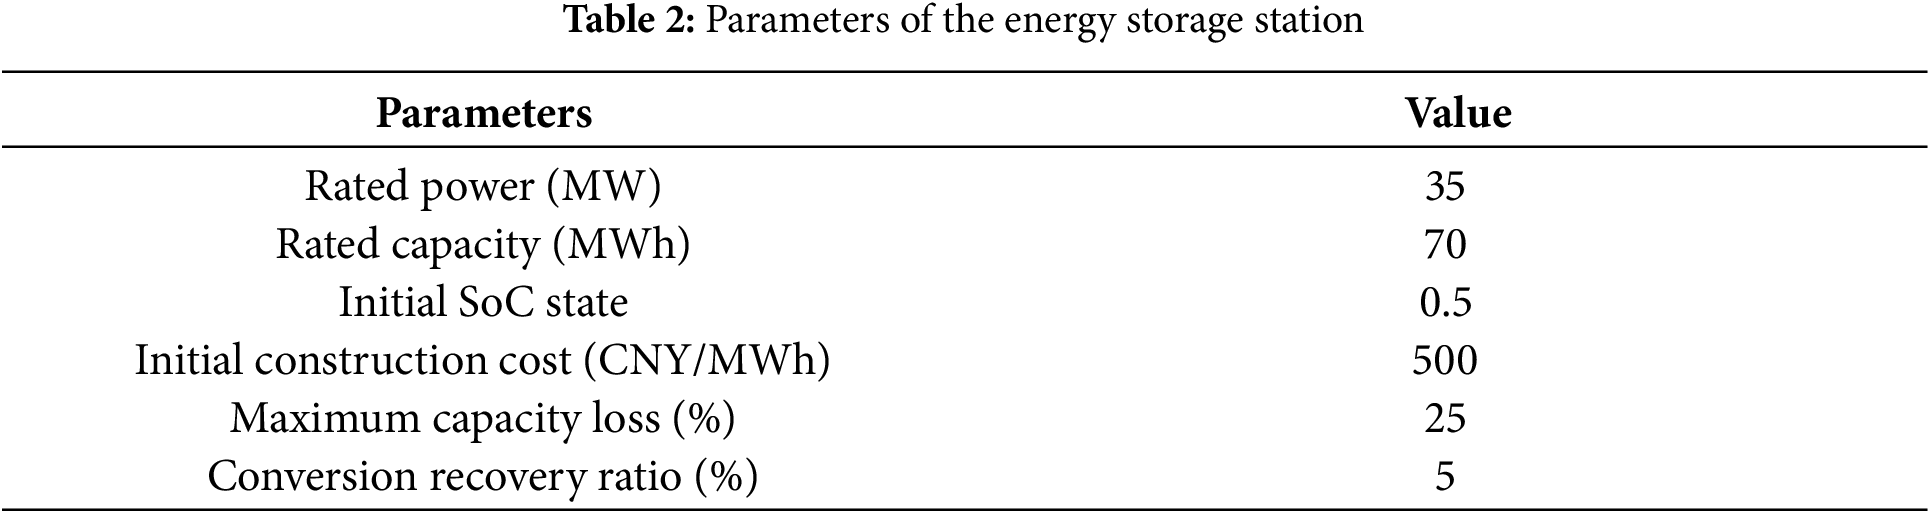
5.1.2 Energy Storage Parameters
The ES medium of the energy storage station in this study is lithium iron phosphate, and some of its parameters are shown in Table 2.
The rental price parameters refer to the local pricing policy, and some of the results are shown in Table 3.
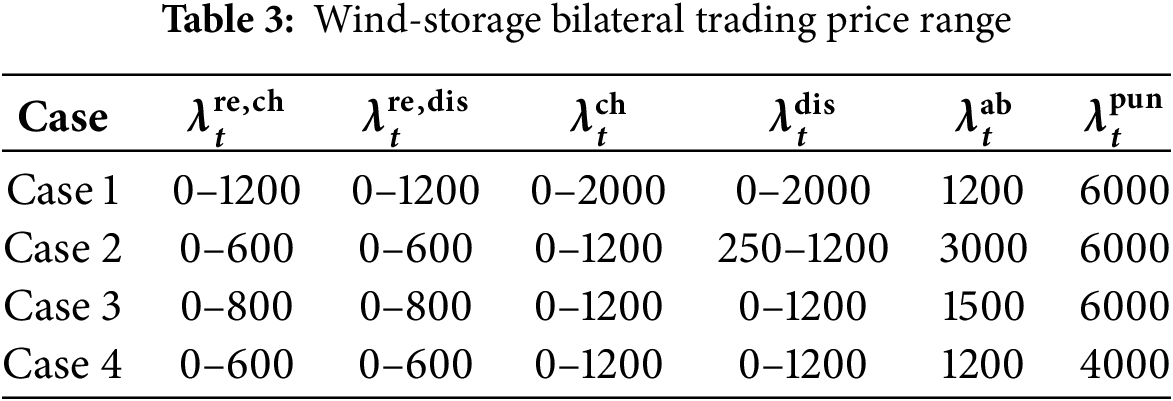
In the case of a breach of the ES leasing contract, both the unit capacity penalty coefficient A and the unit power penalty coefficient B are set to 20,000 CNY/MWh.
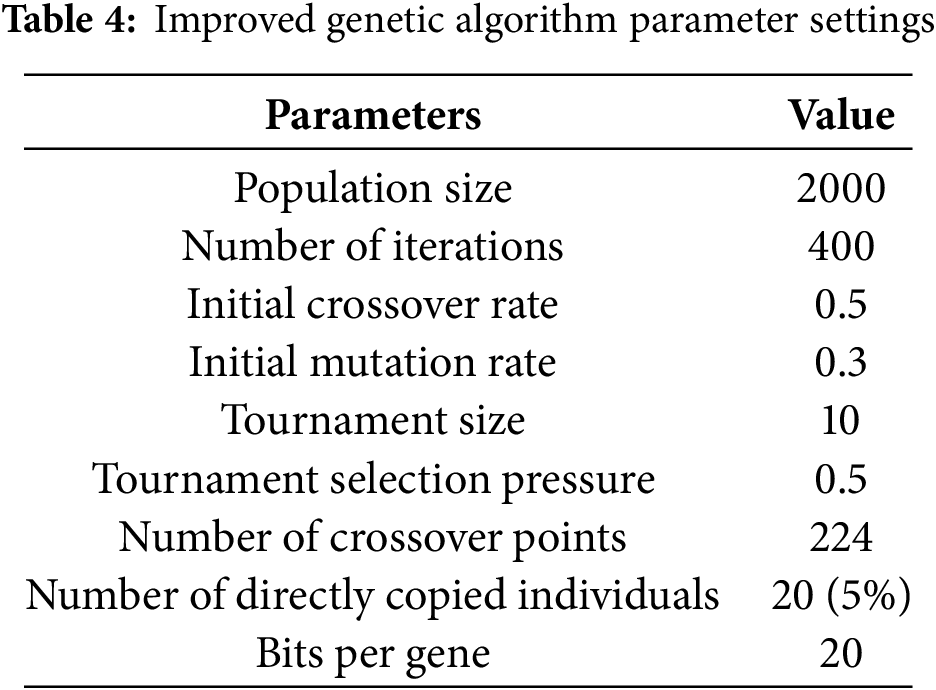
5.1.4 Parameters of the Improved Genetic Algorithm
In the Stackelberg game model solving process, the upper layer involves multiple price optimization, with leasing prices transmitted through the leasing contracts of the lower-layer WF. To reduce the solving complexity, a genetic algorithm with strong global search capability is used for the solution, with the specific parameter settings shown in Table 4.
5.2 Case Study Results Analysis
5.2.1 Revenue Comparison Analysis
The objective of this simulation is to validate the strategic performance of the ES and WF under different price intervals, including capacity price, power price, and penalty price conditions. The revenue results for each scenario are shown in Fig. 8. Specifically, the ES has the lowest revenue in Case 1, with only 442,963.00 CNY; while in Case 2, the highest revenue is achieved, reaching 926,876.14 CNY, showing a significant revenue difference. For WFA, its revenue is the highest in Case 1 at 455,770.50 CNY, and the lowest in Case 2 at 148,812.47 CNY. WFB exhibits a similar trend, with the highest revenue of 282,646.47 CNY in Case 1, and a decrease to 95,662.24 CNY in Case 2. This indicates that due to the different price intervals in each scenario, there are significant differences in the final revenue performance of the ES and WF.
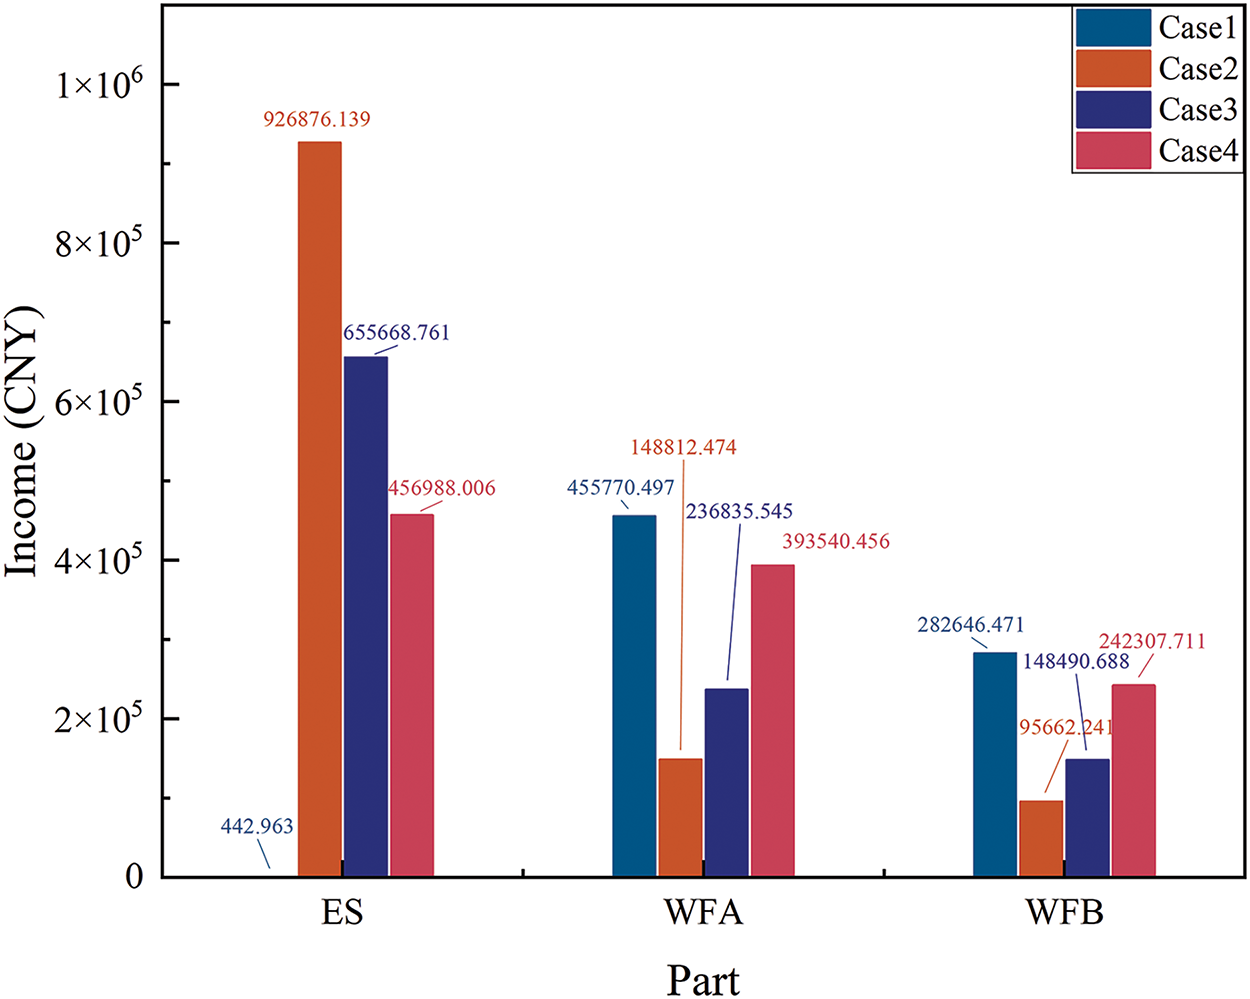
Figure 8: Revenue comparison under different cases
Further analysis of the total revenue for each scenario shows that the total profits for Case 1 to Case 4 are 738,859.93 CNY, 1,171,350.85 CNY, 1,040,994.99 CNY, and 1,092,836.17 CNY, respectively. From the revenue results, it can be seen that Cases 2–4 perform relatively better compared to Case 1, suggesting that the proposed scheme, which comprehensively considers capacity price, power price, and penalty price conditions, offers greater economic potential.
In terms of market bidding strategy, Case 1 has the lowest bidding power, accompanied by higher curtailment and grid deviation power, leading to the worst performance. In contrast, Case 2 has higher bidding power and the least curtailment and deviation power. However, this is achieved by leasing more ES charging and discharging capacity, which indirectly explains the lower revenue of the WF in Case 2, especially when a large portion of the ES capacity is used for storage rather than market participation. Case 3, with higher bidding power than Case 2 and minimal change in grid deviation power, reduced the leasing of ES capacity, thereby increasing the WF’s revenue. Finally, Case 4 achieved the highest market bidding power by leasing an appropriate amount of ES capacity, and under the condition of moderate curtailment and deviation power, it ensured the timely and efficient use of WF energy. The bidding power, curtailment power, deviation power, and leased capacity of each case are shown in Fig. 9.
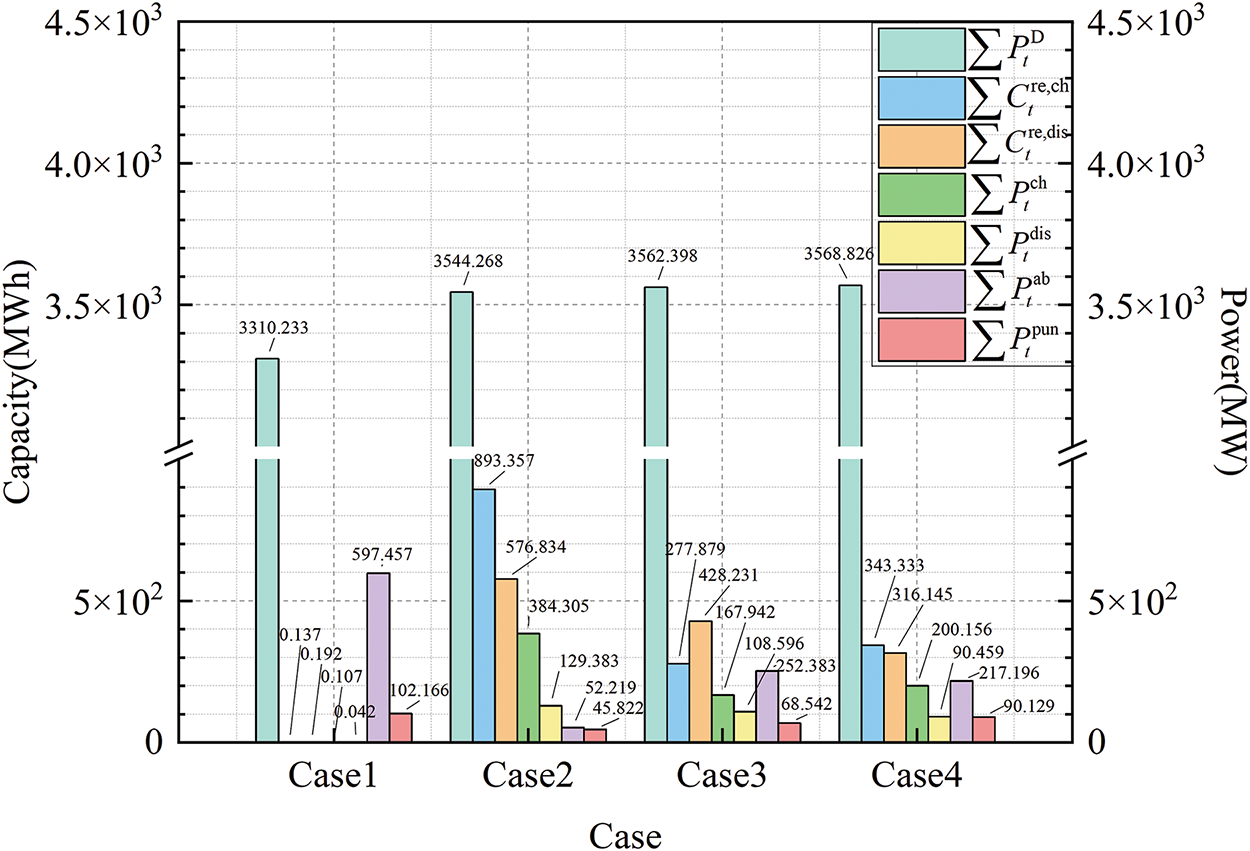
Figure 9: Total bidding power for each case
In the convergence analysis of the game process, the optimization iteration results of each case are shown in Fig. 10. From the figure, it can be observed that the IGA-IPM solving method used in this paper exhibits good convergence properties. Even for the case with the slowest convergence, the results have fully converged by the 300th iteration. As the number of iterations increases, the convergence trends of the leader and follower exhibit opposite patterns. According to the equilibrium determination principle of the Stackelberg game, when the system reaches the equilibrium point, the strategies of both parties in the game will no longer change. At this point, neither party can achieve greater benefits by adjusting their strategy independently.
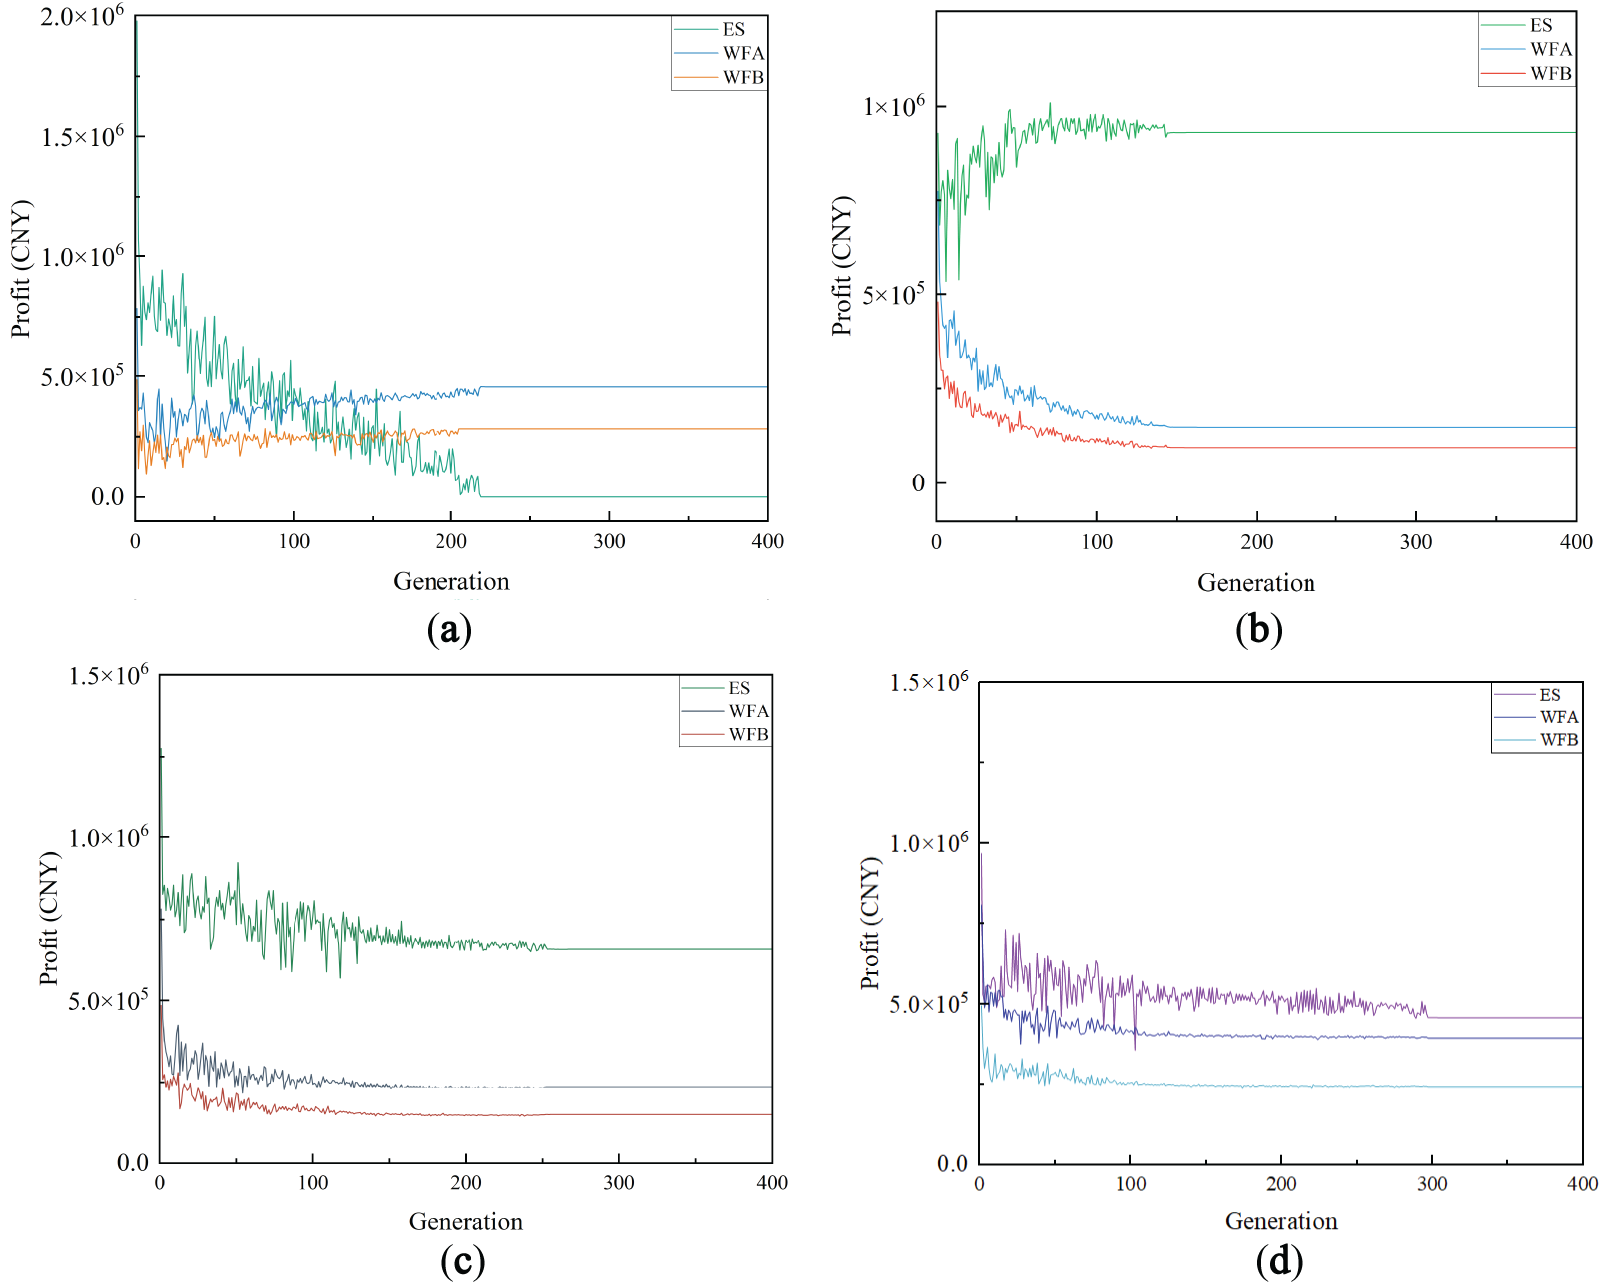
Figure 10: Convergence results of Stackelberg game. (a) Case 1; (b) Case 2; (c) Case 3; (d) Case 4
5.2.2 Lease Price Comparison Analysis
In the simulations from Case 1 to Case 4, the fluctuations in the capacity prices at each time are relatively small, remaining close to the price upper limit. The rental prices for charging and discharging capacities at each time are shown in Fig. 11a,b, respectively. Specifically, in Case 1, the average charging capacity price and discharging capacity price are the highest, with an average charging price of 1158.567 CNY and an average discharging price of 1179.875 CNY. In Case 2, the average prices for charging and discharging capacities are 567.051 CNY and 570.935 CNY, respectively. In Case 3, the charging and discharging capacity prices are 775.884 CNY and 786.549 CNY, respectively. Finally, in Case 4, the charging and discharging capacity prices are 581.785 CNY and 578.145 CNY, respectively. The price fluctuations within each cycle are relatively smooth, with the price standard deviations at each time being very similar. The specific average prices and standard deviation values are shown in Fig. 11c,d.
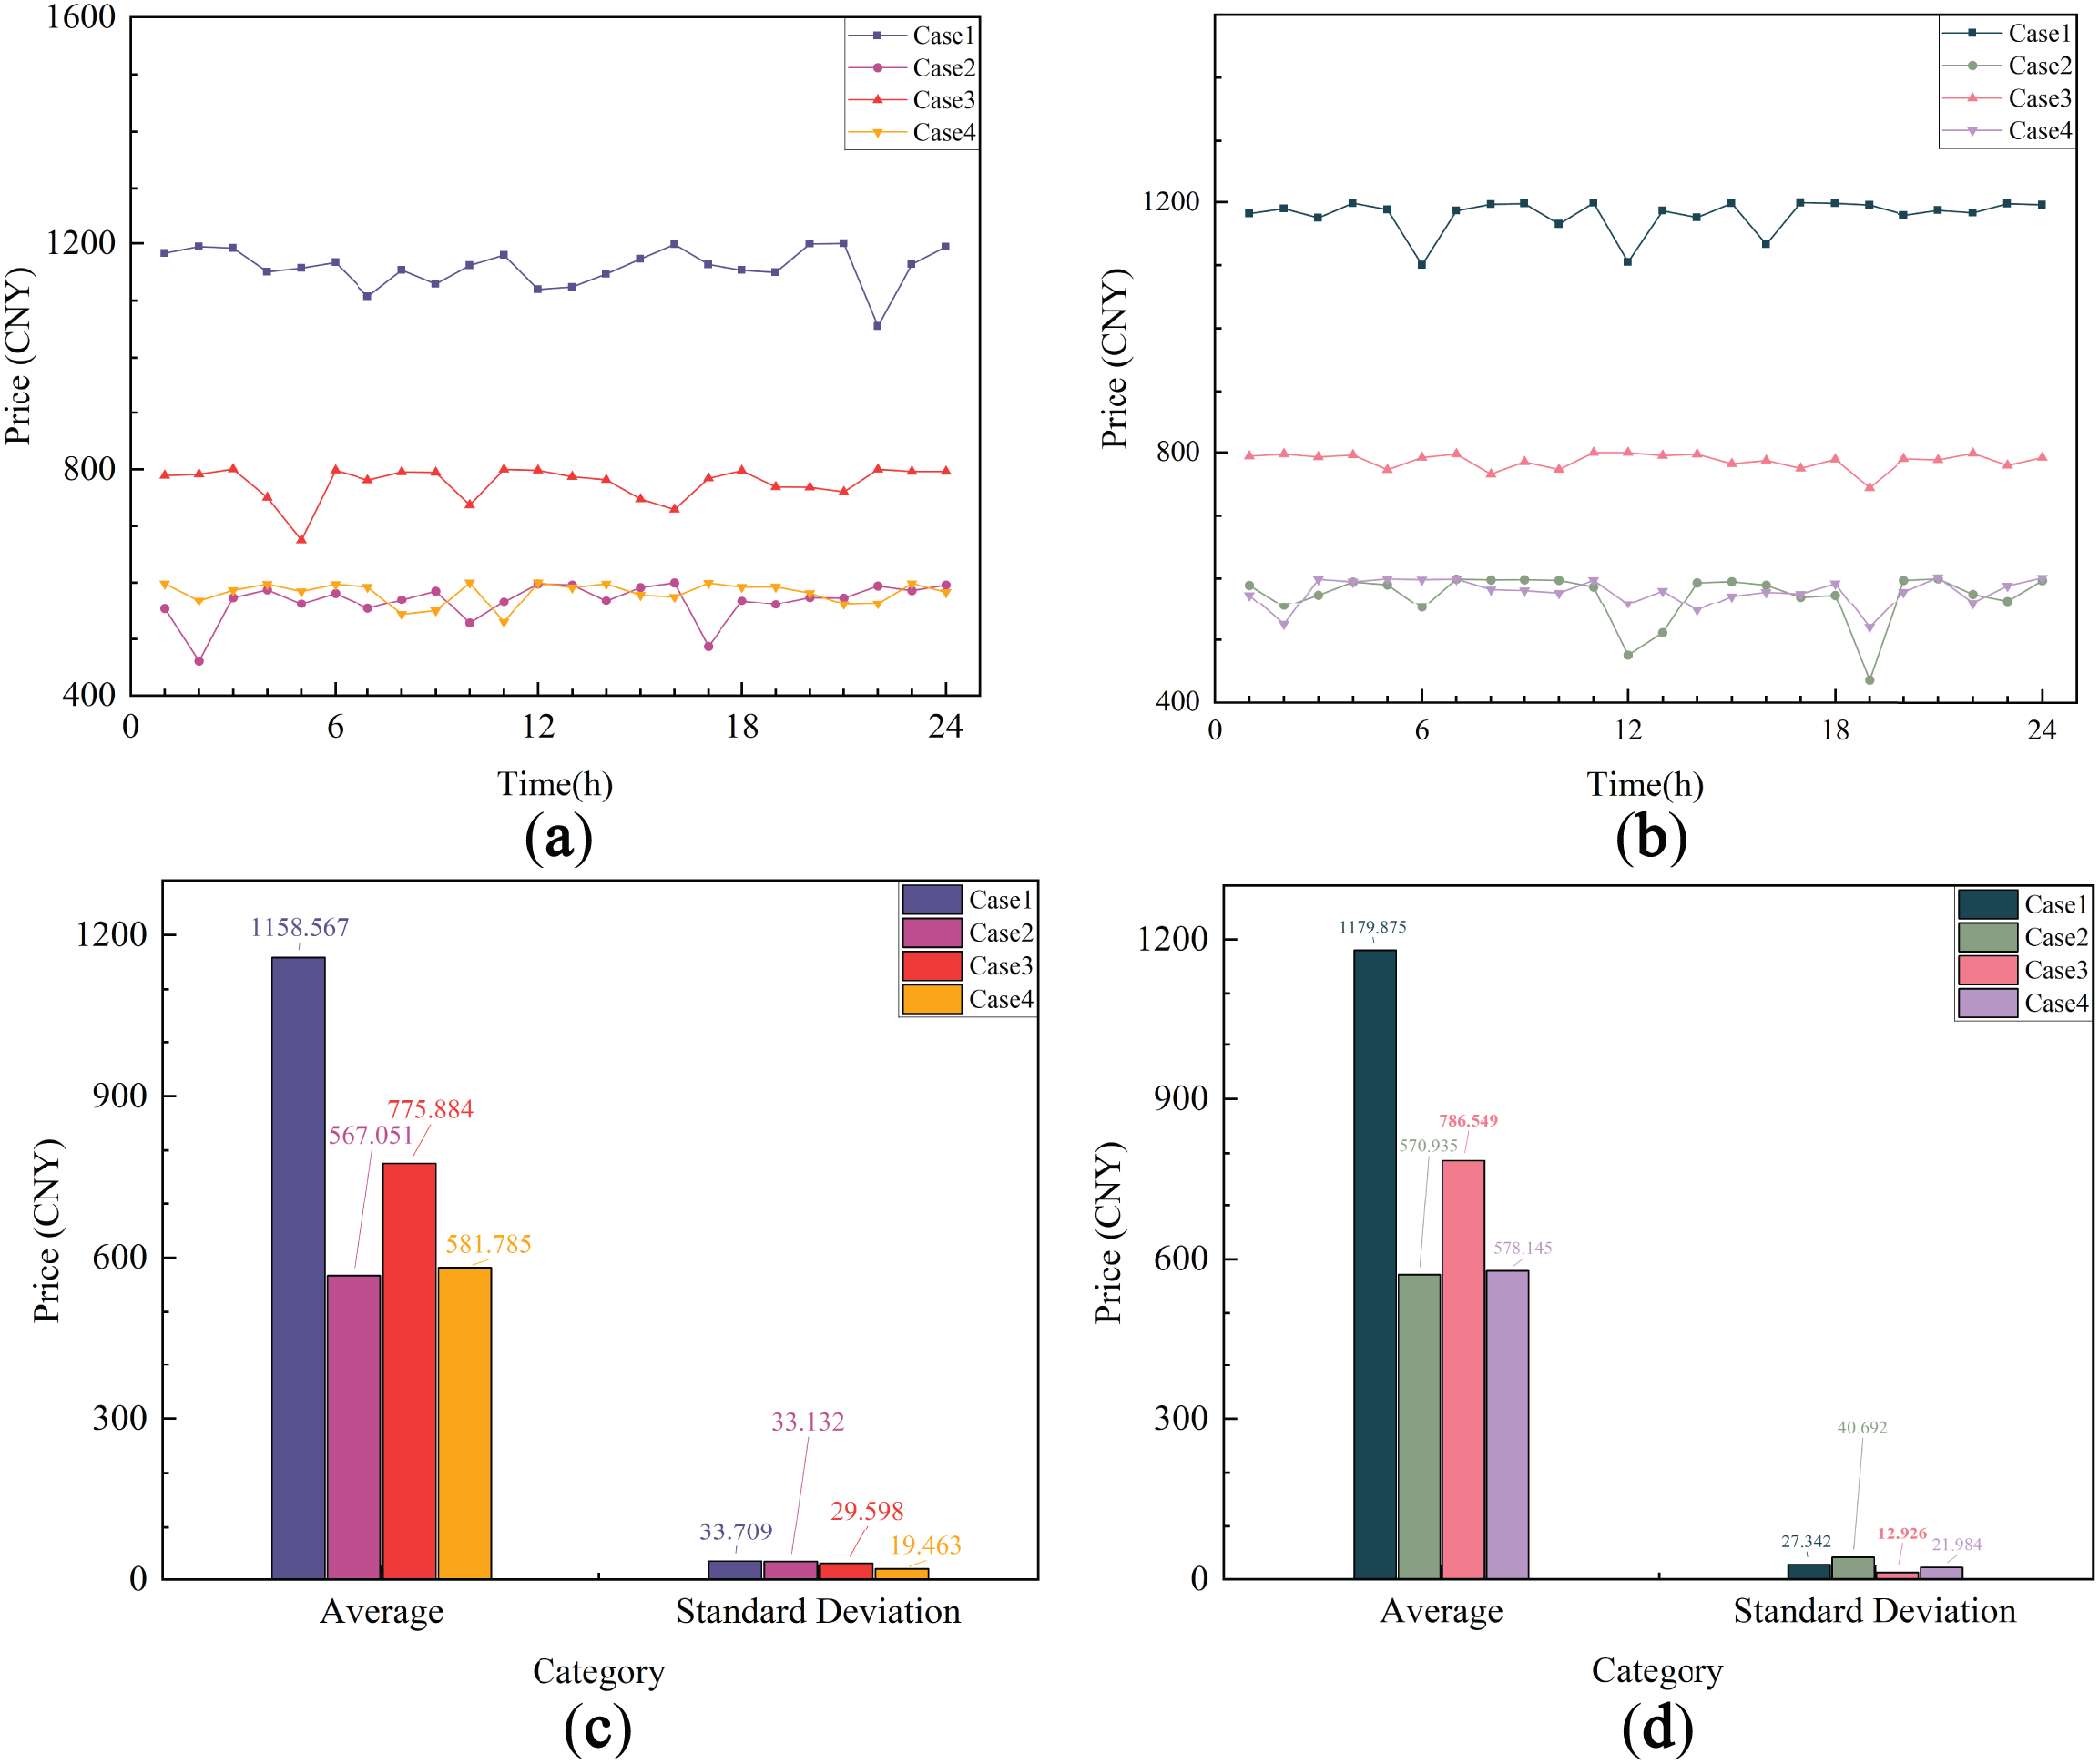
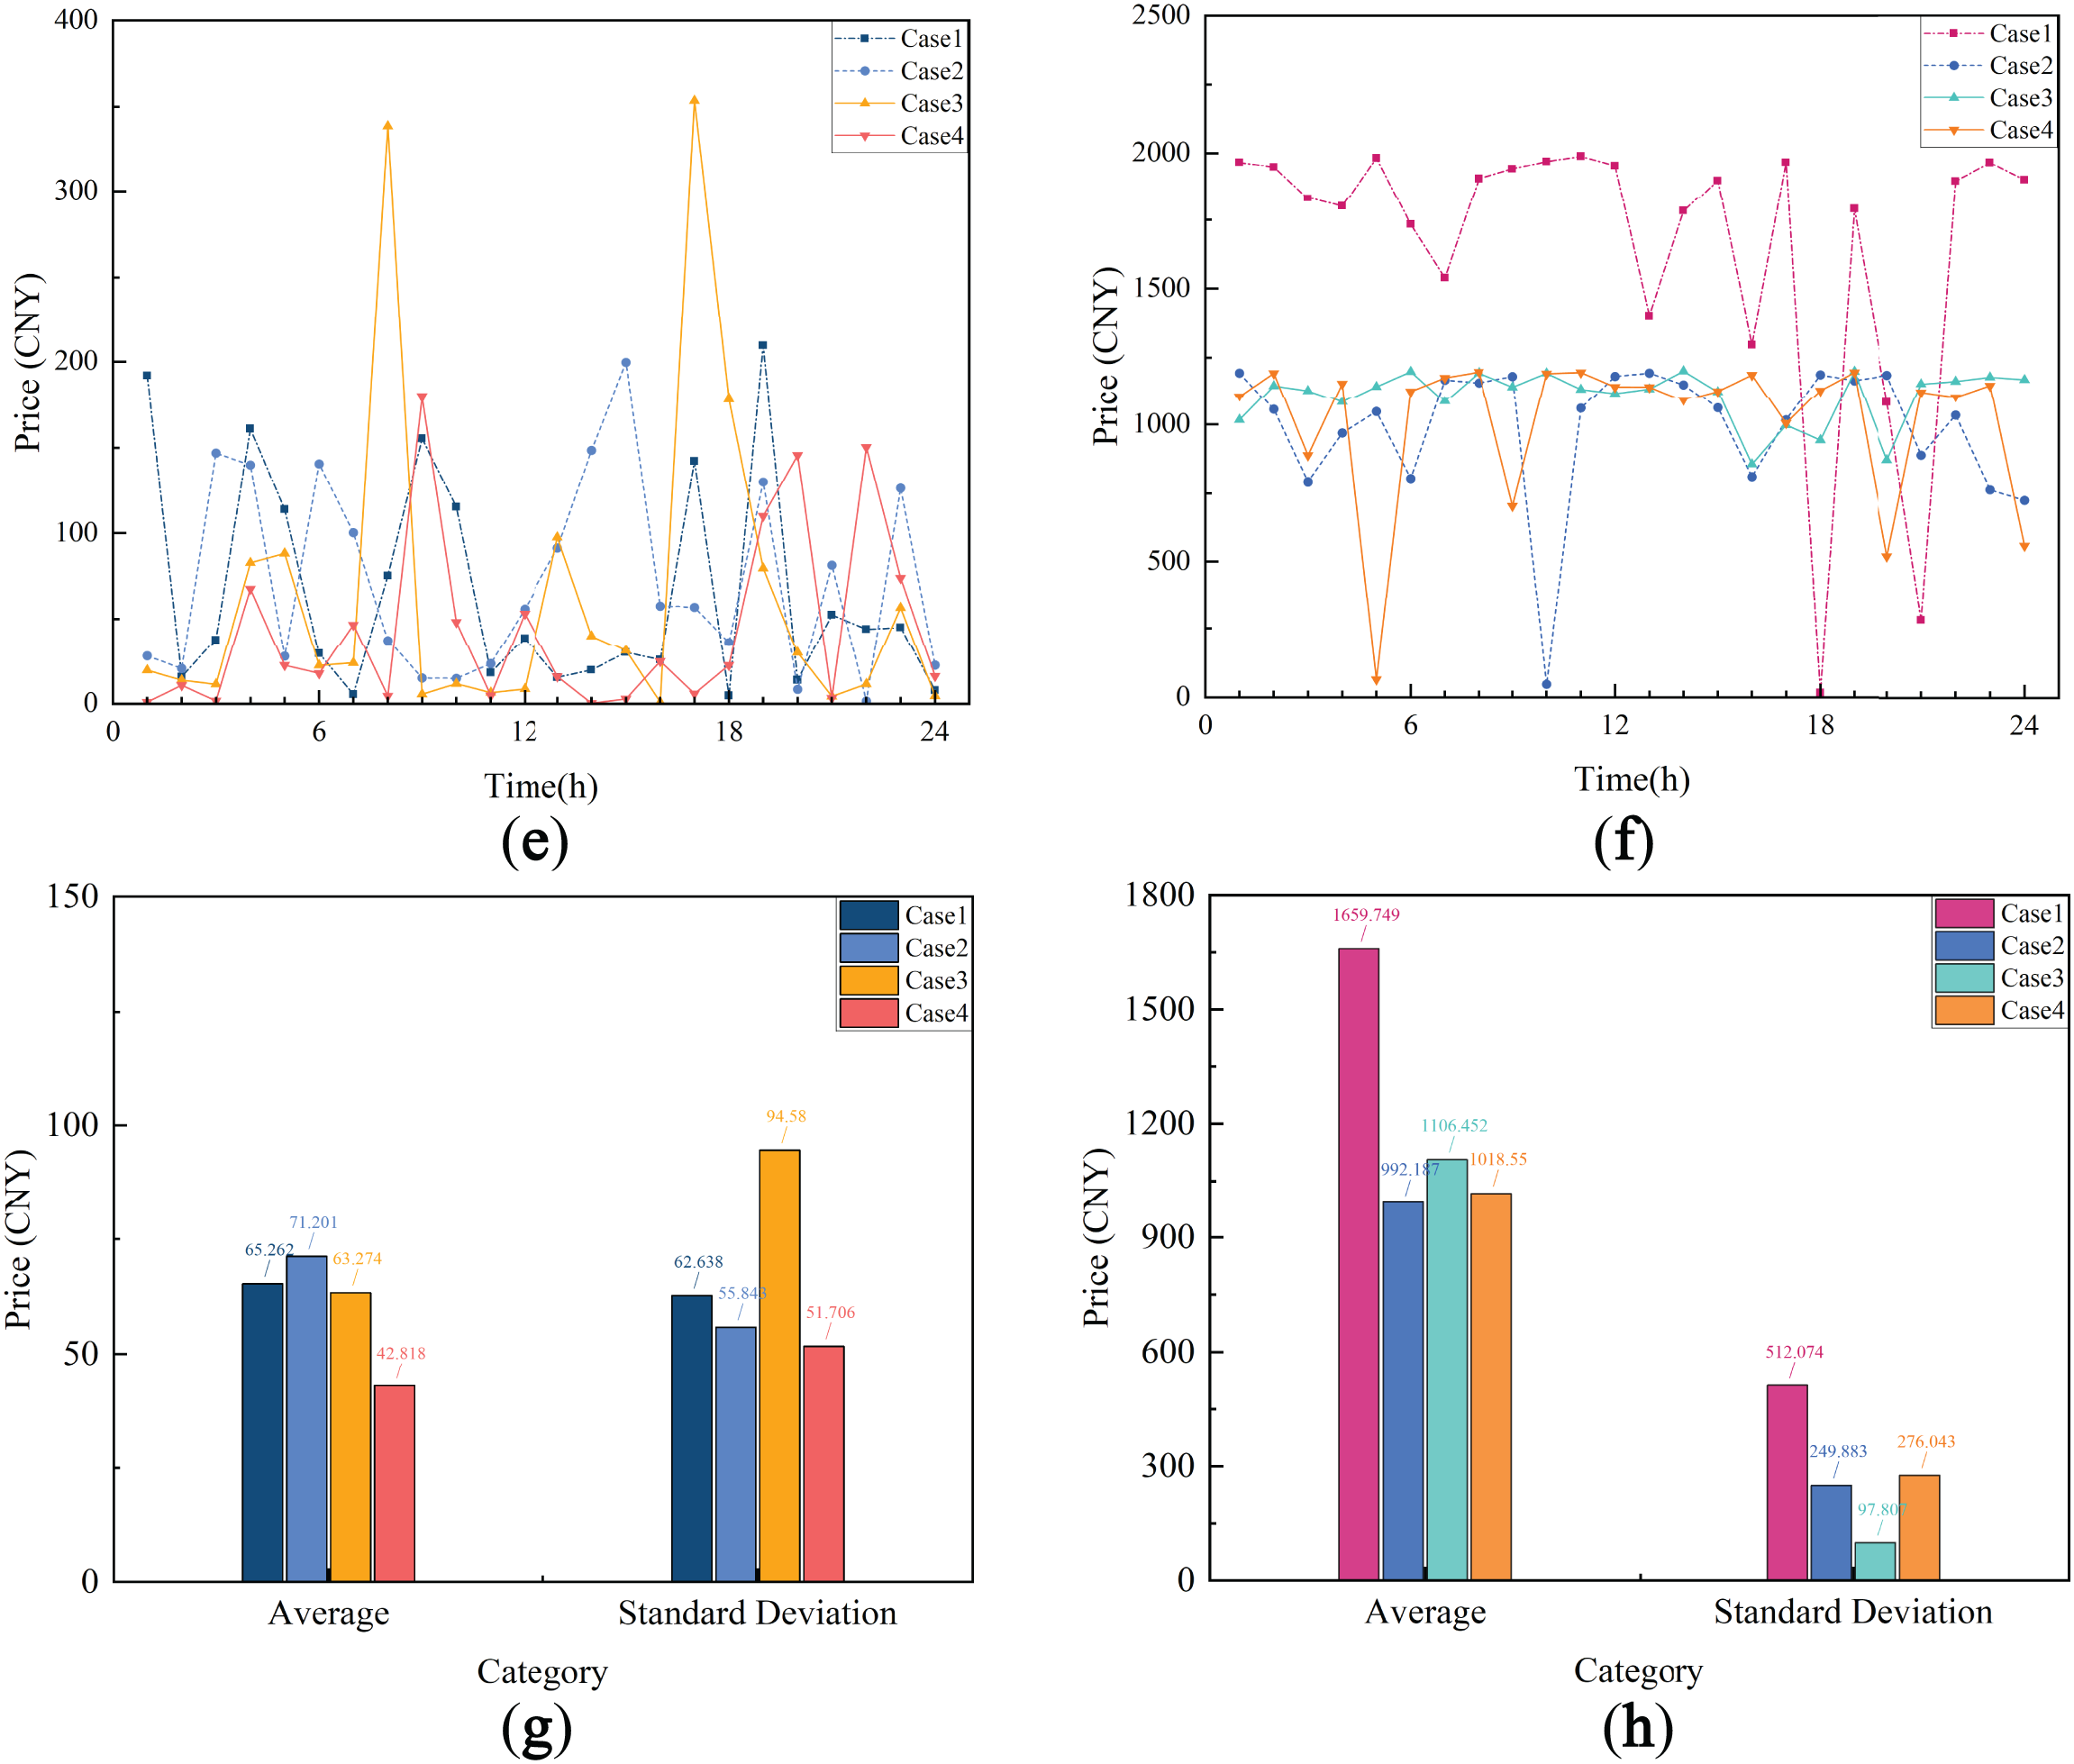
Figure 11: Price curves and their averages and standard deviations. (a) Charging capacity price curve; (b) Discharging capacity price curve; (c) Charging capacity price and its variability; (d) Discharging capacity price and its variability; (e) Charging power price curve; (f) Discharging power price curve; (g) Charging power price and its variability; (h) Discharging power price and its variability
The fluctuation of power prices is more pronounced compared to capacity prices. Let’s first analyze the charging power prices. In Case 1, the overall price fluctuation is relatively smooth, with peaks and troughs distributed evenly. The price stays at a low level for most periods, with slight peaks observed only at specific times (such as at 6 h and 18 h). In Case 2, the price fluctuation is minimal, with the overall level being low and stable, and there are almost no significant price surges. Case 3 exhibits the highest volatility, with notable price spikes around the 12-h and 18-h marks, indicating strong fluctuations. Case 4 shows price fluctuation characteristics similar to those of Case 2, but with small price variations in certain periods (such as around 6 h and 18 h). The specific charging power price curves, along with the average prices and standard deviations, are shown in Fig. 11e,g, respectively.
Next, let’s look at the discharge power prices. In Case 1, the price cap is the highest, so the discharge power price is the highest as well, showing significant fluctuations during multiple periods, which reflects the strong influence of the price cap effect. In contrast, the discharge power prices in Case 2 and Case 3 are relatively low, with smaller fluctuations, resulting in more stable prices. Case 4 experiences greater volatility in discharge power prices, particularly during certain periods (such as around 6 h and 18 h), where significant drops are observed, indicating some instability. The specific discharge power price curves, along with the average prices and standard deviations, are shown in Fig. 11f,h, respectively.
5.2.3 Comparison of WF Operation Strategies
Under the influence of similar weather factors in the region, the bidding power of WFA and WFB in the DAEM in Case 1 to Case 4 shows an overall similar trend. However, there are still some subtle differences, especially in Case 4, where the bidding power curve is smoother compared to other cases. The specific bidding power situation is shown in Fig. 12a.
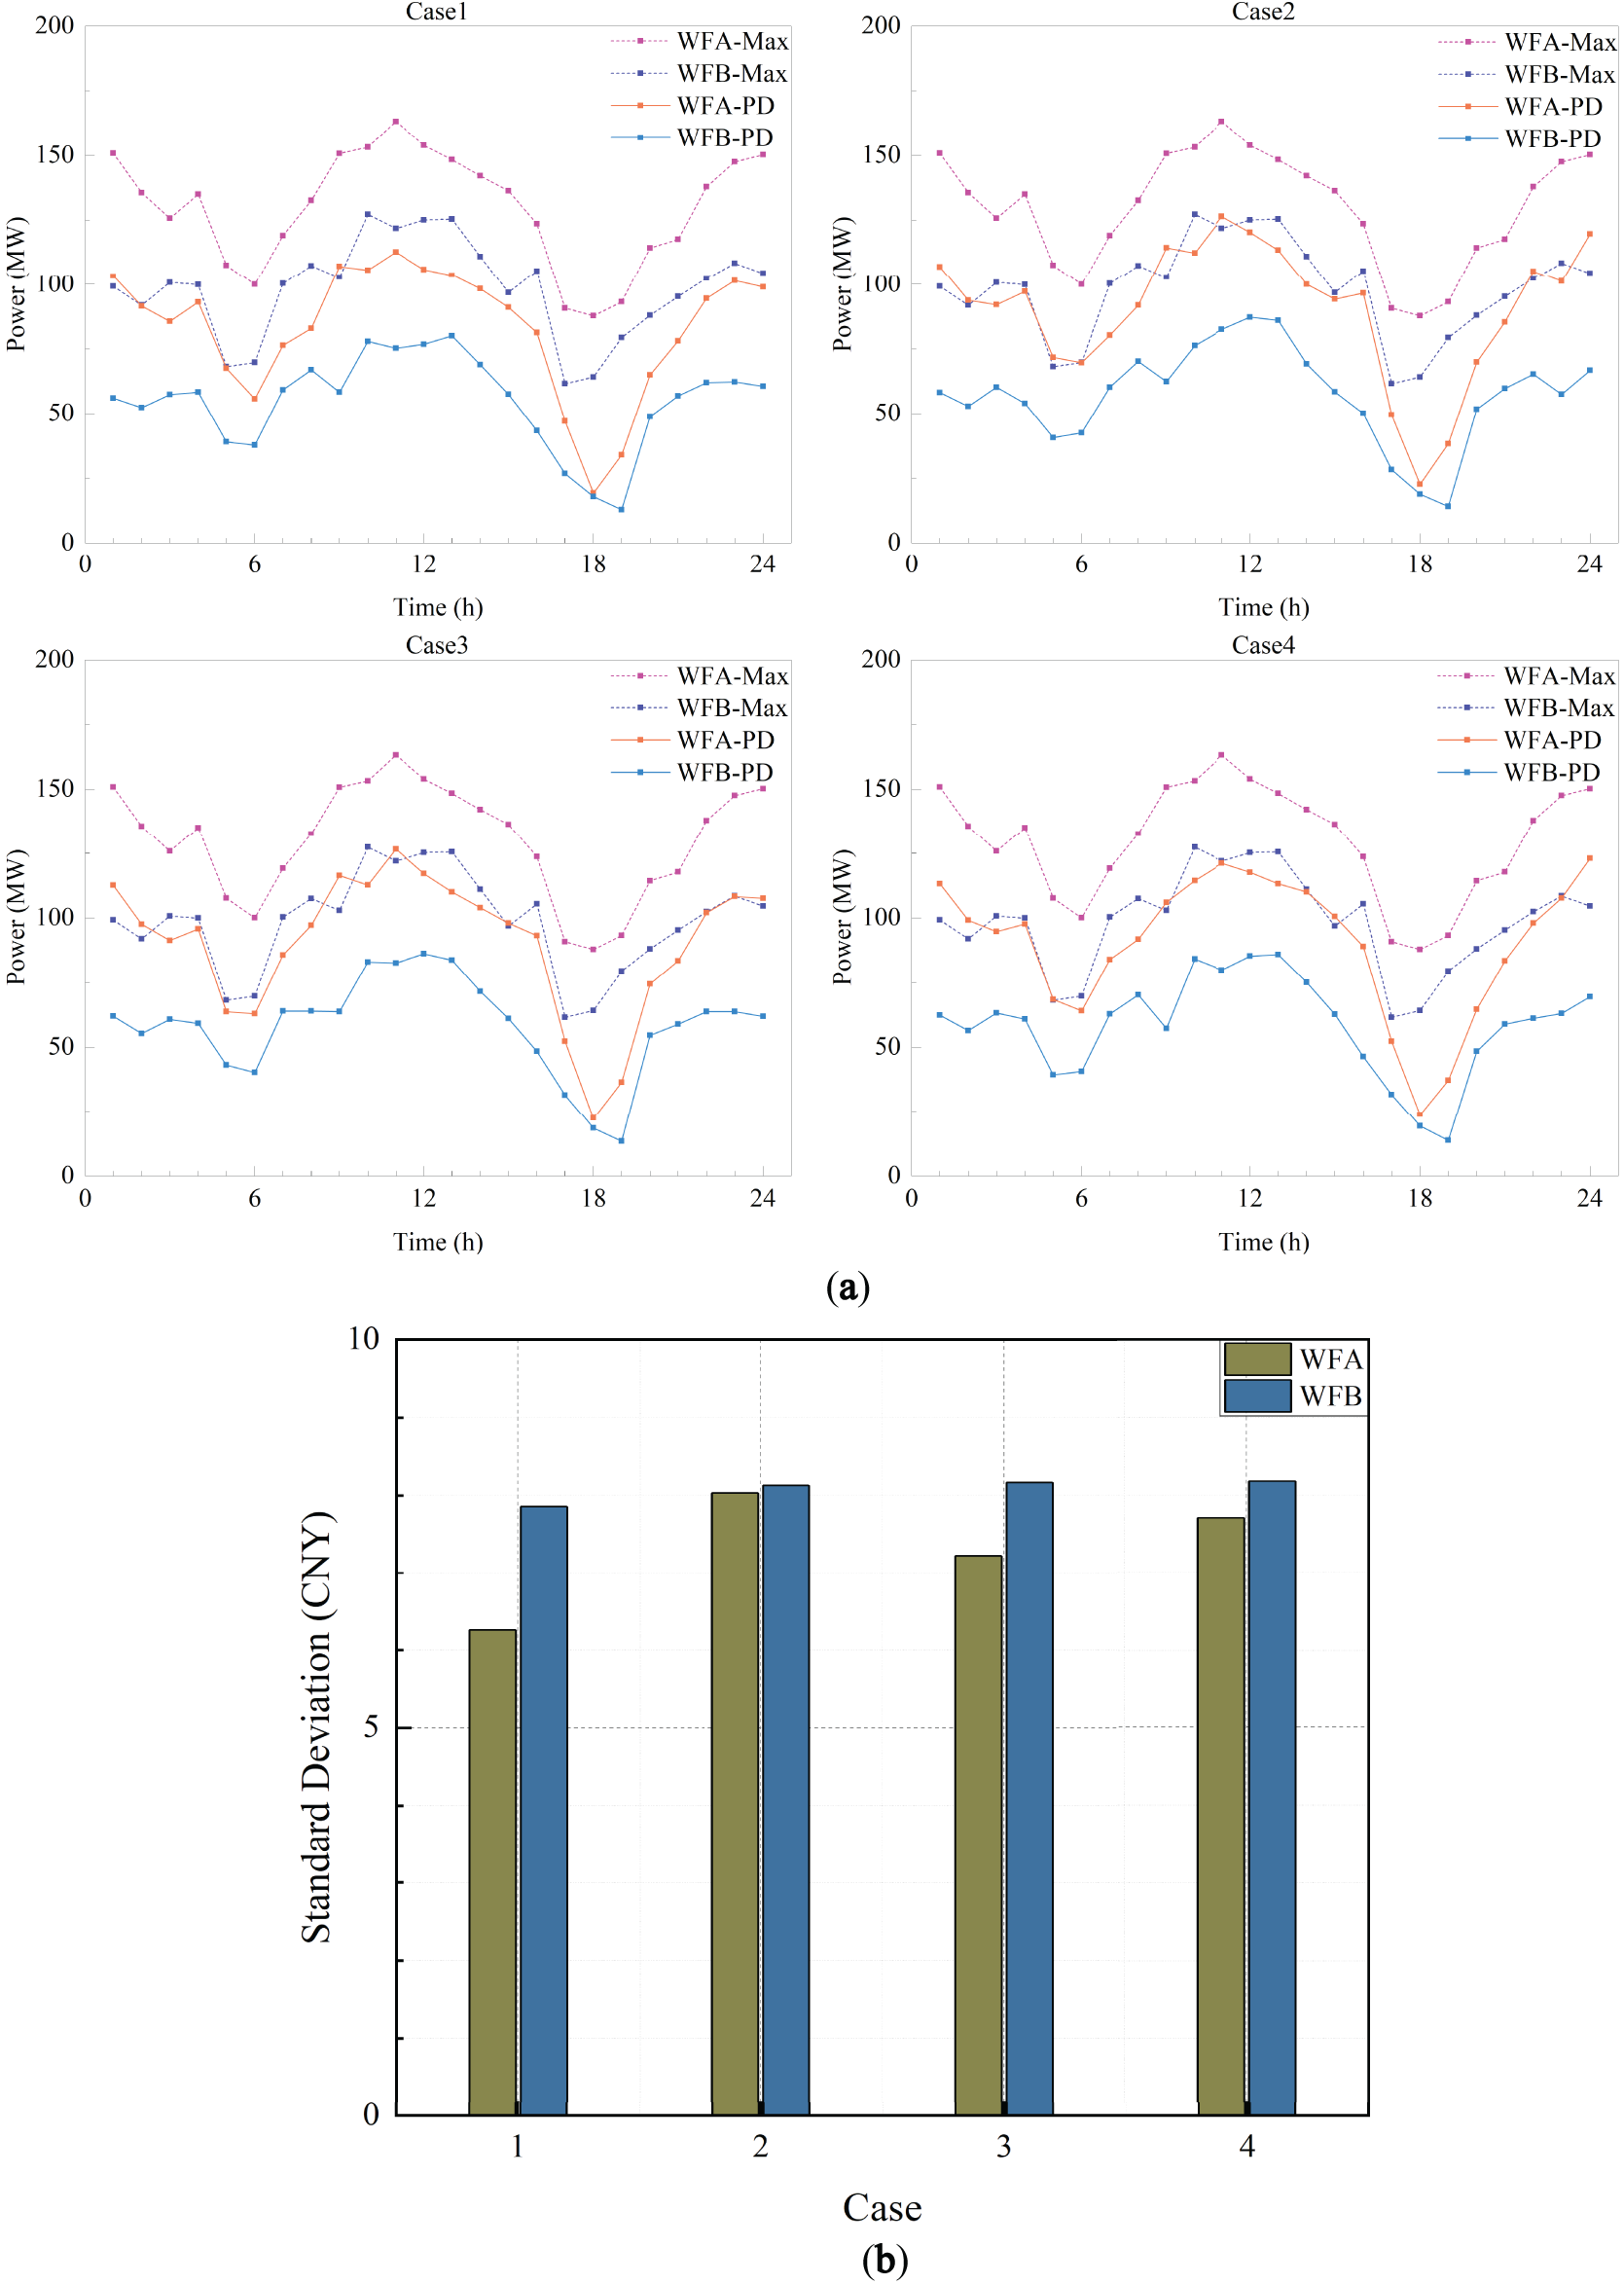
Figure 12: Wind farm bidding and leasing capacity power curves. (a) Bidding power curve chart; (b) Standard deviation of the difference between bidding power and peak power
Regarding the ability of the WF to track the maximum predicted power, first, as described in Section 5.2.1 regarding the leased storage capacity in each case, Case 1 participates in the bidding without relying on storage leasing, so its market bidding power is closest to the maximum predicted power curve. Secondly, Case 3 and Case 4 are able to better track the maximum predicted power curve. Finally, Case 2, by leasing a larger ES capacity, participates in the power market bidding, and through the use of a larger storage capacity, effectively reduces the impact of wind power fluctuations on the market bidding power. The standard deviation of the bidding power tracking the maximum predicted power is shown in Fig. 12b.
The leasing of charging and discharging capacities by WF are interrelated. Generally, the larger the leased charging and discharging capacities, the lower the deviation of WF in the DAEM, but the leasing cost also increases accordingly. Therefore, the charging and discharging capacities of ES will not expand aimlessly in both directions. As shown in the leasing capacity waveforms of Case 1 to Case 4 in Fig. 13a, when a wind farm chooses to increase the charging capacity and sell some of the energy to the storage system, it will correspondingly reduce the leased discharging capacity, thus lowering the bidding power in the DAEM. On the other hand, when WF decides to expand its bidding scale in the DAEM, it will lease more discharging capacity from the ES system and reduce the leasing of charging capacity.
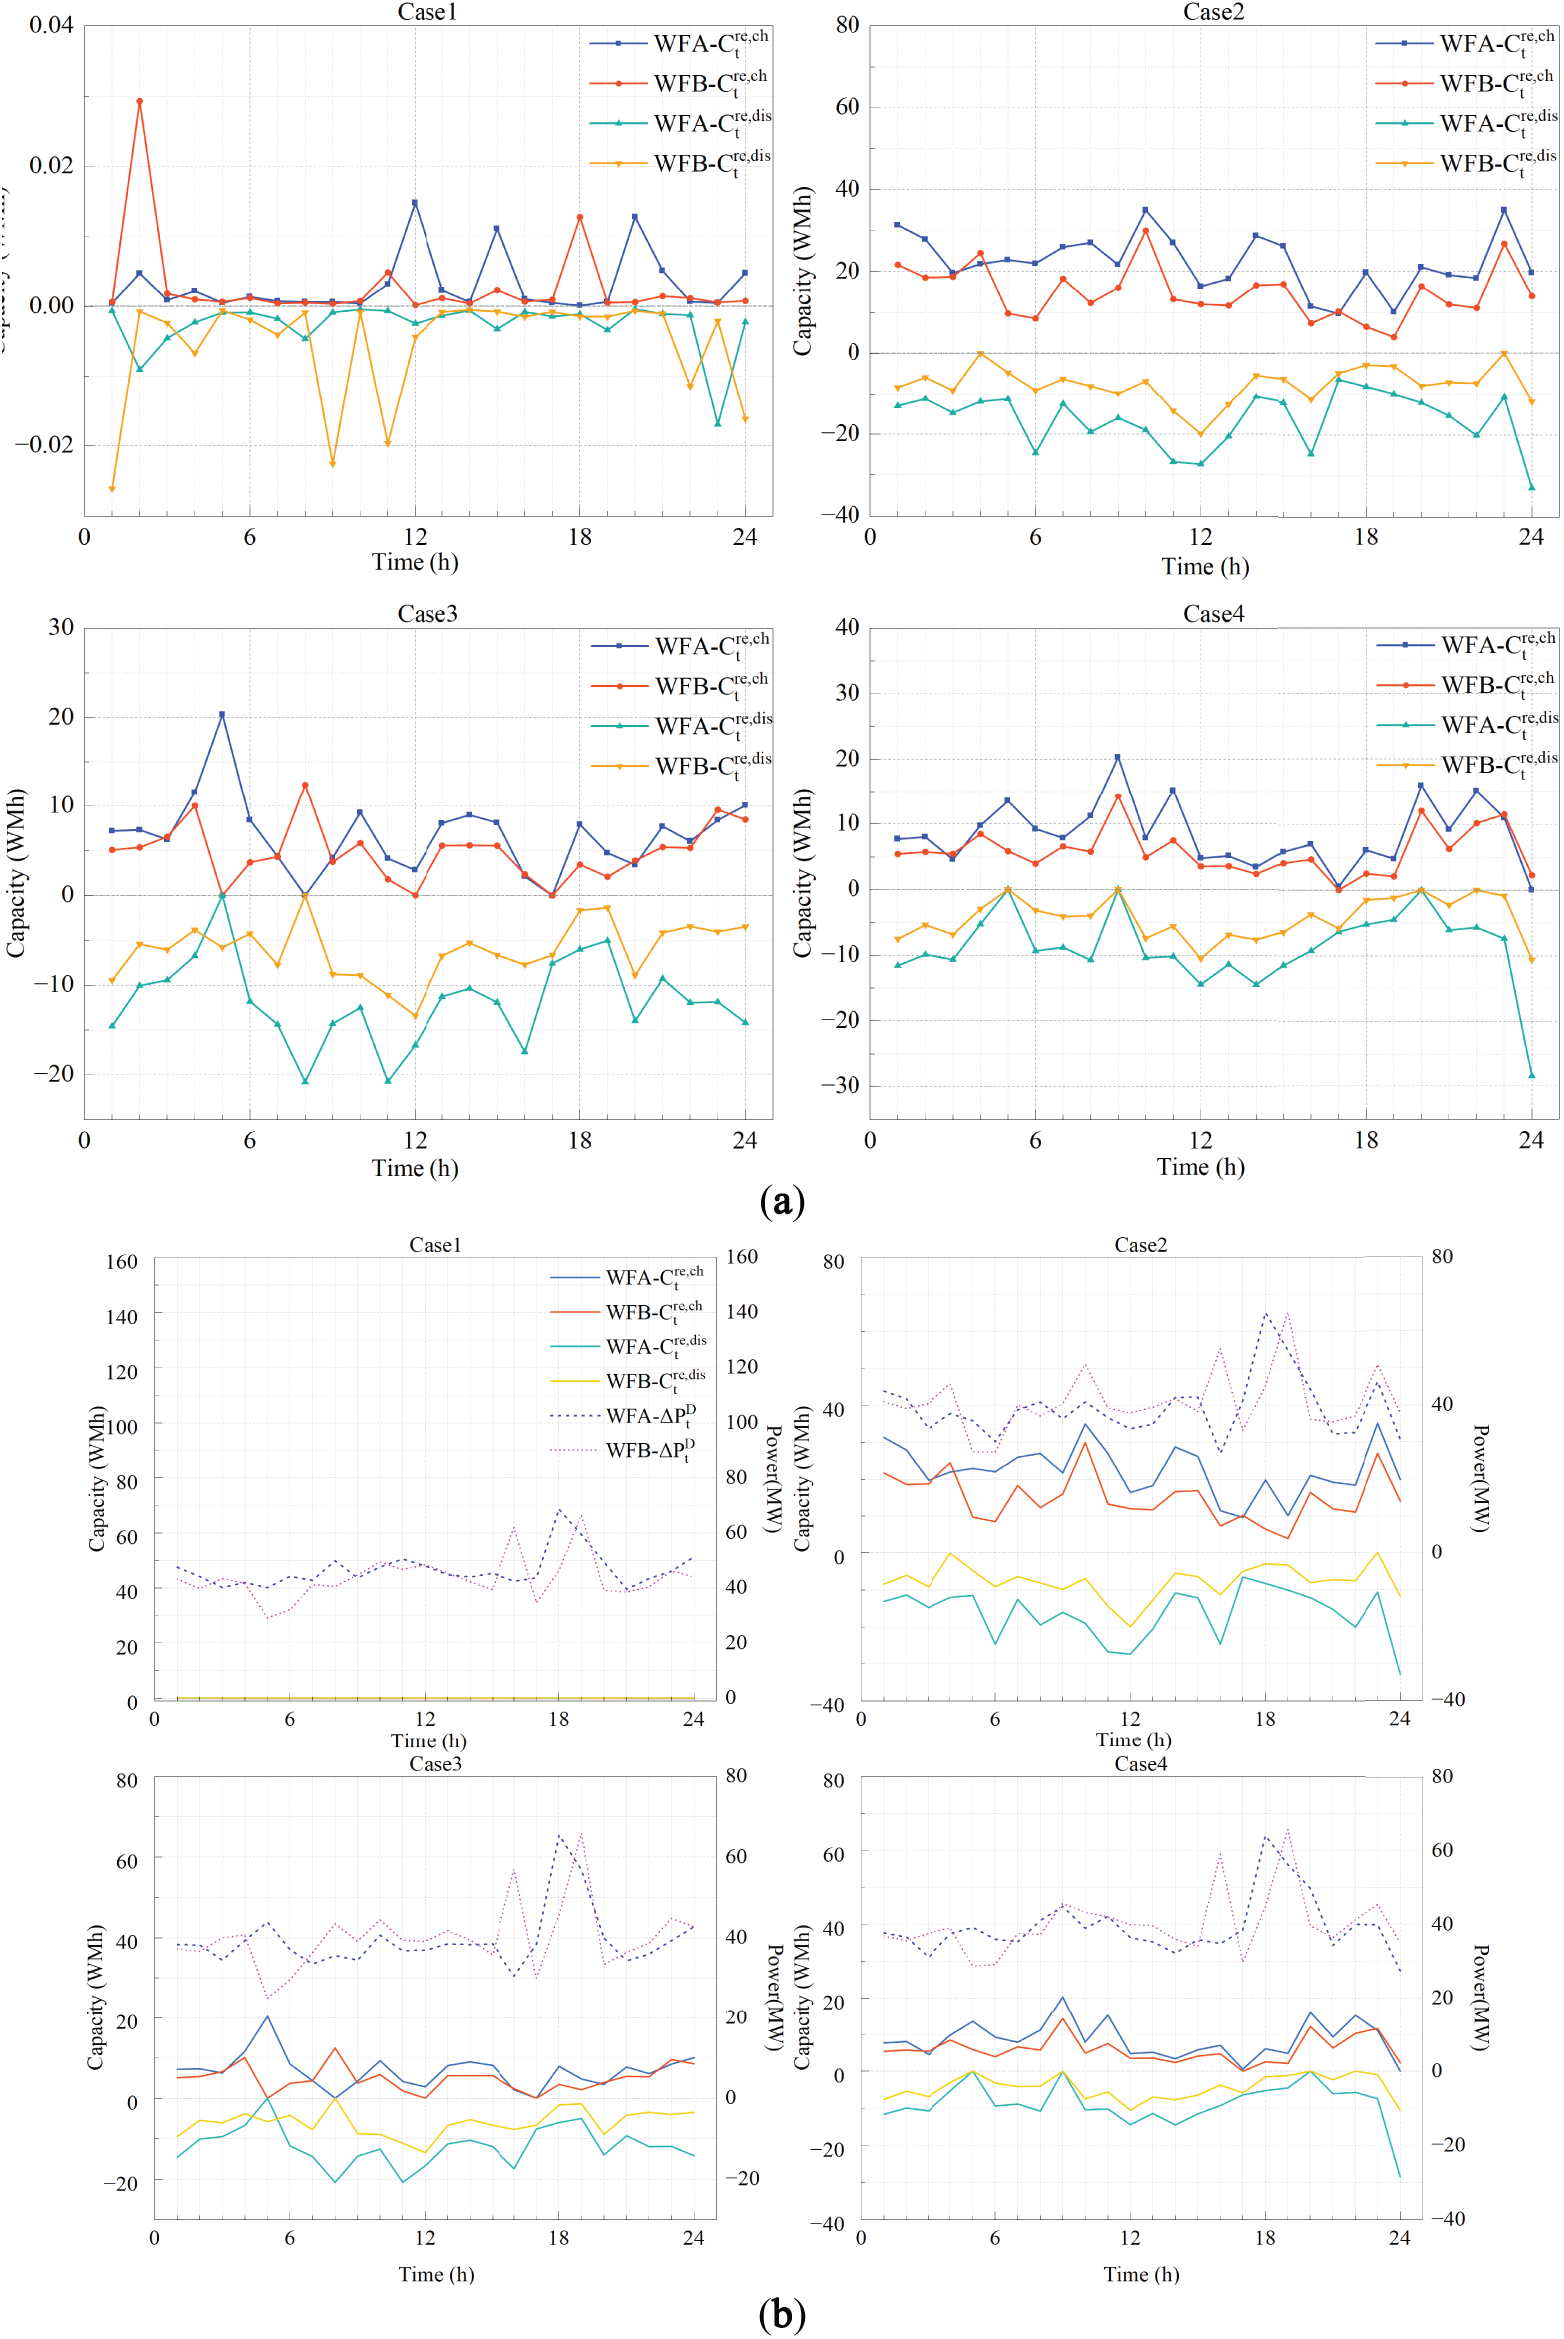
Figure 13: Charging and discharging capacity curves for each case. (a) Charging and discharging capacity curve; (b) Bidding power and leasing capacity curve
In terms of leasing capacity, WFA is much larger than WFB. Therefore, without considering the differences in bidding power, WFA should lease a larger capacity, as shown in Case 2 and Case 4 in Fig. 13a. However, at certain moments, the capacity and power of the ES are limited, which may lead to competition between WF, resulting in a sharp increase in leasing costs. To avoid excessive competition and cost escalation, WFA and WFB will adopt different leasing strategies at these moments. For example, at t5 in Case 3, WFA and WFB adopt completely different leasing strategies, choosing to lease only charging capacity and only discharging capacity, respectively, to cope with potential wind curtailment and imbalance losses. At t8, the strategies of WFA and WFB are the opposite of those at t5.
By analyzing the impact of bidding power changes on the leasing capacity, since the leasing capacity in Case 1 is relatively small, it is not included in further analysis. In Case 2 to Case 4, the trend of the difference between the bidding power and the predicted maximum power (denoted as
5.2.4 Comparison of Energy Storage States
The leasing content needs to consider not only the economic benefits of WF and ES but also the actual state of the ES. In this scheme, the discharging capacity and SoC states for each case are shown in Fig. 14a,b, respectively. Case 1 leases a very small capacity, and the change in ES state is negligible; Case 2 leases excessive ES capacity, selling large amounts of power to storage to avoid grid deviation penalties, thereby shifting the risk to ES and achieving higher revenue. Case 3 leases excess discharging capacity to transfer potential deviation risks. Case 4 achieves high revenue for both WF and ES under reasonable PRC and SoC conditions.
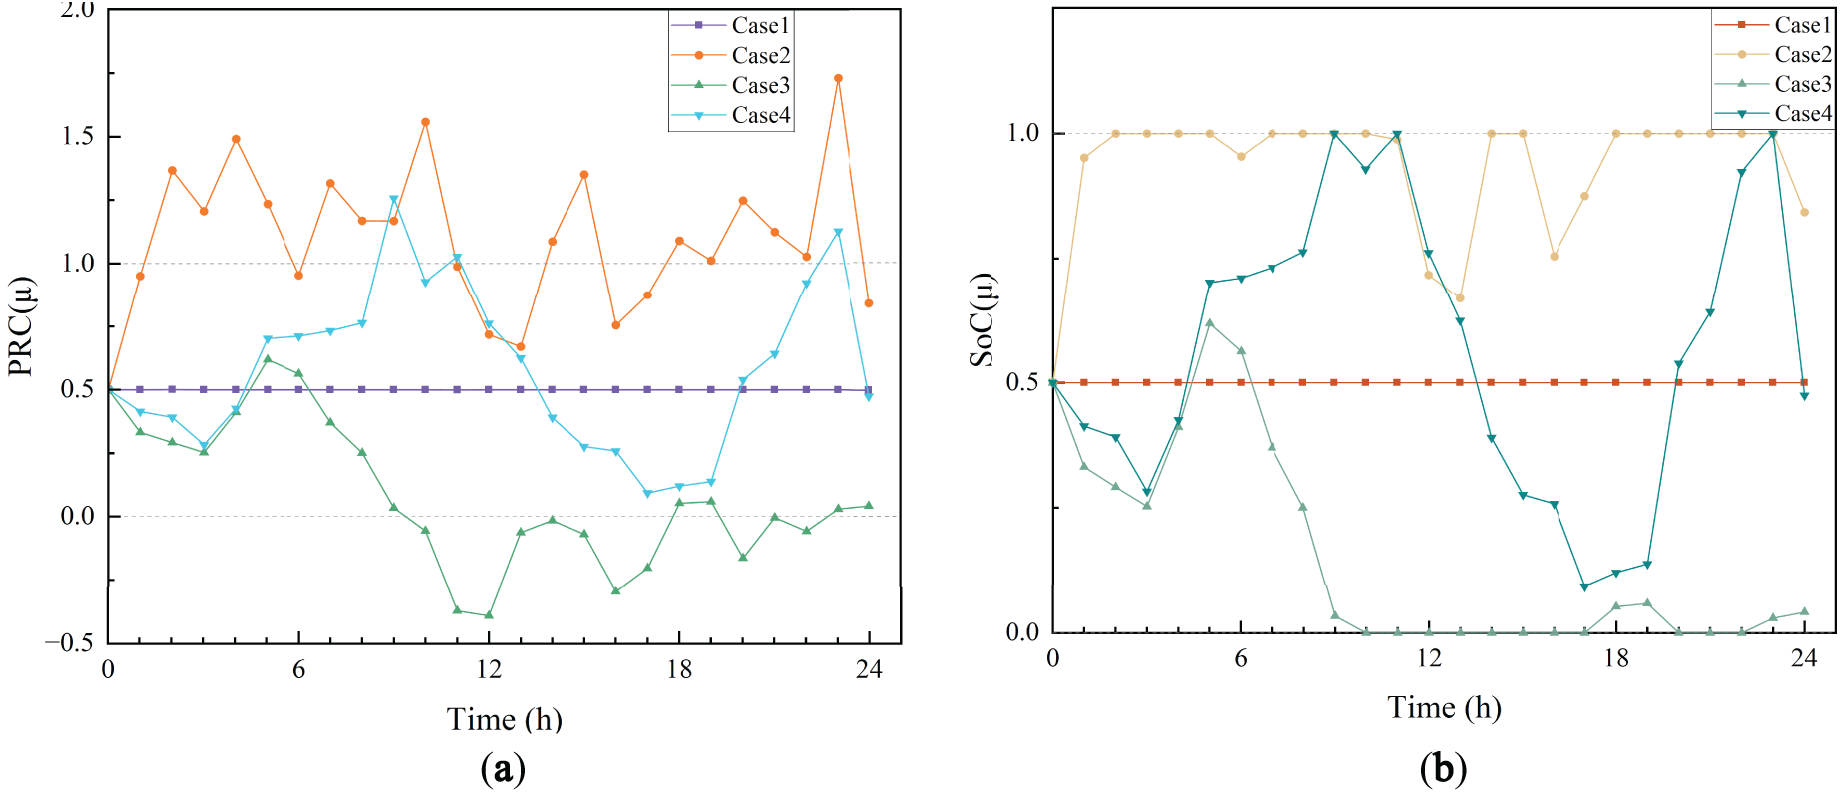
Figure 14: Comparison curve of PRC and SoC states of energy storage. (a) PRC of energy storage; (b) SoC of energy storage
This paper addresses the challenges posed by wind power output uncertainty, as well as the high costs, low utilization rates, and long payback periods associated with dedicated energy storage systems, by proposing an energy storage leasing scheme. The proposed scheme optimizes the leasing of capacity and power to enhance system profitability while accounting for energy storage degradation costs. Based on a revenue model derived from power distribution, it optimizes the bidding and leasing decisions of wind farms in the day-ahead market and employs a Stackelberg game model to refine the pricing strategy for energy storage, analyzing key influencing factors. Additionally, this paper designs a framework for joint participation of wind power and energy storage in the DAEM, focusing on the pricing of storage capacity and power. The framework incorporates multiple pricing intervals and verifies their effectiveness through simulation case studies. The analysis covers various aspects, including final revenues, transaction prices, bidding quantities, bilateral leasing agreements, PRC, and SoC. The key conclusions are as follows:
(1) A reasonable price range is key to achieving the joint wind-storage transaction. It not only optimizes the revenue distribution among market participants but also improves resource allocation efficiency, reduces volatility risks, and ensures the economic benefits and long-term stability of the wind-storage system.
(2) Within the established price range, the ES can set prices for each time period based on leasing demand. This approach not only reduces wind curtailment and grid deviation but also increases revenue, significantly improving ES utilization and shortening the ES payback period.
(3) Considering the factors of ES lifetime degradation can optimize the storage output strategy, making the SoC curve smoother and the charging/discharging range more reasonable, thereby reducing unnecessary battery lifespan degradation.
The results of this study provide a theoretical basis and practical guidance for optimizing smart grids and energy storage systems, with significant application value and potential. However, this study only considers the lifecycle losses of energy storage systems and wind power fluctuations, without fully accounting for factors such as advancements in battery technology and market price fluctuations. Future research could further explore the cost-benefit analysis of different energy storage technologies, optimize the interaction between energy storage and the grid, and analyze the applicability of shared energy storage services under different market conditions. Additionally, more complex game models could be introduced to explore dynamic multi-party collaboration and competition, enhancing the adaptability and feasibility of the proposed solutions.
Acknowledgement: This research was supported by the Key Laboratory of Modern Power System Simulation and Control & Renewable Energy Technology, Ministry of Education (Northeast Electric Power University), and State Grid Jilin Electric Power Co., Ltd. Electric Power Research Institute, which provided funding, technical support, and data resources. We have confirmed that all acknowledged individuals and organizations have consented to being recognized for their contributions, which have been invaluable in advancing the goals of this study.
Funding Statement: This study was supported by the Technology Project of the State Grid Corporation Headquarters (Project No. 4000-202399368A-2-2-ZB).
Author Contributions: The authors confirm contribution to the paper as follows: study conception, task division, content planning, model development, simulation validation, and draft manuscript preparation: Xingxu Zhu, Guiqing Zhao; project introduction, progress and direction oversight, funding acquisition, and final manuscript review: Gangui Yan, Junhui Li; data support, practical validation, and final manuscript review: Hongda Dong, Chenggang Li. All authors reviewed the results and approved the final version of the manuscript.
Availability of Data and Materials: Due to the nature of this research, the data are restricted by confidentiality clauses in contracts and legal regulations, so supporting data is not available.
Ethics Approval: Not applicable.
Conflicts of Interest: The authors declare no conflicts of interest to report regarding the present study.
Abbreviations
| PRC | Percentage of Rental Capacity |
| SoC | State of Charge |
| ES | Energy Storage |
| WF | Wind Farms |
| DAEM | Day-Ahead Energy Market |
here, PRC refers to the proportion of the rental capacity that the energy storage system has currently sold externally.
SoC refers to the current state of charge of the energy storage system.
References
1. Zhao Y, Su Q, Li B, Zhang Y, Wang X, Zhao H, et al. Have those countries declaring zero carbon or carbon neutral climate goals achieved carbon emissions-economic growth decoupling? J Clean Prod. 2022;363(1):132450. doi:10.1016/j.jclepro.2022.132450. [Google Scholar] [CrossRef]
2. Xiao X, Yin J, Chen L, Wang M, Zhao Y, Li Z. Evolutionary game-theoretic modeling of massive distributed renewable energy deployment towards low-carbon distribution networks. J Mod Power Syst Clean Energy. 2023;11(4):1519–28. doi:10.35833/mpce.2022.000434. [Google Scholar] [CrossRef]
3. Hou Q, Du E, Zhang N, Kang C. Impact of high renewable penetration on the power system operation mode: a data-driven approach. IEEE Trans Power Syst. 2019;35(1):731–41. doi:10.1109/TPWRS.2019.2929276. [Google Scholar] [CrossRef]
4. Nosair H, Bouffard F. Reconstructing operating reserve: flexibility for sustainable power systems. IEEE Trans Sustain Energy. 2015;6(4):1624–37. doi:10.1109/TSTE.2015.2462318. [Google Scholar] [CrossRef]
5. Auguadra M, Ribó-Pérez D, Gómez-Navarro T. Planning the deployment of energy storage systems to integrate high shares of renewables: the Spain case study. Energy. 2023;264(11):126275. doi:10.1016/j.energy.2022.126275. [Google Scholar] [CrossRef]
6. Scheben H, Hufendiek K. Modelling power prices in markets with high shares of renewable energies and storages—the Norwegian example. Energy. 2023;267(4):126451. doi:10.1016/j.energy.2022.126451. [Google Scholar] [CrossRef]
7. Xu B, Dvorkin Y, Kirschen DS, Silva-Monroy CA, Watson JP. A comparison of policies on the participation of storage in U.S. frequency regulation markets. In: 2016 IEEE Power and Energy Society General Meeting (PESGM); 2016 Jul 17–21; Boston, MA, USA. p. 1–5. doi:10.1109/PESGM.2016.7741531. [Google Scholar] [CrossRef]
8. Li Y, Yang Z, Li G, Zhao D, Tian W. Optimal scheduling of an isolated microgrid with battery storage considering load and renewable generation uncertainties. IEEE Trans Ind Electron. 2019;66(2):1565–75. doi:10.1109/TIE.2018.2840498. [Google Scholar] [CrossRef]
9. Su HI, El Gamal A. Modeling and analysis of the role of energy storage for renewable integration: power balancing. IEEE Trans Power Syst. 2013;28(4):4109–17. doi:10.1109/TPWRS.2013.2266667. [Google Scholar] [CrossRef]
10. Sepulveda NA, Jenkins JD, Edington A, Mallapragada DS, Lester RK. The design space for long-duration energy storage in decarbonized power systems. Nat Energy. 2021;6(5):506–16. doi:10.1038/s41560-021-00796-8. [Google Scholar] [CrossRef]
11. Divya KC, Østergaard J. Battery energy storage technology for power systems—an overview. Electr Power Syst Res. 2009;79(4):511–20. doi:10.1016/j.epsr.2008.09.017. [Google Scholar] [CrossRef]
12. Krishnamurthy D, Uckun C, Zhou Z, Thimmapuram PR, Botterud A. Energy storage arbitrage under day-ahead and real-time price uncertainty. IEEE Trans Power Syst. 2018;33(1):84–93. doi:10.1109/TPWRS.2017.2685347. [Google Scholar] [CrossRef]
13. Wang Y, Dvorkin Y, Fernández-Blanco R, Xu B, Qiu T, Kirschen DS. Look-ahead bidding strategy for energy storage. IEEE Trans Sustain Energy. 2017;8(3):1106–17. doi:10.1109/TSTE.2017.2656800. [Google Scholar] [CrossRef]
14. Pandžić H, Dvorkin Y, Carrión M. Investments in merchant energy storage: trading-off between energy and reserve markets. Appl Energy. 2018;230(5):277–86. doi:10.1016/j.apenergy.2018.08.088. [Google Scholar] [CrossRef]
15. Song X, Zhang H, Fan L, Zhang Z, Peña-Mora F. Planning shared energy storage systems for the spatio-temporal coordination of multi-site renewable energy sources on the power generation side. Energy. 2023;282(1):128976. doi:10.1016/j.energy.2023.128976. [Google Scholar] [CrossRef]
16. Kim JH, Powell WB. Optimal energy commitments with storage and intermittent supply. Oper Res. 2011;59(6):1347–60. doi:10.1287/opre.1110.0971. [Google Scholar] [CrossRef]
17. Fleischhacker A, Auer H, Lettner G, Botterud A. Sharing solar PV and energy storage in apartment buildings: resource allocation and pricing. IEEE Trans Smart Grid. 2019;10(4):3963–73. doi:10.1109/TSG.2018.2844877. [Google Scholar] [CrossRef]
18. Zhang C, Jiang W, Luo Y, Lan S. Collaborative optimal operation of multiple data center microgrids and shared energy storage considering wind power and photovoltaic uncertainty. Power Syst Prot Control. 2025;53(4):72–84. doi:10.19783/j.cnki.pspc.240732. [Google Scholar] [CrossRef]
19. Xu Y, He X, Gao S, Li T, Pang D. Enhanced energy storage performance of BiScO3 modified Bi0.5Na0.5TiO3-BaTiO3 lead-free ferroelectric ceramics. J Alloys Compd. 2024;1008(34):176548. doi:10.1016/j.jallcom.2024.176548. [Google Scholar] [CrossRef]
20. Kriaa I, Maalej A. Pyroelectric energy harvesting, storage properties and electrocaloric effect of BNBT-ST ferroelectric ceramics. J Energy Storage. 2024;102(2020):114044. doi:10.1016/j.est.2024.114044. [Google Scholar] [CrossRef]
21. Teleke S, Baran ME, Bhattacharya S, Huang AQ. Optimal control of battery energy storage for wind farm dispatching. IEEE Trans Energy Convers. 2010;25(3):787–94. doi:10.1109/TEC.2010.2041550. [Google Scholar] [CrossRef]
22. Xu B, Zhao J, Zheng T, Litvinov E, Kirschen DS. Factoring the cycle aging cost of batteries participating in electricity markets. IEEE Trans Power Syst. 2017;33(2):2248–59. doi:10.1109/TPWRS.2017.2733339. [Google Scholar] [CrossRef]
23. Gao S, Wang W, Li X, Wang H, Ding Y. Trading mechanism for centralized shared energy storage in wind farm clusters with incentive-compatible characteristics. Power Syst Prot Control. 2025;53(4):108–19. doi:10.19783/j.cnki.pspc.240643. [Google Scholar] [CrossRef]
24. Li J, Fang Z, Wang Q, Zhang M, Li Y, Zhang W. Optimal operation with dynamic partitioning strategy for centralized shared energy storage station with integration of large-scale renewable energy. J Mod Power Syst Clean Energy. 2024;12(2):359–70. doi:10.35833/mpce.2023.000345. [Google Scholar] [CrossRef]
25. Chen C, Zhu Y, Zhang T, Li Q, Li Z, Liang H, et al. Two-stage multiple cooperative games-based joint planning for shared energy storage provider and local integrated energy systems. Energy. 2023;284(5):129114. doi:10.1016/j.energy.2023.129114. [Google Scholar] [CrossRef]
26. Maharjan S, Zhu Q, Zhang Y, Gjessing S, Basar T. Dependable demand response management in the smart grid: a Stackelberg game approach. IEEE Trans Smart Grid. 2013;4(1):120–32. doi:10.1109/TSG.2012.2223766. [Google Scholar] [CrossRef]
27. Omar N, Abdel Monem M, Firouz Y, Salminen J, Smekens J, Hegazy O, et al. Lithium iron phosphate based battery-Assessment of the aging parameters and development of cycle life model. Appl Energy. 2014;113:1575–85. doi:10.1016/j.apenergy.2013.09.003. [Google Scholar] [CrossRef]
Cite This Article
 Copyright © 2025 The Author(s). Published by Tech Science Press.
This work is licensed under a Creative Commons Attribution 4.0 International License , which permits unrestricted use, distribution, and reproduction in any medium, provided the original work is properly cited.
 Downloads
 Citation Tools