
 Submit a Paper
 Propose a Special lssue
 Open Access
ARTICLE

Numerical Simulation on Depressurization-Driven Production of Class I Hydrate Deposits with Transition Layer and Perforation Modes Optimization
1 Petroleum Exploration and Production Research Institute, SINOPEC, Beijing, 102206, China
2 Key Laboratory of Unconventional Oil & Gas Development, China University of Petroleum (East China), Ministry of Education, Qingdao, 266580, China
3 School of Petroleum Engineering, China University of Petroleum (East China), Qingdao, 266580, China
* Corresponding Author: Yajie Bai. Email:
(This article belongs to the Special Issue: Integrated Geology-Engineering Simulation and Optimizationfor Unconventional Oil and Gas Reservoirs)
Energy Engineering 2025, 122(6), 2503-2518. https://doi.org/10.32604/ee.2025.063198
Received 08 January 2025; Accepted 28 March 2025; Issue published 29 May 2025
 View Full Text
 Download PDF
Abstract
Natural gas hydrate widely exists in the South China Sea as clean energy. A three-phase transition layer widely exists in low permeability Class I hydrates in the Shenhu offshore area. Therefore, taking into account the low-permeability characteristics with an average permeability of 5.5 mD and moderate heterogeneity, a 3-D geological model of heterogeneous Class I hydrate reservoirs with three-phase transition layers is established by Kriging interpolation and stochastic modeling method, and a numerical simulation model is used to describe the depressurization production performance of the reservoir. With the development of depressurization, a specific range of complete decomposition zones appear both in the hydrate and transition layers. The entire decomposition zone of the whole reservoir tends to outward and upward diffusion. There is apparent methane escape in the three-phase transition layer. Due to the improvement of local permeability caused by the phase transition of hydrate dissociation, some methane accumulation occurs at the bottom of the hydrate layer, forming a local methane enrichment zone. The methane migration trends in reservoirs are mainly characterized by movement toward production wells and hydrate layers under the influence of gravity. However, due to the permeability limitation of hydrate reservoirs, many fluids have not been effectively produced and remain in the reservoir. Therefore, to improve the effective pressure drop of the reservoir, the perforation method and pressure reduction method were optimized by analyzing the influencing factors based on the gas production rate. The comparative study demonstrates that perforating through the free gas layer combined with one-time depressurization can enhance the effective depressurization and improve production performance. The gas production rate from perforating through the free gas layer can be twice as high as that from perforating through the transition layer. This study can provide theoretical support for the utilization of marine energy.Keywords
Gas hydrates are widely distributed in permafrost or in deep seawater with a depth of more than 500 m [1–4]. Low temperature, high pressure, sufficient natural gas sources, and favorable reservoir space are the fundamental conditions for gas hydrate formation [5–7]. Different from conventional oil and gas reservoir exploitation mechanisms, hydrate is decomposed into movable fluid (gas and water) by destroying or changing phase equilibrium conditions. At present, hydrate production methods mainly include depressurization, thermal stimulation, inhibitor injection, gas exchange, and solid fluidization [8–12]. Among the above methods for hydrate deposit development, the depressurization method stands out as the most technologically mature, cost-effective, and economically viable option [13]. It requires no special equipment or external energy injection, making it an efficient choice [14]. The depressurization method has been widely applied in trial production of hydrate deposits in various countries, including Canada, the United States, China, and others [15–19].
According to geological structure and reservoir conditions, hydrate reservoirs can be divided into three classes [20,21]. Jiang X, Jiang Y, Long X, et al. conducted experimental and numerical simulation studies on the depressurization production of various hydrate reservoirs [22–24]. Among them, Class I hydrate reservoir has become the most complex gas-liquid distributed deposit due to the existence of underlying gas layers. So, it is necessary to study the corresponding depressurization development method and scheme. At the same time, due to the complex environment and high requirements for drilling technology of marine gas hydrate, a rock-solid theoretical foundation is required in the scheme design stage. Therefore, the numerical simulation method is undoubtedly a highly economical and effective approach to simulate the dynamic evolution of hydrate reservoirs during the depressurization process and to study the optimal depressurization strategy. It provides valuable insights for the practical development and utilization of gas hydrates.
Yang et al. [25] believe that the dissociation process of hydrates deposits is controlled by both mass and heat transfer, and it is more reasonable to use a depressurization method in the early stage. Lee et al. [26] analyzed the dissociation characteristics and rates of hydrates under depressurization conditions through laboratory experiments and compared the gas production of hydrates and the relationship between the propagation of the dissociation front and time under different depressurization conditions. Wang et al. [27] believe that rapid depressurization can result in the rapid dissociation of hydrates, leading to fast gas production. However, under rapid depressurization and low production pressure, issues such as secondary hydrate formation may arise. Zhao et al. [28] believe that the gas production process can be divided into three main stages: dissociation of free gas, hydrate dissociation supported by thermal conduction in the reservoir, and hydrate dissociation driven by environmental heat exchange, with the latter two stages both dependent on the degree of depressurization. Li et al. [29] conducted a physical experiment to divide the hydrate depressurization production into the free gas stage (stage 1) and the hydrate dissociation stage (stage 2). Chong et al. [30] conducted a comparative study through experimental methods on the characteristics of gas production under various depressurization levels. Zhao et al. [31] conducted laboratory experiments to study the differences of gas production behavior between fine-grained and coarse-grained hydrate sediments. Konno et al. [32] conducted a numerical simulation study on the dissociation and reformation behavior of hydrate reservoir during depressurization and well shut-in. High gas production could only be maintained for a few years after the initial depressurization. Sun et al. [33] employed magnetic resonance imaging (MRI) technology to investigate the dissociation behavior of hydrates. They clarified the comprehensive influence mechanism of different depressurization methods and gas-water flow on hydrate dissociation.
For low-permeability hydrate reservoirs, pressure reduction-induced hydrate dissociation is an effective development method. Meanwhile, the underlying free gas layer makes it easier to achieve effective pressure reduction and efficient development of Class I hydrate reservoirs. Xu et al. [34] clarified the impact of free gas layers in Class I hydrates on the stimulation effect of hydrate reservoirs through fracturing simulations. Merey et al. [35] believed that during the depressurization of hydrate reservoirs, the contribution of the free gas layer to cumulative gas production is significant. Alp et al. [36] clarified the considerable contribution of the free gas layer in depressurization production through the study of natural gas production in two classes of Class I deposits: Class 1 G and Class 1 W [37]. Ge et al. [38] believed that the presence of a free gas layer in Class I hydrate reservoirs could promote the diffusion of the pressure drop interface, thereby further accelerating the dissociation of hydrates.
Based on Class I hydrate reservoirs with the highest commercial development potential, this study first considers the transition layer (coexistence of gas-water-hydrate three phases) under the critical temperature and pressure conditions of the hydrate stability zone. Utilizing the Gauss stochastic simulation method, a numerical simulation model considering the hydrate-gas transition layer is established. The dynamic patterns of hydrate development and the evolution of physical fields are then revealed. This clarifies the main hydrate dissociation area as well as the migration and accumulation behaviors of gas and water. Finally, the study optimizes the perforation location and depressurization method, determining the best perforation location and depressurization approach for Class I hydrate reservoirs with a transition layer.
The following reactions occur during the depressurization process of hydrate reservoirs, as shown in Eq. (1) [3].
2.1 Numerical Simulation Model
Compared with traditional fossil energy, hydrate exploitation has the characteristics of phase transition. Therefore, it is necessary to consider the immobile phase (solid phase gas hydrate) besides the mobile phase in the numerical simulation. CMG-stars is relatively mature in evaluating the process of multiphase flow, heat transfer and phase change in porous media. Different hydrate simulation software has different characteristics [39]. And the rationality and reliability of CMG stars module has been verified [40,41].
Based on the CMG-stars module, the dissociation and formation of hydrate are simulated by Kim-Bishinoi dissociation kinetic model and Vysniauskas-Bishinoi formation kinetic model (as shown in Formulas (2) and (3)) [42,43], and the judgment of hydrate formation/dissociation is obtained by Moridis model [44].
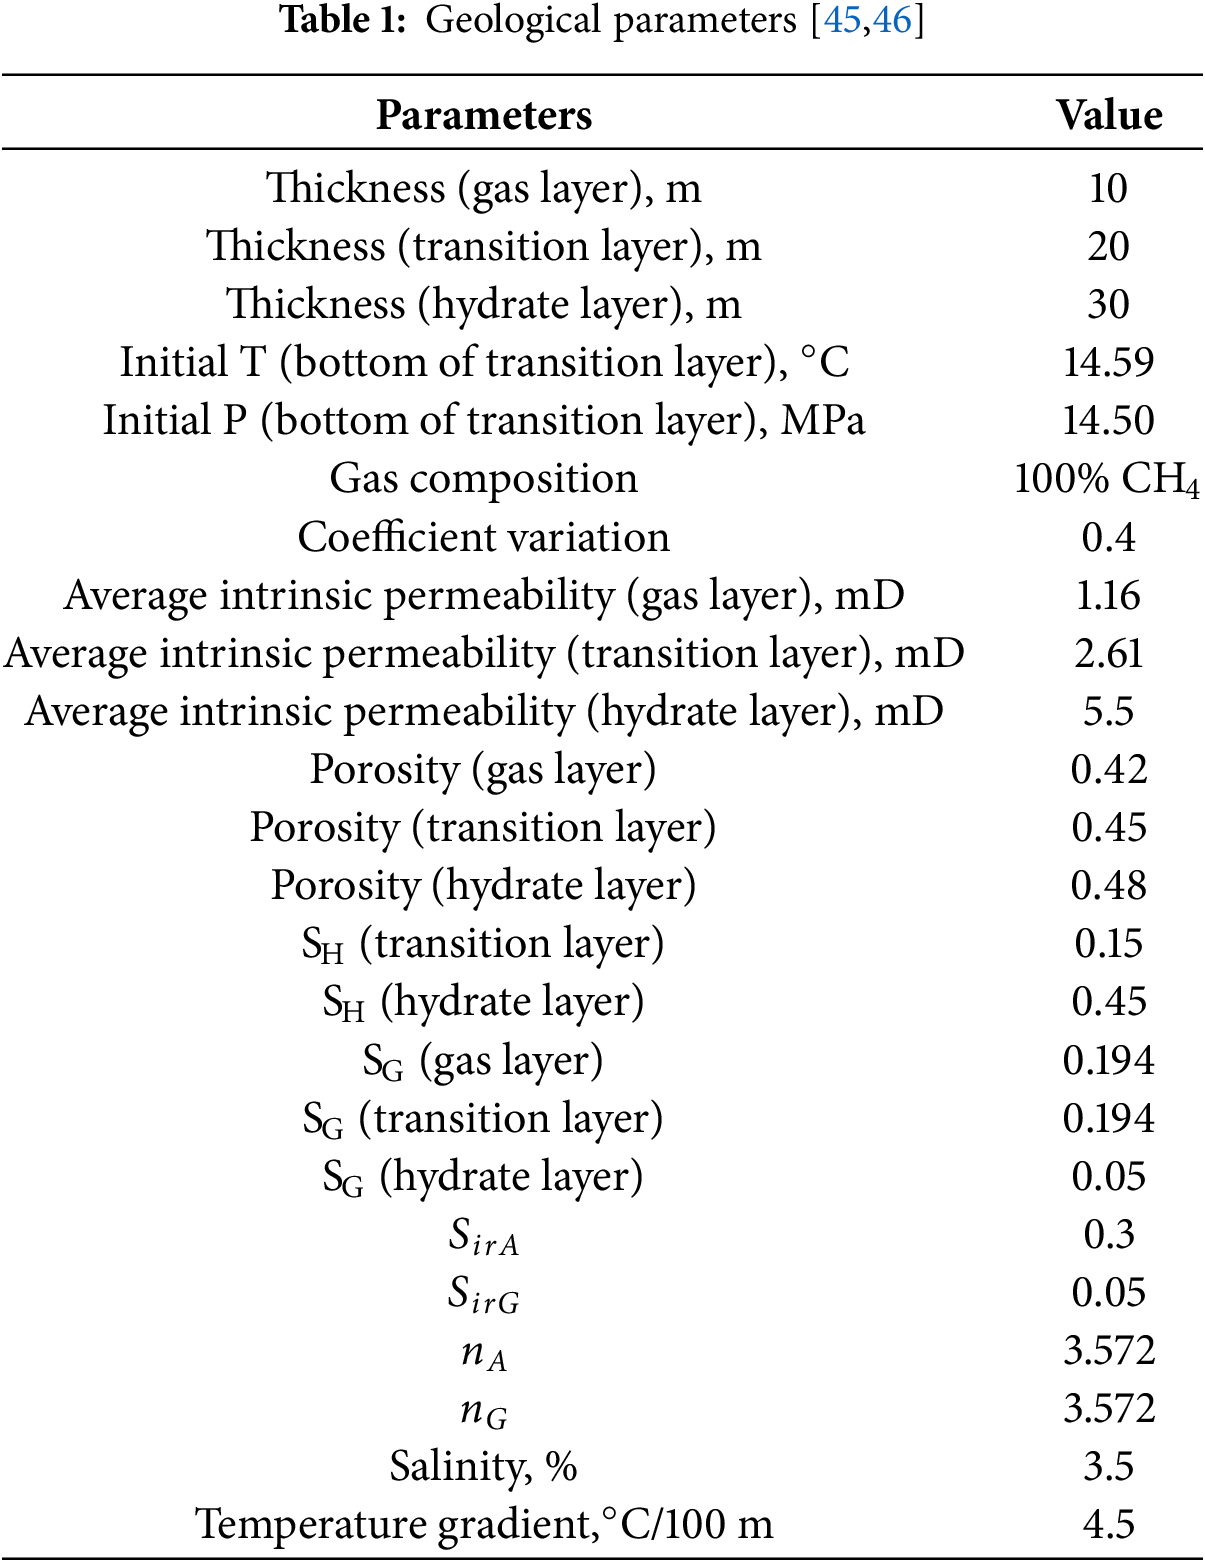
In the model, the production pressure is 7 MPa. Other geological parameters used are shown in Table 1.
In the process of hydrate dissociation, the equilibrium model is shown in Eq. (4) [42].
To simulate the production dynamics of the actual hydrate deposits, the stochastic modeling method is employed to account for heterogeneous permeability. Based on the average permeability, the heterogeneity model is constructed using the Gaussian stochastic simulation method for permeability distribution. To reflect the moderate heterogeneity of the Shenhu area, a permeability variation coefficient of 0.4 was selected [47–49]. The grid permeability was then smoothed to conform to a Gaussian distribution, providing a more reasonable representation of the geological characteristics. Then, a heterogeneity permeability distribution model is generated. To make the established heterogeneity model closer to the actual geological characteristics and knowledge, the generated heterogeneity model is smoothed to create the final heterogeneity permeability field.
Based on the established geological and permeability model, the numerical simulation model is divided into 19 × 19 grids on the plane, in which the grid size is 20 m × 20 m. The grid is refined near the wellbore. The specific mesh grid and heterogeneous field are shown in Fig. 1, and the hydrate deposits structure is shown in Fig. 2.

Figure 1: Heterogeneous permeability
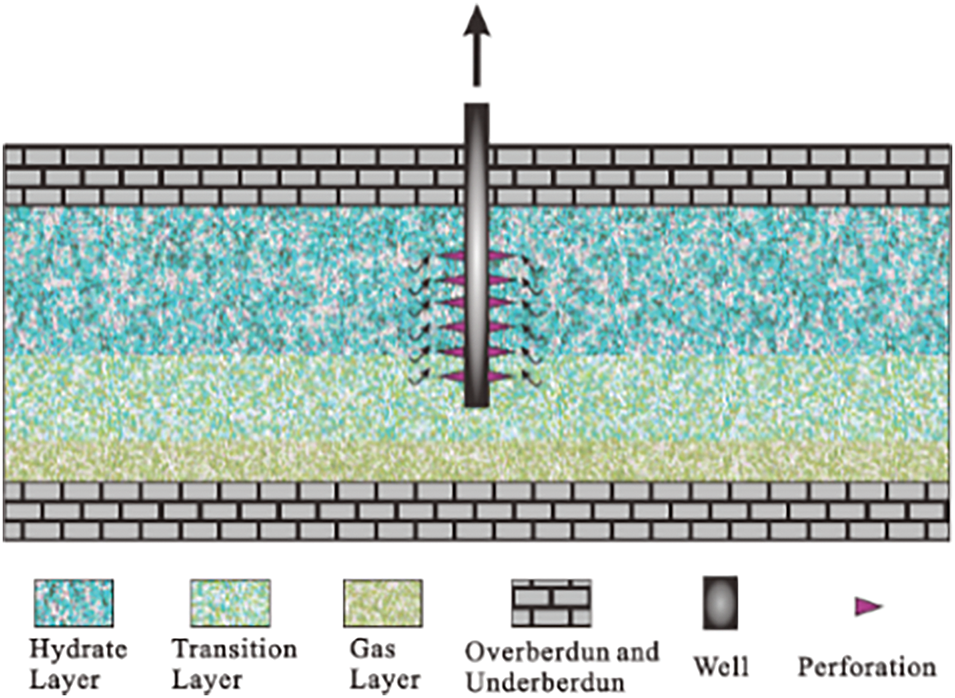
Figure 2: Hydrate deposits in the simulation
Given that hydrate exists as a solid within porous media, variations in its saturation directly impact the effective absolute permeability. Consequently, the movement patterns of gas and water through the porous media are altered. The model employed in this phenomenon to represent absolute permeability is the Carmen-Kozeny model [50] as follows:
The equations utilized in this model for relative permeability [51] and capillary force [52] are as follows:
This study is based on the CMG stars simulator for simulating the depressurization development of hydrates. Therefore, the reliability of the CMG stars hydrate simulation is verified. The paper conducts mutual verification with simulation using MH21 HYDRES under the same parameter conditions by Konno et al. [53] as shown in Fig. 3. The fitting results fully demonstrate the reliability of the model used in hydrate depressurization simulation. Because the primary fluid in the Shenhu area is seawater with a salinity of 3.5%, it has a significant impact on the phase equilibrium temperature and pressure conditions. Therefore, based on the salt content mass fraction, the corresponding temperature offset value is 1.693°C. So that the corresponding modified phase equilibrium is determined, and it is ensured that the critical equilibrium condition is precisely at the bottom boundary of the transition layer, providing the initial equilibrium of the model. Based on the actual trial production data in the Shenhu Sea area (2017), the natural gas hydrate trial production has been continuously stable for 60 days. And the corresponding cumulative gas is 3.09 × 10⁵ m3, the average daily production is 5151 m3, which is entirely consistent with this study.

Figure 3: Model validation [53]
Fig. 4a,b illustrates a continuous upward trend in the cumulative production of both gas and water during the production period, respectively. The rate of gas and water production decrease rapidly at the beginning, which was due to the pressure drop at the beginning of production was considerable. Then, the gas and water production rate gradually increase in the subsequent production process, which is due to the improvement of reservoir permeability and more effortless gas-water flow due to hydrate decomposition. After 250 days, the gas production rate remained stable at about 6000 m3/d, while the water production rate rose gradually. This is due to the limited reserves of methane in the reservoir. During the early stages, a surge in methane production occurs, but this is followed by a gradual decline in the flow of methane within the reservoir, ultimately constraining the potential for a continued increase in the rate of gas production. Accordingly, the water in the reservoir is not produced rapidly, so the water production is still restricted by the permeability of the reservoir.

Figure 4: Production performance. (a) gas dynamic; (b) water dynamic
The cumulative gas and water production and average reservoir pressure after 730 days of depressurization are 434.04 × 10⁴ m3, 1384.86 m3, 12.47 MPa, respectively. It can be seen that the reservoir pressure is limited by permeability, the reduction rate of the pressure is slow, and the accumulated gas/water production is limited.
The dissociation of hydrate requires that the actual P-T conditions fall outside the range of those required for maintaining phase equilibrium. That is, the original P-T conditions need to be destroyed. The decomposition of hydrate is a process that absorbs heat. And hydrate decomposition in reservoirs is often accompanied by a drop in the ambient temperature. Therefore, the physical fields at the initial time, 60 days, and 730 days of hydrate reservoir production are respectively made, as shown in Figs. 5a–c and 6a–c.

Figure 5: Pressure field. (a) 0 d; (b) 60 d; (c) 730 d
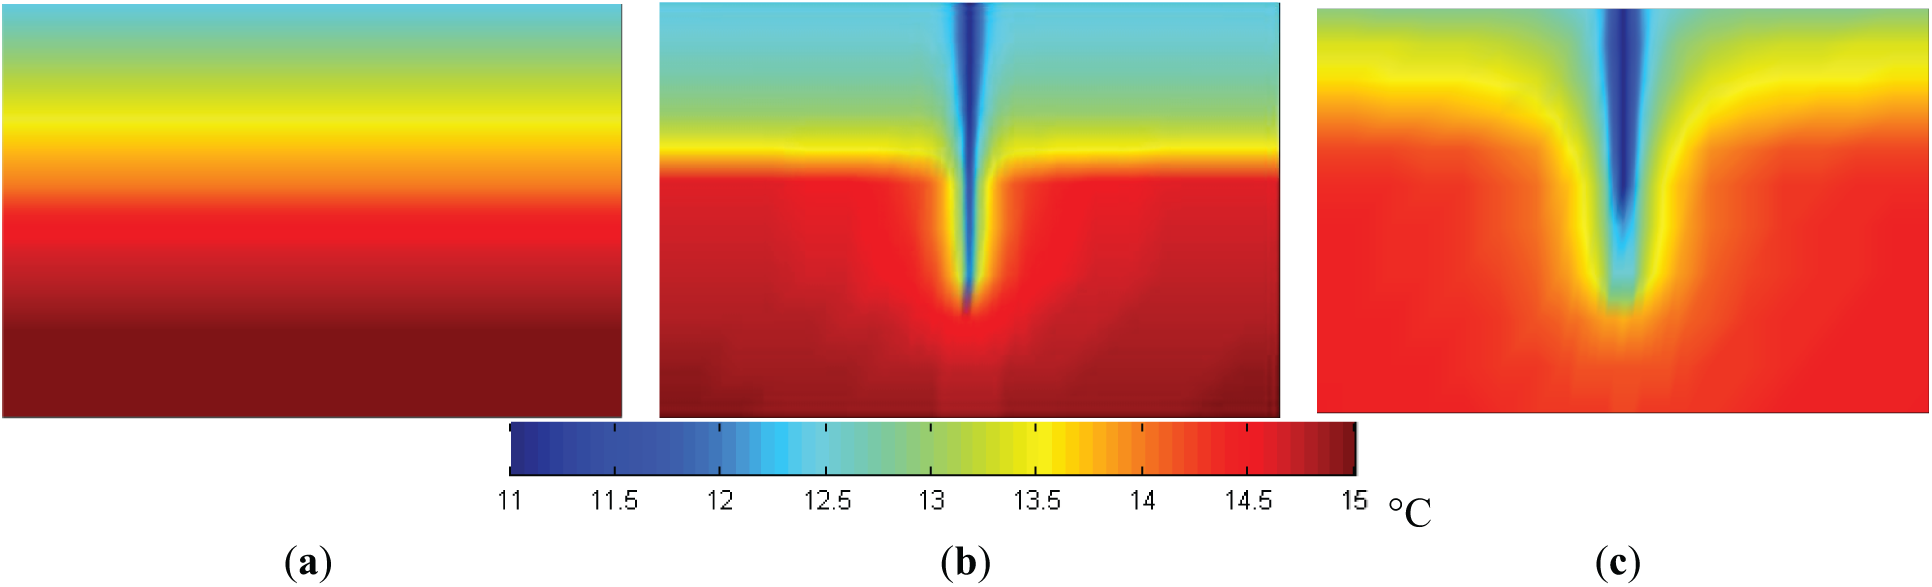
Figure 6: Temperature field. (a) 0 d; (b) 60 d; (c) 730 d
Figs. 5b and 6b show that during the production, the pressure and temperature decrease in the first 60 days. Due to the significant expansion of the methane, the pressure within the transition and the gas layer declines slower, in contrast to the faster rate of pressure drop experienced by the hydrate layer. The pressure distribution is “umbrella” with significant pressure drop in the upper part and negligible pressure drop in the lower part. The migration of natural gas upwards is a compensatory mechanism for the temperature decrease resulting from hydrate dissociation. As the distance from the gas reservoir increases, the temperature drop becomes more pronounced. During the depressurization development phase, which spans from 60 days to 2 years, as shown in Figs. 5c and 6c, there is a notable recovery in the temperature field and pressure field within the hydrate layer, particularly at its base. The bottom hole temperature also has a certain degree of recovery. This is because the reservoir pressure is getting lower and lower, and more and more hydrates are decomposed in the reservoir. However, because of the restricted permeability of the hydrate layer, there are challenges in efficiently extracting the decomposed gas and water. However, gas and water retention in the hydrate layer leads to a pressure rise. The pressure rise simultaneously leads to the regeneration of hydrate in the hydrate layer. Thus, the reservoir temperature also rises.
As the permeability is heterogeneous random distribution, the absolute permeability improvement coefficient (APIC) is defined. That is, the ratio of the permeability at the current time of each grid to the initial permeability, to measure the rate and trend of reservoir permeability change, as shown in Fig. 7. And the hydrate distribution and evolution is shown in Fig. 8.

Figure 7: Absolute permeability improvement coefficient field (APIC). (a) 0 d; (b) 60 d; (c) 730 d
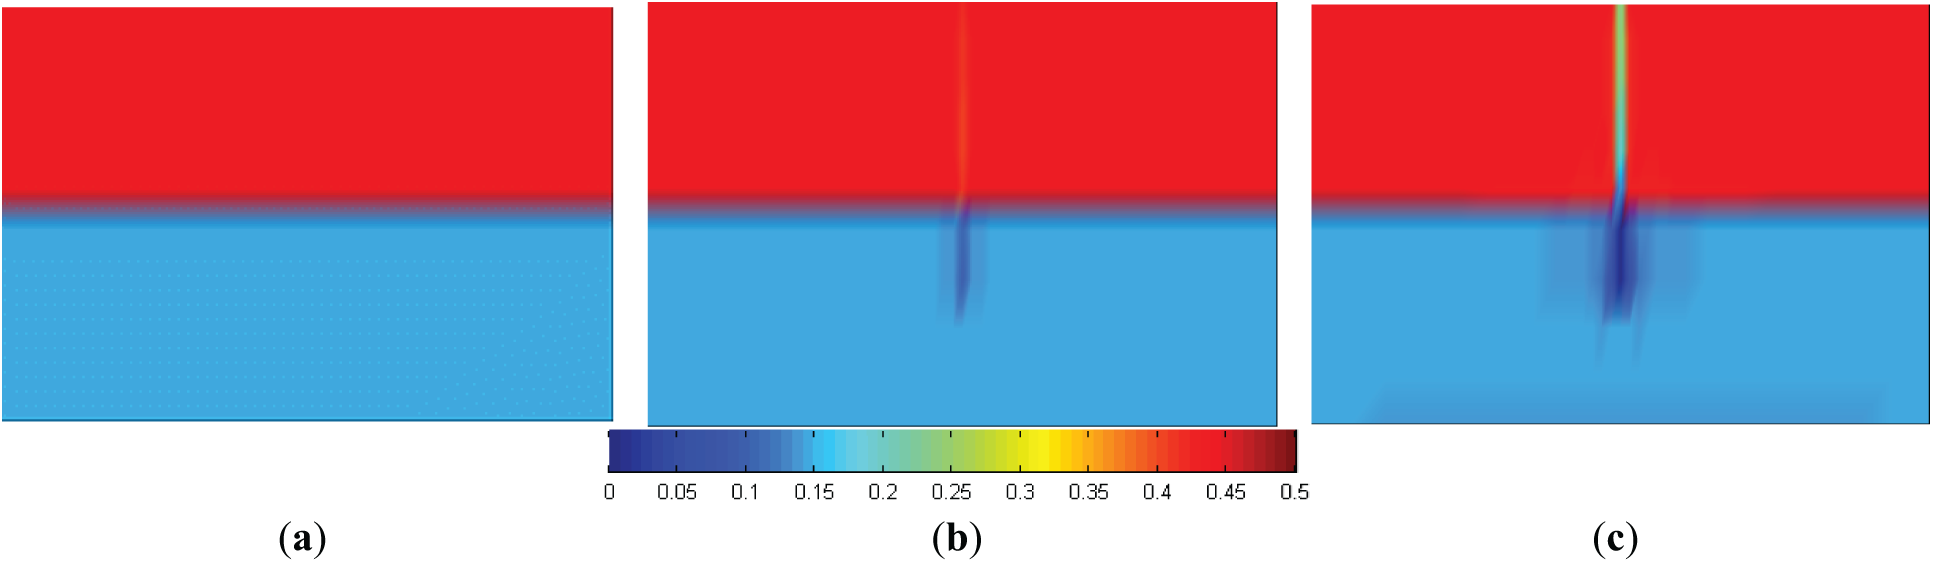
Figure 8: Hydrate saturation field. (a) 0 d; (b) 60 d; (c) 730 d
Figs. 7a–c and 8a–c demonstrate that the primary regions of hydrate dissociation are concentrated within a limited area at the base and outer edges of the transition layer. With the development of depressurization, the hydrate saturation surrounding the well gradually decreases, and the permeability improvement coefficient around the well gradually increases. Moreover, the migration of natural gas towards the well’s base partially replenishes the energy required for hydrate dissociation, resulting in a notably wider extent of hydrate dissociation in the transition layer compared to the hydrate layer. During the hydrate dissociation, the absolute permeability increases, with the permeability near the well in the transition layer showing the most significant rise.
The water saturation distribution in the reservoir at 60 days and 2 years of depressurization production was counted, respectively (
Fig. 9a,b shows the
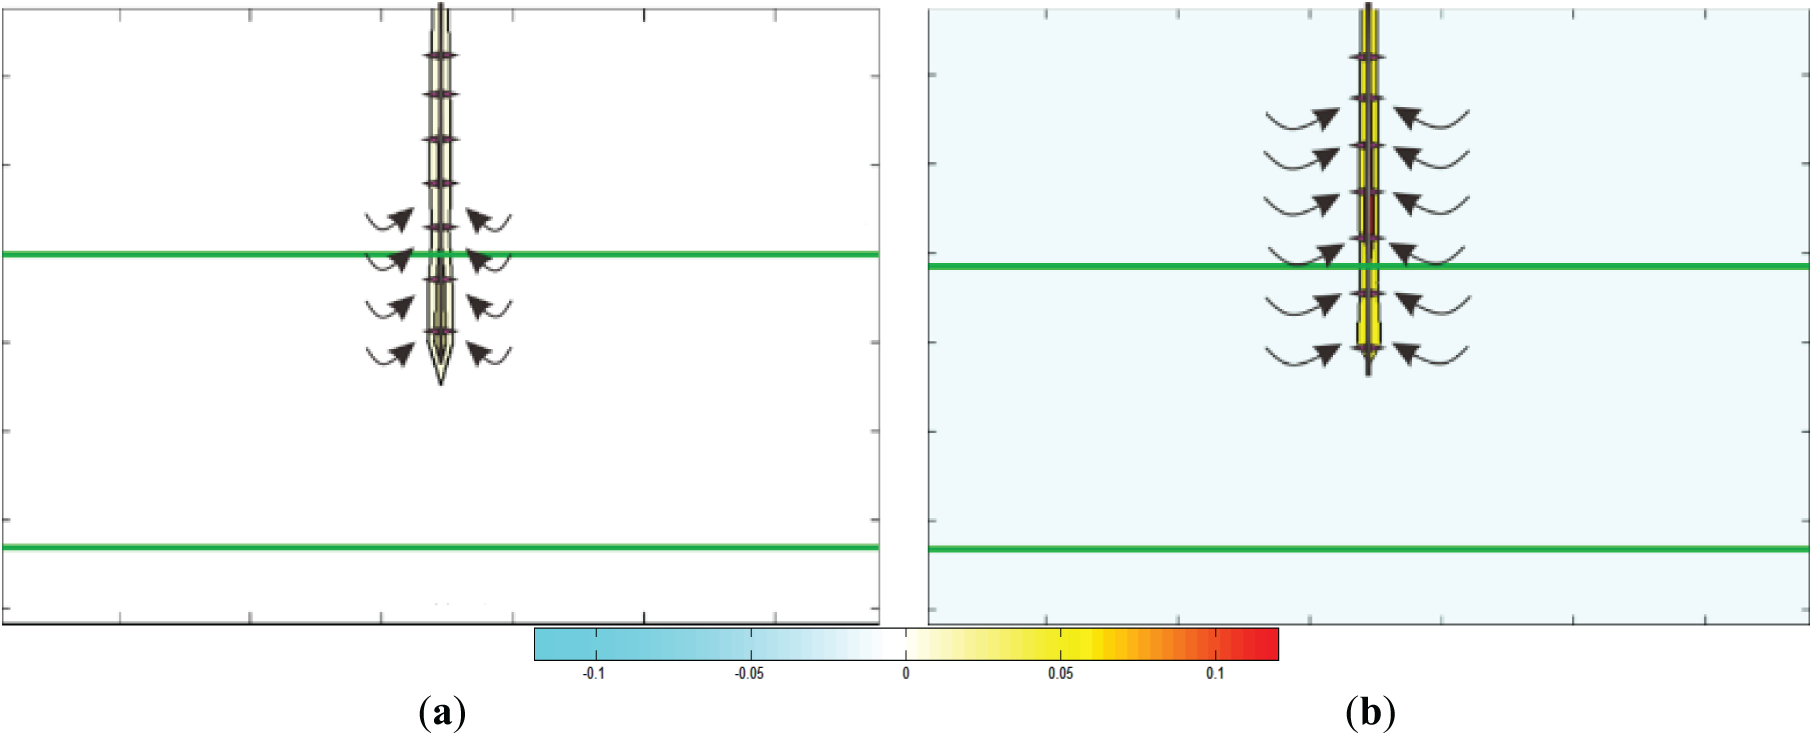
Figure 9: Water migration trend. (a) 60 d; (b) 730 d
Fig. 9a,b shows that the migration trend of water during depressurization is as follows: the free water in the reservoir migrates to the well, and the water generated in the hydrate decomposition area migrates to the well. Due to the low permeability and capillary force, the fluidity of water is very low. After 60 days of development, only a tiny amount of water increased in dissociation area around the well, which was due to the failure to produce the water dissociated by hydrate decomposition in time. After two years of development, there is more water accumulation around the well, while there is only a tiny water reduction in other reservoir areas. Vertically, water has no noticeable migration trend.
The molar amount of methane per unit volume in the reservoir (
Fig. 10a,b shows the

Figure 10: Methane migration trend. (a) 60 d; (b) 730 d
In general, the methane in the large area around the well in the transition layer is escaped, so the methane produced is mainly from the methane in the transition layer. The methane accumulation near the transition layer is relatively apparent, which indicates that part of the methane in the reservoir migrates to the production well, and the other part of the methane migrates to the hydrate layer under the influence of gravity. Fig. 10a shows there is no apparent phenomenon of gas floating up at 60 days. Only part of the methane in the transition layer is produced through the bottom hole perforation. Fig. 10b shows that after 2 years of depressurization, gas has floated upward significantly and accumulated above the transition layer. The reason is that as the pressure decreases, the hydrates in the hydrate layer undergo a phase transition and gradually decompose, improving the reservoir permeability. Thus, the free gas in the transition layer can overcome capillary forces and float to the hydrate layer. However, limited by permeability, the hydrate deposits near the transition layer can receive more energy replenishment, resulting in a higher degree of permeability improvement, and free gas accumulates in this area. In addition, gas accumulation in the area around the well is more evident than that in the area far from the well. That is to say, even in the gas accumulation area, there is still a trend of migration from the high pressure area far from the well to low pressure area near the well. There is noticeable methane escape in the underlying transition layer and gas layer, and the gas escape in the bottom hole area is more evident than in other areas. It can be considered that the methane flows to the wellbore and is produced, while the methane in the transition layer and the gas layer is continuously rising.
Because the reservoir is divided into three layers: hydrate, transition and gas layer. The three parts have corresponding permeability and hydrate saturation. Different perforation layers have significant influence on development effect. The development performance of three schemes is compared, which are perforation to hydrate layer (Hydrate Layer), perforation to hydrate layer and transition layer (Transition Layer), perforation to hydrate layer, transition layer and gas layer (Gas Layer). Fig. 11 presents the varying trends of gas and water production during depressurization, as they correlate with distinct perforation methods.

Figure 11: Production performance of different perforation model. (a) gas dynamic; (b) water dynamic
Fig. 11a shows that there is a significant gap in gas rate among the three perforation schemes. Among the three perforation schemes, the gas rate of the perforation to gas layer is the highest of the three perforation schemes. Additionally, the lowest gas production rate is observed in the perforation directed towards the hydrate layer. Due to the limited energy of the gas reservoir, the gas rate of the perforation to gas layer scheme began to decrease after a period of stability. During the initial stage, due to the improvement of reservoir permeability, the gas rate gradually increased. Compared with the other two schemes, the gas rate of the perforation to the hydrate layer is minimal, resulting in a significantly suboptimal development outcome. Fig. 11b shows that the water rate change in the three schemes is relatively stable. And with the improvement of permeability, the water rate increases slowly. In brief, perforation to hydrate layer, transition layer and gas layer is the best perforation scheme.
3.3 Depressurization Selection
For the same target production pressure, there are many ways to reduce the pressure. Different ways of reducing pressure lead to different production performance. The development effects and dynamics of one step down, two step down and three step down pressure reduction were compared. The dynamic curves of gas and water dynamic corresponding to diverse depressurization methods are shown in Fig. 12.

Figure 12: Production performance of different depressurization model. (a) gas dynamic; (b) water dynamic
Fig. 12a,b respectively shows that the gas and water rate of each scheme is directly proportional to the depressurization amplitude of the corresponding time. At 730 years, the cumulative gas of one-step-down, two-step-down, and three-step-down depressurization was 434.04 × 10⁴ m3, 295.75 × 10⁴ m3, 252.90 × 10⁴ m3, respectively. One step down depressurization has the highest average gas production. The increase in the magnitude of pressure reduction leads to an enhancement in the gas production rate within the multiple-step depressurization scheme. The gas and water production rates tend to be the same when different production schemes reach the same pressure reduction amplitude through different pressure reduction processes. Therefore, the improvement effect on gas rate depends on the effective pressure drop. The one-step-down depressurization method has the best effect because it has the highest effective pressure drop.
(1) In the early production stage, the gas and water rates increase with reservoir permeability. After 250 days, the gas rate stabilized because of the limitation of natural gas reserves, while the water rate still increased with the permeability of the reservoir.
(2) There are two main migration trends of methane in the reservoir: migration to production wells and migration to the hydrate layer under the influence of gravity. There is apparent methane escape in the three-phase transition layer, and methane accumulation occurs above the transition layer. Therefore, during the depressurization extraction of hydrate deposits, it is essential to focus on detecting the location of methane accumulation to prevent methane leakage.
(3) Different perforation methods greatly influence production efficiency. Because of the fast gas flow, it is easy to reduce the reservoir’s pressure effectively. Therefore, the perforation scheme of the hydrate layer, transition layer, and gas layer has the best production effect.
(4) Different depressurization methods greatly influence production performance. The gas rate is directly proportional to the effective depressurization range; therefore, within a reasonable range of voltage reduction, one-step voltage reduction is the most efficient.
Acknowledgement: The authors appreciated the support from SINOPEC Petroleum Exploration and Production Research Institute and China University of Petroleum (East China).
Funding Statement: This study was financially supported by the Sinopec Technology Research and Development Project (No. 30000000-22-ZC0607-0235, No. 33550000-22-ZC0607-0009), the National Natural Science Foundation of China (No. 52334002).
Author Contributions: The authors confirm contribution as follows: Conceptualization, Yajie Bai, Jian Hou, Yongge Liu; methodology, Yajie Bai; investigation, Jian Hou, Yongge Liu; writing—original draft preparation, Yajie Bai; writing—review and editing, Yajie Bai, Jian Hou, Yongge Liu. All authors reviewed the results and approved the final version of the manuscript.
Availability of Data and Materials: The data presented in this study are available from the corresponding author on reasonable request.
Ethics Approval: Not applicable.
Conflicts of Interest: The authors declare no conflicts of interest to report regarding the present study.
Nomenclature
| Symbols | |
| Initial reaction rate constants of dissociation, mol/(s·Pa·m2) | |
| Initial reaction rate constants of formation, mol/(s·Pa·m2) | |
| Nm | Hydration number |
| Molar rate of dissociation, mol/s | |
| Molar rate of formation, mol/s | |
| Phase equilibrium fugacity at temperature T, Pa | |
| Gas phase fugacity at temperature T, Pa | |
| Activating energy, J/mol | |
| Current water saturation | |
| Initial water saturation | |
| Hydrate particles specific surface area, m2/m3 | |
| Hydrate formation area occupied by water and gas in the porous medium, m2/m3 | |
| Molar density of methane, mol/m3 | |
| Initial molar density of methane, mol/m3 | |
| V | Volume of grid, m3 |
| Permeability change factor, 2 | |
| R | Constant, 8.314 J/mol/K |
| Pcap | Capillary pressure |
References
1. Moridis G, Collett T. Strategies for gas production from hydrate accumulations under various geologic conditions. In: Proceedings Tough Symposium 2003; 2003 May 12–14; Berkeley, CA, USA. [Google Scholar]
2. Wei N, Pei J, Li H, Zhou S, Zhao J, Kvamme B, et al. Classification of natural gas hydrate resources: review, application and prospect. Gas Sci Eng. 2024;124:205269. doi:10.1016/j.jgsce.2024.205269. [Google Scholar] [CrossRef]
3. Lu N, Hou J, Liu Y, Barrufet MA, Ji Y, Xia Z, et al. Stage analysis and production evaluation for class III gas hydrate deposit by depressurization. Energy. 2018;165(6964):501–11. doi:10.1016/j.energy.2018.09.184. [Google Scholar] [CrossRef]
4. Yu YS, Zhang X, Liu JW, Lee Y, Li XS. Natural gas hydrate resources and hydrate technologies: a review and analysis of the associated energy and global warming challenges. Energy Environ Sci. 2021;14(11):5611–68. doi:10.1039/D1EE02093E. [Google Scholar] [CrossRef]
5. Liu X, Zhang W, Qu Z, Guo T, Sun Y, Rabiei M, et al. Feasibility evaluation of hydraulic fracturing in hydrate-bearing sediments based on analytic hierarchy process-entropy method (AHP-EM). J Nat Gas Sci Eng. 2020;81(1):103434. doi:10.1016/j.jngse.2020.103434. [Google Scholar] [CrossRef]
6. Gajanayake SM, Gamage RP, Li XS, Huppert H. Natural gas hydrates-Insights into a paradigm-shifting energy resource. Energy Rev. 2023;2(1):100013. doi:10.1016/j.enrev.2022.100013. [Google Scholar] [CrossRef]
7. Qin Y, Shang L, Lv Z, He J, Yang X, Zhang Z. Methane hydrate formation in porous media: overview and perspectives. J Energy Chem. 2022;74:454–80. doi:10.1016/j.jechem.2022.07.019. [Google Scholar] [CrossRef]
8. Bai Y, Hou J, Liu Y, Lu N, Zhao E, Ji Y. Interbed patterns division and its effect on production performance for class I hydrate deposit with mudstone interbed. Energy. 2020;211(2):118666. doi:10.1016/j.energy.2020.118666. [Google Scholar] [CrossRef]
9. Ohgaki K, Takano K, Sangawa H, Matsubara T, Nakano S. Methane exploitation by carbon dioxide from gas hydrates. Phase equilibria for CO2-CH4 mixed hydrate system. J Chem Eng Japan. 1996;29(3):478–83. doi:10.1252/jcej.29.478. [Google Scholar] [CrossRef]
10. Wilson I, Saini S, Sreenivasan H, Sahu C, Krishna S, Gupta P. Review and perspectives of energy-efficient methane production from natural gas hydrate reservoirs using carbon dioxide exchange technology. Energy Fuels. 2023;37(14):9841–72. doi:10.1021/acs.energyfuels.3c00715. [Google Scholar] [CrossRef]
11. Zhang G, Li J, Yang H, Huang H, Liu G, Wang B, et al. Parameter optimization for natural gas hydrate solid fluidization. Phys Fluids. 2024;36(12):123357. doi:10.1063/5.0243458. [Google Scholar] [CrossRef]
12. Wu M, Wang G, Zhang L, Fu Q, Zhong L, Wang D. Numerical analysis of phase transition of mining cavity in hydrate solid fluidization exploitation coupled multi-field. Petrol Sci Technol. 2025;2025:1–26. doi:10.1080/10916466.2025.2466855. [Google Scholar] [CrossRef]
13. Sung W, Kang H. Experimental investigation of production behaviors of methane hydrate saturated in porous rock. Energy Sour. 2003;25(8):845–56. doi:10.1080/00908310303383. [Google Scholar] [CrossRef]
14. Liang H, Song Y, Chen Y. Numerical simulation for laboratory-scale methane hydrate dissociation by depressurization. Energy Convers Manag. 2010;51(10):1883–90. doi:10.1016/j.enconman.2010.02.018. [Google Scholar] [CrossRef]
15. Graver T, Holditch SA, Moridis G. Analysis of deposit performance of messoyakha gas hydrate field. In: Proceedings of the International Offshore and Polar Engineering Conference; 2008 Jul 6–11; Vancouver, BC, Canada. [Google Scholar]
16. Henninges J, Huenges E, Burkhardt H. In situ thermal conductivity of gas-hydrate-bearing sediments of the Mallik 5L-38 well. J Geophys Res. 2005;110(B11):2005JB003734. doi:10.1029/2005jb003734. [Google Scholar] [CrossRef]
17. Anderson B, Hancock S, Wilson S, Enger C, Collett T, Boswell R, et al. Formation pressure testing at the mount elbert gas hydrate stratigraphic test well, Alaska north slope: operational summary, history matching, and interpretations. Mar Petrol Geol. 2011;28(2):478–92. doi:10.1016/j.marpetgeo.2010.02.012. [Google Scholar] [CrossRef]
18. Chen L, Feng Y, Kogawa T, Okajima J, Komiya A, Maruyama S. Construction and simulation of reservoir scale layered model for production and utilization of methane hydrate: the case of Nankai Trough Japan. Energy. 2018;143(1):128–40. doi:10.1016/j.energy.2017.10.108. [Google Scholar] [CrossRef]
19. Bai Y, Clarke MA, Hou J, Liu Y, Lu N, Zhao E, et al. Study on improved efficiency of induced fracture in gas hydrate reservoir depressurization development. Energy. 2023;278(9):127853. doi:10.1016/j.energy.2023.127853. [Google Scholar] [CrossRef]
20. Burshears M, O’Brien TJ, Malone RD. A multi-phase, multi-dimensional, variable composition simulation of gas production from a conventional gas reservoir in contact with hydrates. In: SPE Unconventional Gas Technology Symposium; 1986 May 18–21; Louisville, Kentucky. doi:10.2118/15246-ms. [Google Scholar] [CrossRef]
21. Boswell R, Schoderbek D, Collett TS, Ohtsuki S, White M, Anderson BJ. The Iġnik sikumi field experiment, Alaska north slope: design, operations, and implications for CO2-CH4 exchange in gas hydrate reservoirs. Energy Fuels. 2017;31(1):140–53. doi:10.1021/acs.energyfuels.6b01909. [Google Scholar] [CrossRef]
22. Jiang X, Li S, Zhang L. Sensitivity analysis of gas production from Class I hydrate reservoir by depressurization. Energy. 2012;39(1):281–5. doi:10.1016/j.energy.2012.01.016. [Google Scholar] [CrossRef]
23. Jiang Y, Ma X, Luan H, Wu X, Wang C, Shan Q, et al. Numerical simulation on natural gas hydrate depressurization production considering sediment compression effects. Energy. 2024;301(2):131745. doi:10.1016/j.energy.2024.131745. [Google Scholar] [CrossRef]
24. Long X, Tjok K, Adhikari S. Numerical investigation on gas hydrate production by depressurization in hydrate-bearing reservoir. In: ASME, 2016 35th International Conference on Ocean, Offshore and Arctic Engineering; 2016 Jun 19–24; Busan, Republic of Korea. doi:10.1115/omae2016-55067. [Google Scholar] [CrossRef]
25. Yang X, Sun CY, Su KH, Yuan Q, Li QP, Chen GJ. A three-dimensional study on the formation and dissociation of methane hydrate in porous sediment by depressurization. Energy Convers Manag. 2012;56:1–7. doi:10.1016/j.enconman.2011.11.006. [Google Scholar] [CrossRef]
26. Lee J, Park S, Sung W. An experimental study on the productivity of dissociated gas from gas hydrate by depressurization scheme. Energy Convers Manag. 2010;51(12):2510–5. doi:10.1016/j.enconman.2010.05.015. [Google Scholar] [CrossRef]
27. Wang B, Fan Z, Wang P, Liu Y, Zhao J, Song Y. Analysis of depressurization mode on gas recovery from methane hydrate deposits and the concomitant ice generation. Appl Energy. 2018;227:624–33. doi:10.1016/j.apenergy.2017.09.109. [Google Scholar] [CrossRef]
28. Zhao J, Zhu Z, Song Y, Liu W, Zhang Y, Wang D. Analyzing the process of gas production for natural gas hydrate using depressurization. Appl Energy. 2015;142:125–34. doi:10.1016/j.apenergy.2014.12.071. [Google Scholar] [CrossRef]
29. Li B, Li XS, Li G, Feng JC, Wang Y. Depressurization induced gas production from hydrate deposits with low gas saturation in a pilot-scale hydrate simulator. Appl Energy. 2014;129:274–86. doi:10.1016/j.apenergy.2014.05.018. [Google Scholar] [CrossRef]
30. Chong ZR, Yin Z, Tan JHC, Linga P. Experimental investigations on energy recovery from water-saturated hydrate bearing sediments via depressurization approach. Appl Energy. 2017;204(Part 2):1513–25. doi:10.1016/j.apenergy.2017.04.031. [Google Scholar] [CrossRef]
31. Zhao J, Liu Y, Guo X, Wei R, Yu T, Xu L, et al. Gas production behavior from hydrate-bearing fine natural sediments through optimized step-wise depressurization. Appl Energy. 2020;260(2):114275. doi:10.1016/j.apenergy.2019.114275. [Google Scholar] [CrossRef]
32. Konno Y, Masuda Y, Akamine K, Naiki M, Nagao J. Sustainable gas production from methane hydrate reservoirs by the cyclic depressurization method. Energy Convers Manag. 2016;108(2):439–45. doi:10.1016/j.enconman.2015.11.030. [Google Scholar] [CrossRef]
33. Sun H, Chen B, Zhao G, Zhao Y, Yang M. Utilization of water-gas flow on natural gas hydrate recovery with different depressurization modes. Fuel. 2021;288(2):119583. doi:10.1016/j.fuel.2020.119583. [Google Scholar] [CrossRef]
34. Xu J, Qin H, Li H, Lu C, Li S, Wu D. Enhanced gas production efficiency of class 1, 2, 3 hydrate reservoirs using hydraulic fracturing technique. Energy. 2023;263(5943):126003. doi:10.1016/j.energy.2022.126003. [Google Scholar] [CrossRef]
35. Merey Ş, Longinos SN. Numerical simulations of gas production from Class 1 hydrate and Class 3 hydrate in the Nile Delta of the Mediterranean Sea. J Nat Gas Sci Eng. 2018;52(2000):248–66. doi:10.1016/j.jngse.2018.01.001. [Google Scholar] [CrossRef]
36. Alp D, Parlaktuna M, Moridis GJ. Gas production by depressurization from hypothetical Class 1G and Class 1W hydrate reservoirs. Energy Convers Manag. 2007;48(6):1864–79. doi:10.1016/j.enconman.2007.01.009. [Google Scholar] [CrossRef]
37. Moridis GJ, Kowalsky MB, Pruess K. Depressurization-induced gas production from class 1 hydrate deposits. SPE Reserv Eval Eng. 2007;10(5):458–81. doi:10.2118/97266-pa. [Google Scholar] [CrossRef]
38. Ge K, Liu J, Wang J, Long Z, Zhang X, Wei H, et al. Numerical simulation of gas production behavior of class I, class II and class III hydrate reservoirs for different well locations. J Clean Prod. 2023;433(1–3):139844. doi:10.1016/j.jclepro.2023.139844. [Google Scholar] [CrossRef]
39. Myshakin EM, Gaddipati M, Rose K, Anderson BJ. Numerical simulations of depressurization-induced gas production from gas hydrate reservoirs at the Walker Ridge 313 site, northern Gulf of Mexico. Mar Petrol Geol. 2012;34(1):169–85. doi:10.1016/j.marpetgeo.2011.09.001. [Google Scholar] [CrossRef]
40. Gaddipati M. Code comparison of methane hydrate reservoir simulators using CMG STARS manohar [dissertation]. Morgantown, WV, USA: West Virginia University; 2008. [Google Scholar]
41. Uddin M, Coombe D, Law D, Gunter B. Numerical studies of gas hydrate formation and decomposition in a geological reservoir. J Energy Resour Technol. 2008;130(3):032501. doi:10.1115/1.2956978. [Google Scholar] [CrossRef]
42. Kim HC, Bishnoi PR, Heidemann RA, Rizvi SSH. Kinetics of methane hydrate decomposition. Chem Eng Sci. 1987;42(7):1645–53. doi:10.1016/0009-2509(87)80169-0. [Google Scholar] [CrossRef]
43. Vysniauskas A, Bishnoi PR. A kinetic study of methane hydrate formation. Chem Eng Sci. 1983;38(7):1061–72. doi:10.1016/0009-2509(83)80027-X. [Google Scholar] [CrossRef]
44. Liu Y, Liu J, Jia W, Bai Y, Hou J, Xu H, et al. Numerical simulation of the development of hydrate-bearing layers by depressurization of radial wells. Nat Gas Ind B. 2024;11(3):274–90. doi:10.1016/j.ngib.2024.05.003. [Google Scholar] [CrossRef]
45. Sun J, Zhang L, Ning F, Lei H, Liu T, Hu G, et al. Production potential and stability of hydrate-bearing sediments at the site GMGS3-W19 in the South China Sea: a preliminary feasibility study. Mar Petrol Geol. 2017;86(7):447–73. doi:10.1016/j.marpetgeo.2017.05.037. [Google Scholar] [CrossRef]
46. Zhao E, Hou J, Liu Y, Ji Y, Liu W, Lu N, et al. Enhanced gas production by forming artificial impermeable barriers from unconfined hydrate deposits in Shenhu area of South China Sea. Energy. 2020;213(1):118826. doi:10.1016/j.energy.2020.118826. [Google Scholar] [CrossRef]
47. Li Y, Xu C, Zhu J, Lu H, Liu Y, Gu Y, et al. Comprehensive characterizations of core sediments recovered from Shenhu W17 well in South China Sea and its impact on methane hydrate kinetics. Gas Sci Eng. 2024;131:205482. doi:10.1016/j.jgsce.2024.205482. [Google Scholar] [CrossRef]
48. Huang Y, Yu X, Fu C. Gas hydrate distribution influenced by sea floor slide and canyon erosion in the Shenhu slope, northern South China Sea margin. Processes. 2025;13(1):193. doi:10.3390/pr13010193. [Google Scholar] [CrossRef]
49. Li Y, Yan C, Song L, Wu P, Li Y. Experimental study on the effect of hydrate filling on the mechanical properties of marine sediments in the Shenhu area, South China Sea. Energy Fuels. 2024;38(6):5192–205. doi:10.1021/acs.energyfuels.4c00057. [Google Scholar] [CrossRef]
50. Carman P. Flow of gases through porous media. London, UK: Butterworths; 1956. [Google Scholar]
51. Bai Y, Hou J, Clarke MA, Zhao E, Zhang B, Liu Y. Numerical simulation on reservoir stimulation assisted depressurization development of hydrate bearing layers based on embedded discrete fractures. Geoenergy Sci Eng. 2024;241(3):213112. doi:10.1016/j.geoen.2024.213112. [Google Scholar] [CrossRef]
52. van Genuchten MT. A closed-form equation for predicting the hydraulic conductivity of unsaturated soils. Soil Science Soc Amer J. 1980;44(5):892–8. doi:10.2136/sssaj1980.03615995004400050002x. [Google Scholar] [CrossRef]
53. Konno Y, Masuda Y, Hariguchi Y, Kurihara M, Ouchi H. Key factors for depressurization-induced gas production from oceanic methane hydrates. Energy Fuels. 2010;24(3):1736–44. doi:10.1021/ef901115h. [Google Scholar] [CrossRef]
Cite This Article
 Copyright © 2025 The Author(s). Published by Tech Science Press.
This work is licensed under a Creative Commons Attribution 4.0 International License , which permits unrestricted use, distribution, and reproduction in any medium, provided the original work is properly cited.
 Downloads
 Citation Tools