
 Submit a Paper
 Propose a Special lssue
 Open Access
ARTICLE

Bioenergy and Green Hydrogen Production in The Gambia: Potential for Energy Mix Integration
1 Material and Energy Valorisation of Biogenious Residues, Waste and Resource Management, Faculty of Agricultural and Environmental Science, University of Rostock, Justus-von-Liebig-Weg 6, Rostock, 18059, Germany
2 Faculty of Science, University of Lome, Lome, BP1515, Togo
* Corresponding Author: Satyanarayana Narra. Email:
Energy Engineering 2025, 122(7), 2539-2569. https://doi.org/10.32604/ee.2025.061963
Received 06 December 2024; Accepted 16 May 2025; Issue published 27 June 2025
 View Full Text
 Download PDF
Abstract
This study evaluates the feasibility of incorporating alternative sustainable energy sources, specifically bioenergy and green hydrogen, into The Gambia’s energy mix to support the nation’s long-term energy development goals. The feedstocks analyzed include agricultural crop residues such as rice, cassava, groundnuts, maize, sorghum, oil palm fruit, seed cotton, and millet, as well as municipal solid waste (MSW). An assessment was conducted to calculate the theoretical potential generated from the organic components of both MSW and crop residues, utilizing data collected from 2017 to 2021 and projections extending to 2038. The results were employed to calculate potential yields of biomethane and electricity production, using Buswell’s equation as a framework for determining biogas generation from various organic materials. Additionally, the potential for hydrogen production via steam methane reforming was evaluated using stoichiometric principles. The technical potential for electricity and hydrogen generation was then established based on their respective conversion efficiencies. This study is the first to comprehensively assess the technical potential for both bioenergy and green hydrogen production from crop residues and MSW in The Gambia. By quantifying yields of electricity (64.5 MW) and hydrogen (6.2 million kmol), and proposing a site-specific pilot project strategy, it bridges the gap between theoretical potential and practical implementation, providing a scalable roadmap for energy diversification in low-income nations. To address data management and infrastructure gaps, a strategy is proposed that includes automated data collection, awareness programs, and waste-to-energy initiatives, aimed at enhancing energy resilience and sustainability in The Gambia.Keywords
1.1 Africa’s Energy Transition and Projects
Energy plays a crucial role in the development of any nation, influencing its economy, social activities, infrastructure, and lifestyle. In many African countries, electrification has yet to reach 100%, particularly in rural areas. Sub-Saharan Africa, home to 14% of the global population in developing countries, accounts for nearly 40% of the population without access to electricity [1]. Despite this, Africa is endowed with abundant renewable resources, and several countries, such as Nigeria, Egypt, Ghana, South Africa, and Kenya, have begun tapping into these resources. In 2021, Kenya proposed a 12 MW, grid-connected municipal Waste-to-Energy (WTE) plant in Kabira, a suburb of Nairobi. This project aims to convert three types of biomass municipal solid waste (MSW), crop residues, and livestock waste into biogas or fuel ethanol, while also generating electricity [2]. Similarly, Ghana has implemented a 400 kW hybrid WTE plant in Gyankobaa as a pilot project. This facility processes 50 t of MSW daily and aims to produce electricity, biogas, compost, green hydrogen, solar power (200 kW), and facilitate plastic recycling via pyrolysis. It also serves as a training center to build local capacity [3].
The exploration of integrating bioenergy and green hydrogen into the energy mix of various nations is gaining traction globally. This study focuses on The Gambia, emphasizing the unique political, environmental, socioeconomic, and climatic contexts that shape energy policy in the country. An implementation strategy is proposed, which is predicated on an assessment of the production potential of agricultural crop residues and MSW as viable sources for generating bioenergy and green hydrogen. This research further identifies critical gaps within the nation’s energy policies and infrastructure. To address these deficiencies, targeted recommendations are presented for consideration by government entities, aimed at enhancing the sustainability and resilience of The Gambia’s energy landscape.
The Gambia is a small country located in West Africa along the eastern seaboard of the Atlantic Ocean. According to [4], the country has a total area of 11,570 km2 and it stretches 450 km inland along the banks of The Gambia River. The country is bordered on three fronts by Senegal and has a landscape classified under the category of savannah with low hills and a tropical climate. It has an estimated population size of 2.5 million, with 176 people per square kilometer, making it one of the most densely populated countries in Africa. 57% of the population is concentrated in the urban areas of the country [5]. The Gambia’s economy relies heavily on tourism and agriculture. In 2021, the country’s gross domestic product (GDP) was estimated at USD 2.078 billion. The agricultural, forestry, and fisheries sectors employ 9.2% of the working population, excluding subsistence farmers. Agriculture represents approximately 24% of the GDP, 72% of poor households, and 91% of extremely poor rural households. Additionally, The Gambia serves as a key transit and trade route for Senegal and other regional countries [6].
1.3 The Gambia’s Emissions and Energy Status
In 2020, The Gambia’s total greenhouse gas (GHG) emissions were 4935 GgCO2e, projected to increase to 6617 GgCO2e by 2030 if no measures are taken [7]. The transport sector was responsible for 1026 GgCO2e of GHG emissions in the energy sector, with the sub-sector emitting 345 GgCO2e in 2020 and a projected increase to 1026 GgCO2e by 2050. This increase can be attributed to the rising number of old cars and poor-quality fuels. GHG emissions from livestock were 434 GgCO2e in 2020, expected to rise to 1085 GgCO2e by 2050. Similarly, emissions from aggregate sources were 270 GgCO2e in 2020, projected to reach 674 GgCO2e by 2050, and emissions from forestry stood at 232 GgCO2e in 2020, with a projected value of 578 GgCO2e by 2050 [8]. While The Gambia’s emissions are relatively low compared to global standards, electricity generation accounted for 241 GgCO2e in 2020 and is expected to rise to 535 GgCO2e by 2030 due to the use of light and heavy fuels in electricity production [7]. The country’s electricity demand in urban areas was 1488 kWh per household per annum, compared to 792 kWh per household annually in rural areas [8]. Currently, only 60% of the population in the greater Banjul area has access to electricity, with rural areas having less than 30% access. The government aims to achieve universal electricity access for 80% of the population by 2025.
1.4 Waste Disposal and Management in The Gambia
Municipal solid waste in The Gambia is divided into organic and inorganic fractions, including food waste, agricultural waste, wood, animal waste, paper, plastics, latex, fabrics, and dirt [9]. Globally, organic waste makes up about 46% of municipal solid waste, with paper (17%), plastics (10%), glass (5%), metals (4%), and other types of waste comprising the remaining (18%) [10]. While waste is ideally segregated at the source of production or collection, in The Gambia, segregation at the point of disposal is not widely practiced.
Waste is a significant source of greenhouse gas emissions. The waste sector in The Gambia produced 506 GgCO2e in 2020, with emissions expected to rise to 1184 GgCO2e by 2030 [7]. A 2014 study by the National Environmental Agency identified 95 dumpsites across the country, classified into the following regional volumes:
I Banjul—4 Dumpsites, volume of 556.9 m3
II Kanifing Municipality—16 Dumpsites, volume of 14,384 m3
III West Coast region—20 Dumpsites, volume of 22,910 m3
IV Upper river region—29 Dumpsites, volume of 13,923 m3
V North Bank Region—13 Dumpsites, a volume of 9605 m3
VI Central River region—12 Dumpsites, a volume of 2448 m3
VII Lower River Region—4 Dumpsites, a volume of 494.9 m3
This data highlights the country’s lack of a standardized landfill [11]. The Gambia has identified several mitigation measures to improve waste management and reduce emissions, including waste prevention, recycling, banning biodegradable waste from dumpsites, organic waste recovery, increased landfill methane capture and oxidation, waste separation, and improvements at wastewater treatment and composting facilities [8,12].
1.5 The Gambia’s Energy Development Goals and Targets
The Gambia’s electricity generation is currently entirely dependent on fossil fuels, which are unsustainable and contribute to climate change and GHG emissions. To mitigate these negative effects and secure carbon credits, the government is prioritizing renewable energy sources, including solar PV systems, wind, mini-hydro systems, and biomass [7,12]. To meet national targets, the government, in partnership with others, has outlined several key renewable energy projects:
I 150 MW Regional Solar PV power plant in Soma (IPP)
II 20 MW Jambur solar PV project
III 10.5 MW Nationally Appropriate Mitigation Action (NAMA) solar PV project
According to the Ministry of Environment, Climate Change, and Adaptation’s 2023 project mapping, The Gambia currently has eight energy and climate change adaptation projects, of which only one integrates clean cooking stoves with biogas. Given this focus on solar energy, there is an urgent need for investments in alternative renewable energy sources, particularly waste-to-energy and green hydrogen projects. The country’s limited space and ongoing waste management challenges raise questions about the sustainability of an energy approach centered solely on solar power.
1.6 Current Status of Integrating Bioenergy and Green Hydrogen into the Energy Mix
The integration of bioenergy and green hydrogen into the energy system of countries represents a significant shift towards sustainable energy solutions [13]. The goal of this integration is to enhance energy security, optimize resource use, and reduce greenhouse gas emissions. Research shows that combining bioenergy with green hydrogen strengthens energy infrastructure. This combination improves energy storage and ensures a stable energy supply, addressing the intermittent nature of other renewable energy sources such as solar and wind energy [14,15]. While green hydrogen is most commonly produced through electrolysis powered by solar or wind, it can also be produced from bioenergy methods that can be done biologically or thermochemically.
Dark fermentation is a well-established biological method for hydrogen production, with a net energy ratio of 1.9. In this process, anaerobic bacteria convert substrates in the absence of light [16]. This method can utilize both the organic fraction of municipal solid waste and agricultural residue. Unlike anaerobic digestion, which primarily aims to produce biogas, dark fermentation focuses on hydrogen production [17]. Several types of bacteria can be employed in dark fermentation; however, Clostridium and Enterobacter are the most commonly used. These bacteria can metabolize carbohydrates, proteins, and lipids to produce hydrogen, carbon dioxide, and organic acids through the acidogenic pathway.
Bio-photolysis is another biological method for hydrogen production, which can be categorized into two types. The first type is direct bio-photolysis, where water molecules are split using sunlight as an energy source, facilitated by the hydrogenase enzyme, to produce hydrogen without releasing greenhouse gases. The second type is indirect biophotolysis, performed by microalgae under anoxic conditions. In these conditions, microalgae can produce biohydrogen through fermentation or respiration. However, the indirect method is not continuous, as the return of the light period triggers photosynthetic growth, which inhibits hydrogenase activity [18].
Anaerobic digestion is a biological method that produces biogas from biomass. The conversion involves four main steps that normally take place in a digester. According to [19], the first stage, known as hydrolysis, is in charge of transforming complex insoluble organic matter into simple soluble molecules through the use of enzymatic hydrolysis microorganisms. This is then followed by the acidogenesis stage. During this phase, acid bacteria use both dissolved and bound oxygen in the solution to degrade the hydrolysis products into short-chained organic acids. Before moving to the third stage, called the acetogenesis phase, where essential products for methane generation are produced using acetogenic bacteria. During the final stage, methanogenesis occurs, in which products from the acetogenesis phase, namely acetic acid and hydrogen, are transformed into biomethane by methanogenic microorganisms. At the end of all the processes involved in AD, the main products produced are biogas and digestate. Gasification is a common thermochemical process that transforms biomass or other organic solid wastes into a gaseous product known as syngas. This syngas typically comprises hydrogen (H2), methane (CH4), carbon monoxide (CO), and carbon dioxide (CO2). The conversion occurs by reacting carbonaceous feedstocks with gasifying agents such as air, oxygen, steam, or supercritical water within a gasifier, at temperatures ranging from 500°C to 1200°C. The most prevalent types of gasifiers include fixed bed gasifiers, fluidized bed gasifiers, and entrained flow gasifiers [20]. It can be categorized as either an autothermal reaction or an allothermal reaction. The auto-thermal reaction, often referred to as direct gasification, produces the necessary heat for the process internally, making it endothermic. In contrast, the allothermal gasification process, or indirect gasification, depends on externally generated heat to facilitate the reaction, rendering it exothermic.
Globally, the transition toward sustainable energy systems is accelerating, driven by commitments to decarbonization, energy security, and climate resilience. While much attention has been given to solar, wind, and hydropower, there is growing recognition of the role that waste-to-energy and hydrogen technologies can play, particularly in addressing energy access challenges in low-income and climate-vulnerable countries, as seen in Section 1.1.
In The Gambia, recent investments have primarily focused on solar photovoltaic installations and grid extension projects, supported by international development partners. While commendable, these efforts have not sufficiently diversified the national energy mix, leaving the country highly dependent on imported fossil fuels and vulnerable to energy price shocks. Furthermore, existing projects often overlook locally available organic resources such as crop residues and MSW that could be harnessed for energy generation in both rural and peri-urban areas.
This research addresses a critical gap in The Gambia’s energy planning by conducting the first integrated assessment of bioenergy and green hydrogen potential using nationally sourced biomass and waste data. Unlike previous studies that examine isolated technologies or rely on generalized regional models, this study provides a quantitative, country-specific evaluation of both theoretical and technical energy yields from crop residues and MSW, spanning from 2017 to 2021 with projections to 2038. It estimates a technical capacity of 64.5 MW in electricity and over 6.2 million kmol of hydrogen annually, highlighting significant untapped potential. Beyond energy estimation, the study employs GIS-based site analysis and proposes a three-phase implementation strategy, making it not only analytically robust but also actionable. In doing so, it offers a novel framework for integrated energy planning that is grounded in local context and can serve as a blueprint for other West African countries undergoing energy transitions. This combination of localized resource modeling, technical potential analysis, and spatial planning constitutes the core novelty and strategic importance of the study.
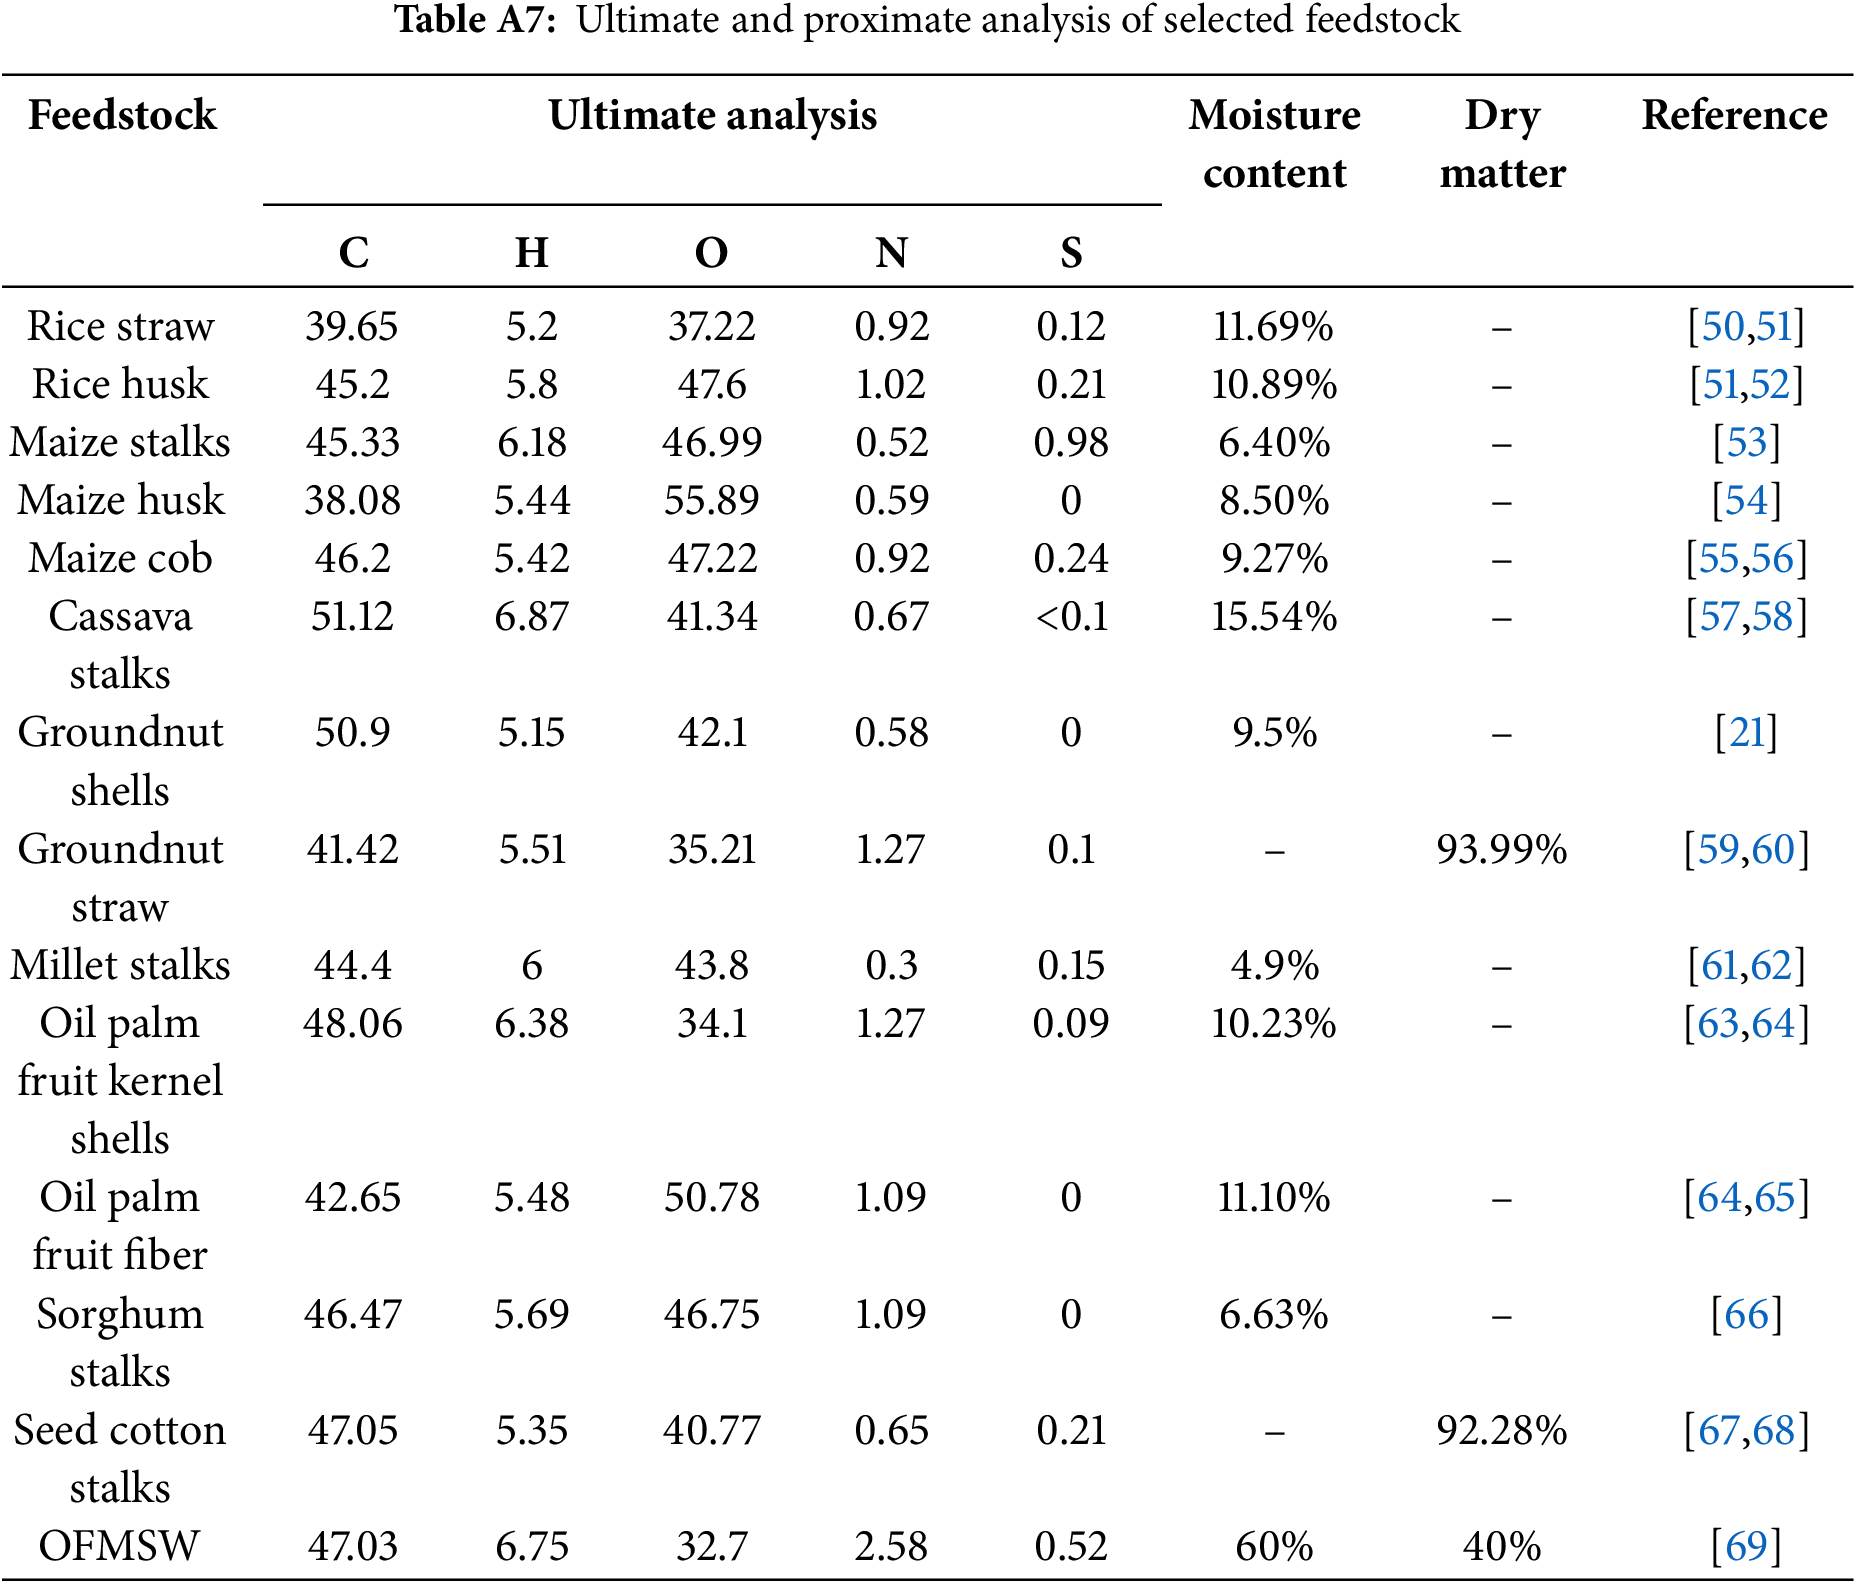
2.1 Ultimate and Proximate Analysis
The ultimate analysis or elemental analysis is performed to quantify the carbon (C), hydrogen (H), oxygen (O), nitrogen (N), and sulfur (S) content of biomass. This analysis is normally conducted with the use of an element analyzer such as the LECO CNS and Model 2400 CHNS-O, Perkin Elmer element analyzers, and the ASTM D 3173-85 or ASTM D 2243-00 methods [21–24]. Whereas, the proximate analysis quantifies the moisture content, dry matter, volatile materials, fixed carbon, and ash content in the feedstock. According to [22] To obtain the values of the specified parameters, the ASTM E 1617-94 and the ASTM E 1755-01 methods are used.
2.2 Residue-to-Product Ratio (RPR)
The residue-to-product ratio is a key metric in biomass studies that represents the proportion of crop residue generated relative to the main agricultural product. According to [25], the RPR values indicate how much biomass waste is generated per unit of harvested crop. These values can vary based on factors such as crop variety, soil fertility, and climatic conditions.
2.3 Theoretical Potential Calculation Methods
The theoretical potential of crop residues is calculated by multiplying the annual crop production by the residue-to-product ratio, as shown in Eq. (1). That of municipal solid waste is calculated by multiplying the annual production of municipal solid waste by the organic fraction of municipal solid waste percentage of the study site, as shown in Eq. (3). The theoretical Buswell’s equation, shown below Eq. (5), was introduced in 1952 and is used to estimate the biogas potential of a given feedstock from anaerobic digestion. The values required while using the equation are the carbon, oxygen, hydrogen, nitrogen, and sulfur composition (ultimate analysis) of the specified biomass. To estimate the methane potential, a combination of Buswell’s equation with the carbon content of the biodegraded material [26–28]. Steam methane reforming is an endothermic reaction that converts methane to hydrogen with the aid of steam. To determine the theoretical hydrogen potential of selected feedstocks theoretical methane potential is a branch of chemistry known as stoichiometry that involves the use of reactants and products in a chemical reaction to derive the quantity of the element needed, in this case, hydrogen. Eq. (9) was obtained from [29,30] was used to estimate the hydrogen potential of the selected feedstocks for this research.
The Gambia is divided into five administrative regions whose names originate from their position with the River Gambia that runs across the length of the country. The names of the regions are as follows: Central River Region (CRR (North and South)), Lower River Region (LRR), Upper River Region (URR), North Bank Region (NBR), and West Coast Region (WCR) [12]. These regions are further divided into eight districts, namely Banjul, Brikama, Kanifing, Kerewan, Mansa Konko, Kuntaur, Janjanbureh, and Basse, as shown above in Fig. 1. This study focuses on municipal solid waste and the crop residue generated by the country as a whole. The Gambia’s economy is mainly dependent on agricultural activities and tourism. The agricultural sector contributes 24% of the country’s gross domestic product (GDP) [31]. The agricultural products mainly produced in the country are livestock, crops, and fisheries. Crop residues in The Gambia are mainly obtained from farms or gardens. It normally includes rice straw, wheat straw, rice husk, corn stover, stalks and leaves from tomatoes, pepper, coconut shells, sugarcane bagasse, and so forth, depending on the region and climatic conditions. They are mostly left on the fields after harvests and used for fodder and landfill material, or burned in many places. These practices can lead to carbon emissions and leaching [32].
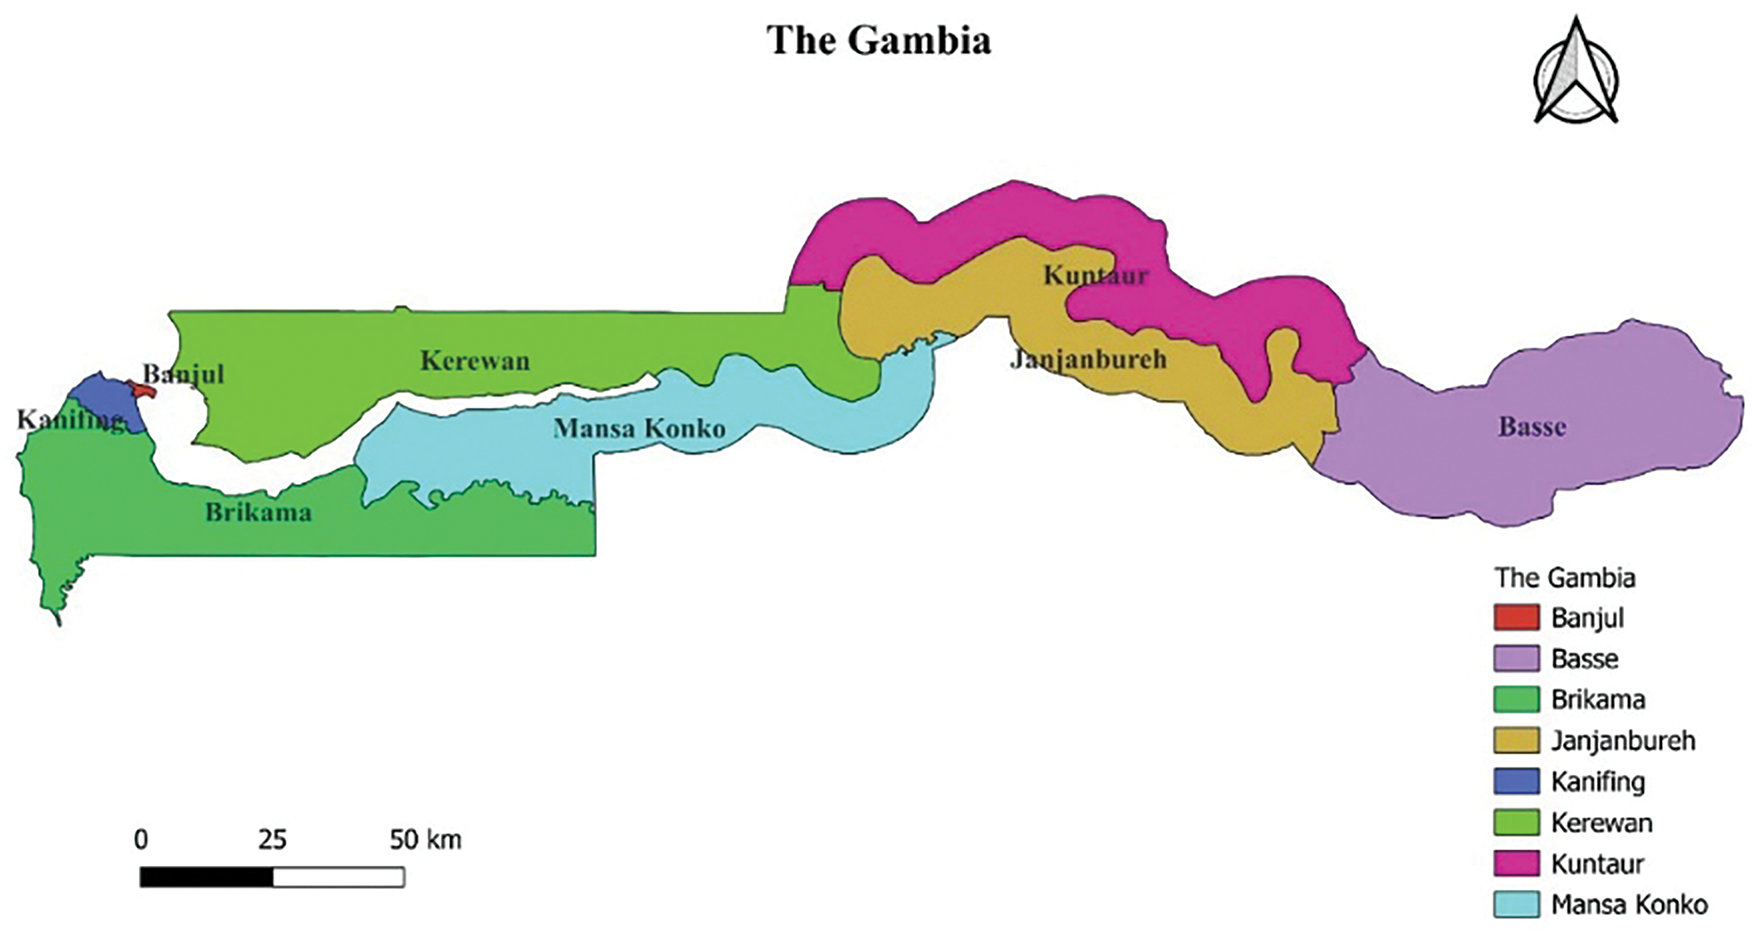
Figure 1: Study site highlighting the eight districts of The Gambia
The agricultural residue is mostly inexpensive, renewable lignocellulosic fiber resources that can be used as an alternative to woody lignocellulosic biomass. These residues have similar structure, composition, and properties to those of other plant fibers and make them suitable for composite, textile, pulp, and paper applications [33].
These residues can be used for composting and the generation of biogas, biofuels, and green hydrogen. This research is focused on the use of biogas production through anaerobic digestion to calculate the country’s potential for generating biomethane, electricity, and hydrogen.
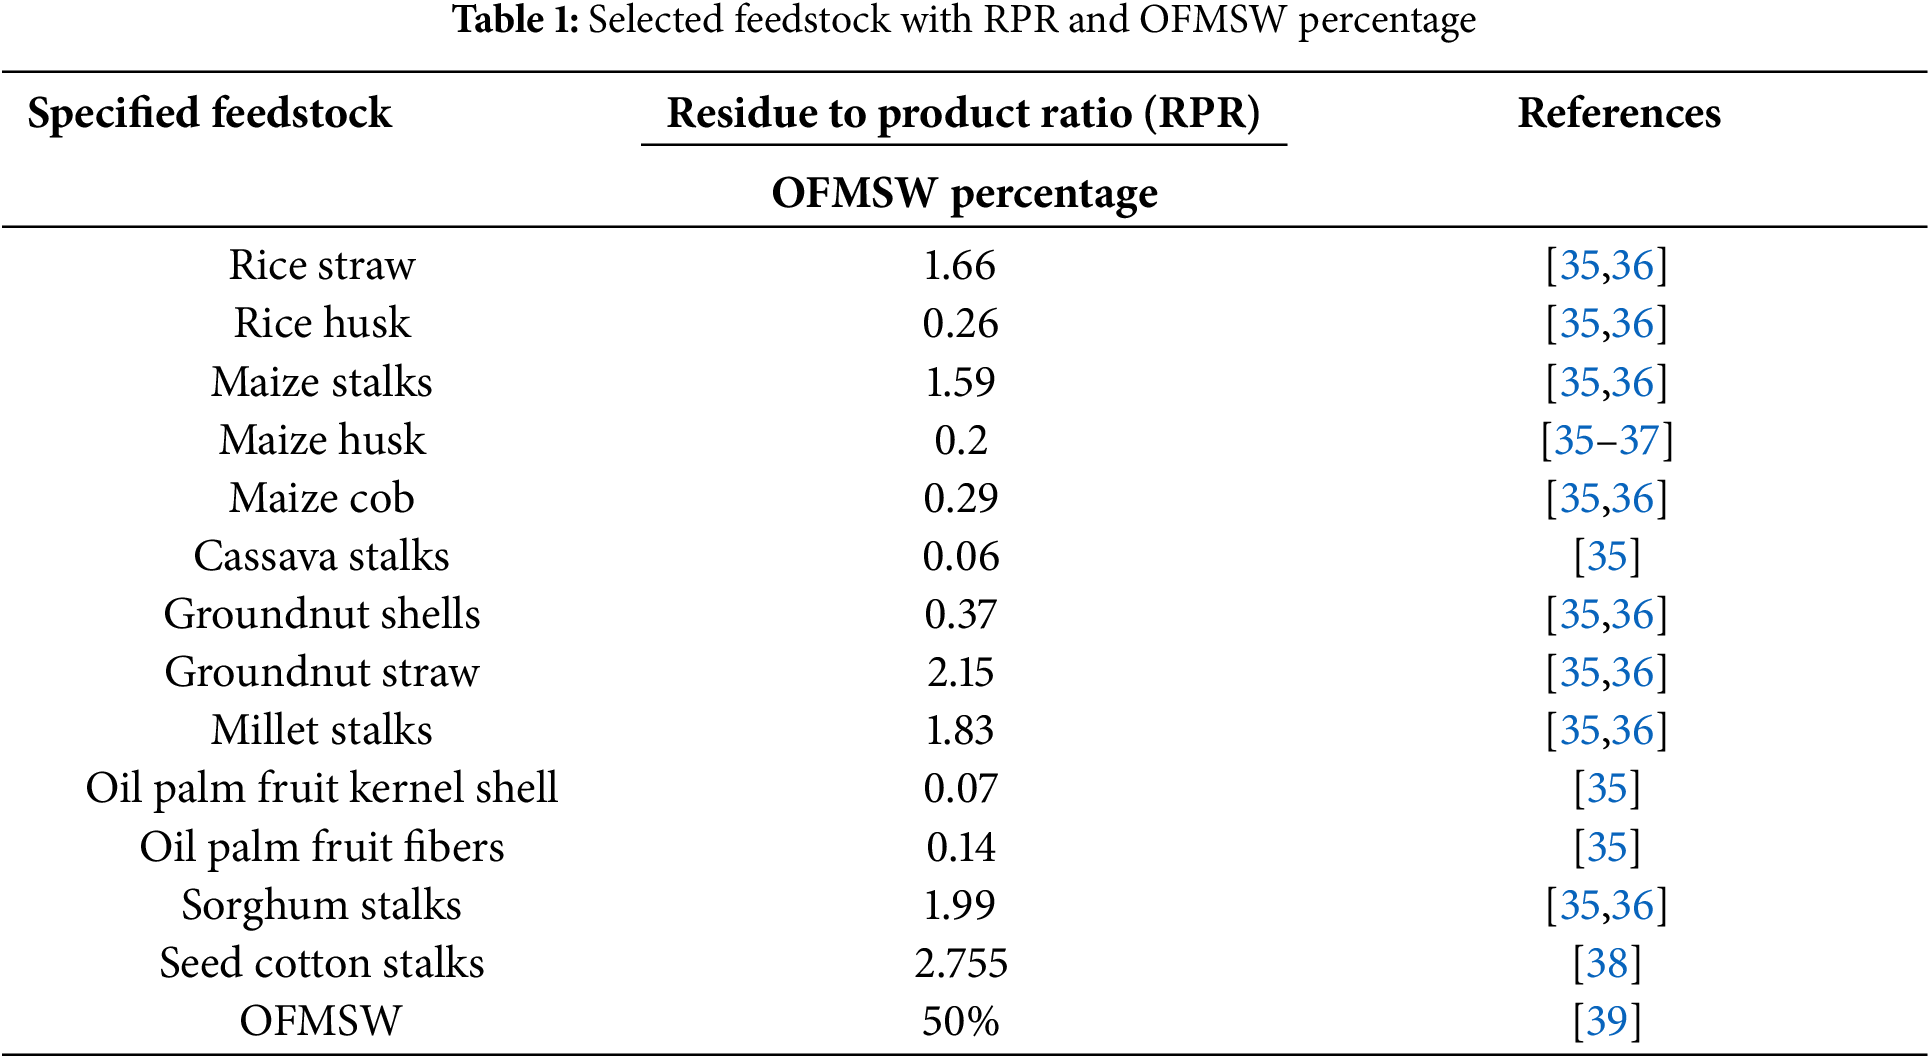
Crops produced in The Gambia are divided into two categories, the first being cash crops, which include groundnuts, millet, sorghum, seed cotton, and oil palm fruit. The second category is subsistence crops, which include rice, cassava, okra, onions, tomatoes, and other vegetables. Table 1 highlights the fourteen feedstocks used to estimate the study site’s biogas, biomethane, biohydrogen, and electricity production potential.
2.5 Secondary Data Collection and Compilation
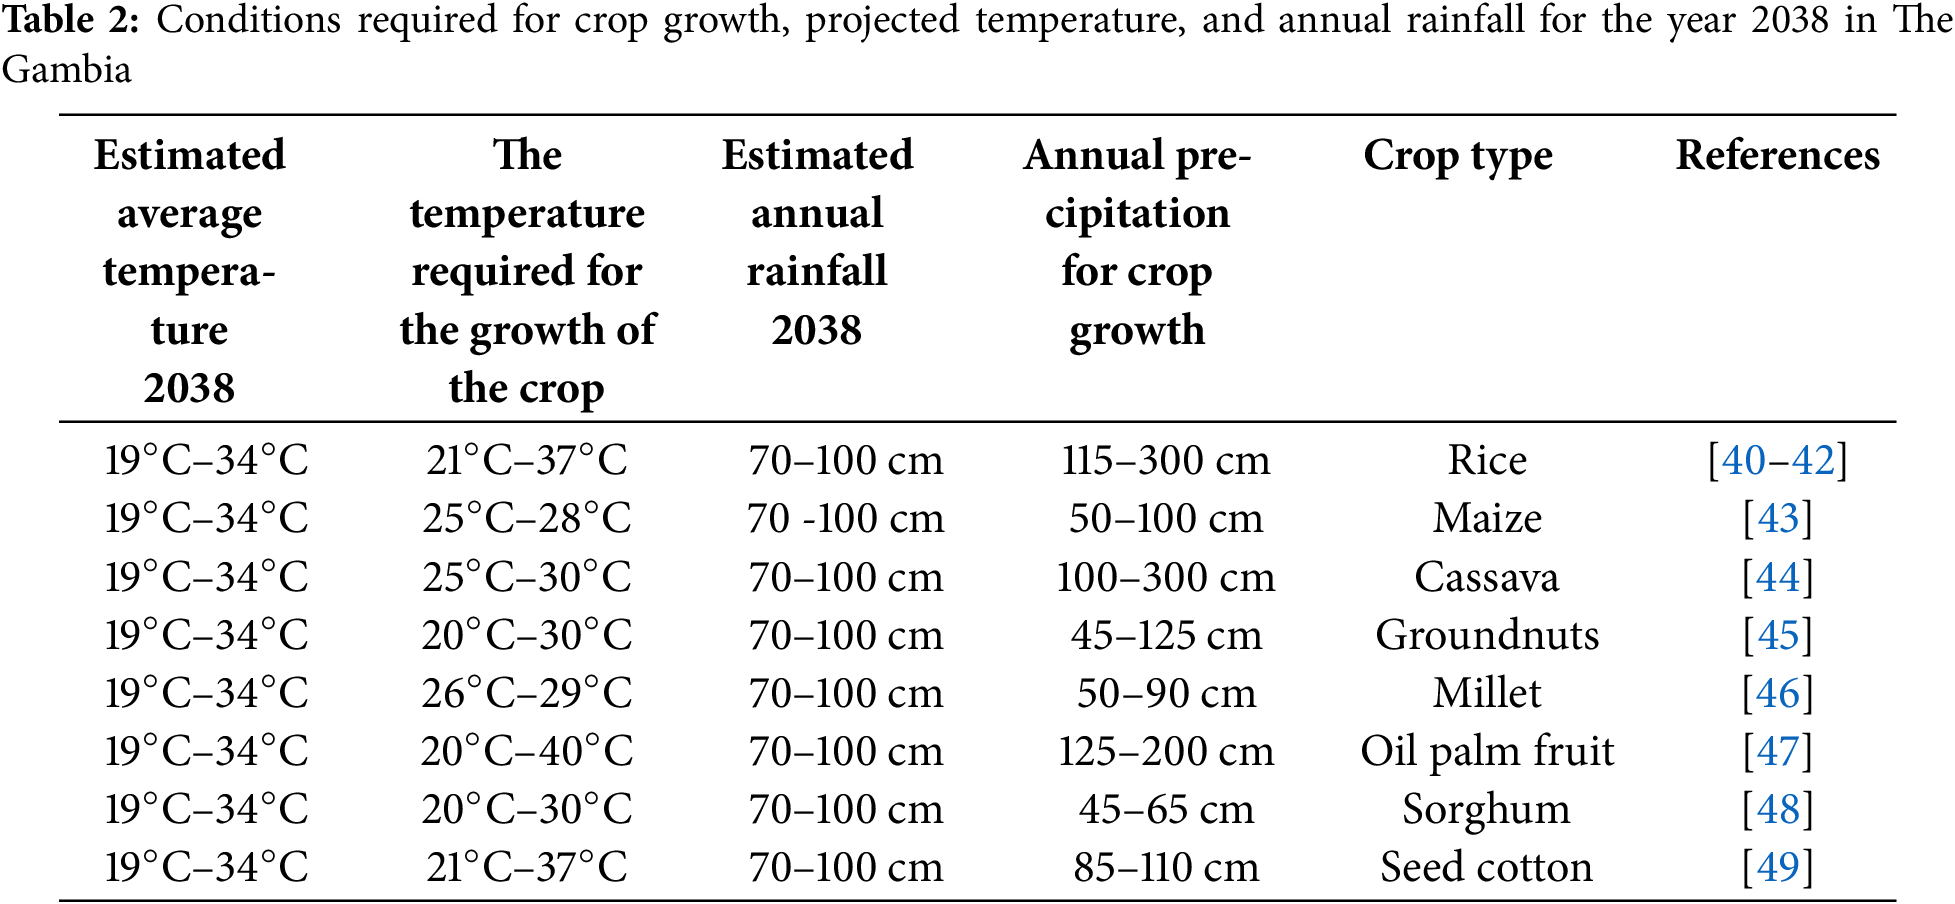
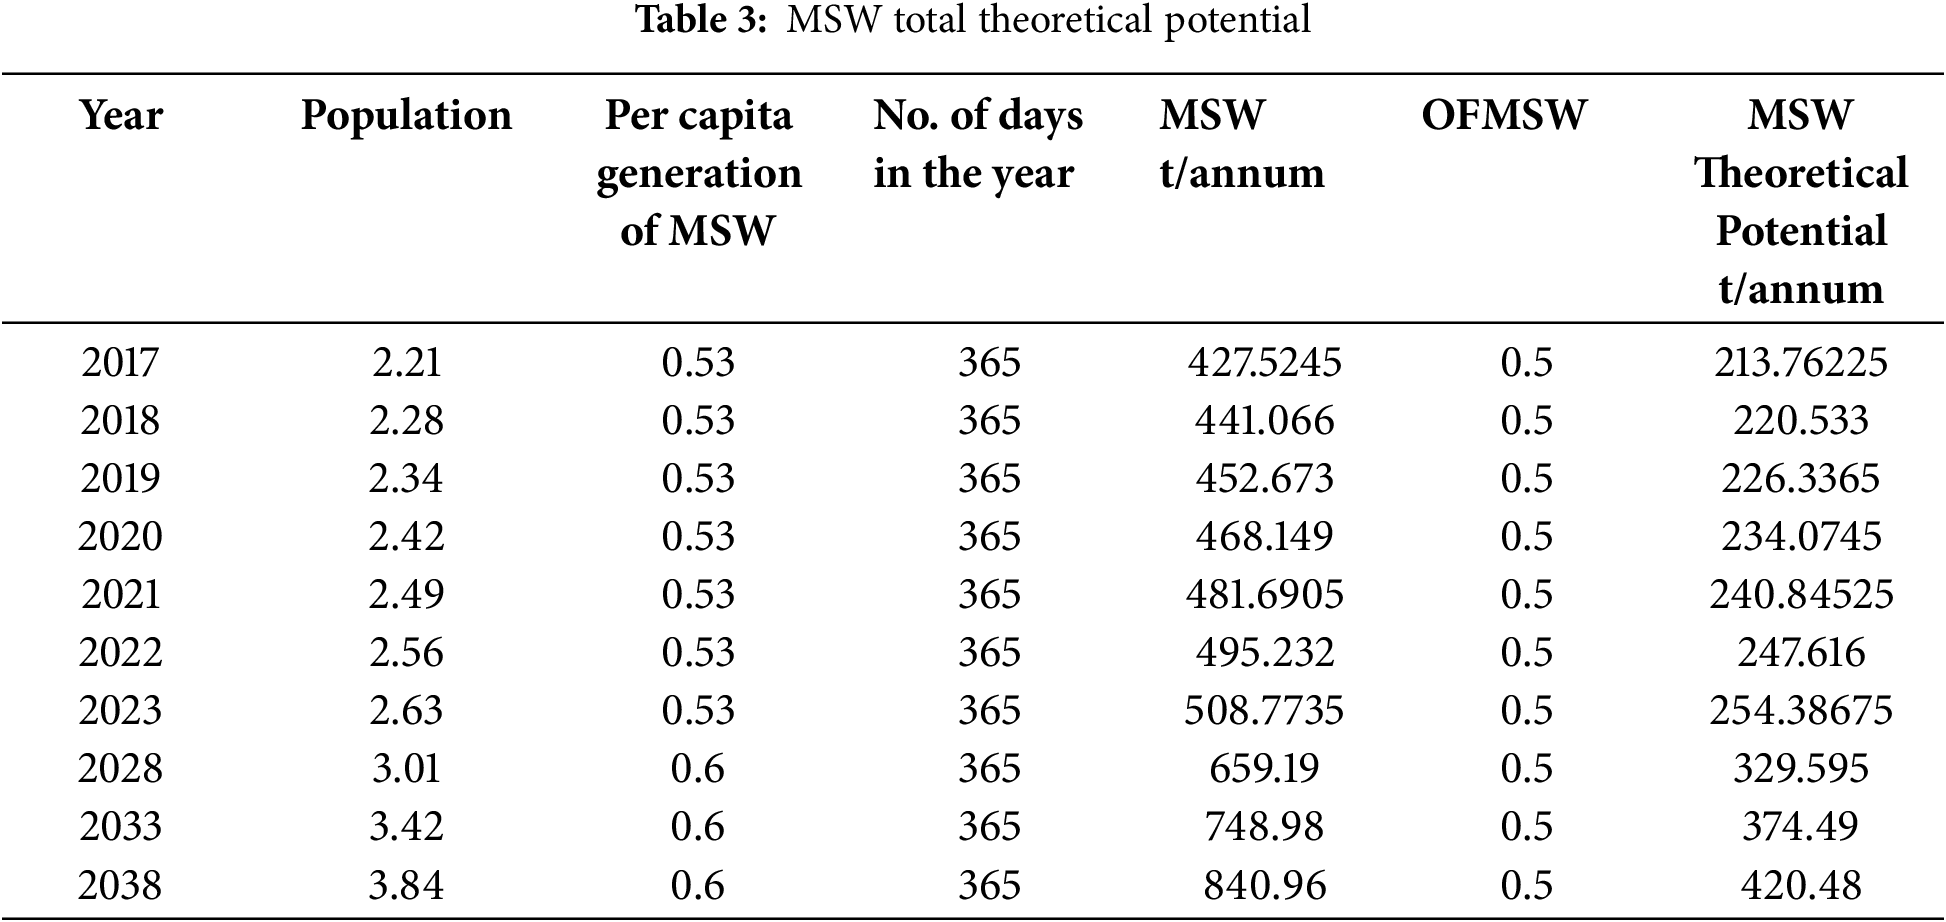
Data for this study, presented in Tables 1 and 2 with additional supporting data provided in Table 3 were obtained from FAOSTAT (Food and Agriculture Organization Corporate Statistical Database), peer-reviewed articles, and official sources including The Gambia’s Ministry of Agriculture, Ministry of Environment, Ministry of Energy, the Kanifing Municipal Council, and the Brikama area council. FAOSTAT serves as a comprehensive global database that systematically collects, processes, and disseminates agricultural data, including detailed statistics on crop production. In the context of The Gambia, the process of submitting crop production data to FAOSTAT is handled by the Ministry of Agriculture, which oversees a structured methodology involving national statistical agencies in collaboration with FAO. Data collection in The Gambia relies on diverse sources, including farm surveys, census reports, and administrative records, encompassing key agricultural metrics such as area harvested, total production, and yield per hectare. Upon compilation, the data is formatted and submitted to FAO through standardized templates designed to ensure consistency and uniformity across submissions. The FAO subsequently undertakes verification and validation procedures, cross-referencing the submitted data for accuracy and rectifying any discrepancies in coordination with Gambia’s agricultural authorities.
Following the validation process, the verified data is integrated into the FAOSTAT database, making it publicly available. During the data collection phase for this study, correspondence was sent to the public institutions listed above, which provided valuable information regarding the geographical distribution of farms and dumpsites, as well as policies and ongoing projects. Notably, it was identified that the data lacked quantitative details specifying the types and volumes of crops produced, which presents a significant limitation to the study, as it indicates that not all agricultural products cultivated within the nation are comprehensively represented in the FAOSTAT database. Data represented in Tables A1–A5, found in the Appendix, provides annual crop production data sourced from literature [34].
2.6.1 Crop Residue and Municipal Solid Waste Theoretical Potentials
Theoretical crop residue potential
For this research, the estimation of theoretical crop residue potential was conducted by using the following steps:
Step One:
Determine the annual crop production of the selected feedstock from the literature. Due to unavailable data for the years 2022 and 2023, the data in Tables A1–A5 in the Appendix and Table 2 were used as a reference to estimate the projected annual crop production for the year 2038.
Step Two:
Calculate the theoretical crop residue potential using equation one and the data in Tables A1–A7.
Step Three:
The values obtained from step two were then summed up to get the total theoretical crop residue potential for the years 2017 to 2021 and 2038.
Annual municipal solid waste production
Municipal solid waste theoretical potential
To obtain the municipal solid waste theoretical potential for this research, the following steps were taken:
Step One:
To calculate the country’s generation of municipal solid waste for each of the specified years, equation two was used by multiplying the population value by each corresponding year with the per capita generation of that particular year and the number of days in the year. The values for the population size and per capita generation of MSW are highlighted in Table 3.
Step Two:
The estimated municipal waste generation was multiplied by the percentage of the organic fraction of municipal solid waste for each year to obtain the theoretical potential of municipal solid waste. The percentage of the OFMSW is shown in Table 3.
To obtain the total theoretical potential of all the feedstocks, equation four was used by simply summing up the MSW theoretical potential with the crop residue theoretical potential. This was done for each of the respective years.
Total theoretical potential
2.6.2 Theoretical Buswell’s Equation
Buswell’s equation
To calculate the methane and energy yield, the steps below were followed using the proximate and ultimate analysis data from Table A8, which were sourced from various studies on individual feedstocks: rice straw and rice husk [50–52], maize stalk, husk, and cob [53–56], cassava stalks [57,58], groundnut shells and straw [59,60], millet stalks [61,62], oil palm kernel shells and fibers [63–65], sorghum stalks [66], seed cotton stalks [67,68], and the organic fraction of municipal solid waste [69].
Step One: Theoretical biogas composition
This was calculated with the use of Eqs. (5) and (6).
• To get the coefficient of carbon dioxide and methane, the elemental value from the ultimate analysis of a specific feedstock was divided by its corresponding atomic mass.
• The values obtained at this stage were then used in Buswell’s equation to get the earlier-mentioned coefficients.
• The methane percentage of the biogas was then determined by dividing the methane coefficient by the sum of the methane and carbon dioxide coefficients, as shown in Eq. (6).
• This value was then subtracted from one hundred to get the carbon dioxide percentage.
Methane percentage
Step Two: Methane yield
• The theoretical potential of each of the chosen feedstocks was converted from tons to kilograms.
• The converted values were used to determine the theoretical potential dry matter and moisture content by multiplying the specified moisture percentage in Table A8 with its respective theoretical potential. The same process was followed for the dry matter content.
• The carbon percentage was calculated by multiplying the elemental value by its corresponding atomic mass from the ultimate analysis. The values for each of the elements were then summed up. The value for carbon was then divided by the summed-up value and multiplied by one hundred to get the carbon percentage.
• Calculate the weight of carbon of the feedstock by multiplying the carbon percentage by the dry matter content of the feedstock’s theoretical potential.
• Calculate the weight of carbon converted to biogas first, assuming the percentage of biodegraded carbon is 70%. This percentage is multiplied by the weight of carbon to get the weight of carbon converted to biogas.
• Determine the weight of methane carbon by multiplying the methane percentage of biogas by the weight of carbon converted to biogas.
• According to [27], 1 mol of methane is equal to 16 g of methane.
• To calculate the weight of methane, 16 g of methane is divided by the atomic mass of carbon, which is then multiplied by the weight of carbon to get the weight of methane in kilograms before it is later converted to grams.
• According to [27], 1 mol of gas at standard temperature and pressure (STP) is equal to 22.4 L, and 16 g of methane is equivalent to 22.4 L.
• To calculate the volume of methane in cubic meters, the weight of methane in grams obtained earlier is then divided by 16 to get methane in moles. The methane in mols is then multiplied by 22.4 to get the volume of methane in liters, this value is then converted to cubic meters.
• The weight of methane was then converted to metric tons by dividing the value of methane in kilograms by one thousand.
Step Three: Energy value of methane
• Based on [27], 1 m3 of methane is equal to 36 MJ (megajoules) and 1 kWh is equivalent to 3.6 MJ and 1 m3 of methane is equal to 10 kWh.
• The energy value of methane for each of the chosen feedstocks was determined by multiplying the volume of methane in cubic meters by ten to get it in kilowatt hours.
• This was then converted to MWh with the use of Eq. (7).
kWh to MWh conversion equation
MWh to MW conversion equation
2.6.3 Hydrogen Production Potential from Steam Methane Reforming with the Use of Stoichiometry
Steam methane reforming
Based on [29,30], 1 mol of methane will give 3 moles of hydrogen gas stoichiometrically. Eqs. (10)–(12) were then used to calculate the hydrogen theoretical potential.
Molar mass of methane
Amount of methane
Amount of hydrogen
The technical potential for energy generation and hydrogen production was calculated to determine the achievable production quantity. To do this, the conversion efficiencies for electricity from methane, which is 85%, and the conversion efficiency of hydrogen through steam methane reforming, which ranges from 65% to 75%, were obtained [70,71]. The conversion efficiency percentage of energy was multiplied by the theoretical energy potential for each corresponding year. The same process was followed to calculate the technical potential for hydrogen, as shown in Eq. (13).
Technical potential
3.1 Theoretical Crop Residue Potential
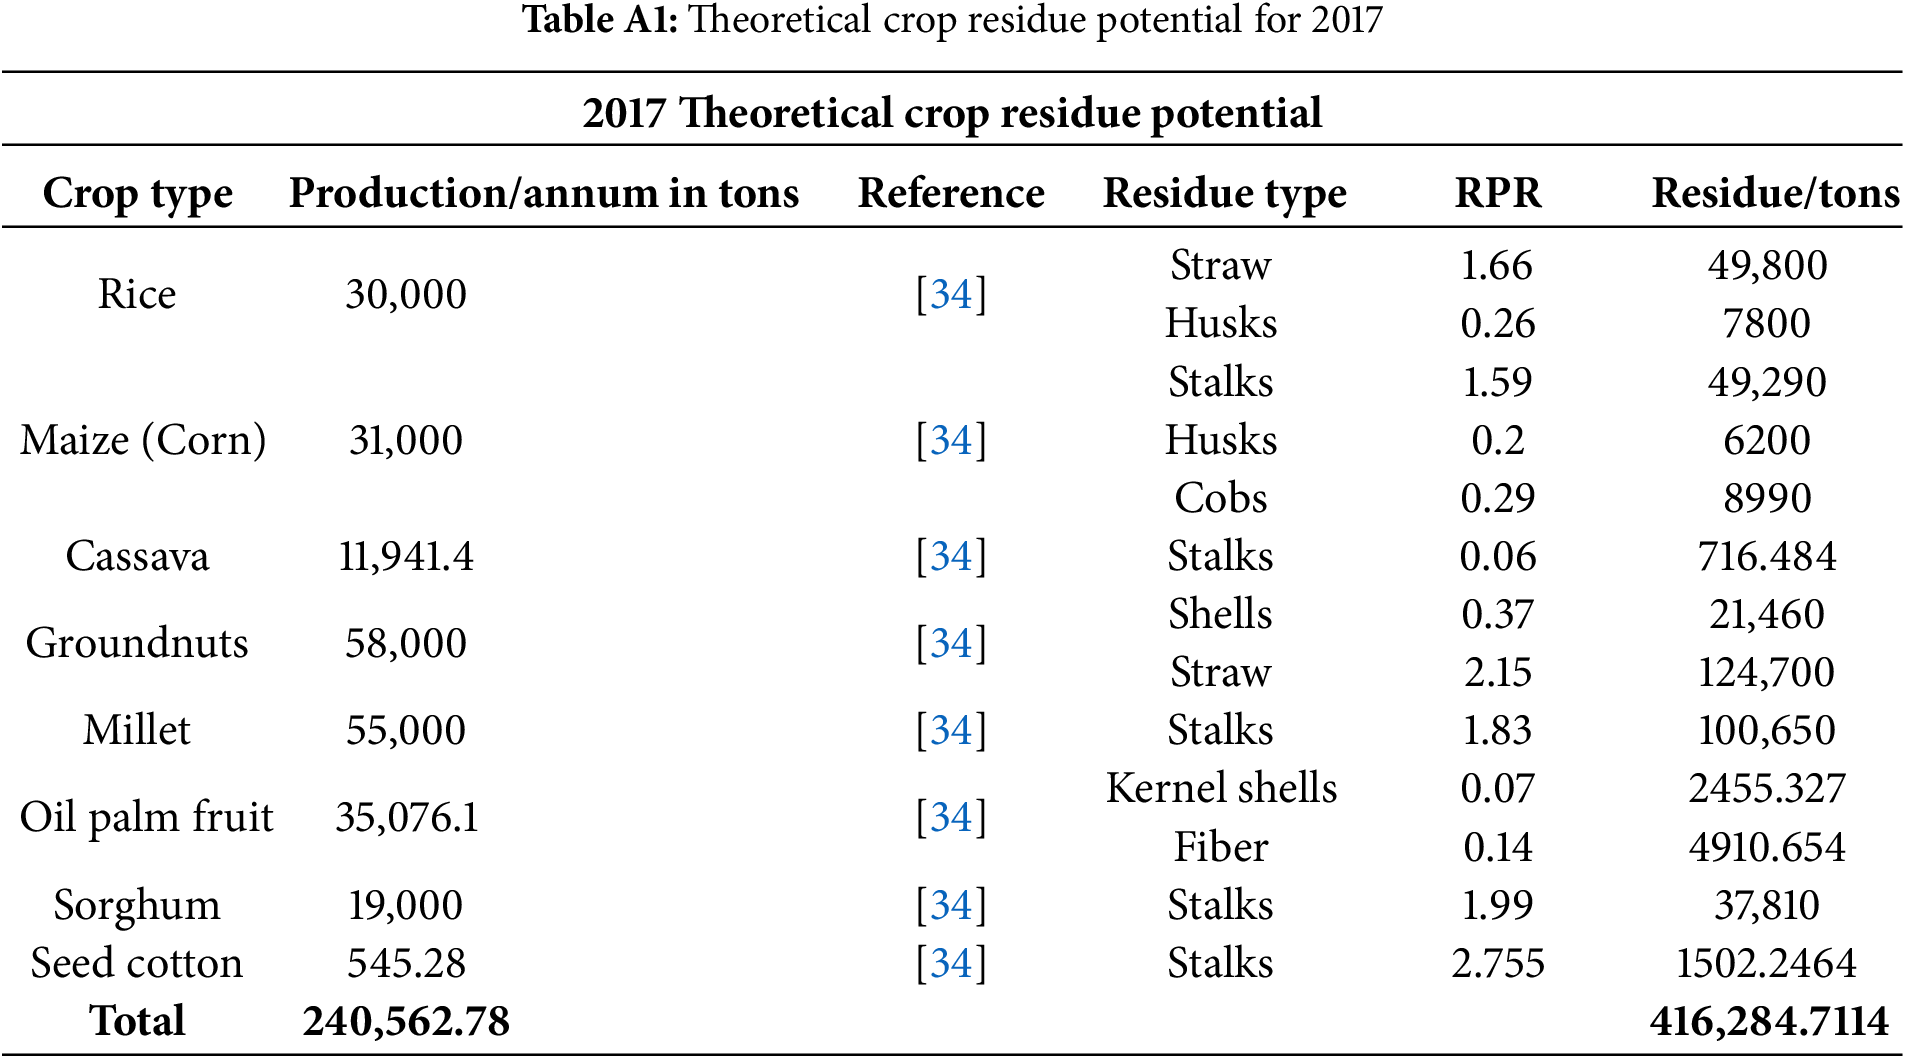
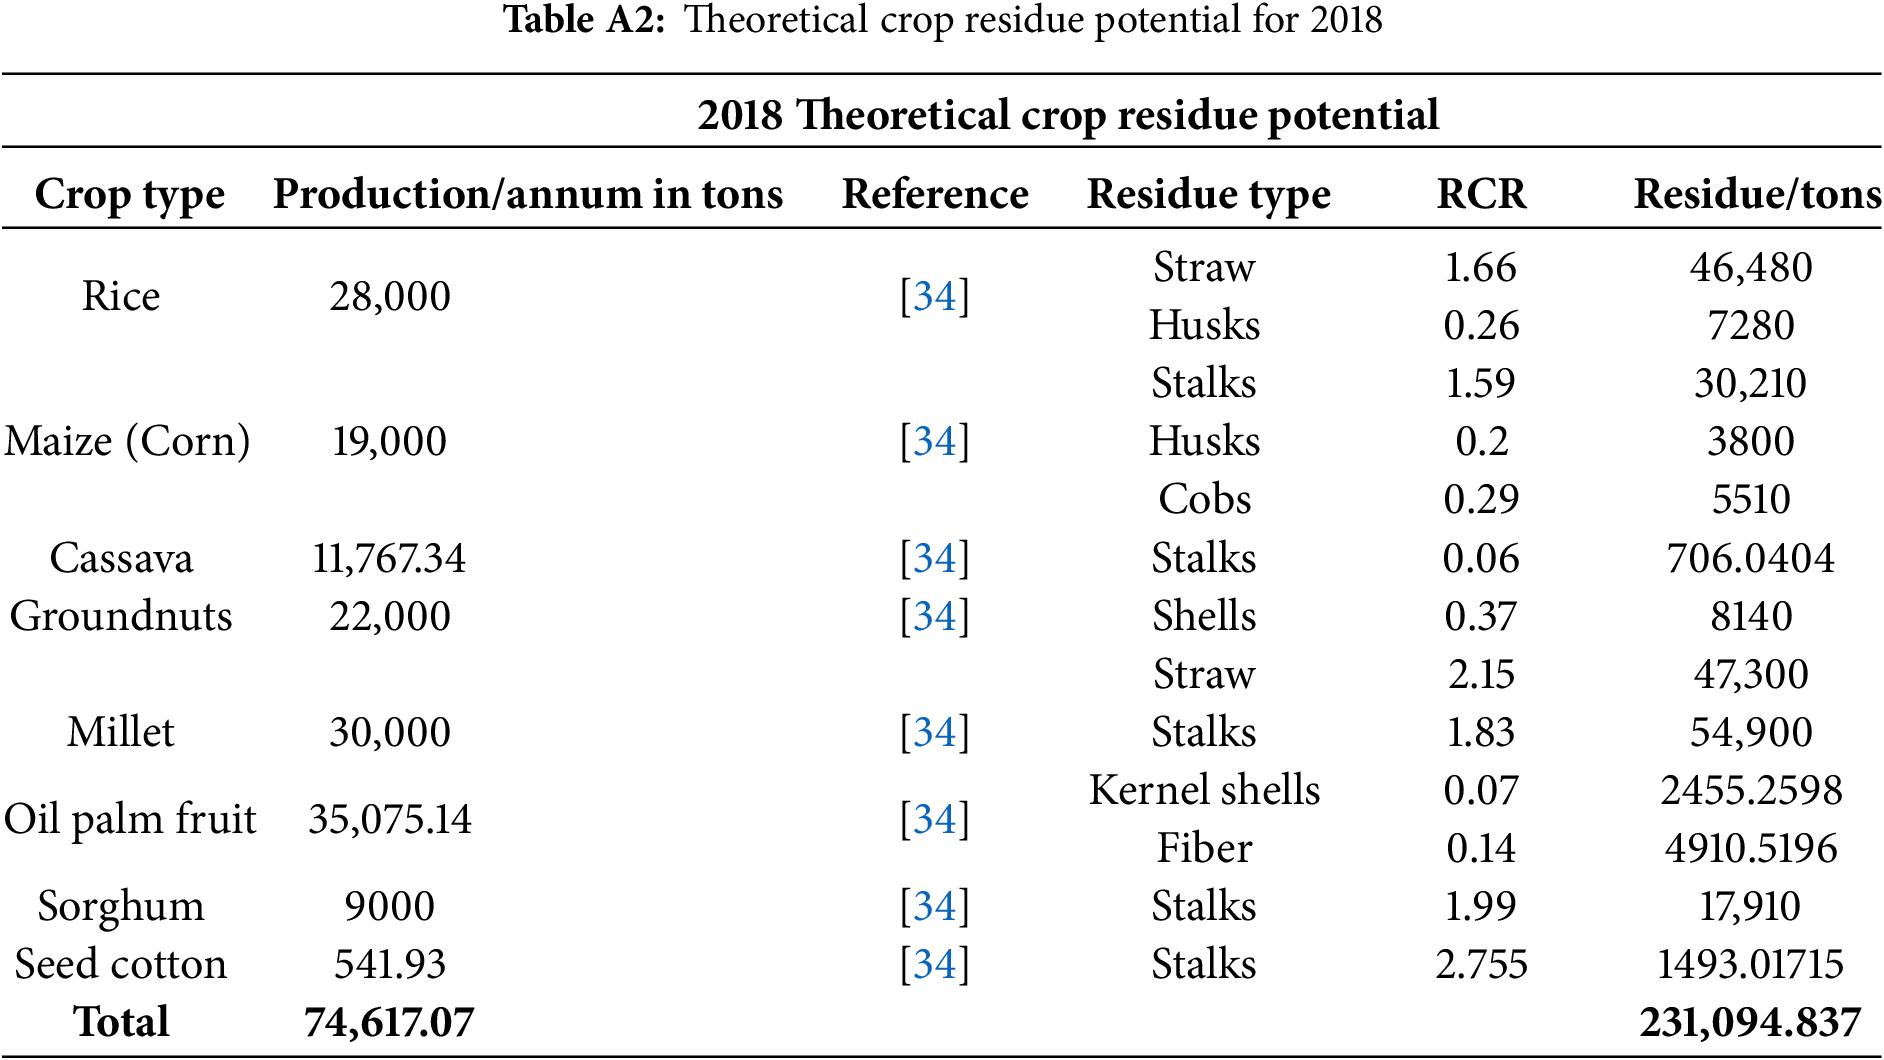
Shown below in Fig. 2 is the total theoretical crop residue potential for each of the respective years. The years 2017 and 2019 had the highest theoretical crop residue potential due to the high production yield, as compared to 2018, which had a lower potential due to flooding that occurred during July and August in The Gambia. Although the theoretical crop residue potential for the years 2020 (303,660.0 t/annum) and 2021 (297,639.2 t/annum) was much better than that of 2018 (231,094.8 t/annum). However, compared to the year 2019, which had a potential of 416,284.7 t/annum, it was significantly lower; this reduction in yield could be attributed to the COVID-19 pandemic, which had a severe impact on the country’s agricultural activities. Assuming the absence of natural disasters and pandemics, the estimation for the year 2038 was conducted with the aid of data in Table 2, which helped to prove that when exposed to the required growth conditions, the country’s theoretical crop residue potential would increase steadily.
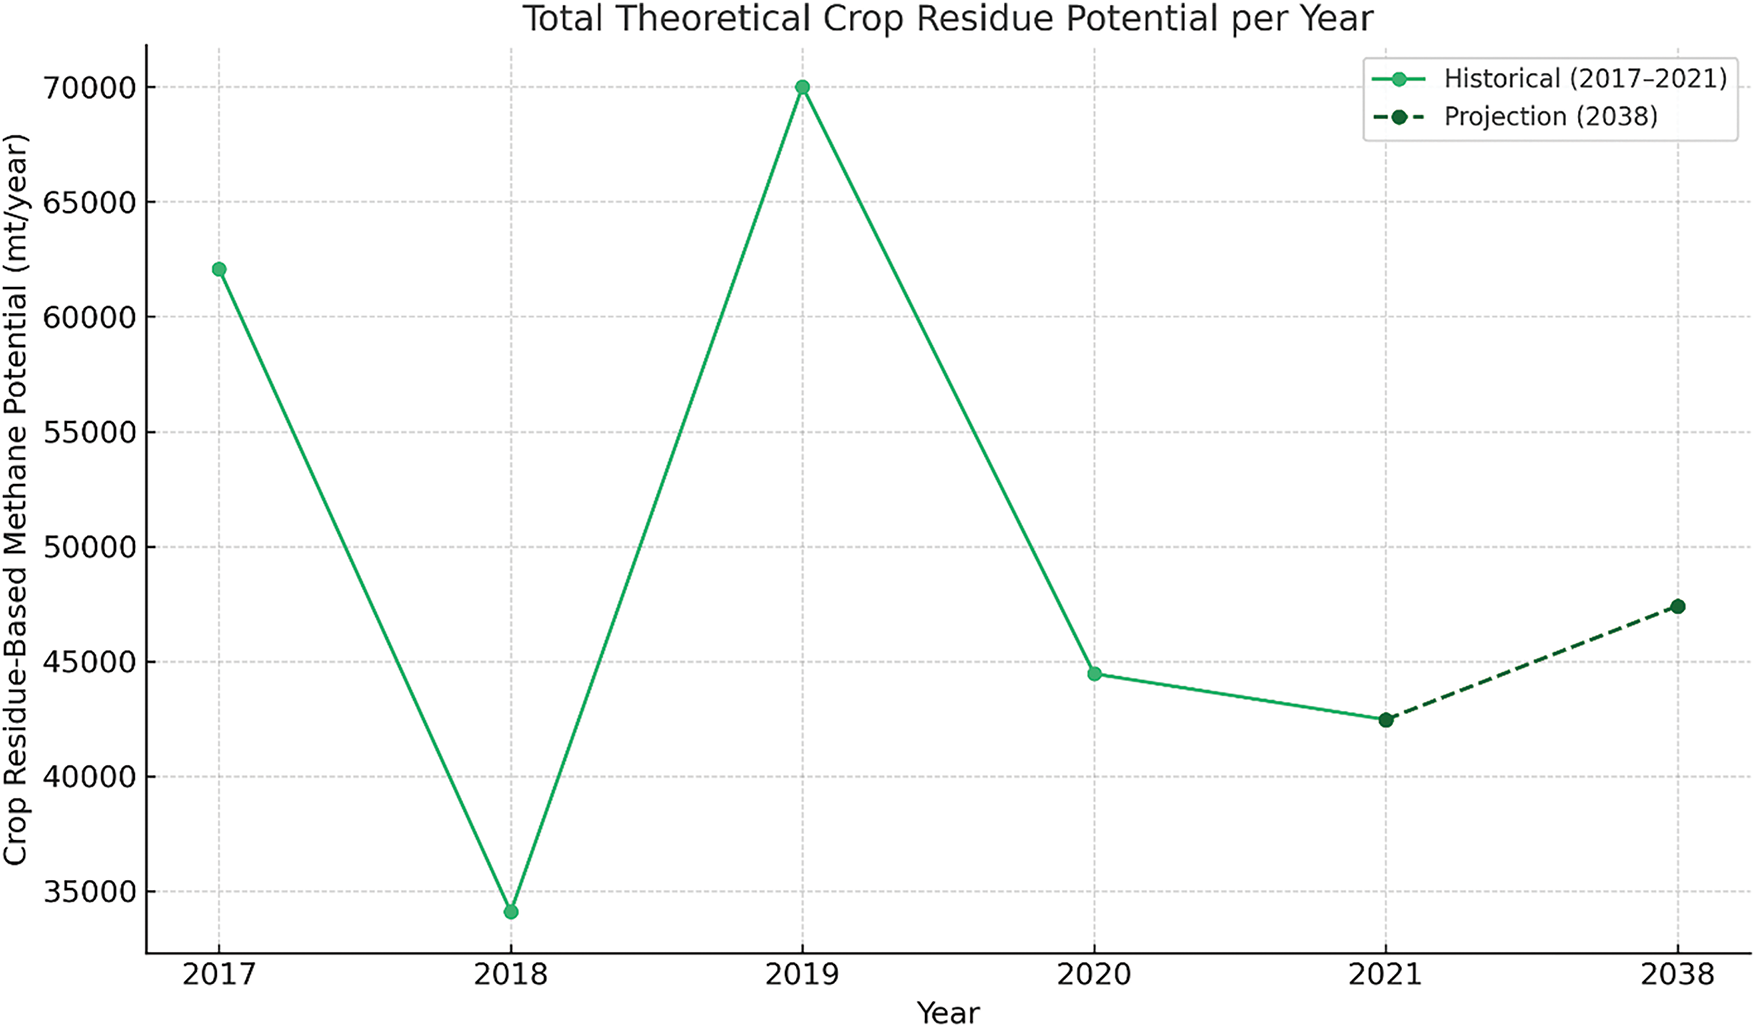
Figure 2: The total theoretical crop residue potential per year
3.2 Municipal Solid Waste Theoretical Potential
Unlike the theoretical crop potential shown above in Fig. 2, the municipal solid waste theoretical potential represented in Fig. 3 shows a steady yearly increase in municipal solid waste theoretical potential. This trend is due to the increase in population size and the per capita generation of the country. Based on this trend, in addition to that of the crop residue potential, when the theoretical potential for crop residue and MSW is combined, it shows that the country has an estimated total theoretical potential of 329,889.7 t/annum.
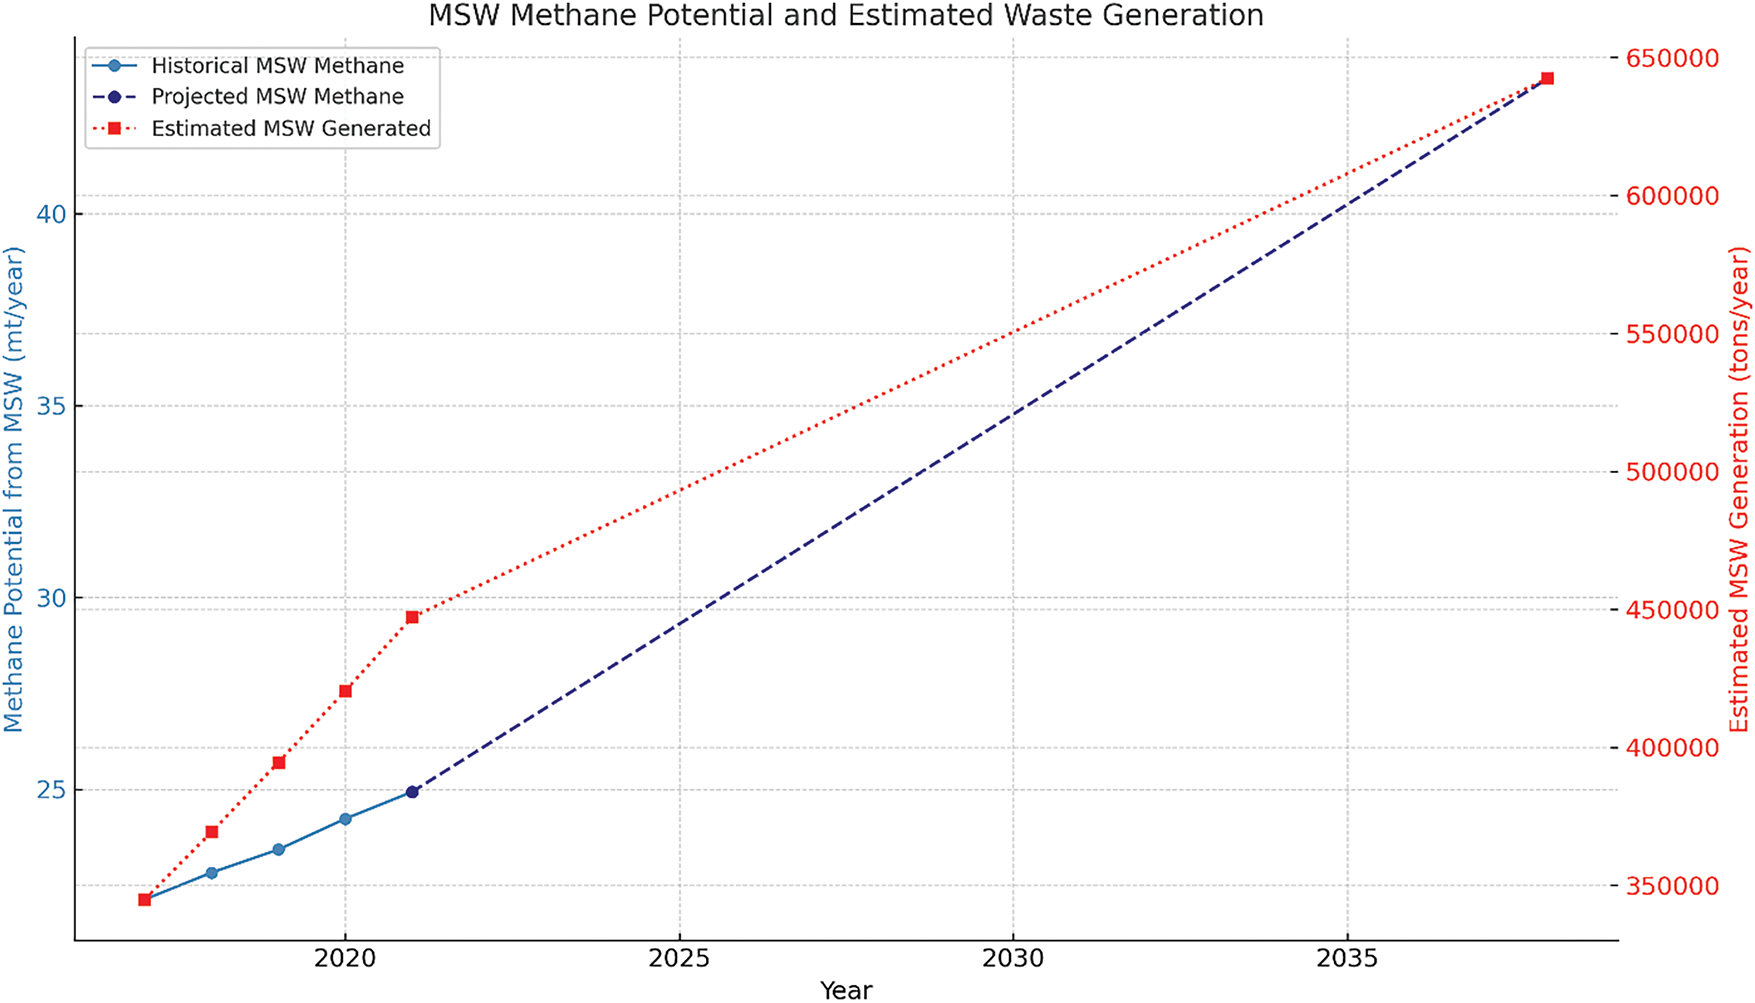
Figure 3: The total theoretical potential of municipal solid waste
3.3 Theoretical Methane Potential
The findings presented in Fig. 4 illustrate that the residues derived from cash crops, specifically groundnuts, millet, sorghum, and maize, exhibit significantly higher methane production potentials in comparison to subsistence crops. Conversely, the organic fraction of municipal solid waste (OFMSW) demonstrates the lowest theoretical methane production potential.
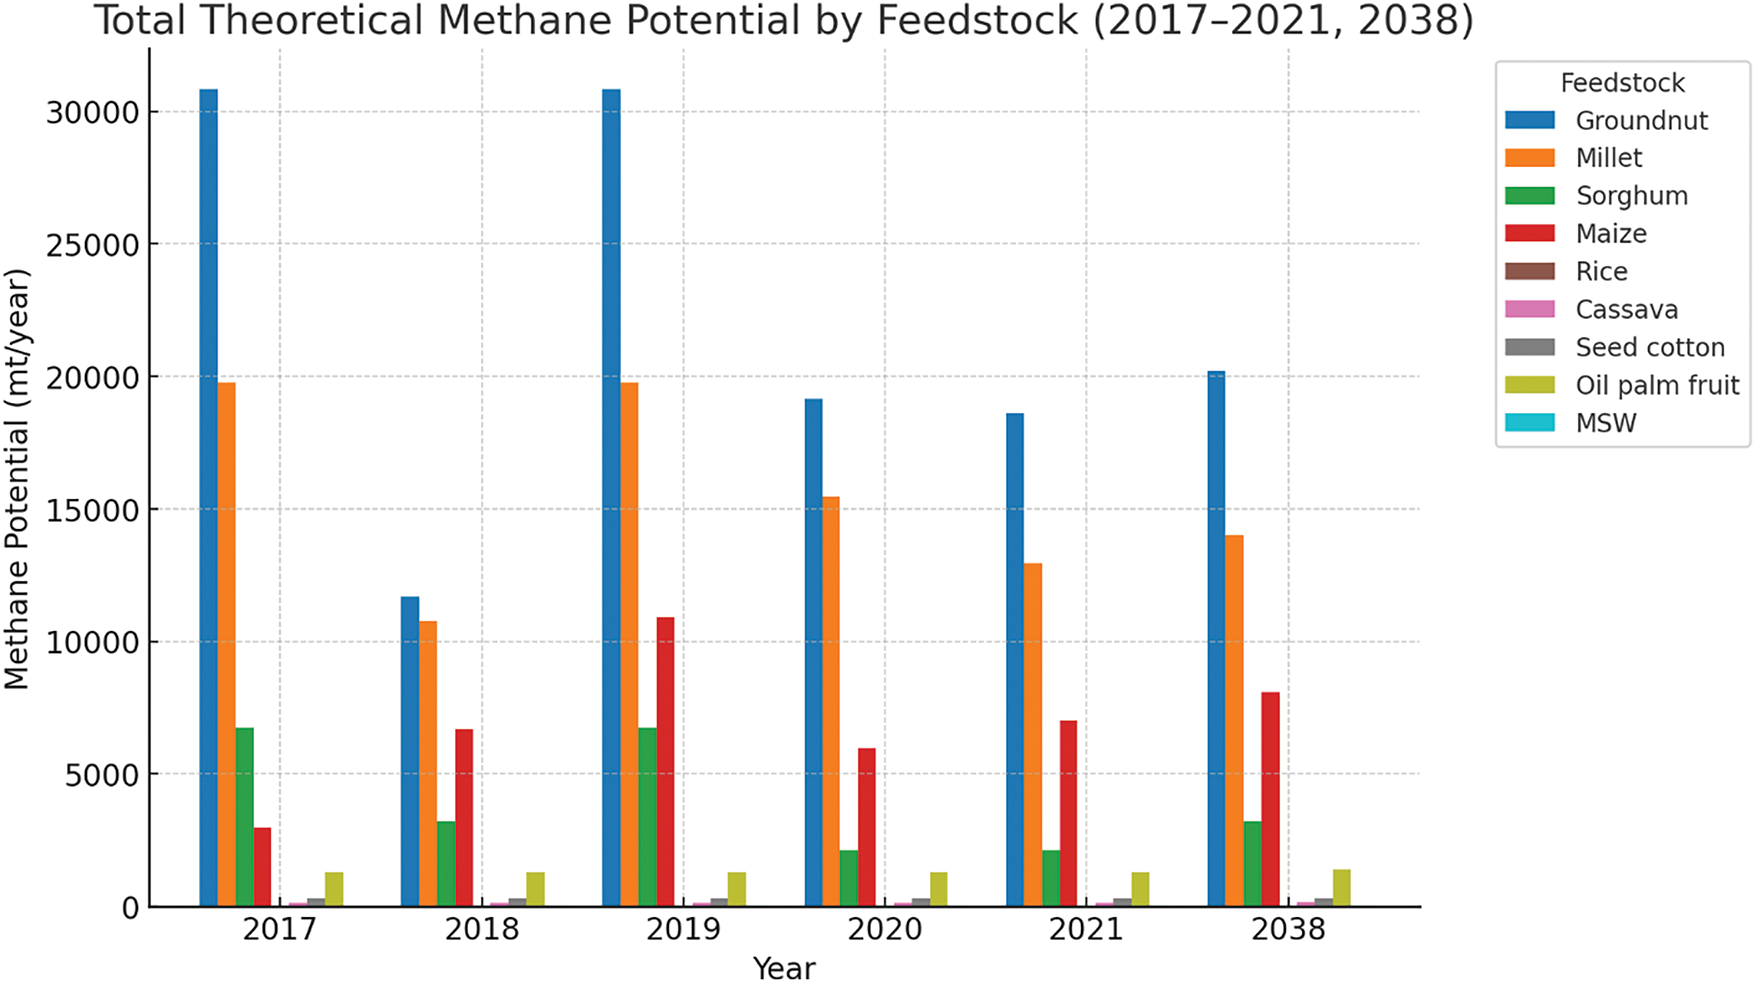
Figure 4: Total theoretical methane potential
The data spanning the years 2017 through 2021 indicate that groundnut residues, which possess the highest methane production potential, yielded the following annual methane generation figures: 30,836 mt/annum in 2017, 11,696.6 mt/annum in 2018, 30,836.6 mt/annum in 2019, 19,139.9 mt/annum in 2020, and 18,608.3 mt/annum in 2021. Moreover, the projected methane production for groundnuts in the year 2038 is estimated to be 20,203.3 mt/annum.
In stark contrast, the methane production levels derived from OFMSW further corroborate its relatively low potential when juxtaposed against crop residues. The respective methane production metrics for the years 2017, 2018, 2019, 2020, 2021, and the projection for 2038 are as follows: 22.1, 22.8, 23.4, 24.2, 24.9 and 43.5 mt/annum.
While crop residues alone demonstrate considerable potential for methane production, an optimal outcome would involve the synergistic integration of OFMSW with crop residues. The comprehensive total combined feedstock outputs for the years 2017, 2018, 2019, 2020, and 2021, and the projection for 2038 were recorded at: 62,102.7, 34,129.4, 70,039.9, 44,485.7, 42,492.7, and 47,455 mt/annum, respectively.
3.4 Theoretical and Technical Energy Potential
Similarly, to that of the methane potential, the results indicate that the residues from cash crops, specifically groundnuts, millet, sorghum, and maize, exhibit significantly higher energy production potentials from methane compared to those derived from subsistence crops. Furthermore, the analysis demonstrates that the organic fraction of municipal solid waste possesses the lowest theoretical energy potential among the evaluated materials. Data for energy production from groundnut residues, which were identified as having the highest potential among the studied residues, for the years 2017, 2018, 2019, 2020, 2021, and 2038 are reported as follows: 431,711.8, 163,752.8, 431,711.8, 267,959.1, 260,515.8, and 282,845.7 MWh, respectively. In contrast, energy generation from OFMSW consistently yields the lowest potential when compared to crop residues, with the following production levels recorded for the respective years: 309.8, 319.6, 328, 339.2, 349.4, and 609.4 MWh. While individual crop residues demonstrate a commendable potential for energy production, an optimal strategy would involve the synergistic combination of OFMSW and crop residues to enhance overall energy yield. The resulting totals for the combined feedstock for the years 2017, 2018, 2019, 2020, 2021, and 2038 were: 869,437.6, 477,811.1, 980,558.1, 622,799.2, 594,898.1, and 664,367.3 MWh, respectively.
As shown above in Fig. 5, the technical potential represented in orange proves that when all the feedstocks are summed up the actual achievable capacity for the country to produce electricity from the feedstocks for the years 2017, 2018, 2019, 2020, 2021, and 2038 were: 739,022, 406,139.5, 833,474.4, 529,379.3, 505,663.4, and 564,712.2 MWh.
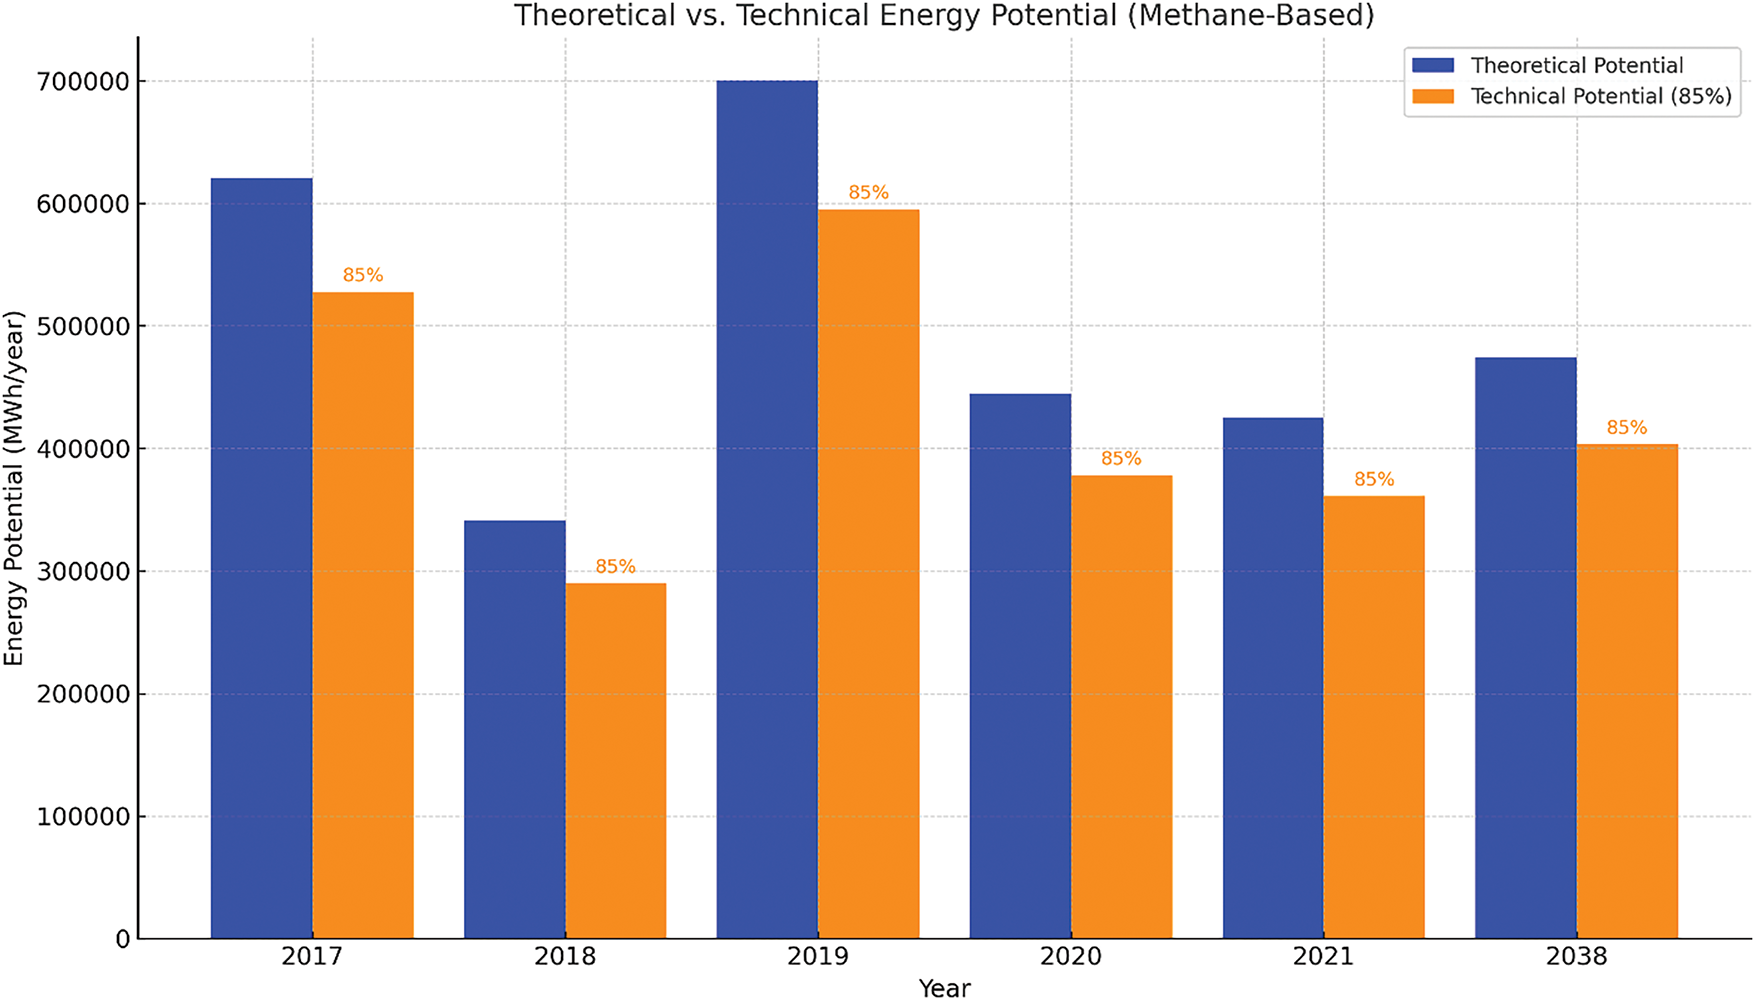
Figure 5: Total theoretical and technical potential
Based on the feedstocks analyzed for this research, the country could potentially implement a waste-to-energy plant with an actual achievable capacity of 64.5 MW for electricity generation.
3.5 Theoretical and Technical Hydrogen Production Potential
As seen in the results for methane and energy production potentials, the residues from the cash crops, namely groundnuts, millet, sorghum, and maize, have higher hydrogen production potentials as compared to the subsistence crops. It also shows that the organic fraction of municipal solid waste has the lowest theoretical hydrogen potential.
In the years 2017, 2018, 2019, 2020, 2021, and 2038, the results for hydrogen production from groundnut residues, which had the highest potential, were: 5,781,855.1, 2,193,117.4, 5,781,855.1, 3,588,737.6, 3,489,050.5, and 3,788,111.9 kmol.
In contrast, hydrogen produced from the OFMSW results showed that it has the lowest potential when compared to crop residue. Its results for years 2017, 2018, 2019, 2020, 2021, and 2038 were 4148.9, 4280.3, 4393, 4543.1, 4674.6, and 8161.1 kmol, respectively.
Although crop residues on their own have a good potential for energy production, a more desirable output would be combining the OFMSW and crop residues for production. The results of the total combined feedstock for the years 2017, 2018, 2019, 2020, 2021, and 2038 were 11,644,254, 6,399,256.1, 13,132,474.2, 841,060.2, 7,967,385.5, and 8,897,776.7 kmol, respectively.
Fig. 6 compares the results for the theoretical potential to those of the technical potential for hydrogen. Although the theoretical potential is more than the technical potential for each of the years, the country still has a good hydrogen production capacity based on the chosen feedstock for this research.
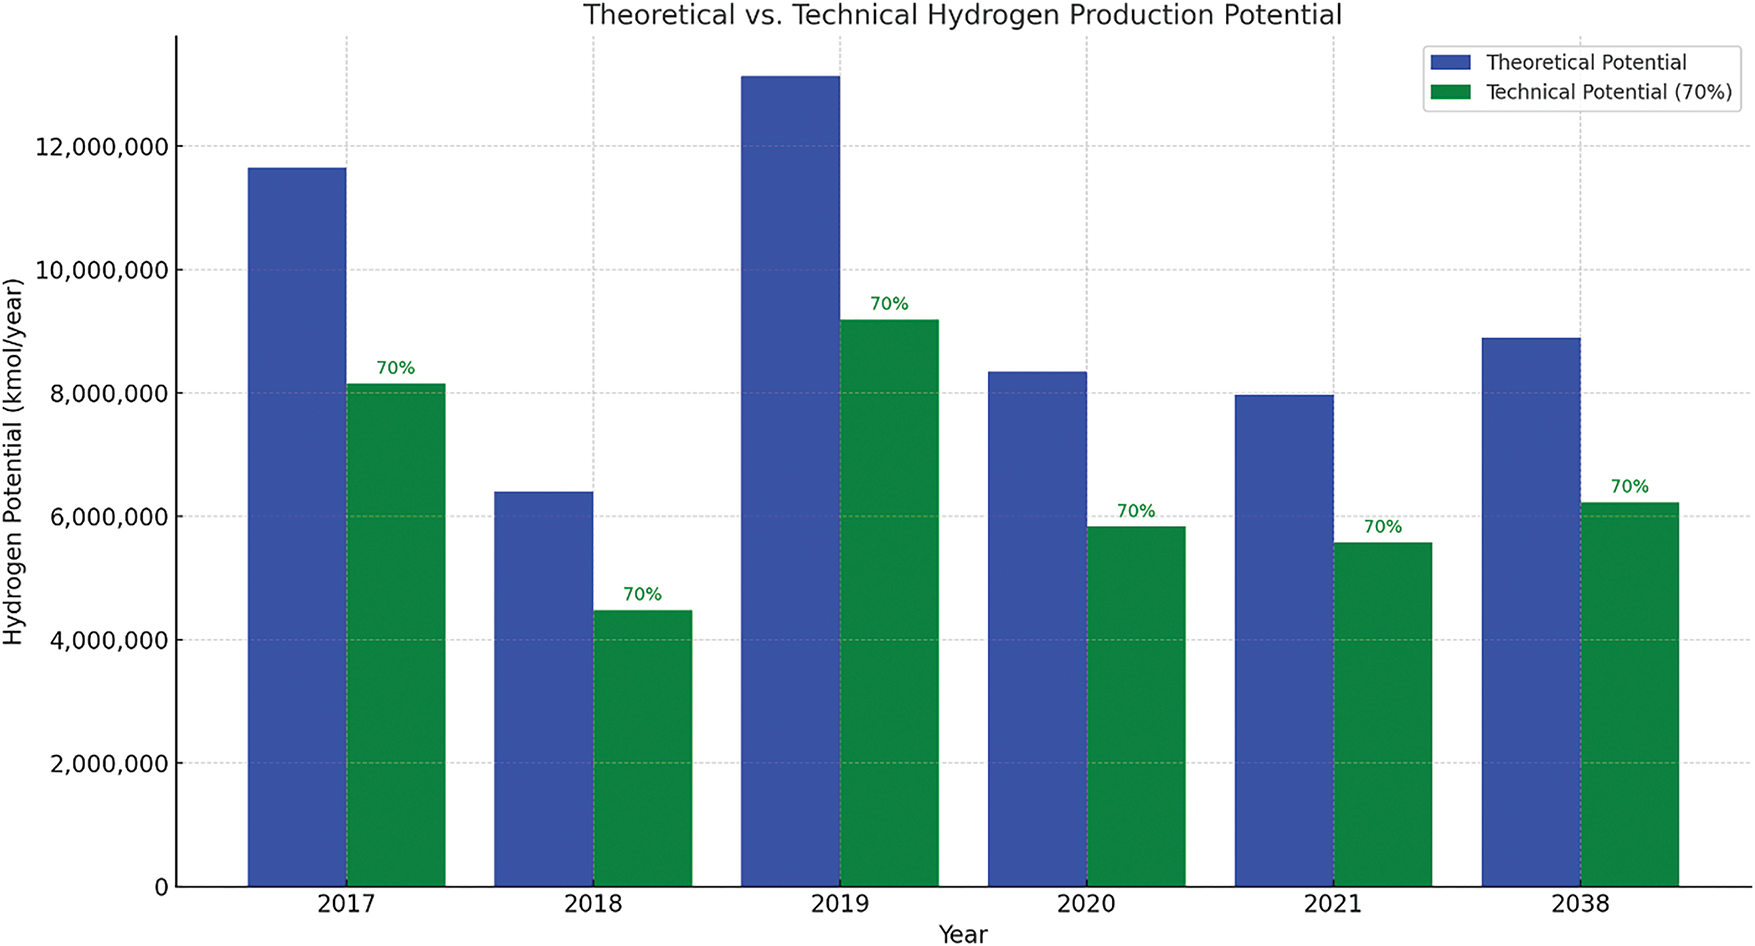
Figure 6: Total theoretical hydrogen production potential compared to technical potential
The technical hydrogen potential for the years 2017, 2018, 2019, 2020, 2021, and 2038 was 8,150,977.8, 4,479,479.3, 9,192,731.9, 5,838,742.2, 5,577,169.9, and 6,228,443.7 kmol, respectively.
3.6 Pilot Waste-to-Energy Plant Based on Technical Energy and Hydrogen Potential Results
Based on the results obtained from Figs. 5 and 6 clearly show that The Gambia has the potential to produce both electricity of 64.5 MW and hydrogen of 6,228,443.7 kmol from the organic fraction of municipal solid waste although based on the method of calculation used a potential pilot plant can choose to produce only electricity and later produce hydrogen based on the market demand and what the country needs at the time but not the two products at the time. Moreover, this will aid the country in achieving its 2050 long-term development goal of achieving 100% electrification. However, to fully utilize the country’s potential waste from livestock and aquatic life, the country should be investigated.
Considering the results and the above-mentioned factors, the country has a strong potential to produce methane, electricity, hydrogen, and other products if a pilot plant is implemented. This will aid the country in achieving its development goals by increasing the GDP and standard of living, and reducing migration, as it will open job opportunities both in rural and urban centers. Due to the country’s strategic location next to the Atlantic Ocean on its western borders, the export of other products, such as catalysts, to other countries can be easily achieved.
To select an ideal location for the pilot plant, the following factors were considered:
• The district that generates the highest amount of MSW is shown in Fig. 7: MSW potential across the eight districts for the year 2013 and potential location for the pilot plant.
• Former mining sites that are no longer operational, namely Kartong and Kachuma, shown in Fig. 8, could be used as a location to build the mining site. Mining sites were considered to avoid competition with fertile land that can be used for agriculture and urbanization as the country is still developing, mining sites in the country are also close to water bodies and are far from residential areas and factories making it an ideal location to avoid fire incidents and to increase methods of transportation of waste and products either by land or sea.
• The country’s Sandika market and the largest slaughterhouse in the country are also located in Brikama. This is also ideal as waste from the market and slaughterhouse can be easily transported to the potential site.
• Brikama has easy access to the River Gambia and the Banjul port. This could facilitate the trade of products between the two countries.
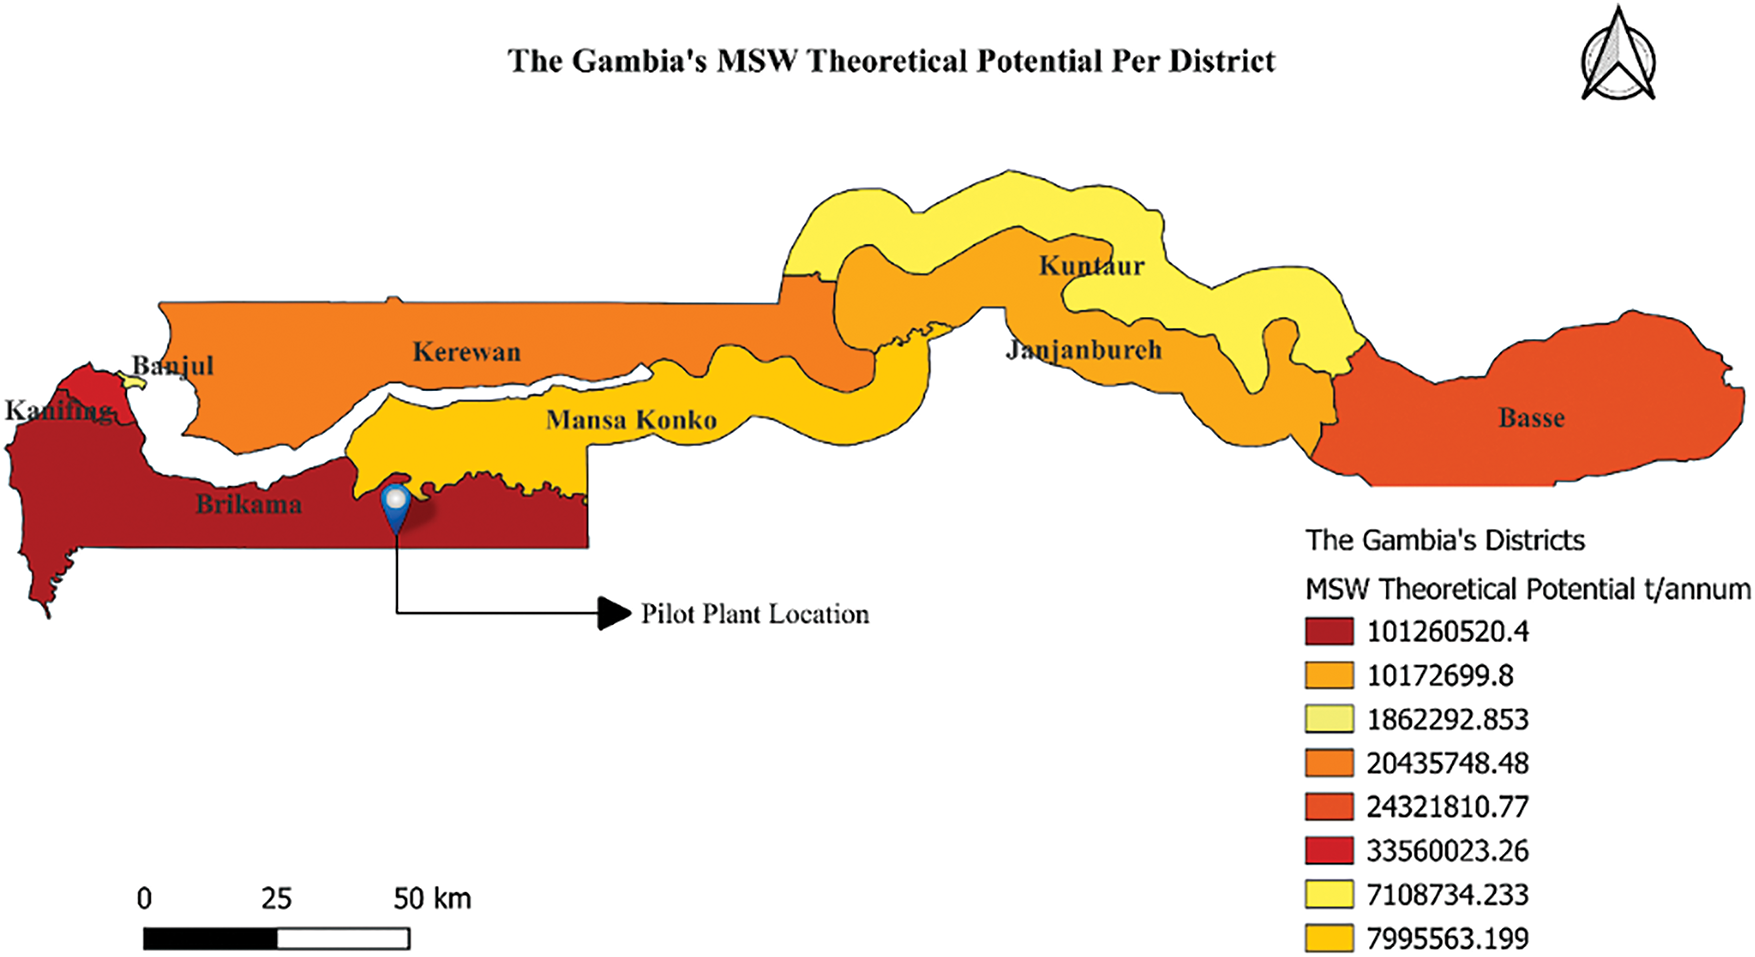
Figure 7: MSW potential across the eight districts for the year 2013 and potential location for the pilot plant (Reused with permission and modified after National Environment Agency 2014)
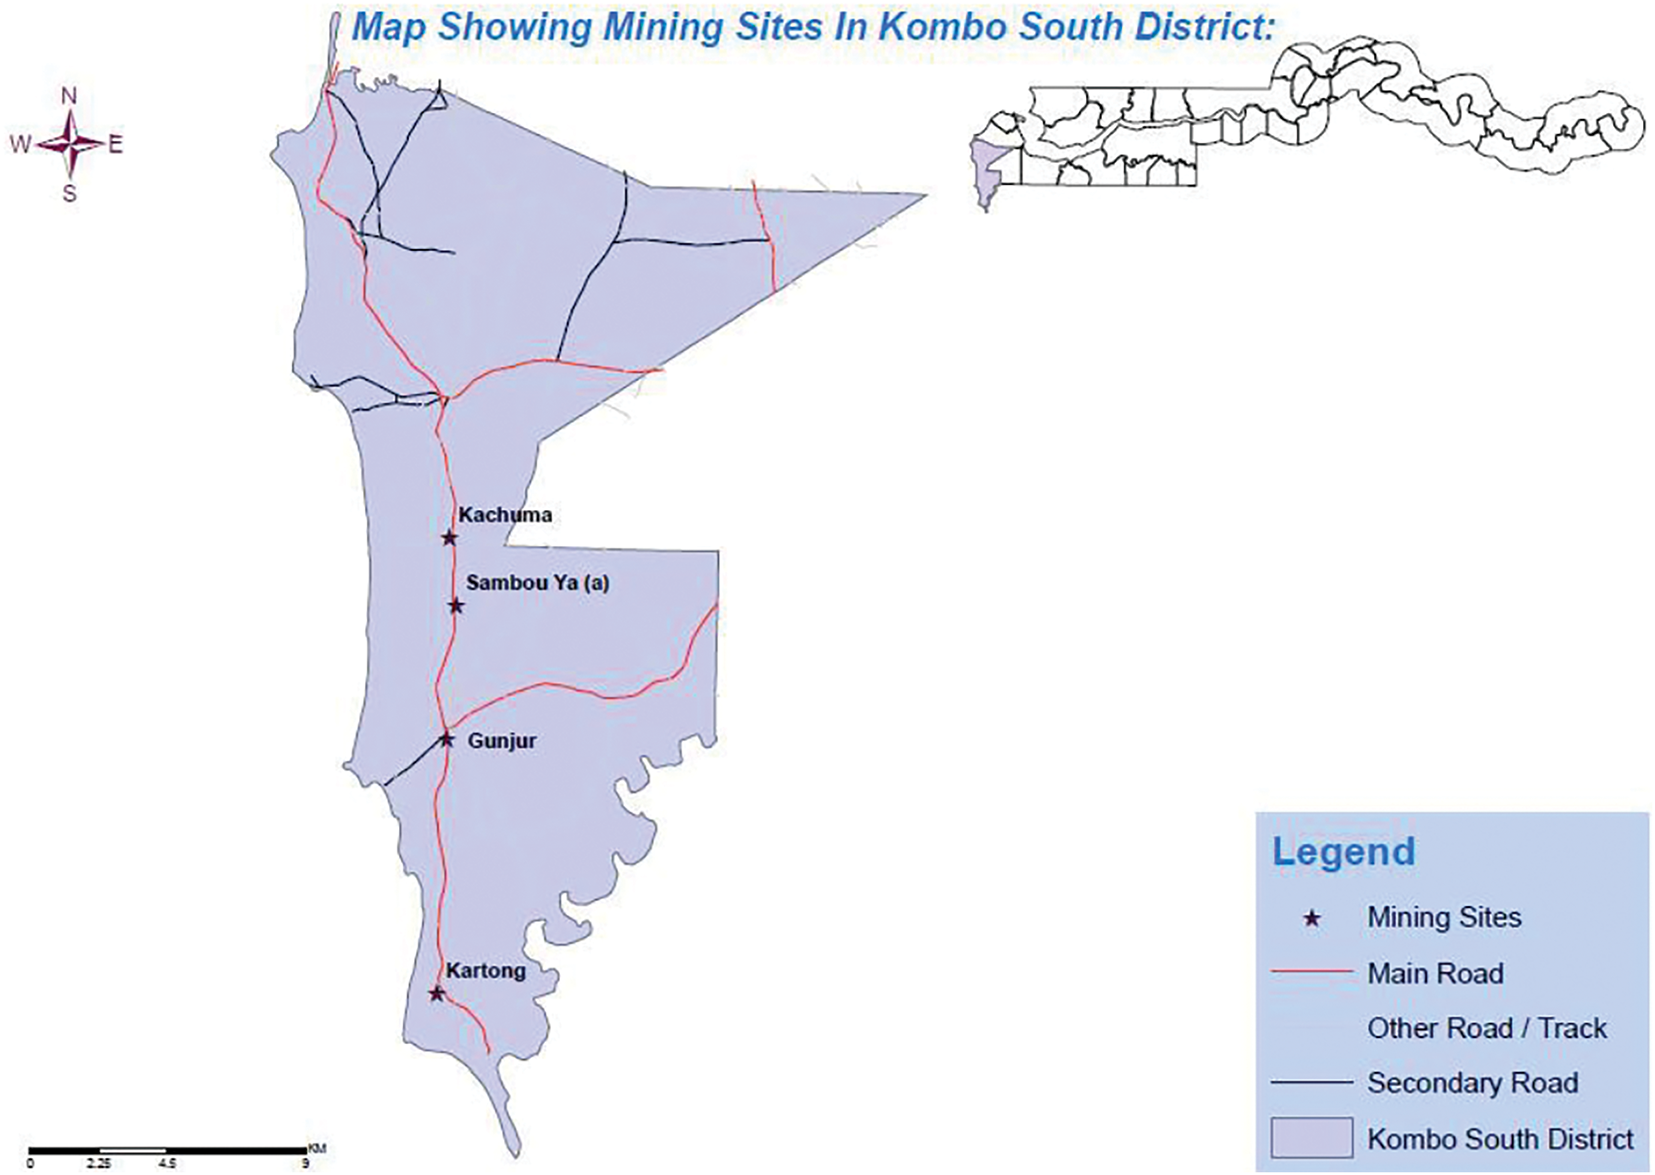
Figure 8: Mining sites in the Brikama district
Fig. 7 represents The Gambia’s eight districts, with the darkest color representing the area with the highest MSW generation. It also highlights the suggested location for a pilot plant.
MSW potential across the eight districts for the year 2013 and potential location for the pilot plant are explained in Table A9. The calculations shown in this table were unable to be conducted for the other years as demographic sensors for the districts haven’t been conducted since 2013.
3.7 Comparative Analysis of Hybrid Waste-to-Energy Systems in Africa
This study provides valuable insights into the potential of incorporating hybrid WTE technologies, including biohydrogen production, in The Gambia’s energy mix. When compared to similar studies in other African countries, such as Ghana, where WTE technologies have been assessed in the context of organic waste and biogas potential, the results of our study highlight the promising scalability of biohydrogen and bioenergy from waste. For instance, in Ghana, the estimated hydrogen yield from organic waste MSW through AD and steam methane reforming (SMR) processes can reach up to 40,000 GWh per year, with significant GHG emissions reductions (14,601 kt CO2e) [72]. In contrast, our findings suggest that The Gambia’s technical potential for hydrogen production is still in its early stages, yet comparable methodologies for hydrogen yield calculations show that waste-to-energy systems could offset a significant portion of fossil fuel use, providing substantial environmental benefits.
Technically, the potential of hybrid W2E systems in The Gambia aligns closely with national energy needs. The energy generation capacity from biogas and hydrogen in The Gambia has the potential to meet a significant portion of the country’s energy demand, as outlined in previous studies on waste-to-energy integration in other regions [73]. The assessment of WTE systems in Ghana demonstrated the feasibility of generating electricity and reducing GHG emissions while simultaneously promoting waste management and energy recovery [72]. This is crucial for countries like The Gambia, where energy access remains a challenge, and renewable energy systems, including bioenergy from waste, can provide both economic and environmental advantages. The results also show that the combination of solar power and waste-to-energy technologies can significantly boost the overall energy capacity, which is crucial for national energy security.
When compared to solar-only strategies, the feasibility of hybrid systems emerges as more promising for countries with high waste generation, like The Gambia and Ghana. The integration of W2E systems, especially those that combine anaerobic digestion with biohydrogen production, offers a more reliable and sustainable alternative than solar power alone. While solar energy plays an important role in reducing carbon emissions, its intermittent nature limits its ability to meet continuous energy demand. In contrast, waste-to-energy systems can provide both base-load power and the ability to generate clean fuels like hydrogen, which can be stored and transported. This hybrid approach is therefore not only technically feasible but also offers greater resilience and reliability in the face of fluctuating solar availability [72].
During this research, the following gaps were identified:
• Data on types and quantity of crops produced yearly and seasonally.
• Use of crop residue and disposal of unwanted residue.
• Geographic information system (GIS) location of gardens and land area planted on.
• Number of dumpsites and the quantity of municipal solid waste generated yearly.
• Composition of The Gambia’s municipal solid waste.
• Ultimate and proximate analysis of crops produced and municipal solid waste in The Gambia.
• The residue-to-crop ratio of crops produced in The Gambia.
These gaps were further categorized into three main gaps, which are as follows:
• No proper management and monitoring of crop residue and MSW.
• Lack of awareness of waste management and its energy value.
• Lack of systems and proper infrastructure for the conversion of waste to valuable goods and resources.
The primary objective of this research is to assess whether The Gambia has the potential to produce hydrogen and bioenergy sources from municipal solid waste and crop residues. The theoretical potential of the organic fraction of municipal solid waste and crop residues is calculated based on data from the years 2017 to 2021, as well as projections for 2038. These results are then utilized to estimate the production potential of biomethane and electricity using Buswell’s equation, from which, through stoichiometry, the potential for hydrogen production is determined via steam methane reforming. The technical potential for electricity and hydrogen is subsequently calculated using their respective conversion efficiencies.
To help the country achieve its 2050 energy development goals, the following recommendations should be implemented, beginning with the data collection strategy illustrated in Fig. 9. The proposed data collection strategy is designed for implementation within a timeframe of one to two years, contingent upon adherence to the following considerations:
Acquisition of Tools and Resources:
- Development and procurement of automated data collection software.
- The acquisition of necessary laboratory equipment and reagents to facilitate analysis.
- Recruitment of field personnel, laboratory technicians, data managers, and software developers. Engaging local-stakeholders, such as farmers and waste collectors, will enhance data accuracy and foster community acceptance.
- Procurement of tablets and computers to streamline data collection and management processes.
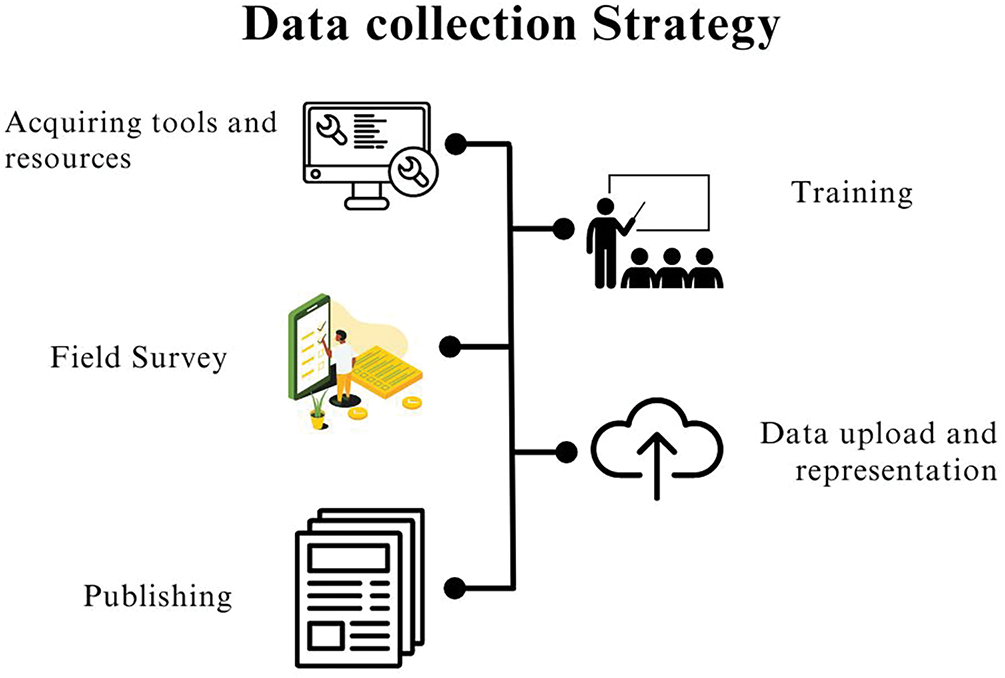
Figure 9: Automated data collection strategy illustration
Training Protocols:
- Comprehensive training programs for staff on the effective use of data collection tools and software.
- Targeted training for field personnel on conducting surveys in local languages to ensure cultural and contextual relevance.
Field Survey Implementation:
- Systematic data collection regarding the monthly harvest of various crops, including quantitative assessments of yield.
- Collection of representative samples for laboratory analysis.
Data Upload and Representation:
- Results from laboratory analyses will be systematically uploaded to a designated software platform.
- The uploaded data will then undergo analysis and interpretation, employing statistical methods and visual representations, including tables and graphs.
Publication of Findings:
- The analyzed data will be disseminated through the official website to ensure transparency and accessibility.
- Annual publications will be produced to document the research findings and analyses, contributing to the scientific community and informing stakeholders.
To effectively implement the data collection strategy, it is crucial to develop an awareness strategy that highlights the importance of adopting a waste-to-energy framework. This framework presents various benefits, such as reducing greenhouse gas emissions, strengthening the nation’s economic resilience, and enhancing energy security. By raising awareness and engaging relevant stakeholders, we can increase social acceptance of waste-to-energy initiatives, which will help facilitate their implementation across the country. The potential steps for the awareness strategy are outlined in Fig. 10.
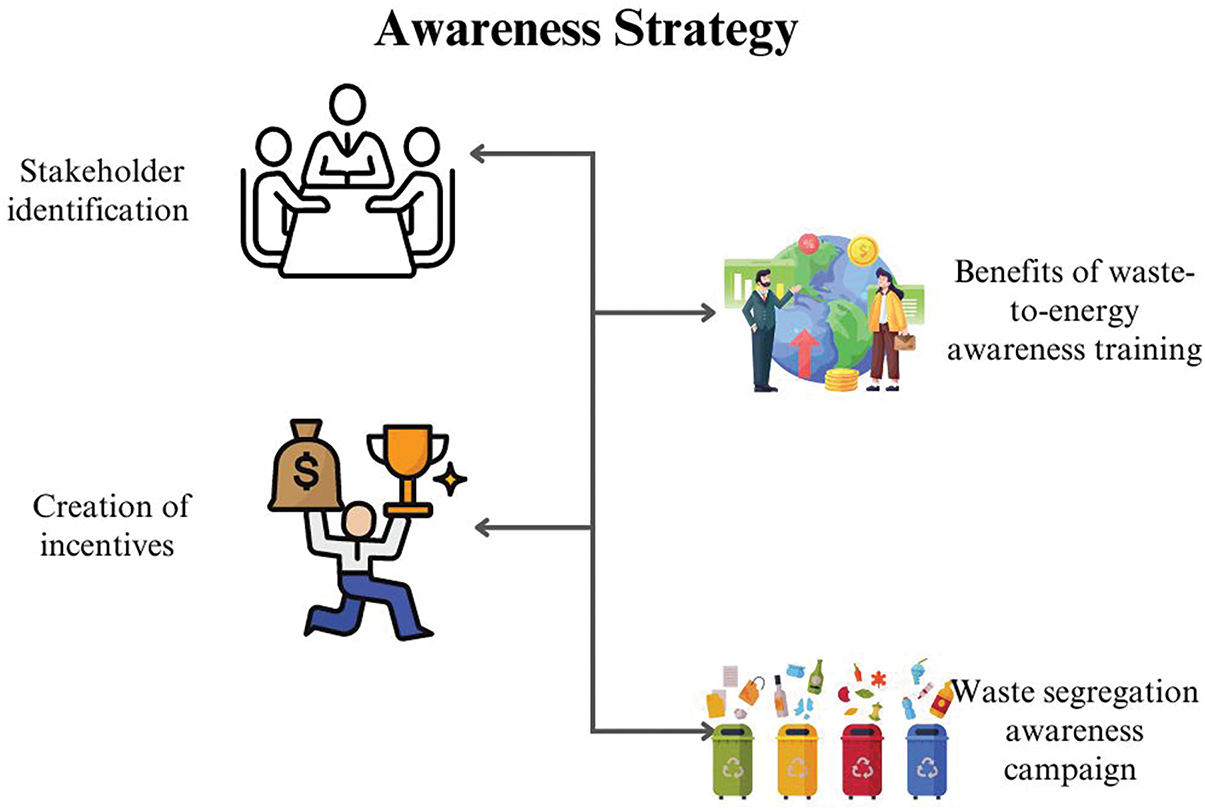
Figure 10: Awareness strategy illustration
The waste-to-energy strategy will be implemented in three distinct phases, each designed to enhance waste management and energy production as seen in Fig. 11.
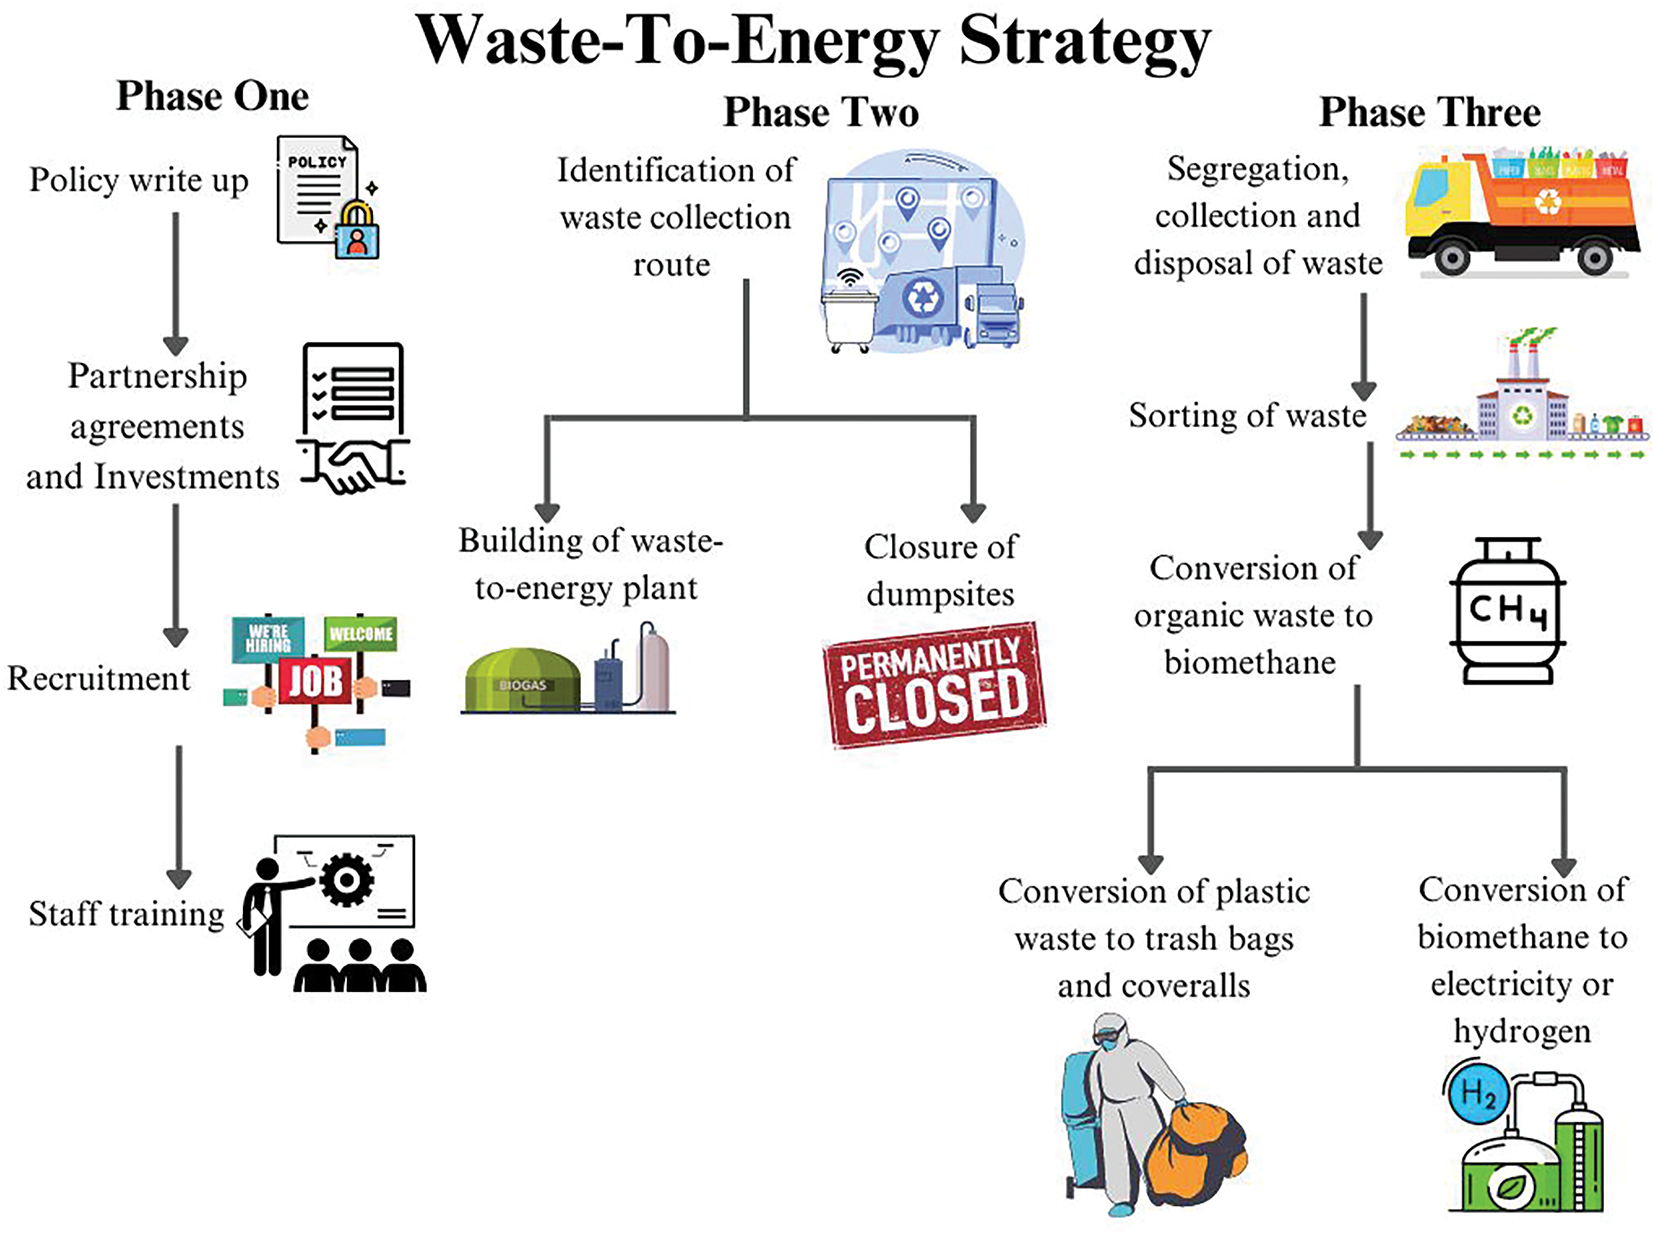
Figure 11: Three-phase waste-to-energy strategy illustration
Phase One will focus on establishing foundational partnerships and training initiatives. This includes forming partnerships through memoranda of understanding with private waste collection companies and governmental entities to streamline efforts. Farmers will receive training on effectively separating and storing crop residues, which will be used for energy generation and composting. Waste collectors will also undergo training to familiarize themselves with Geographic Information System (GIS) tools and equipment, improving the efficiency of waste transportation. Additionally, feasibility studies will be conducted for the proposed waste-to-energy plant, setting the stage for Phase Two.
Phase Two will utilize GIS technology to optimize waste collection routes, thereby enhancing operational efficiency. This phase will also concentrate on connecting the proposed plant to the electrical grid, ensuring that the generated energy is integrated into the larger system. Furthermore, strategies will be developed for distributing products generated from the waste-to-energy process. Essential resources, such as sweepers, waste collection trucks, and color-coded community bins for educational purposes, will be acquired to support effective waste management.
Phase Three will culminate in the generation of electricity that will be fed into the grid, marking a significant achievement in sustainable energy production. This phase will also explore innovative ways to handle plastic waste, converting it into valuable products like trash bags and gloves. The commercial viability of these products will be assessed to promote domestic sales, contributing to economic development and environmental sustainability.
Through these phases, the waste-to-energy strategy aims to promote a comprehensive approach to waste management, enhance energy production, and encourage community involvement in sustainability initiatives.
This study offers a comprehensive assessment of the potential for integrating alternative sustainable energy sources, specifically bioenergy and green hydrogen, into The Gambia’s energy mix. The investigation uniquely synthesizes the evaluation of agricultural crop residues and municipal solid waste for bioenergy production, providing novel insights into the utilization of these underexploited feedstocks to address the nation’s increasing energy demands.
In contrast to previous research, this study effectively bridges the gap between theoretical potential and practical implementation. It presents a detailed analysis of hydrogen yield and its implications for enhancing national energy security. The findings indicate that The Gambia harbors substantial untapped resources in the form of agricultural residues and waste materials, which can be converted into clean energy, including biohydrogen, thereby offering significant environmental benefits.
Furthermore, this research systematically compares the efficacy of a hybrid waste-to-energy approach with solar-exclusive strategies, highlighting the enhanced feasibility and resilience of hybrid systems in ensuring a reliable and continuous energy supply for the nation. By addressing the dual challenges of waste management and renewable energy generation, this study lays the groundwork for future policy initiatives and investments in waste-to-energy technologies.
Ultimately, the novelty of this research lies in its integrative approach to bioenergy, waste management, and green hydrogen production within the context of a low-income country. This work presents a scalable model for sustainable energy development that can be applied to similar regions worldwide.
Acknowledgement: The authors wish to extend their sincere gratitude to the Ministries of Agriculture, Environment, and Energy of the Gambia, as well as the municipal offices, for providing essential country-specific data that significantly contributed to the enhancement of this research. Additionally, the authors would like to acknowledge the University of Rostock and the University of Lomé for their invaluable administrative and technical support throughout the duration of this research project.
Funding Statement: This research was supported by the IMP-EGH Project (Project Number 03SF0626D), funded by the Federal Ministry of Education and Research, Germany (BMBF). The funding was provided in the form of a scholarship to the first author through WASCAL (West African Service Centre on Climate Change and Adapted Land Use). The authors gratefully acknowledge this support, which made it possible to undertake this research.
Author Contributions: The authors confirm their contribution to the paper as follows: Study conception and design: Fatou Balleh Jobe, Satyanarayana Narra. Data collection: Fatou Balleh Jobe. Analysis and interpretation of results: Fatou Balleh Jobe, Satyanarayana Narra, Vidhi Singh, Komi Agboka. Draft manuscript preparation: Fatou Balleh Jobe, Satyanarayana Narra, Vidhi Singh, Komi Agboka. All authors reviewed the results and approved the final version of the manuscript.
Availability of Data and Materials: The authors confirm that the data supporting the findings of this study are available within the article and its supplementary materials.
Ethics Approval: Not applicable, this study did not involve any human or animal subjects.
Conflicts of Interest: The authors declare no conflicts of interest to report regarding the present study.
Abbreviations
| MSW | Municipal solid waste |
| OFMSW | Organic fraction of municipal solid waste |
| AD | Anaerobic digestion |
| RPR | Residue-to-product ratio |
| WTE | Waste-to-Energy |
| GDP | Gross Domestic Product |
| GHG | Greenhouse Gas |
| IPP | Independent Power Producers |
| NAMA | Nationally Appropriate Mitigation Action |
| CH4 | Methane |
| CO | Carbon monoxide |
| CO2 | Carbon dioxide |
| GgCO2e | Gigagrams of Carbon dioxide equivalent |
| STP | Standard Temperature and Pressure |
Appendix A
References
1. Ajayi OO. Sustainable energy development and environmental protection: implication for selected states in West Africa. Renew Sustain Energy Rev. 2013;26(1):532–9. doi:10.1016/j.rser.2013.06.009. [Google Scholar] [CrossRef]
2. Kane, Michael. Kenya–Kabira Waste-To-Energy—SEFA Project Summary Note. Africa Development Bank. Reference N°: G-KEFZ0-PRE-002; 2021. [cited 2025 May 15]. Available from: https://www.afdb.org/en/documents/kenya-kabira-waste-energy-sefa-project-summary-note2017. [Google Scholar]
3. Africa Energy Portal. GHANA: a plant converts waste into electricity and fertilizer in Gyankobaa; 2022. [cited 2025 Jan 26]. Available from: https://www.afrik21.africa/en/ghana-a-plant-converts-waste-into-electricity-and-fertilizer-in-gyankobaa/. [Google Scholar]
4. The Gambia renewables readiness assessment 2013; 2013. [Online]. [cited 2025 May 15]. Available from: www.irena.org/rra. [Google Scholar]
5. The World Bank. The World Bank in The Gambia through IDA, the World Bank supports projects in basic education, energy, public resources management and agriculture; 2023. [cited 2025 May 15]. Available from: https://www.worldbank.org/en/country/gambia/overview. [Google Scholar]
6. Republic of The Gambia. The Gambia 2050 Climate Vision. The Gambia : Ministry of Environment, Climate Change and Natural Resourceschrome-extension. 2021. [cited 2025 May 15]. Available from: https://cdn.climatepolicyradar.org/navigator/GMB/2021/the-gambia-2050-climate-vision_f5efe2396680a7bee728aeea67455bf7.pdf. [Google Scholar]
7. MCCNR. Second nationally determined contribution of the gambia; 2021; The Gambia : Ministry of Environment, Climate Change and Natural Resourceschrome-extension. p. 1–35. [cited 2025 May 15]. Available from: https://unfccc.int/sites/default/files/NDC/2022-06/Second%20NDC%20of%20The%20Republic%20of%20The%20Gambia-16-12-2021.pdf. [Google Scholar]
8. Change C, Resources N. Government of the gambia ministry of environment, climate change and natural resources. In: The Gambia’s Long-Term Climate-Neutral Development Strategy 2050; 2022. p. 1–84. [cited 2025 May 15]. Available from: https://unfccc.int/sites/default/files/resource/Long_Term_Climate_Change_Strategy_of_The_Gambia_Final.pdf. [Google Scholar]
9. Hameed Z, Aslam M, Khan Z, Maqsood K, Atabani AE, Ghauri M, et al. Gasification of municipal solid waste blends with biomass for energy production and resources recovery: current status, hybrid technologies and innovative prospects. Renew Sustain Energy Rev. 2021;136:110375. doi:10.1016/j.rser.2020.110375. [Google Scholar] [CrossRef]
10. Zamri MFMA, Hasmady S, Akhiar A, Ideris F, Shamsuddin AH, Mofijur M, et al. A comprehensive review on anaerobic digestion of organic fraction of municipal solid waste. Renew Sustain Energy Rev. 2021;137:110637. doi:10.1016/j.rser.2020.110637. [Google Scholar] [CrossRef]
11. National Environment Agency The Gambia. The mapping and documentation of dumpsites that cause, or have potential to cause flooding (Unpublished report, National Environment Agency); 2014. [cited 2025 May 15]. Available from: https://www.zef.de/uploads/tx_zefnews/zef_wp_150.pdf. [Google Scholar]
12. Government of The Gambia Ministry of Environment. Climate change and natural resources; 2022 [Online]. [cited 2025 May 15]. Available from: https://gisgeography.com/gambia-map/. [Google Scholar]
13. Velmozhina KA, Politaeva NA, Ilin IV, Shinkevich PS. Review of modern strategies for the development of hydrogen bioenergy as key areas for achieving sustainable development goals. Int J Hydrog Energy. 2024;70:729–36. doi:10.1016/j.ijhydene.2024.05.123. [Google Scholar] [CrossRef]
14. Hassan Q, Hafedh SA, Mohammed HB, Abdulrahman IS, Salman HM, Jaszczur M. A review of hydrogen production from bio-energy, technologies and assessments. Energy Harvest Syst. 2024;11(1):20220117. doi:10.1515/ehs-2022-0117. [Google Scholar] [CrossRef]
15. Squadrito G, Maggio G, Nicita A. The green hydrogen revolution. Renew Energy. 2023;216(6):119041. doi:10.1016/j.renene.2023.119041. [Google Scholar] [CrossRef]
16. Łukajtis R, Hołowacz I, Kucharska K, Glinka M, Rybarczyk P, Przyjazny A, et al. Hydrogen production from biomass using dark fermentation. Renew Sustain Energy Rev. 2018;91:665–94. doi:10.1016/j.rser.2018.04.043. [Google Scholar] [CrossRef]
17. Schievano A, Sciarria TP, Gao YC, Scaglia B, Salati S, Zanardo M, et al. Dark fermentation, anaerobic digestion and microbial fuel cells: an integrated system to valorize swine manure and rice bran. Waste Manag. 2016;56(7):519–29. doi:10.1016/j.wasman.2016.07.001. [Google Scholar] [PubMed] [CrossRef]
18. Ahmed SF, Rafa N, Mofijur M, Badruddin IA, Inayat A, Ali MS, et al. Biohydrogen production from biomass sources: metabolic pathways and economic analysis. Front Energy Res. 2021;9:753878. doi:10.3389/fenrg.2021.753878. [Google Scholar] [CrossRef]
19. Kumar R, Kumar A, Pal A. Hydrogen production from biogas: methods and economic analysis. Res Sq; 2021 Jun 08. doi:10.21203/rs.3.rs-457836/v1. [Google Scholar] [CrossRef]
20. Wu Y, Wang H, Li H, Han X, Zhang M, Sun Y, et al. Applications of catalysts in thermochemical conversion of biomass (pyrolysis, hydrothermal liquefaction and gasificationa critical review. Renew Energy. 2022;196:462–81. doi:10.1016/j.renene.2022.07.031. [Google Scholar] [CrossRef]
21. Rathod N, Jain S, Patel MR. Thermodynamic analysis of biochar produced from groundnut shell through slow pyrolysis. Energy Nexus. 2023;9:100177. doi:10.1016/j.nexus.2023.100177. [Google Scholar] [CrossRef]
22. Cruz G, da Luz Pereira Rodrigues A, da Silva DF, Gomes WC. Physical-chemical characterization and thermal behavior of cassava harvest waste for application in thermochemical processes. J Therm Anal Calorim. 2021;143(5):3611–22. doi:10.1007/s10973-020-09330-6. [Google Scholar] [CrossRef]
23. Fonseca J, Albis A, Montenegro AR. Evaluation of zinc adsorption using cassava peels (Manihot esculenta) modified with citric acid. Contemp Eng Sci. 2018;11(72):3575–85. doi:10.12988/ces.2018.87364. [Google Scholar] [CrossRef]
24. Sulaiman MA, Adetifa BO, Adekomaya SO, Lawal NS, Adama OO. Experimental characterization of maize cob and stalk based pellets for energy use. Eng J. 2019;23(6):117–28. doi:10.4186/ej.2019.23.6.117. [Google Scholar] [CrossRef]
25. Ayamga EA, Kemausuor F, Addo A. Technical analysis of crop residue biomass energy in an agricultural region of Ghana. Resour Conserv Recycl. 2015;96(5):51–60. doi:10.1016/j.resconrec.2015.01.007. [Google Scholar] [CrossRef]
26. Addae G, Oduro-Kwarteng S, Fei-Baffoe B, Rockson MAD, Ribeiro JXF, Antwi E. Market waste composition analysis and resource recovery potential in Kumasi, Ghana. J Air Waste Manag Assoc. 2021;71(12):1529–44. doi:10.1080/10962247.2021.1969296. [Google Scholar] [PubMed] [CrossRef]
27. Banks CJ, Heaven S, Zhang Y, Baier U. Food waste digestion: anaerobic digestion of food waste for a circular economy. In: Murphy JD, editor. IEA bioenergy task. Paris, France: International Energy Agency; 2018. [Google Scholar]
28. Aragon-Briceño C, Pożarlik A, Bramer E, Brem G, Wang S, Wen Y, et al. Integration of hydrothermal carbonization treatment for water and energy recovery from organic fraction of municipal solid waste digestate. Renew Energy. 2022;184(1):577–91. doi:10.1016/j.renene.2021.11.106. [Google Scholar] [CrossRef]
29. Shahhosseini HR, Iranshahi D, Saeidi S, Pourazadi E, Klemeš JJ. Multi-objective optimisation of steam methane reforming considering stoichiometric ratio indicator for methanol production. J Clean Prod. 2018;180(4):655–65. doi:10.1016/j.jclepro.2017.12.201. [Google Scholar] [CrossRef]
30. Yokota O. Stoichiometric consideration of steam reforming of methane on Ni/Al2O3 catalyst at 650°C by using a solar furnace simulator. Int J Hydrog Energy. 2000;25(1):81–6. doi:10.1016/s0360-3199(99)00011-7. [Google Scholar] [CrossRef]
31. Ceesay EK, Francis PC, Jawneh S, Njie M, Belford C, Fanneh MM. Climate change, growth in agriculture value-added, food availability and economic growth nexus in the Gambia: a Granger causality and ARDL modeling approach. SN Bus Econ. 2021;1(7):100. doi:10.1007/s43546-021-00100-6. [Google Scholar] [CrossRef]
32. Adhikari S, Nam H, Chakraborty JP. Conversion of solid wastes to fuels and chemicals through pyrolysis. In: Waste biorefinery. Amsterdam: Elsevier; 2018. p. 239–63. doi:10.1016/b978-0-444-63992-9.00008-2. [Google Scholar] [CrossRef]
33. Panthapulakkal S, Sain M. The use of wheat straw fibres as reinforcements in composites. In: Biofiber reinforcements in composite materials. Amsterdam: Elsevier; 2015. p. 423–53. doi:10.1533/9781782421276.4.423. [Google Scholar] [CrossRef]
34. FAO. FAOSTAT; 2023. [cited 2025 May 15]. Available from: https://www.fao.org/faostat/en/#data/QCL. [Google Scholar]
35. Kemausuor F, Kamp A, Thomsen ST, Bensah EC, Østergård H. Assessment of biomass residue availability and bioenergy yields in Ghana. Resour Conserv Recycl. 2014;86(3):28–37. doi:10.1016/j.resconrec.2014.01.007. [Google Scholar] [CrossRef]
36. Seglah PA, Wang Y, Wang H, Bi Y. Estimation and efficient utilization of straw resources in Ghana. Sustainability. 2019;11(15):4172. doi:10.3390/su11154172. [Google Scholar] [CrossRef]
37. Simonyan KJ, Fasina O. Biomass resources and bioenergy potentials in Nigeria. Afr J Agric Res. 2013;8(40):4975–89. doi:10.5897/AJAR2013.6726. [Google Scholar] [CrossRef]
38. Halder PK, Paul N, Beg MRA. Assessment of biomass energy resources and related technologies practice in Bangladesh. Renew Sustain Energy Rev. 2014;39(1):444–60. doi:10.1016/j.rser.2014.07.071. [Google Scholar] [CrossRef]
39. Sanneh ES, Hu AH, Chang YM, Sanyang E. Introduction of a recycling system for sustainable municipal solid waste management: a case study on the greater Banjul area of the Gambia. Environ Dev Sustain. 2011;13(6):1065–80. doi:10.1007/s10668-011-9305-9. [Google Scholar] [CrossRef]
40. Aryal S. Rainfall and water requirement of rice during growing period. J Agric Environ. 2013;13:1–4. doi:10.3126/aej.v13i0.7576. [Google Scholar] [CrossRef]
41. Atique-ur-Rehman, Sarwar N, Ahmad S, Khan MA, Hasanuzzaman M. World rice production: an overview. In: Modern techniques of rice crop production. Singapore: Springer Singapore; 2022. p. 3–12. doi:10.1007/978-981-16-4955-4_1. [Google Scholar] [CrossRef]
42. Pickson RB, He G, Boateng E. Impacts of climate change on rice production: evidence from 30 Chinese provinces. Environ Dev Sustain. 2022;24(3):3907–25. doi:10.1007/s10668-021-01594-8. [Google Scholar] [CrossRef]
43. Maize production Jéan du Plessis Department: Agriculture republic of South Africa. [Online]. [cited 2025 May 15]. Available from: https://www.arc.agric.za/arc-gci/fact%20sheets%20library/maize%20production.pdf. [Google Scholar]
44. Department of Agriculture, Forestry and Fisheries, Cassava Production Guideline, Pretoria, South Africa. [Online]. [cited 2025 May 20]. Available from: https://www.dalrrd.gov.za/phocadownloadpap/Brochures_and_Production_Guidelines/Production%20Guidelines%20%20Cassava.pdf. [Google Scholar]
45. Cilliers AJ. Groundnut production a concise guide, ARC grain crops institute, Potchefstroom, South Africa. [Online]. [cited 2025 May 20]. Available from: https://www.arc.agric.za/arc-gci/Fact%20Sheets%20Library/Groundnut%20Production.pdf. [Google Scholar]
46. Chapke RR, Prasad GS, Das IK, Hariprasanna K, Singode A, Kanthi Sri BS, et al. Latest millet production and processing technologies. Hyderabad, India: ICAR-Indian Institute of Millets Research; 2020. Booklet No: 11/2019-20. [Google Scholar]
47. Unjan R, Nissapa A, Chiarawipa R. Climatic considerations which support the choice between natural rubber and oil palm in Nakhon Si Thammarat, southern Thailand. Kasetsart J Soc Sci. 2017;38(3):273–81. doi:10.1016/j.kjss.2016.07.006. [Google Scholar] [CrossRef]
48. Terefe G, Berehe M, Azanaw A, Gebriel HW. Gebriel, sorghum production training manual. Gondar, Ethiopia: BENEFIT–SBN; 2017 Aug. [Google Scholar]
49. Dai J, Kong X, Zhang D, Li W, Dong H. Technologies and theoretical basis of light and simplified cotton cultivation in China. Field Crops Res. 2017;214(1):142–8. doi:10.1016/j.fcr.2017.09.005. [Google Scholar] [CrossRef]
50. Kaniapan S, Pasupuleti J, Patma Nesan K, Abubackar HN, Umar HA, Oladosu TL, et al. A review of the sustainable utilization of rice residues for bioenergy conversion using different valorization techniques, their challenges, and techno-economic assessment. Int J Environ Res Public Health. 2022;19(6):3427. doi:10.3390/ijerph19063427. [Google Scholar] [PubMed] [CrossRef]
51. Biswas B, Pandey N, Bisht Y, Singh R, Kumar J, Bhaskar T. Pyrolysis of agricultural biomass residues: comparative study of corn cob, wheat straw, rice straw and rice husk. Bioresour Technol. 2017;237(1):57–63. doi:10.1016/j.biortech.2017.02.046. [Google Scholar] [PubMed] [CrossRef]
52. Efomah AN, Gbabo A. The Physical, proximate and ultimate analysis of rice husk briquettes produced from a vibratory block mould briquetting machine. Int J Innovat Sci, Eng Technol. 2015;2(5):814–22. [Google Scholar]
53. Nilson. Physical properties of corn residues. Am J Biochem Biotechnol. 2012;8(2):44–53. doi:10.3844/ajbbsp.2012.44.53. [Google Scholar] [CrossRef]
54. Waheed MA, Akogun OA, Enweremadu CC. Influence of feedstock mixtures on the fuel characteristics of blended cornhusk, cassava peels, and sawdust briquettes. Biomass Convers Biorefin. 2023;13(17):16211–26. doi:10.1007/s13399-023-04039-6. [Google Scholar] [CrossRef]
55. Anukam AI, Goso BP, Okoh OO, Mamphweli SN. Studies on characterization of corn cob for application in a gasification process for energy production. J Chem. 2017;2017(8):6478389. doi:10.1155/2017/6478389. [Google Scholar] [CrossRef]
56. Danish M, Naqvi M, Farooq U, Naqvi S. Characterization of south Asian agricultural residues for potential utilization in future ‘energy mix’. Energy Proc. 2015;75(1):2974–80. doi:10.1016/j.egypro.2015.07.604. [Google Scholar] [CrossRef]
57. Pattiya A, Suttibak S. Production of bio-oil via fast pyrolysis of agricultural residues from cassava plantations in a fluidised-bed reactor with a hot vapour filtration unit. J Anal Appl Pyrolysis. 2012;95:227–35. doi:10.1016/j.jaap.2012.02.010. [Google Scholar] [CrossRef]
58. Murugan PC, Navaneethakrishnan P, Joseph Sekhar S. An experimental investigation on utilizing cassava stalk as biomass sources in a gasifier. IOP Conf Ser: Mater Sci Eng. 2021;1057(1):012040. doi:10.1088/1757-899x/1057/1/012040. [Google Scholar] [CrossRef]
59. Getnet Alebel M, Urge M, Assefa G, Worku B, Abebe A. The effect of using either soybean or groundnut straw as part of basal diet on body weight gain, and carcass characteristics of Gumuz Sheep. Int J Livestock Product. 2019;10(3):70–6. doi:10.5897/IJLP2018.0549. [Google Scholar] [CrossRef]
60. Tian Y, Wang F, Djandja JO, Zhang SL, Xu YP, Duan PG. Hydrothermal liquefaction of crop straws: effect of feedstock composition. Fuel. 2020;265:116946. doi:10.1016/j.fuel.2019.116946. [Google Scholar] [CrossRef]
61. Ouiminga SK, Rogaume T, Daho T, Richard F, Koulidiati J. Thermal degradation of polyethylene bags and millet stalks: influence of the temperature and the local concentration of oxygen on the conversion rate of carbon. Adv Chem Eng Sci. 2012;2(1):155–65. doi:10.4236/aces.2012.21019. [Google Scholar] [CrossRef]
62. Ajikashile JO, Alhnidi MJ, Parku GK, Funke A, Kruse A. A study on the fast pyrolysis of millet and sorghum straws sourced from arid and semi-arid regions of Nigeria in a twin-screw mixing reactor. Mater Sci Energy Technol. 2023;6:388–98. doi:10.1016/j.mset.2023.03.007. [Google Scholar] [CrossRef]
63. Ninduangdee P, Kuprianov VI, Cha EY, Kaewrath R, Youngyuen P, Atthawethworawuth W. Thermogravimetric studies of oil palm empty fruit bunch and palm kernel shell: TG/DTG analysis and modeling. Energy Proc. 2015;79:453–8. doi:10.1016/j.egypro.2015.11.518. [Google Scholar] [CrossRef]
64. Onochie UP, Obanor AI, Sa A, Igbodaro OO. Proximate and ultimate analysis of fuel pellets from oil palm residues. Nig J Tech. 2017;36(3):987–90. doi:10.4314/njt.v36i3.44. [Google Scholar] [CrossRef]
65. Yahayu M, Abas FZ, Zulkifli SE, Ani FN. Utilization of oil palm fiber and palm kernel shell in various applications. Singapore: Springer Singapore; 2018. doi:10.1007/978-981-10-5062-6_4. [Google Scholar] [CrossRef]
66. Mehrvarz E, Ghoreyshi AA, Jahanshahi M. Adsorptive separation of CO2 and CH4 by the broom sorghum based activated carbon functionalized by diethanolamine. Korean J Chem Eng. 2017;34(2):413–24. doi:10.1007/s11814-016-0268-2. [Google Scholar] [CrossRef]
67. Adl M, Sheng K, Gharibi A. Technical assessment of bioenergy recovery from cotton stalks through anaerobic digestion process and the effects of inexpensive pre-treatments. Appl Energy. 2012;93(20):251–60. doi:10.1016/j.apenergy.2011.11.065. [Google Scholar] [CrossRef]
68. Al Afif R, Pfeifer C, Pröll T. Bioenergy recovery from cotton stalk. [Online]. [cited 2025 May 15]. Available from: www.intechopen.com. [Google Scholar]
69. Yong ZJ, Bashir MJK, Hassan MS. Biogas and biofertilizer production from organic fraction municipal solid waste for sustainable circular economy and environmental protection in Malaysia. Sci Total Environ. 2021;776(1):145961. doi:10.1016/j.scitotenv.2021.145961. [Google Scholar] [PubMed] [CrossRef]
70. La Picirelli de Souza L, Rajabi Hamedani S, Silva Lora EE, Escobar Palacio JC, Comodi G, Villarini M, et al. Theoretical and technical assessment of agroforestry residue potential for electricity generation in Brazil towards 2050. Energy Rep. 2021;7:2574–87. doi:10.1016/j.egyr.2021.04.026. [Google Scholar] [CrossRef]
71. de Souza SN, Horttanainen M, Antonelli J, Klaus O, Lindino CA, Nogueira CE. Technical potential of electricity production from municipal solid waste disposed in the biggest cities in Brazil: landfill gas, biogas and thermal treatment. Waste Manag Res. 2014;32(10):1015–23. doi:10.1177/0734242X14552553. [Google Scholar] [PubMed] [CrossRef]
72. Mohammed M, Agyenim FB, Mohammed L, Adomah R, Edem MB, Samii RA, et al. Exploring the potential of integrating bio-hydrogen generation into hybrid waste-to-energy (W2E) plant in Ghana. In: Innovations in circular economy and renewable energy in Africa. Cham: Springer Nature Switzerland; 2024. p. 209–27. doi:10.1007/978-3-031-68330-5_12. [Google Scholar] [CrossRef]
73. Armoo EA, Baidoo T, Mohammed M, Agyenim FB, Kemausuor F, Narra S. Environmental assessment of hybrid waste-to-energy system in Ghana. Energies. 2025;18(3):595. doi:10.3390/en18030595. [Google Scholar] [CrossRef]
Cite This Article
 Copyright © 2025 The Author(s). Published by Tech Science Press.
This work is licensed under a Creative Commons Attribution 4.0 International License , which permits unrestricted use, distribution, and reproduction in any medium, provided the original work is properly cited.
 Downloads
 Citation Tools