
 Submit a Paper
 Propose a Special lssue
 Open Access
ARTICLE

An Energy Storage Planning Method Based on the Vine Copula Model with High Percentage of New Energy Consumption
1 Development Planning Department, State Grid Anhui Electric Power Co., Ltd., Hefei, 230022, China
2 Planning Evaluation Center, Economic and Technological Research Institute of State Grid Anhui Electric Power Co., Ltd., Hefei, 230022, China
* Corresponding Author: Yuming Shen. Email:
(This article belongs to the Special Issue: The Role of Energy Storage in Energy Transition towards Low Carbon Economies)
Energy Engineering 2025, 122(7), 2751-2766. https://doi.org/10.32604/ee.2025.064317
Received 12 February 2025; Accepted 08 May 2025; Issue published 27 June 2025
 View Full Text
 Download PDF
Abstract
To adapt to the uncertainty of new energy, increase new energy consumption, and reduce carbon emissions, a high-voltage distribution network energy storage planning model based on robustness-oriented planning and distributed new energy consumption is proposed. Firstly, the spatio-temporal correlation of large-scale wind-photovoltaic energy is modeled based on the Vine Copula model, and the spatial correlation of the generated wind-photovoltaic power generation is corrected to get the spatio-temporal correlation of wind-photovoltaic power generation scenarios. Finally, considering the subsequent development of new energy on demand for high-voltage distribution network peaking margin and the economy of the system peaking, we propose the optimization model of high-voltage distribution network energy storage plant siting and capacity setting for source-storage cooperative peaking. The simulation results show that the proposed energy storage plant planning method can effectively alleviate the branch circuit blockage, promote new energy consumption, reduce the burden of the main grid peak shifting, and leave sufficient peak shifting margin for the subsequent development of a new energy distribution network while ensuring the economy.Keywords
With the rapid development of renewable energy generation technology, distributed power generation systems such as wind power and photovoltaic have been rapidly applied [1,2]. However, the current renewable energy output is characterized by fluctuation and intermittency, which is not conducive to the scale of its grid connection by the distribution grid. Therefore, planning the expansion of highly weather-dependent renewable power systems is a complex task [3]. The installed capacity of distributed photovoltaic (PV) is growing rapidly, and the cumulative installed capacity of distributed PV power generation grew from 4.67 to 107.508 million kW from 2014 to 2021 [4,5]. With the “double carbon” goal, provinces and municipalities gradually carry out distributed new energy planning, when the grid side of the large-scale integration of distributed new energy, the distribution network into a multi-power structure, the direction of the current fluctuations, such as in the same distribution substation, the same 110 kV line and even the same substation when the main transformer access to the amount of large, there is a large amount of distributed PV access to return the power to the grid, the power will be returned to the grid. Photovoltaic access to the power back to the Internet caused by heavy overloading of equipment, there will also be a countercurrent which leads to the PV power generation system grid point voltage increases or even over the limit [6–8].
The high-voltage distribution network, is connected to the transmission grid upwards, and when the power source in the region cannot meet its own supply and demand balance, it needs to be regulated by the transmission grid in time to supplement and consume the power. With the continuous development of new energy, wind, and other new energy power generation is gradually replacing thermal power generation as the main source of electricity, thermal power units accounted for a decline in the proportion of the system to reduce the flexibility of the peak, high-voltage distribution network on the liaison line to increase the dependence on the power regulation, which in turn increases the peak pressure of the higher grid. The addition of electrochemical energy storage is a useful supplement to system flexibility, and its superior fast response characteristics can make up for the shortcomings of the slow response speed of thermal power units. Through the configuration of an energy storage power plant, the full use of a high-voltage distribution network in the peak resources can effectively reduce the high-voltage distribution network on the upper grid peak demand. Energy storage system (ESS) can effectively solve the impact of large-scale distributed photovoltaic grid-connected distribution network operation [9]. In the distributed PV planning at the same time, with the development of energy storage planning to solve the “dual-carbon” background of the future large-scale distributed PV grid-connected consumption problem is the current municipal power supply companies, one of the key works of the planning department.
On the other hand, research on large-scale wind access to the distribution network cannot be separated from the generation of wind scenarios. For wind farms and photovoltaic power plants in the same region, their geographic locations and climates are similar, which not only have the autocorrelation of power output in time but also have the mutual correlation of power output in space. The construction of spatial and temporal correlation scenarios is of great significance for the rational planning of energy storage power plants.
For distribution grid energy storage planning, literature [10–12] focuses on the study of optimal allocation of distribution grid energy storage systems. Literature [10] comprehensively considered factors such as energy storage arbitrage income, government tariff subsidy income, reduction of electricity transit fee, and delay of grid upgrading constructed an energy storage planning model for the distribution grid with the goal of maximizing the whole-life-cycle revenue and proposed a hybrid algorithm based on the differential evolution method and the prediction-correction interior point method, and charging/discharging operation strategies for each time period. Literature [11] considered factors such as energy storage investment cost, operation and maintenance cost, revenue from saving power loss, and arbitrage revenue from low storage and high discharge of energy storage, constructed an upper layer optimization model with the objective of maximizing energy storage revenue, and constructed a charging/discharging strategy for battery storage system in the lower layer with consideration of time-of-use tariffs, and utilized genetic algorithms embedded in the heuristic method for solving the problem. Literature [12] addresses distribution systems with high renewable energy penetration and allocates energy storage for reducing losses due to uncertainty in loads and distributed power sources, and the proposed planning model saves energy procurement costs and develops a more appropriate energy procurement plan. The above literature is a capacity optimization allocation problem based on the known location of energy storage, it does not solve the siting problem, and it is not a study of energy storage siting and capacity determination for distributed PV consumption.
Therefore, this paper proposes a high-voltage distribution network energy storage planning model based on the Rattan Copula with a high proportion of new energy consumption. Firstly, the spatio-temporal correlation of large-scale wind-photovoltaic energy is modeled based on the Rattan Copula model, and a scenario reduction method is proposed based on the improved Iterative Self-Organizing Data Analysis Technique Algorithm (ISODATA) clustering algorithm to select the scenario set of distributed new energy that has a serious impact on the distribution network; finally, taking into account the demand for new energy subsequent development of the high-voltage distribution network peak margins as well as the economy of the system peaking, the proposed high-voltage distribution network of the source-storage coordinated peaking is proposed. Finally, considering the demand for new energy development on high-voltage distribution network peaking margin and the economy of system peaking, we propose the optimization model of energy storage plant siting and capacity setting. The simulation results show that the proposed energy storage plant planning method can effectively alleviate branch circuit blockage, promote new energy consumption, reduce the burden of the main grid peak shifting, and leave sufficient peak shifting margin for the subsequent development of new energy distribution grids while guaranteeing the economy.
2 Typical Scenario Classification of Wind-Light Correlation Based on Vine Copula Modeling
The generation of wind and solar typical daily operation scenarios is mainly divided into three parts, firstly, the time correlation is considered to generate the time-sequence output scenario of a single wind farm or photovoltaic (PV) plant, then the spatial correlation is considered to generate the output scenarios of multiple wind farms and PV plants with a single time cross-section, and finally the spatial correlation scenarios are utilized to correct the time-sequence output scenarios, so as to get the wind and solar power outputs of the typical daily operation scenarios.
2.1 A Single Time Section Scene Generation Method for Multiple Wind Farms and PV Plants
In this paper, we introduce the generalized D-Vine Copula structure for modeling scenic spatial correlation Copula theory is a method for dealing with the problem of correlation of random variables in statistics.
By Sklar’s theorem, let
When analyzing the correlation of multidimensional variables, the Copula function is used together with the vine structure model to obtain better analysis results. There are two types of Vine structure, C-type and D-type, C-type structure is suitable for multidimensional variables in which the correlation between a certain dimensional variable and the remaining variables is strong and the correlation between the other remaining variables is weak; the D-type structure is suitable for multidimensional variables in which the correlation between the variables is close to the same degree, and it has an obvious parallel structure.
The Vine Copula model transforms the complex multidimensional correlation between random variables into a simpler correlation between two variables. The Vine Copula model calculation process is hierarchical step-by-step. For N-dimensional random variables, the first layer is the respective random variables, the second layer establishes the joint distribution between two of these random variables, i.e., the Copula function, the third layer of the Copula function obtained from the upper layer as a random variable, the calculation of the Copula function of this layer, and so on.
The joint probability density function is decomposed using conditional distributions, and the corresponding conditional distribution function for each conditional probability density function is as follows:
Let the random number
The inverse transformation of the requested sampling points yields a collection of n spatially correlated wind farm and photovoltaic (PV) plant output scenarios for a given time section, denoted as
2.2 Method for Generating Multi-Time Cross-Section Scenarios for a Single Wind Farm or PV Plants
The time scale of wind power modeling in the distribution network energy storage planning problem is medium to long-term, and does not pursue the accuracy of wind power prediction, but focuses on the analysis of historical data patterns. MCMC method has obvious advantages in the medium to long term modeling of single wind farms or photovoltaic power plants with multiple time cross-sections of power sequences to better reflect the daily power characteristics of the wind and photovoltaic power and the seasonal characteristics and does not need to construct the energy conversion model, which reduces the modeling difficulty. This reduces the modeling difficulty. Therefore, this paper adopts the MCMC method to generate a collection of n wind farms and PV power plants with time-dependent output scenarios, which is denoted as
2.3 Temporal Scenario Correction Considering Spatio-Temporal Correlation
The flow of scene correction considering temporal correlation is as follows:
(1) Arrange the m variables in
(2) The variables corresponding to the position and
(3) Take the variables with temporal correlation
(4) The variables
(5) Finally output the corrected
In which the outgoing scenarios of each time section in the pair are corrected according to Eq. (4):
where
So far, the generation of wind and solar daily operation scenarios considering spatial and temporal correlation is completed [14].
3 Scene Screening Method Based on Improved ISODATA Clustering Algorithm
Although the classical ISODATA clustering algorithm has solved the problem that the K-means algorithm needs to determine the number of clusters in advance, it still has certain drawbacks: for example, randomly selecting the initial clustering centers may lead to slower convergence of the clustering algorithm and poorer results; and the selection of Euclidean distance as a distance metric in the original input space of the load curves fails to capture high-dimensional features in the load curves. Therefore, the L-ISODATA clustering algorithm, i.e., the Load curve-ISODATA algorithm, is proposed to apply the ISODATA algorithm in the field of load curve clustering and to improve the ISODATA clustering algorithm.
For problems such as the difficulty of obtaining the high-dimensional features of the load curve by Euclidean distance in the original load curve input space, the kernel method can be used for optimization. The idea is to map the new energy output curve in the original input space to the high-dimensional feature space through nonlinear mapping, and then carry out clustering in the new high-dimensional feature space. The nonlinear mapping increases the probability that the data points are linearly separable, and the clustering algorithm can compute the distances between the samples according to the high-dimensional features of the load curve so as to carry out clustering, and the effect of the clustering is also correspondingly improved.
The kernel method can bypass the mapping function ϕ and solve it by the kernel function K(x,z), which can significantly reduce the amount of computation. In clustering algorithms, the degree of similarity between two samples needs to be calculated, which can be expressed by the inner product of the two samples or by the kernel function, so the kernel method can be perfectly applied in clustering algorithms [15].
In the clustering algorithm, we need to calculate the distance between two samples and the distance between two samples in high dimensional space can be represented by the kernel function:
In addition to this, we need to compute the distance from each sample xi to each clustering center μi in the high dimensional space:
And the center of clustering in a higher dimensional space can be expressed as:
3.2 Clustering Effectiveness Evaluation Indicators
The clustering task belongs to unsupervised learning, in which the samples are pre-existing without category information, and potential category concepts are obtained by dividing the samples. Therefore, when evaluating the clustering effect, it is also different from supervised learning in that it cannot be evaluated by comparing it with real labeling information.
Intuitively, the higher the degree of similarity between samples of the same cluster, the better, and the lower the degree of similarity between samples of different clusters, the better, i.e., the intra-cluster similarity of clustering results should be high while the inter-cluster similarity should be low. According to such an evaluation criterion, this paper adopts DBI (Davies-Bouldin Index, DBI) and DI (Dunn Index, DI) to evaluate the clustering effect. Before giving the expressions of DB index and DI index, the following definitions are given:
Assuming that the clustering result is
where dist(xi, xj) denotes the distance between two samples; avg(C) denotes the average distance between samples in cluster C; diam(C) denotes the maximum distance between samples in cluster C dmin(Ci, Cj) denotes the minimum distance between the samples of clusters Ci and Cj; and dcem(Ci, Cj) denotes the distance between the cluster centers of cluster Ci and cluster Cj the distance between the clustering centers of cluster Ci and cluster Cj.
The expressions for the DBI and DI indices are then given as:
The expressions of DBI and DI are analyzed: where the smaller avg(C) indicates the higher intra-cluster similarity, the larger dcem(Ci, Cj) indicates the lower inter-cluster similarity, so the value of DBI is the smaller the better, and the smaller it indicates the higher intra-cluster similarity and the lower inter-cluster similarity; whereas, the larger dmin(Ci, Cj) indicates the lower inter-cluster similarity, and the diam(C) The smaller indicates the higher intra-cluster similarity, so the larger the value of DI, the better.
3.3 Scenario Reduction Based on Clustering Results
The output scenarios of each time section in Section 2.3 are clustered by L-ISODATA, and then, with reference to the idea of robust optimization, a class of scenarios with the smallest combined wind-photovoltaic new energy output and the largest average value of the load output is selected as the computational and analytical scenarios of energy storage planning, which can not only avoid the tedious computation brought by the establishment of a model for each day’s output but also enhance the learning ability for the different characteristics of the electricity consumption. Date learning ability and improve the accuracy of energy storage planning. A comparison of various clustering algorithms is shown in Table 1.
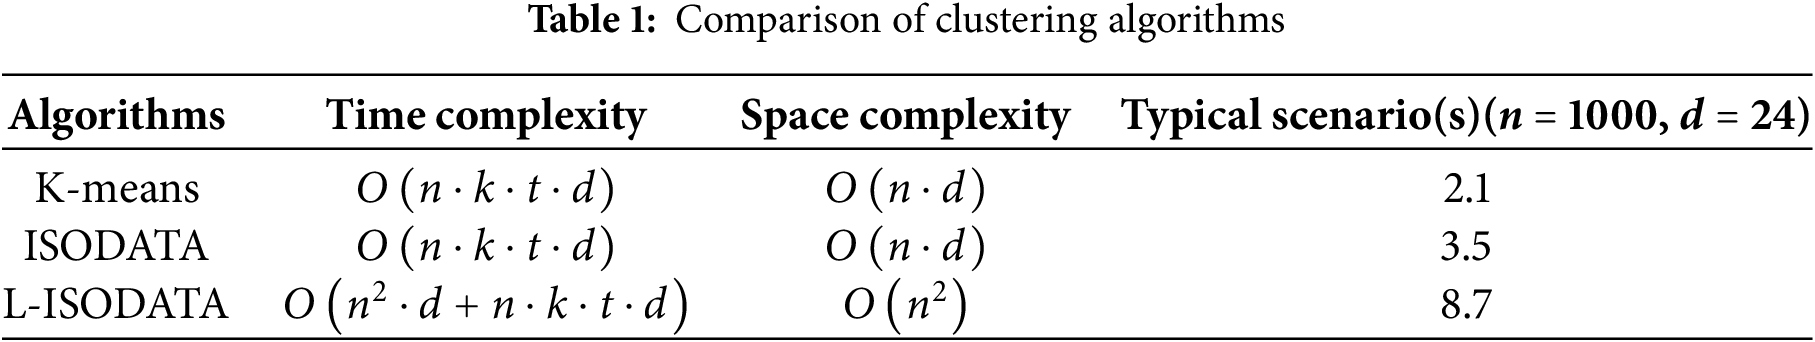
In the table, O is the computational complexity, n is the number of samples; k is the number of clusters; T is the number of iterations; d is the data dimensions.
4 Optimization Model for Energy Storage Siting and Capacity Determination
The optimal configuration of energy storage in high-voltage distribution grids is a system optimization model with the goal of minimizing the cost of flexibility regulation, which includes the cost of operating conventional units, the cost of regional purchased power, and the cost of carbon emissions. At the same time, it is also necessary to consider the security of energy storage on the grid lines and delay the investment in transmission and distribution equipment, as well as coal savings and emission reductions. When the grid lines produce power fluctuations and large peak-to-valley differences, energy storage can be used as a temporary power source to realize the safe and stable operation of the power system.
In the formula,
4.1.1 Full Life Cycle Costs of Energy Storage
The whole life cycle cost of energy storage includes its investment and construction cost, operation cost, maintenance cost, replacement cost, and residual value. For the construction of the energy storage power plant, the investment construction cost is the one-time investment of the energy storage system, including the acquisition cost of the energy storage system and its affiliated power electronic devices, which is generally a huge amount and is scientifically discounted over the whole life cycle in the calculation process of this paper.
In the formula,
In the formula,
4.1.2 Conventional Energy Running Costs
Conventional coal-fired units participate in capacity-based fluctuation regulation, and gas turbines participate in system power-based fluctuation regulation. The operating output cost of traditional units mainly includes fuel cost and operating cost. Calculation methods have quadratic nonlinear and primary linear calculation methods, in order to simplify the calculation, this paper adopts the linearized cost function to portray the traditional unit power cost:
where
4.1.3 Cost of Purchasing Power from Out-of-Region Sources
Extra-regional power supply can be regarded as a supplementary power source for the region’s energy consumption, which is characterized by poor peak adjustment ability and significant intra-annual abundance/depletion variations of part of the delivered power, and its transmission cost is determined by the delivered power and landed power price [16].
where Nout is the number of external power returns, cout,w is the landed tariff of the w external power purchase, pout,w(t) is the status of the external power transmission from the region, EEE is a 0–1 variable, with a value of 1 the external power transmission from the region, and with a value of 0 the external power transmission from the region does not take place, and pout,w(t) is the power delivered by the w external power purchase.
4.1.4 Cost of Carbon Emissions
Conventional units emit large amounts of pollutant gases during operation, causing environmental pollution. In order to achieve the goal of “carbon peak, carbon neutral”, the new power system equipped with energy storage can be used to replace traditional energy sources to achieve complex and frequent flexibility adjustment, thereby increasing the consumption of renewable energy and reducing the environmental pollution caused by conventional units. The carbon emission discounting cost
where c1 and c2 are the discounted cost of carbon emissions per unit of conventional coal-fired unit and out-of-region electricity, respectively, which is obtained from the product of carbon emission price and carbon emission factor.
4.1.5 Delaying the Benefits of Grid Upgrades
When grid lines are overloaded, the equipment needs to be upgraded and expanded, thus increasing the investment cost of the lines. The reconstruction of the grid electrical equipment can be delayed by establishing an energy storage plant on the grid side. The delayed grid upgrading benefit
where
4.1.6 Gain on Government Subsidies
At present, due to the high cost of energy storage devices, in order to further promote the popularization and application of energy storage technology, most countries have introduced a series of construction subsidy policies. China has also introduced a series of related subsidy policies. There are generally two forms of government subsidies, one is the construction investment subsidy and the other is the electricity price subsidy, which is adopted in this study:
In the formula,
4.2.1 System Reliability Constraint
The reliability constraint of the system is that the total generating capacity needs to be greater than or equal to the total power demand:
where
At time t, wind-photovoltaic new energy generation, energy storage discharge, traditional power generation and transmission from outside the region
where
4.2.3 Regional Outsourcing Constraint
Power purchased outside the region cannot exceed the maximum power delivered by the line.
4.2.4 Energy Storage Charge State Constraint
State of Charge (SOC) is an important indicator to measure the electric energy storage state and charging/discharging capability of the energy storage system. The upper and lower limits of SOC need to be set during the operation of the energy storage system, so that it works within the set range, thus reducing the loss of energy storage performance itself, which can be expressed as:
where
The flowchart of the proposed algorithm in this paper is shown in Fig. 1.
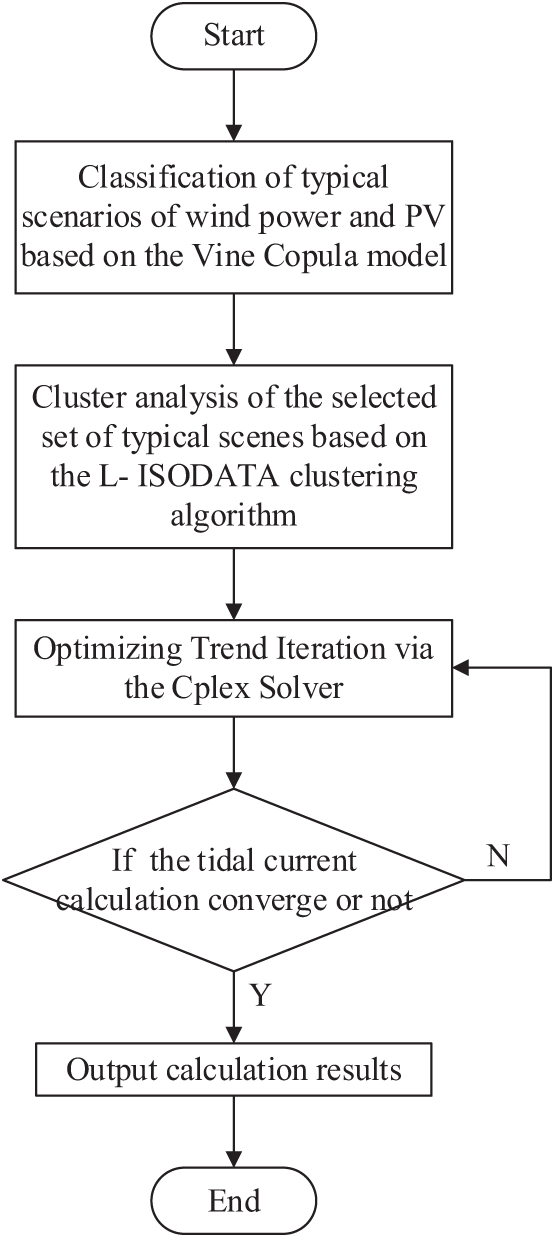
Figure 1: Algorithm flow chart
This section modifies the standard IEEE 30 system to make it a radial high-voltage distribution network as shown in Fig. 2. The reference voltage of the system is 135 kV and the allowable operating range of the node voltage is 0.5–1.05 p.u. A 200 MW thermal power unit is connected at nodes 2 and 22 respectively. The new energy sources connected to this high-voltage distribution network are large in scale, with a 50 MW photovoltaic power plant at nodes 14 and 27, and a 70 MW wind farm at nodes 3 and 22, respectively.
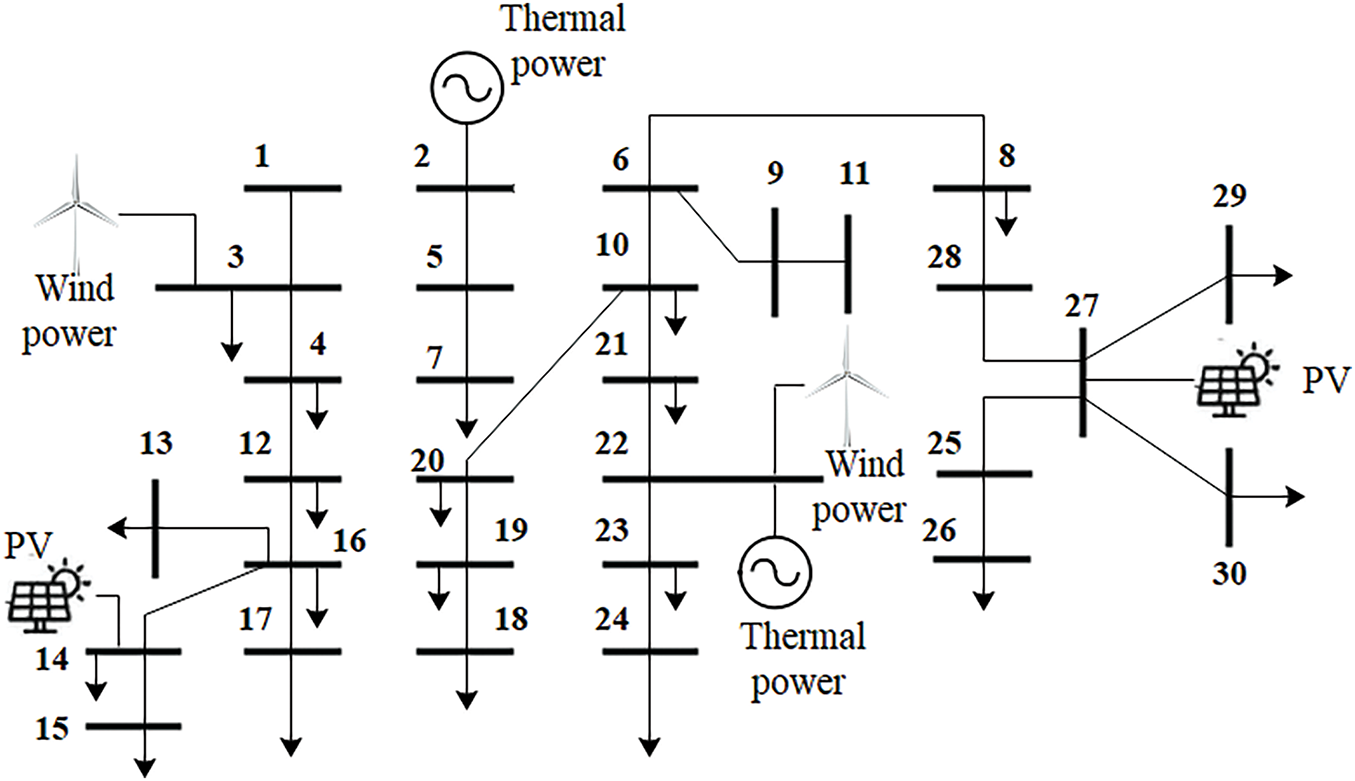
Figure 2: Improved IEEE 30-node high-voltage distribution network
The planning period is taken as 10 years of energy storage life cycle, the rated power of each energy storage is capped at 50 MW, the capacity is 100 MWh, the cost coefficient of unit power configuration is taken as 8200 ¥/kW, the cost coefficient of unit capacity operation and maintenance is taken as 0.05, and the discount rate is 3%. Sampling is carried out every 1 h in a day, and 8760 sampling points are taken in a year. The output data of wind farms and photovoltaic (PV) power plants were obtained from the actual data of wind farms and PV power plants in a central region of China.
The Vine Copula model is used to generate multiple daily output scenarios, and the L-ISODATA clustering algorithm is used to cut down the scenarios, and finally five typical wind and solar daily output scenarios are obtained as shown in Fig. 3. The scenarios generated by this method not only contain the strong correlation between the two wind farms, but also take into account the seasonal characteristics of the wind and solar, which provide a comprehensive scenario basis for the energy storage planning. Fig. 4 shows the evaluation of the clustering results by comparing k-means clustering and traditional ISODATA clustering, and using DBI and DI index. The clustering results show that the L-ISODATA model has significant advantages for clustering of wind power and load curves.
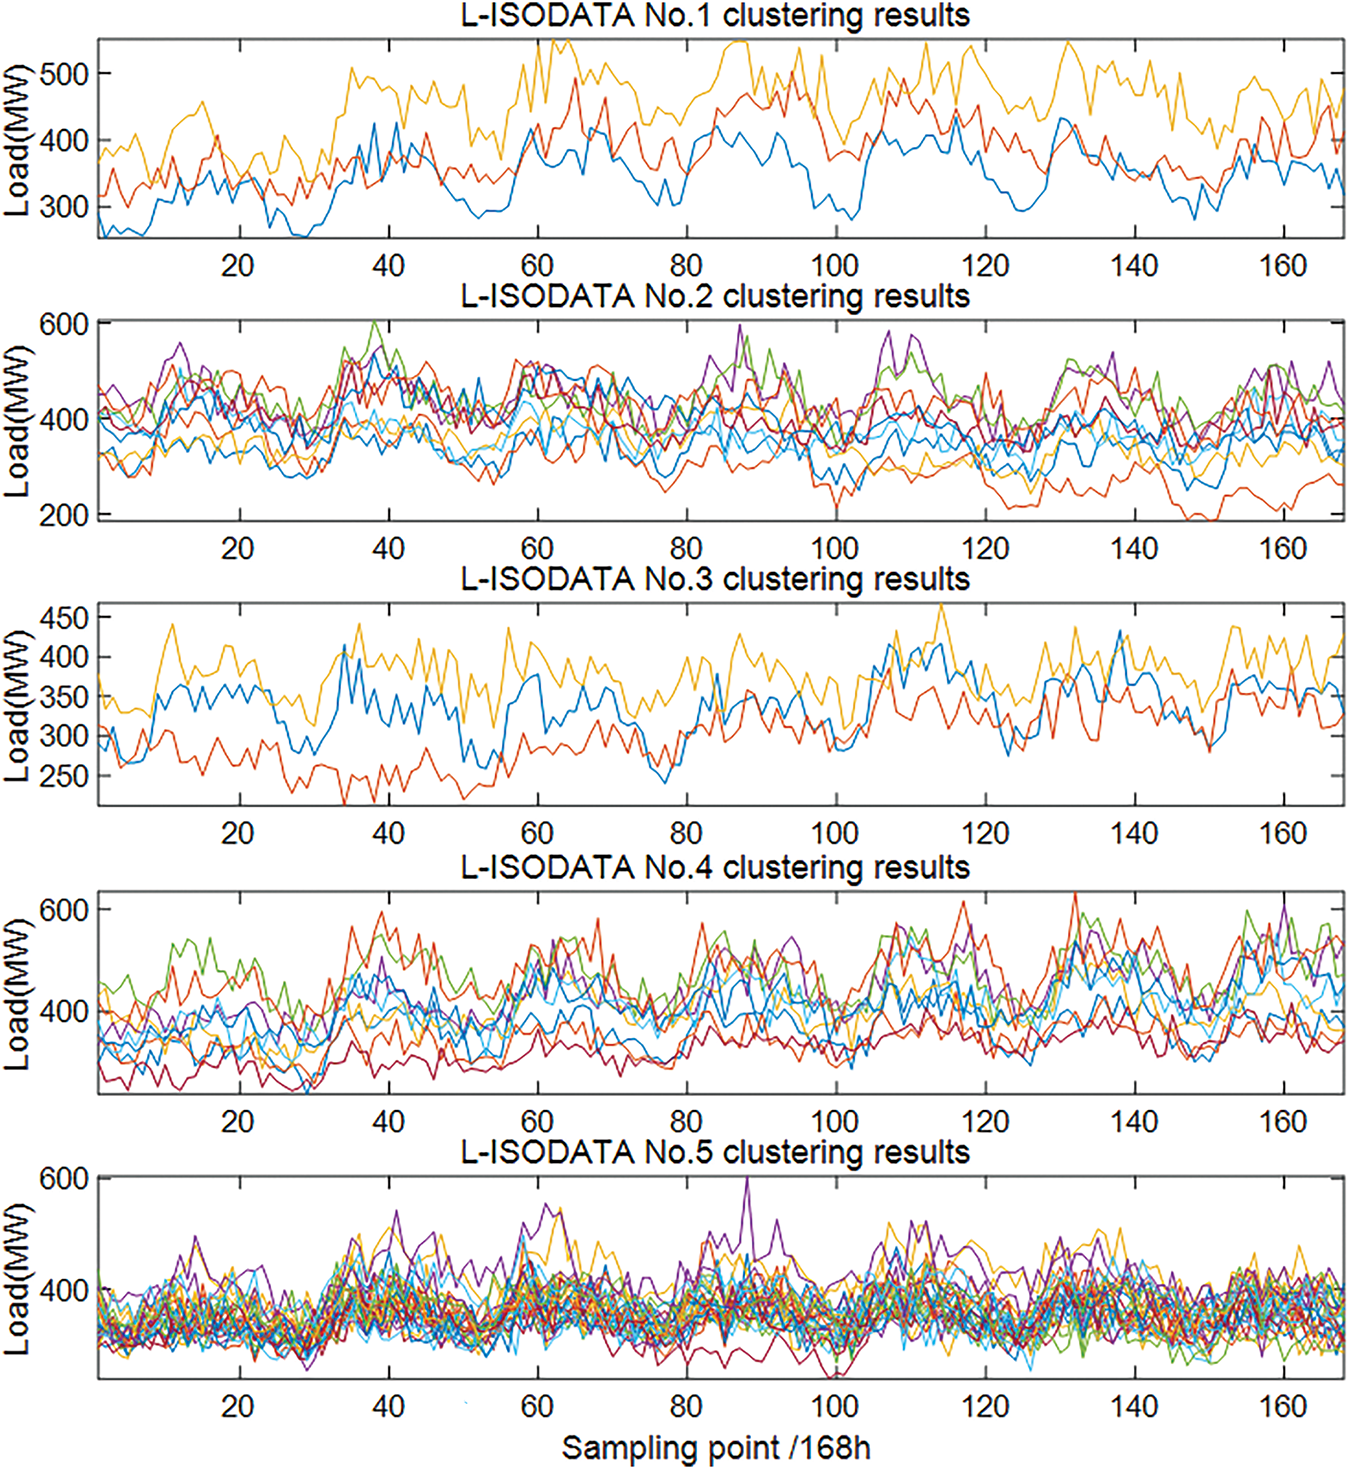
Figure 3: Scene clustering reduction results

Figure 4: Evaluation of clustering effects
In order to improve the ability of the high-voltage distribution network to withstand the risk of uncertainty in new energy output and increase the resilience of the grid, among the five types of typical scenarios generated above, the two types of scenarios with the largest average net loads are selected as the research scenarios for the high-voltage distribution network energy storage planning to be studied. The maximum number of configurations of energy storage power stations is set to three, then the energy storage configuration scheme is shown in Table 2.
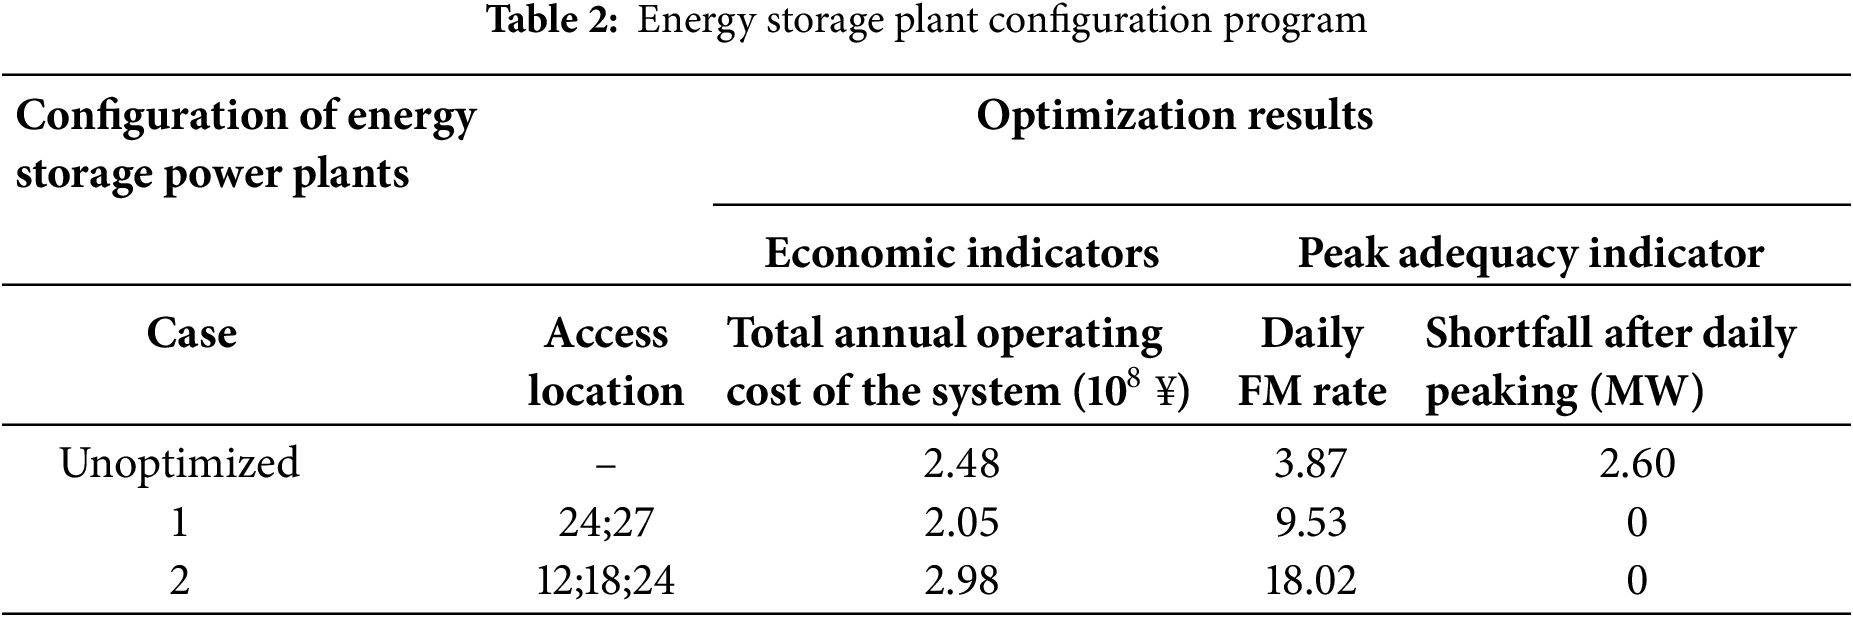
Scenario 1 and Scenario 2 are the calculation results of the energy storage planning scenarios. Compared to the case without energy storage, both scenarios optimize the peak adequacy index to different degrees. Among them, the annual operating cost of the system in Scenario 1 is lower than that of the system without energy storage and improves the daily peaking rate to some extent. Scenario 2 has the highest cost because it is planned to build one more energy storage plant than Scenario 1, but at the same time, the daily peaking rate is also optimal, and has a stronger ability to absorb the distributed new energy resources that will continue to be built in the future, so in the actual construction, it can be based on the planning and construction of the storage plant to decide whether to choose Scenario 2. Intercepting the state of charging and discharging of the energy storage in the two planning scenarios and the state of the thermal power plant’s power output as shown in Fig. 5.
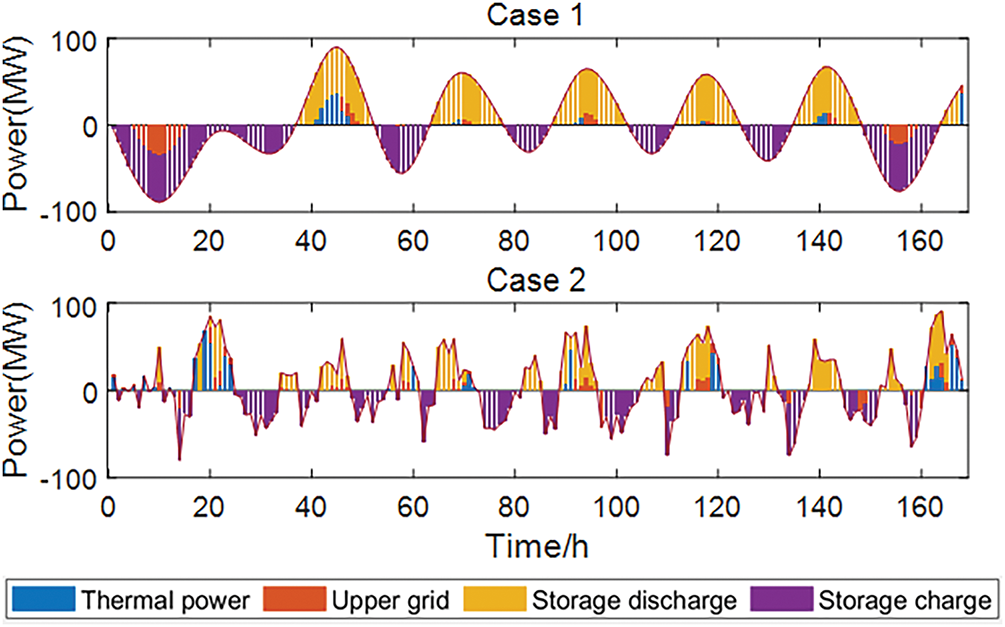
Figure 5: Results of energy storage utilization with different configurations
Aiming at the high proportion of new energy access to the grid side brings the problem of difficulty to consuming completely, a high-voltage distribution network energy storage planning model based on Vine Copula and a high proportion of new energy consumption is proposed. Improved IEEE 30 nodes are used as an example for simulation modeling, and the results of the example show that:
(1) The wind-photovoltaic output corrected by the Vine Copula model has similarity in time, which is more consistent with reality, and improves the trustworthiness and practical reference value of the planning results of the subsequent energy storage power plant;
(2) The L-ISODATA clustering method proposed in the article has a better clustering effect on new energy output curves compared with traditional clustering algorithms, which can effectively cut down the number of typical days of energy storage planning scenarios, reduce the amount of computation, and improve the accuracy of the planning of energy storage power plants;
(3) According to the proposed method in the corresponding location configuration of the energy storage power station, in different scenarios adjusting the operation strategy of the energy storage, can effectively reduce the branch circuit blockage caused by the wind and light abandonment, through the energy storage and thermal power units to coordinate the power can significantly reduce the grid’s peaking burden, and improve the high-voltage distribution network on the new energy consumption capacity.
However, there are still some directions that deserve further research in this paper, such as the sensitivity analysis of elements such as discount rate and carbon price cost on the results of energy storage planning; and the testing of computing speed under a larger scale network structure. The above issues can be discussed in more depth in the subsequent research.
Acknowledgement: This work was supported by the State Grid Anhui Electric Power Co., Ltd. Research Program.
Funding Statement: This work was supported by State Grid Anhui Electric Power Co., Ltd. Research Program (B3120923000C).
Author Contributions: The authors confirm contribution to the paper as follows: Formal analysis, methodology, software, validation, visualization, writing—original draft and writing—review & editing: Jiaqing Wang; Conceptualization, data curation, funding acquisition, methodology, project administration, supervision: Yuming Shen; Methodology and project administration: Xuli Wang; Formal analysis and software: Jiayin Xu. All authors reviewed the results and approved the final version of the manuscript.
Availability of Data and Materials: The authors confirm that the data supporting the findings of this study are available within the article.
Ethics Approval: Not applicable.
Conflicts of Interest: The authors declare no conflicts of interest to report regarding the present study.
References
1. Zhang T, Yang J, Jin K, Jing T. Local power consumption method of distributed photovoltaic generation in rural distribution network based on blockchain. IET Generation Trans & Dist. 2023;17(6):1409–18. doi:10.1049/gtd2.12748. [Google Scholar] [CrossRef]
2. Liang G, Sun B, Zeng Y, Ge L, Li Y, Wang Y. An optimal allocation method of distributed PV and energy storage considering moderate curtailment measure. Energies. 2022;15(20):7690. doi:10.3390/en15207690. [Google Scholar] [CrossRef]
3. Wu H, Ding D, She Y, Wang L, Ji B, Chen T. Topology optimization of regional power grid under large-scale access of distributed photovoltaic power generation. J Nanoelectron Optoelectron. 2022;17(12):1648–54. doi:10.1166/jno.2022.3349. [Google Scholar] [CrossRef]
4. Zhu L, Yang XY, Tang LJ, Wang K, Ding YJ, Chen ZM. Bi-level optimal dispatch strategy for air-conditioning load based on temperature and switch hybrid control under distributed photovoltaic grid-connection. Mod Electr Power. 2023;40(2):219–29. (In Chinese). doi:10.19725/j.cnki.1007-2322.2021.0312. [Google Scholar] [CrossRef]
5. Xu X, Lv X, Zhang X, Xu X. Research on distributed photovoltaic grid-connected voltage cooperative control strategy considering local load. Am J Electr Electron Eng. 2020;8(3):84–90. doi:10.12691/ajeee-8-3-3. [Google Scholar] [CrossRef]
6. Li Y, Sun Y, Li K, Zhuang J, Liang Y, Pang Y. Analysis and suppression of voltage violation and fluctuation with distributed photovoltaic integration. Symmetry. 2021;13(10):1894. doi:10.3390/sym13101894. [Google Scholar] [CrossRef]
7. Zhang YJ, Zhang SH, Liu SL, Yi YQ. Dual planning of a distribution transformer considering the impact of distributed photovoltaics and energy storage access. Power Syst Prot Control. 2020;48(24):9–15. (In Chinese). doi:10.19783/j.cnki.pspc.200128. [Google Scholar] [CrossRef]
8. Liu H, Tian JY, Luo J, Min YZ. Research on distributed energy storage connecting to remote mountainous distribution network planning. Guangdong Electr Power. 2024;37(12):61–9. (In Chinese). [Google Scholar]
9. Ranamuka D, Muttaqi KM, Sutanto D. Flexible AC power flow control in distribution systems by coordinated control of distributed solar-PV and battery energy storage units. IEEE Trans Sustain Energy. 2020;11(4):2054–62. doi:10.1109/TSTE.2019.2935479. [Google Scholar] [CrossRef]
10. Liu M, Wu Q, Li Z, Zhao B, Zhang L, Li J, et al. Online optimization to suppress the grid-injected power deviation of wind farms with battery-hydrogen hybrid energy storage systems. Energy Eng. 2025;122(4):1403–24. doi:10.32604/ee.2025.060256. [Google Scholar] [CrossRef]
11. Li XL, Geng GF, Ji YQ, Lu LZ. Study on optimal allocation of battery energy storage in distribution network considering the actual operation. Power Syst Prot Control. 2017;45(9):88–94. (In Chinese). doi:10.7667/PSPC160636. [Google Scholar] [CrossRef]
12. Zheng Y, Dong ZY, Luo FJ, Meng K, Qiu J, Wong KP. Optimal allocation of energy storage system for risk mitigation of DISCOs with high renewable penetrations. IEEE Trans Power Syst. 2014;29(1):212–20. doi:10.1109/TPWRS.2013.2278850. [Google Scholar] [CrossRef]
13. Gao J, Hao H, Wen C, Wang Y, Han Z, Nykilla EE, et al. Correlation analysis of power quality and power spectrum in wind power hybrid energy storage systems. Energy Eng. 2025;122(3):1175–98. doi:10.32604/ee.2025.061083. [Google Scholar] [CrossRef]
14. Ning N, Wu X, Shao Q, Xie M, Huang B, Li S. Copula correlation modeling of wind farms generation and its application in power dispatching. IOP Conf Ser Earth Environ Sci. 2021;766(1):012045. doi:10.1088/1755-1315/766/1/012045. [Google Scholar] [CrossRef]
15. Zhang C. Research on short-term power load forecasting and load curve clustering based on machine learning [master’s thesis]. Hangzhou, China: Zhejiang University; 2021. doi: 10.27461/d.cnki.gzjdx.2021.000300. [Google Scholar] [CrossRef]
16. Wang HW, Cheng XH, Zhao MM, Zhang D, Zhou JS, Zhang P. Method for energy storage planning in medium-voltage distribution networks for distributed photovoltaic consumption. Electr Power Constr. 2023;44(9):58–67. (In Chinese). doi:10.12204/j.issn.1000-7229.2023.09.006. [Google Scholar] [CrossRef]
Cite This Article
 Copyright © 2025 The Author(s). Published by Tech Science Press.
This work is licensed under a Creative Commons Attribution 4.0 International License , which permits unrestricted use, distribution, and reproduction in any medium, provided the original work is properly cited.
 Downloads
 Citation Tools