
 Submit a Paper
 Propose a Special lssue
 Open Access
ARTICLE

Low Carbon Economic Dispatch of a Multi-Principal Integrated Energy System Considering CCS and P2G
School of Electrical Engineering, Shanghai DianJi University, Shanghai, 201306, China
* Corresponding Author: Ximin Cao. Email:
(This article belongs to the Special Issue: Innovative Approaches in Clean Energy Systems: Integration, Sustainability, and Policy Impact of Renewable Energy)
Energy Engineering 2025, 122(7), 2865-2890. https://doi.org/10.32604/ee.2025.065419
Received 12 March 2025; Accepted 14 May 2025; Issue published 27 June 2025
 View Full Text
 Download PDF
Abstract
Against the backdrop of China’s “dual-carbon” target, clean energy generation currently accounts for about 3.8 trillion kilowatt-hours, or 39.7 percent of total power generation, establishing a reasonable market trading mechanism while enhancing the low-carbon economic benefits of the integrated energy system (IES) and optimizing the interests of various entities within the distribution system has become a significant challenge. Consequently, this paper proposes an optimization strategy for a low-carbon economy within a multi-agent IES that considers carbon capture systems (CCS) and power-to-gas (P2G). In this framework, the integrated energy system operator (IESO) acts as the primary leader, while energy suppliers (ES), energy storage operators (ESO), and load aggregators (LA) follow. At the level of low-carbon technology, a coupling model of P2G and CCS is developed, leading to the establishment of an IES that incorporates energy conversion and storage equipment. Economically, effective control of system carbon emissions in market trading is progressively established. Lastly, the trading decision model of the system is integrated within a master-slave game framework, utilizing an improved differential evolution algorithm in conjunction with the distributed equilibrium method of quadratic programming for solution. The calculation example demonstrates that the strategy safeguards the benefits for both parties in the game and achieves energy savings and carbon reduction for the system.Keywords
In recent years, carbon emissions have produced a greenhouse effect due to rapid economic and social development, leading to global climate change [1]. Amidst accelerating global efforts toward sustainable development, the adoption of decarbonized energy systems has emerged as a critical priority for both current and future economic paradigms. The development of IES, marked by the seamless coordination of generation, grid, demand, and storage components alongside cross-energy synergies, serves as a cornerstone strategy for advancing toward sustainable, low-carbon energy economies. IES interconnects diverse energy networks, dynamically transforming electricity, thermal, cooling, and gas resources to optimize energy distribution while seamlessly integrating decentralized renewable energy generation [2]. Advancing energy efficiency optimization and driving sustainable energy transitions represent pivotal research priorities with profound implications for future innovation and policy development.
P2G technology facilitates the bidirectional conversion between electrical energy and hydrogen within IES, enhancing energy flexibility and storage capabilities. Reference [3] analyzed the principle of power-to-gas, electrolysis of water to obtain hydrogen, to achieve the conversion and storage of energy. CCS plays a key role in reducing carbon emissions from IES, and CCS technology captures, sequesters, and uses CO2 emitted from the energy sector [4,5]. References [6,7] verify the effectiveness of CCS retrofits in decarbonizing power systems in real cases. However, the application of either P2G technology or CCS technology alone is not ideal in terms of economics [8]. The integration of CCS and P2G technologies enables the repurposing of captured CO2 for methane synthesis, achieving dual outcomes: a substantial reduction in IES carbon emissions and the production of renewable synthetic fuel [9]. Introducing P2G technology into the cogeneration scheduling model in IES effectively improves energy utilization and economy [10]. Reference [11] feeds captured CO2 from a gas-fired cogeneration plant to a P2G plant, and the generated gas is supplied to a gas-fired cogeneration plant. The above references lack consideration of the need for CO2 feedstock for methane production. Reference [12] established an integrated wind-light-hydrogen energy model and a coupled CCS and P2G model, which provides an effective way for IES renewable energy to adapt to a reliable hydrogen supply. Reference [13] proposed an operational framework including carbon capture, hydrogen fuel cells, and P2G technology. Through analysis of carbon valorization pathways, results confirmed improved eco-economic efficiency when operating under a stepped carbon trading policy. The literature largely excludes transactional market structures from multi-stakeholder operational models and employs fixed-rate carbon trading systems that fail to evolve toward more nuanced emission mitigation paradigms. Tensions among market participants arising from transactional disagreements risk eroding their willingness to actively engage in commercial exchanges.
Recent practical research reveals that the power trading mechanism is showing significant dynamic evolution characteristics, and the composition of the participating subjects in its marketization process has broken through the traditional single form and transformed into a multi-dimensional industrial synergy network. Under the new power system architecture, power generation companies, power sales companies, and load aggregators are forming a complex ecology of competition through long-term agreement alliances and spot market bidding. In the face of this asymmetric information environment, the construction of game models for strategy derivation has become an inevitable choice for market players to optimize their decision-making—equilibrium analysis can effectively deconstruct the conflict of interests of multiple parties, while game theory provides quantitative support for dynamic strategy adjustment, which provides a key methodological framework for solving the dilemma of the market power game under the new power system. Since the master-slave game is an important method for solving the dispute of interests of multiple decision-making subjects and studying the strategy choice, it is now widely used in the field of optimal scheduling of IESs [14]. In IES, the system operator formulates an appropriate price strategy based on the load demand and supply-demand relationship, and the suppliers and consumers respond according to the price information given by the operator, there is a sequential order in the game process, which is in line with the dynamic game situation between master and slave [15]. Reference [16] proposes a game-theoretic optimization framework for regional multi-energy systems, integrating load demand responsiveness to maximize combined economic and operational efficiency. Reference [17] proposes a two-level cooperative control strategy model based on multi-intelligence deep reinforcement learning for an “electricity-heat-gas” integrated energy system, which improves energy efficiency and reduces the cost of the integrated energy system. Reference [18] proposes a dual-phase optimization framework for combined heat and power systems, integrating strategic tariff adaptation and operational policy refinement to balance energy efficiency gains with cost minimization. Reference [19] incorporates a carbon trading mechanism, establishes a hierarchical decision-making model between energy suppliers and load-side stakeholders, and incentivizes user participation in low-carbon demand-side management through dynamic pricing strategies and flexible generation scheduling. This approach facilitates synergistic optimization of energy efficiency and emission reduction within IES. The study confirms that the introduction of master-slave game analysis tools can not only quantify the loss of game efficiency due to market power abuse but also provide a computable theoretical framework for institutions to design market power suppression mechanisms, which opens up a new path to solve the prevalent strategic offer and market manipulation problems in the power system. However, the solution methodology and other trading mechanisms are not comprehensively considered, and the extent of the IES carbon reduction potential is not deep enough.
Building on this context, the study introduces a coordinated optimization mechanism for multi-stakeholder interactions within a hierarchical decision-making framework. Firstly, the model of IES including CCS and P2G, and the market trading mechanism are introduced. Then, the payoff model and game framework of each subject are constructed separately. Subsequently, a distributed solving algorithm that protects the privacy of each subject is used to realize the balance between information privacy and market competition by the upper leader formulating a price strategy and the lower follower responding according to the price information provided. Scenario-based evaluations conclusively demonstrate the practical efficacy of the methodology introduced in this study.
Our work establishes the main innovations:
1. A multi-energy coupled IES optimal scheduling model based on a master-slave game is established. By describing the behaviors of each subject of interest in IES, the problem of conflicting interests among each other is solved, and the interests of each subject are maximized.
2. A refined CCS and P2G coupling model is constructed, as well as CET and GCT mechanisms are added to deeply explore the carbon reduction potential of IES.
3. In this paper, a distributed solution algorithm is proposed, aiming to cope with the severe challenge of competition in the electricity market, while protecting the information privacy of each subject of interest. Unlike the traditional Stackelberg game approach, the algorithm does not need to disclose sensitive information such as participants’ objective functions, equipment parameters, or energy use preferences, which are regarded as trade secrets. The core mechanism of the algorithm is that the upper-tier leaders formulate pricing strategies, while the lower-tier followers make decisions based on the received price information, thus maintaining the fairness and stability of the market competition while safeguarding the information privacy.
The architecture of IES is shown in Fig. 1. Energy is supplied by wind turbine (WT), photovoltaic (PV), grid, and natural gas. The IES device mainly includes a gas boiler (GB), electric boiler (EB), micro turbine (MT), heat recovery boiler (HRB), absorption chiller (AC), hydrogen fuel cell (HFC), electric refrigeration unit (ERU). Within the combined cooling, heating, and power (CCHP), it consists of MT, HRB, and AC. IESO acts as a bridge between energy supply and demand, connecting the supply side, storage side and load side, and realizes the integrated operation of source, network, load and storage.
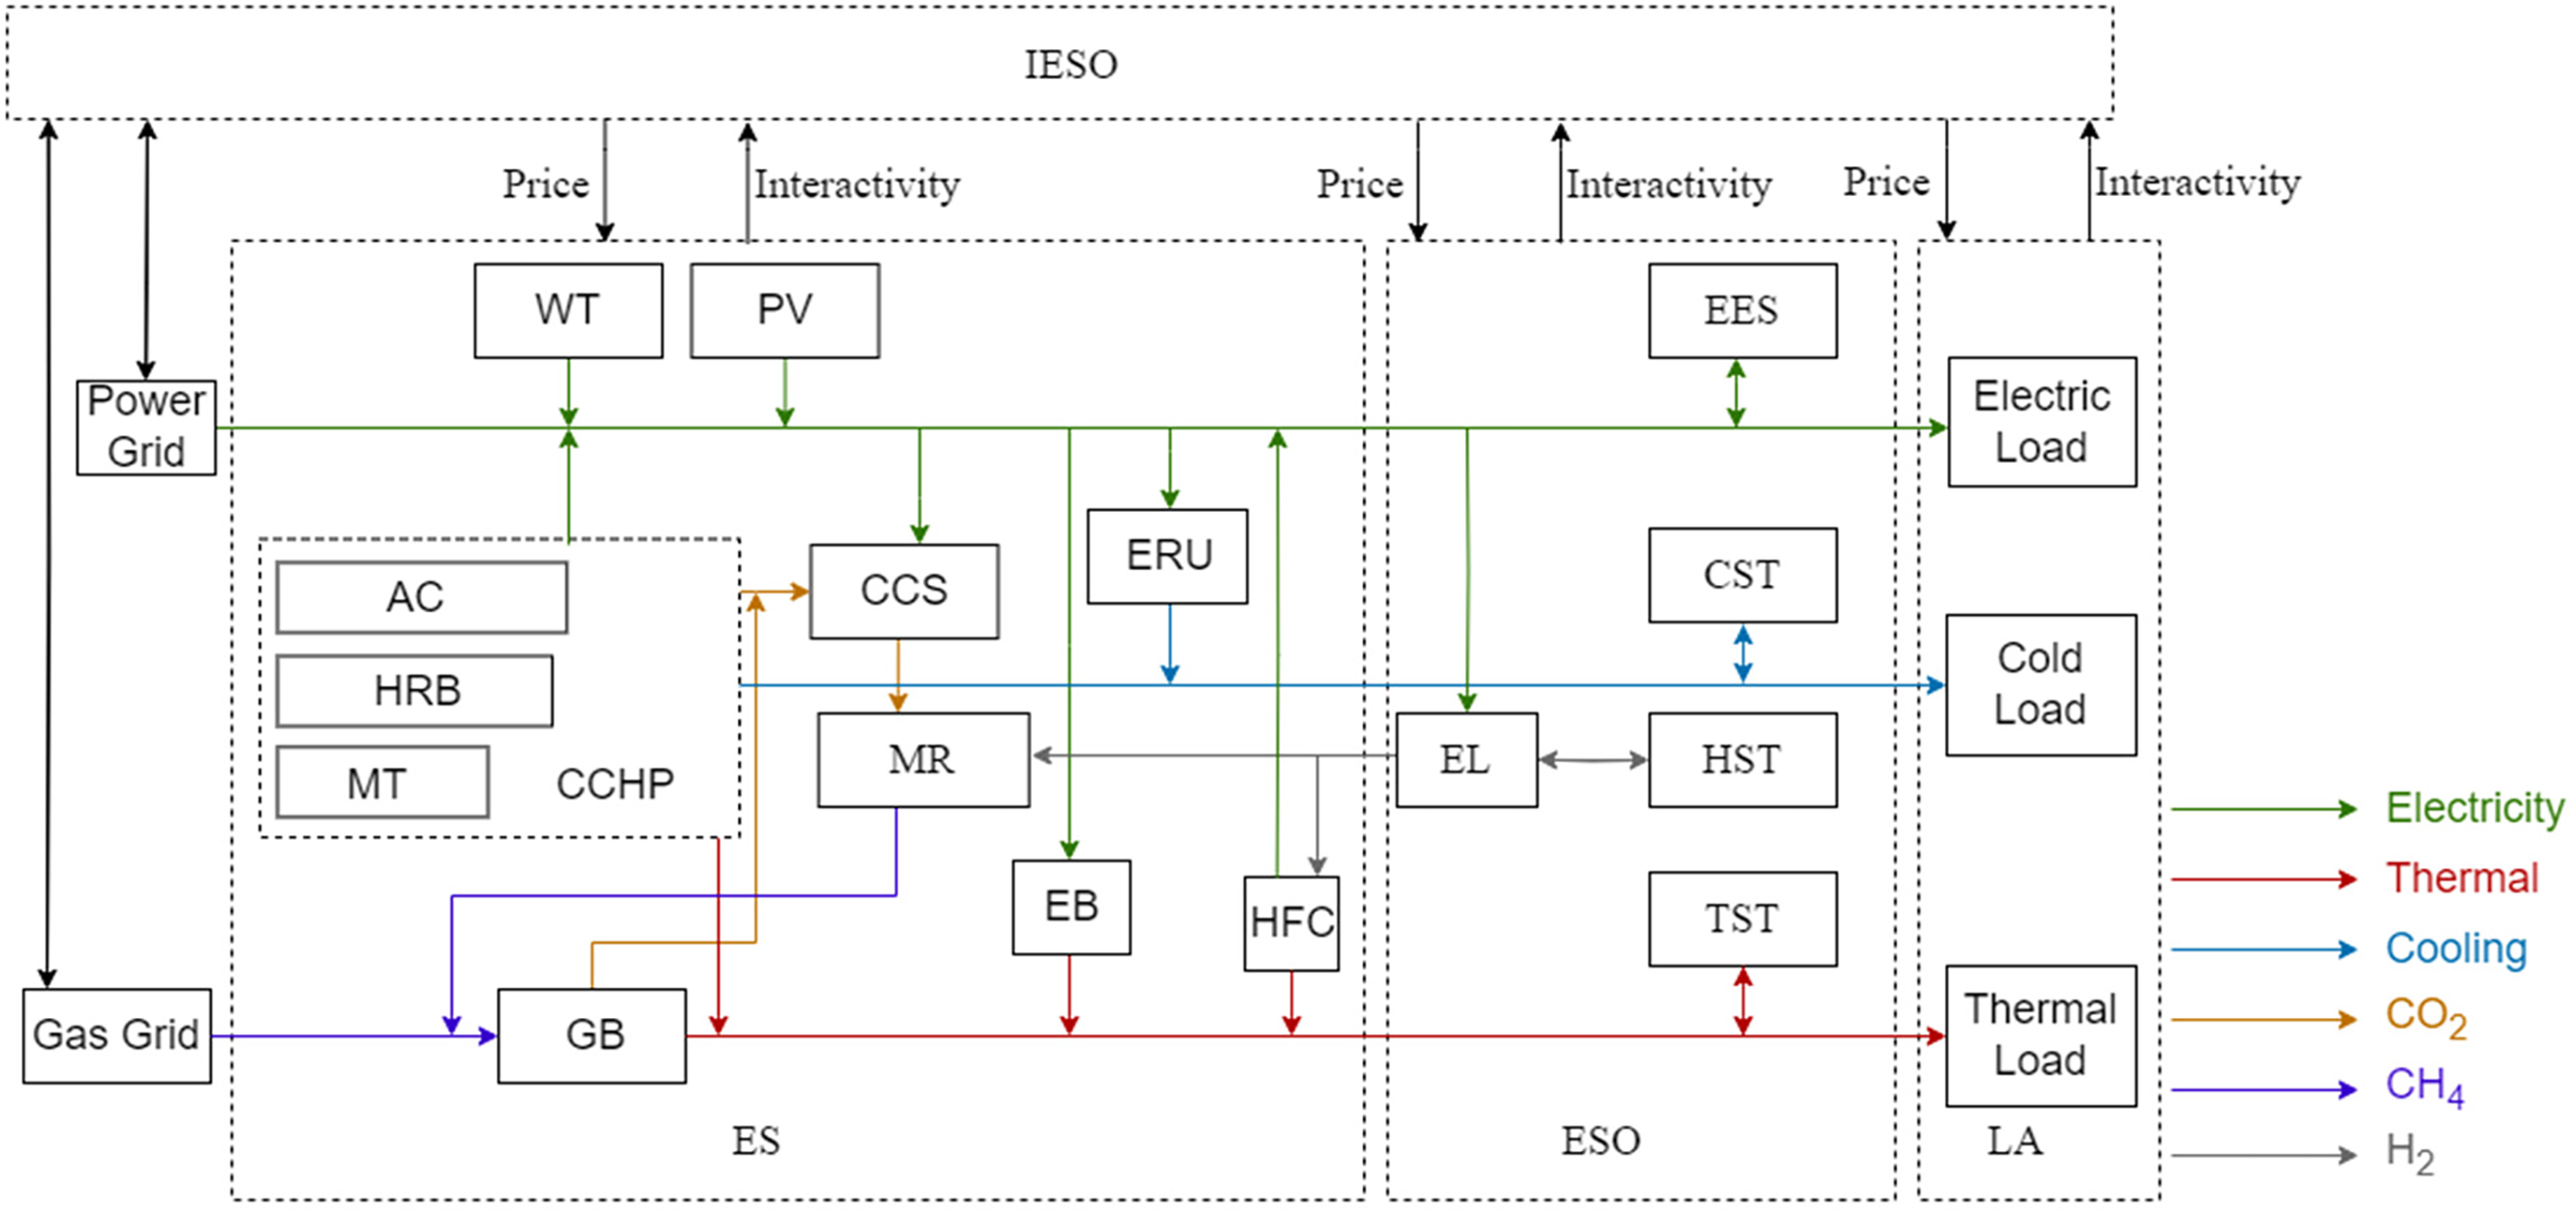
Figure 1: Structure of integrated regional energy system
The strategic behavior of IESO, ES, ESO and LA in the process of energy trading can be regarded as a kind of game, in which they formulate trading strategies and optimize the internal operation state according to their interests and environmental effects, respectively. The IESO is the coordinator and leader of the entire IES, assuming the three-way energy mobility and decision-making ability of source-load-storage, setting the energy purchase and sale prices according to the supply-demand relationship and market conditions, and purchasing the energy produced by the ES and selling it to the LA and the ESOs to earn profits. ES, as the energy supplier of IES, provides electricity, heat and cold energy to the system through multiple energy supply equipment. Aligning with the IESO’s established energy pricing framework, the ES dynamically optimizes the IES’s operational strategy to maximize profitability. ES also participates in the GCT and CET markets, taking the initiative to bear carbon emission penalties. LA re-optimizes load demand and reduces energy purchasing expenditures. ESO buys energy at a lower price to store it during low energy use periods and sells it at a higher price during peak energy use periods to make a profit.
3.1 CCS and P2G Coupling Model
CCS constitute climate mitigation frameworks that integrate post-combustion capture technologies with geological sequestration, targeting anthropogenic CO2 emissions from industrial flue streams and power generation units through mineralogical trapping mechanisms. The procedure begins with purifying flue gas by removing contaminants. A chemical solvent then interacts with CO2 in an absorption tower, isolating it from the gas stream. The pure CO2 is separated and transported by compression to a designated location, where it can be sequestered or used in the P2G process [20,21]. In the P2G process, the electrolysis cell (EL) and methane reactor (MR) are two key components. The EL utilizes electrical energy to break down water into hydrogen and oxygen, while the MR reacts CO2 with hydrogen to produce methane gas [22,23].
The advantage of coupling CCS with P2G is that it enables more efficient carbon cycling and emission reduction, thereby minimizing external carbon procurement expenditures and the risk of CO2 transportation. In addition, the energy expenditure of CCS systems is categorized into two primary components: fixed energy consumption and operational energy consumption. Fixed energy consumption refers to the energy and resources required to build the CCS equipment, which does not change with CCS operation. Operational energy consumption, on the other hand, exhibits a direct proportionality to the captured CO2 mass flow rate. In the coupled system, the CCS first captures and sequesters the CO2 released from the gas boilers and CCHP equipment in the system, and then uses the captured CO2 directly in the P2G process. In this way, it not only realizes CO2 reduction but also contributes to sustainable development. The coupled model of P2G and CCS is shown below:
where
The operational power constraints and climb constraints for carbon capture are:
where t denotes the moment;
P2G systems involve hydrogen generation through electrolytic cells as the initial stage of the energy conversion sequence. The operating power constraints and creep constraints of the electrolysis cell are:
where t denotes the moment;
Methanation is the next step, and the methane reactor is operated with power constraints and climb constraints:
where t denotes the moment;
CCHP unit integrates three core components—a gas turbine, waste heat recovery boiler, and absorption chiller—to simultaneously generate cooling, heating, and electricity through optimized natural gas utilization. This multi-functional design enhances energy efficiency while significantly reducing operational carbon footprints and energy waste. The mathematical model is shown below:
where
CCHP running power constraints and climbing power constraints are:
where t denotes the moment;
3.3 Models of Energy Conversion Equipment
GB generates thermal energy through the combustion of natural gas, and the model for this high-carbon emission device is as follows:
where
3.3.2 Electric Heating Boiler Model
Through electrothermal conversion, the boiler elevates water to steam or high-temperature liquid states to supply heat, which is modeled as follows:
where
3.3.3 Model of Electric Refrigerator
Through a series of compression, expansion and other processes, the electric refrigeration machine realizes the refrigeration of air or other media, converting electrical energy into cooling capacity, which is modeled as follows:
where
Photovoltaic systems transform sunlight into electrical energy. During operation, the generated power of PV panels correlates linearly with solar irradiance intensity. The output power of the photovoltaic unit is modeled as follows:
where
Wind power generation hinges on wind speed, but its variability demands rigorously defined operational limits (cut-in/cut-out speeds), which structure the model’s technical framework:
where
3.3.6 Hydrogen Fuel Cell Model
A hydrogen fuel cell converts the energy produced by burning hydrogen into electrical output and also produces a large amount of heat, which is modeled as follows:
where
3.4 Models of Energy Storage Device
The energy storage device includes hydrogen storage tank (HST), thermal storage tank (TST), electric energy storage (EES), and cold storage tank (CST), which are similar in the process of energy charging and discharging but differ in capacity storage. Attaining optimized energy storage and adaptive allocation demands coordinated integration of multi-energy systems to ensure equilibrium between energy generation and consumption. The mathematical model is as follows:
where
The constraints are the same for heat, electricity, cold, and hydrogen storage equipment, so only the heat storage constraints are described, and the same for electricity, cold, and hydrogen storage equipment constraints, which are as follows:
where
In compliance with China’s established carbon quota management scheme, carbon emission allowances have become an important trading asset in the market and can be freely traded in various carbon markets. In China, the initial allocation of allowances is generally done on a free-of-charge basis, and the government regularly accounts for the carbon emissions of enterprises to make timely adjustments to the allowances [24]. When there is a discrepancy between the actual production of the enterprise and the pre-quota, the government department will make up for the discrepancy according to the actual situation, to ensure the accuracy of the enterprise’s carbon emission quota [25,26]. The carbon emission allowances discussed in this paper cover three major categories: power purchase allowances, CCHP allowances, and GB allowances. Carbon allowance distribution for power procurement is proportional to the volume of electricity sourced from external grids, which predominantly rely on fossil-fuel-based generation. In the study, the CET mechanism is refined to the hour, and each hour is optimized to record the carbon quota and the corresponding carbon emission, and then liquidated by the hour at the end of a cycle. The expression is as follows:
where
The IES’s net carbon footprint aggregates direct emissions from CCHP and GB operations, indirect emissions linked to electricity procurement, and deducts emissions mitigated through P2G conversion processes. The expression is as follows:
where
Net carbon emissions E are actual carbon emissions minus compliance allowances allocated:
This study proposes a laddering carbon trading framework that imposes hierarchically defined emission constraints through segmented emission thresholds, contrasting with conventional homogeneous trading systems, thereby establishing compliance costs based on differentiated allowance allocation across defined carbon intensity brackets. The calculation model of CET is as follows:
where
4.2 Green Certificate Trading Mechanism
The GCT mechanism is based on the renewable energy generation quota, when the actual renewable energy power produced by the system fails to meet the established quota requirements, obligated entities procure green certificates to make up the difference, to achieve the renewable energy quota target. If the quota requirements are exceeded, it is possible to make a profit from the sale of green certificates. Analogous to laddered carbon trading, the study uses a laddered GCT mechanism. The model for GCT is as follows:
where
5 Modeling the Benefits of System’s Subjects
Due to the geographic location of the IES in the study, cooling is supplied to users from May to October, and heating is supplied to users from November to April. Although there is a difference in the way heat energy and cold energy are converted, the transaction mode is roughly the same, and this paper chooses to analyze the heat supply mode.
5.1 Integrated Energy System Operator Revenue Model
The IESO formulates bid-based energy pricing through continuous monitoring of generation-demand balances and market conditions, and when there is an imbalance between energy supply and demand in IES, IESO needs to interact with the main grid. The objective function of IESO mainly includes the trading revenue, operational expenditures for purchasing energy, and the cost of interacting with the higher level of the electricity, heat, and gas grids. The specific expressions are as follows:
where
To avoid LAs and ESOs trading directly with the main grid, the IESO shall establish procurement rates exceeding feed-in tariff benchmarks while implementing selling rates below the dynamic pricing structure of the time-of-use grid tariffs. To satisfy their interests, the purchase price of electricity should be smaller than the time-of-use grid tariffs and the sale price of electricity should be larger than the feed-in tariff. At the same time, the prices for purchasing and selling thermal energy are within a reasonable market price range, respectively, with the following constraints:
The IES is identical to the different forms of energy interaction constraints and only the grid interaction constraints are described. It is specified as follows:
where
5.2 Energy Supplier Revenue Model
Guided by the IESO’s pricing framework and demand conditions, the ES optimizes unit generation levels to enhance profitability through strategic operational adjustments. The ES maximum target revenue function is as follows:
where
5.3 Energy Storage Operator Revenue Model
Following the pricing signals set by the IESO for electricity transactions, the ESO optimizes energy storage charge/discharge patterns to balance supply-demand peaks and valleys, thereby generating revenue through grid stabilization. The ESO’s maximum target revenue function is as follows:
where
5.4 Load Aggregator Revenue Model
LA can regulate its flexible load distribution based on energy prices set by the IESO with the following maximum objective benefit function:
where
In the case of electrical loads, the constraints on the shifted loads are as follows:
where
In the case of electrical loads, the constraints on the curtailable loads are as follows:
where
6 Master-slave Game Framework for Integrated Energy Systems
In the IES, the multi-subject master-follower game describes the decision-making process in which IESO, ES, ESO and LA pursue the optimization of their respective objectives. ES, ESO and LA act as followers, optimizing their own strategies according to the price strategies of the IESO, the upper-level leader, and finally obtaining the optimal solution of the game equilibrium.
The formalized analytical structure representing the game’s dynamics is detailed below:
where P, S, and I are the participants, strategy sets, and payoffs of the master-slave game, respectively;
The specific set of strategies is listed below:
Balancing the game demands that followers adjust their behaviors optimally to the leader’s tactics, with the leader reciprocally incorporating these adjustments into its decision framework. In the equilibrium solution
The constraint conditions of the supply and demand balance of electricity, heat, gas, and hydrogen are as follows:
In the competitive electricity market with opaque information, the information of each interest body is not complete, so it is not convenient to optimize the strategy of the participants. The study employs a modified differential evolution algorithm as a decentralized equilibrium-solving strategy, while the IESO framework inherently operates under nonlinear dynamics. The problem is addressed using a differential evolution algorithm, with the resulting pricing solution transmitted to subordinate agents in the lower-tier hierarchy. The lower follower model belongs to the mixed integer linear model, which uses the CPLEX solver to calculate its benefits. The step-by-step methodology for resolving the problem is illustrated in Fig. 2.
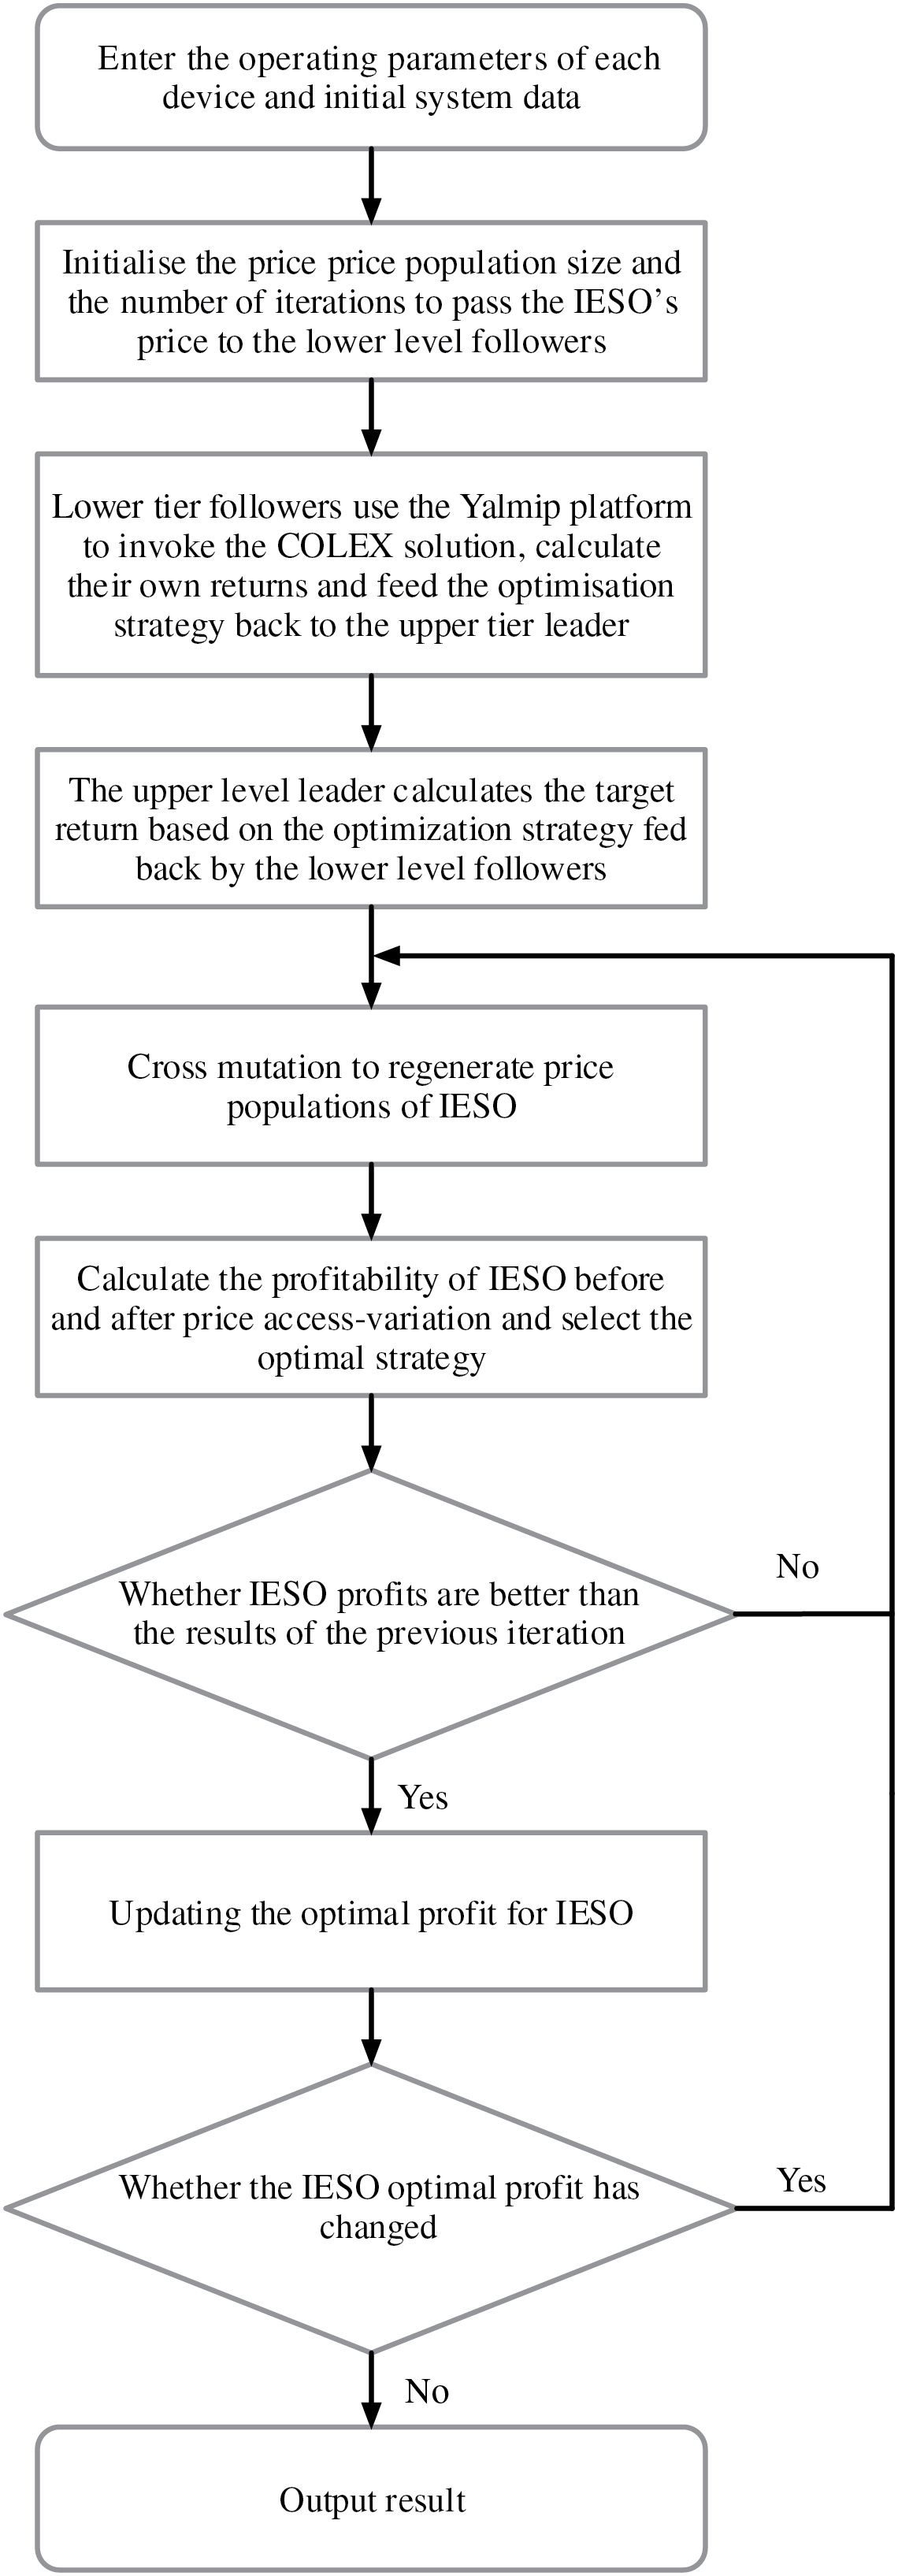
Figure 2: Flow chart of model solving
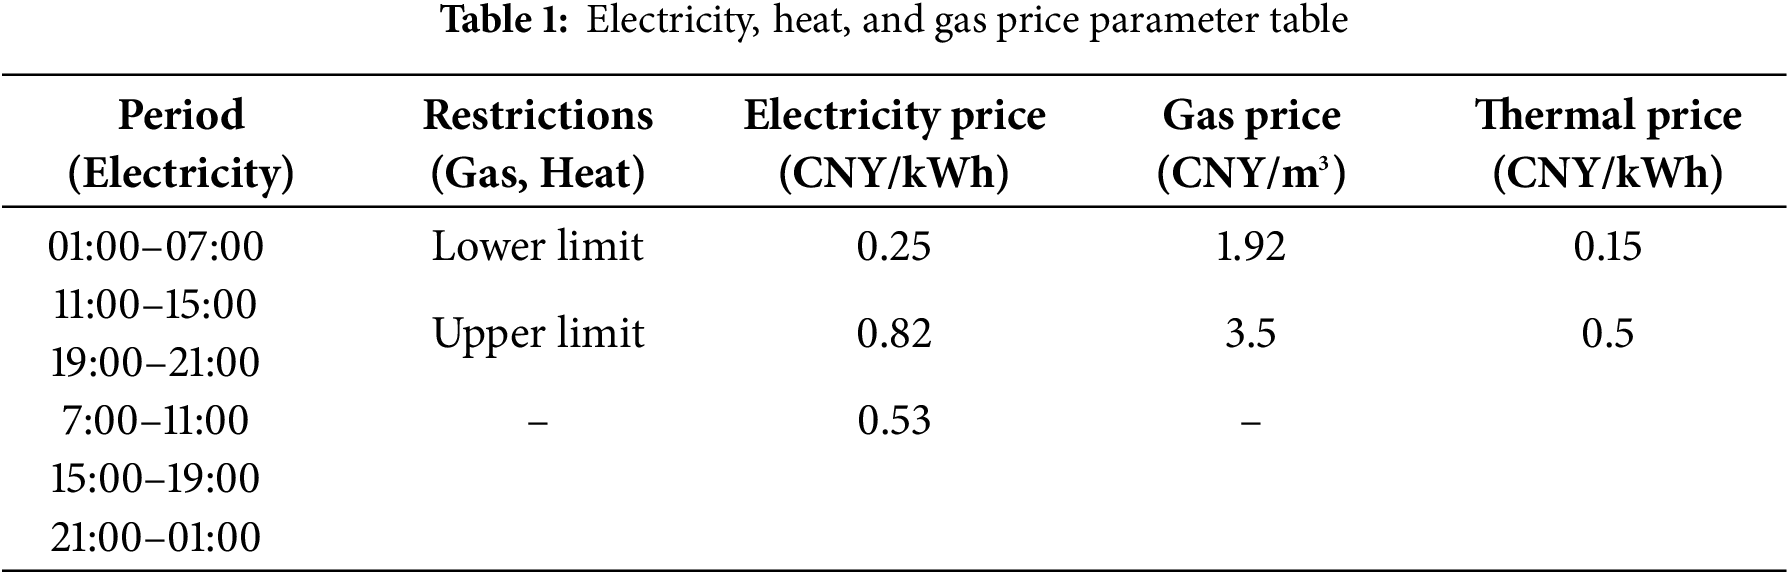
In this study, an IES in a region in western China is analyzed by arithmetic simulation. Fig. 3 presents the 24-h power prediction data for wind and solar energy production, as well as electricity and heat load demand patterns. Price-related data are summarized in Table 1, while Table 2 lists the technical specifications for the IES’s conversion equipment and the operational parameters of its multi-component energy storage units.
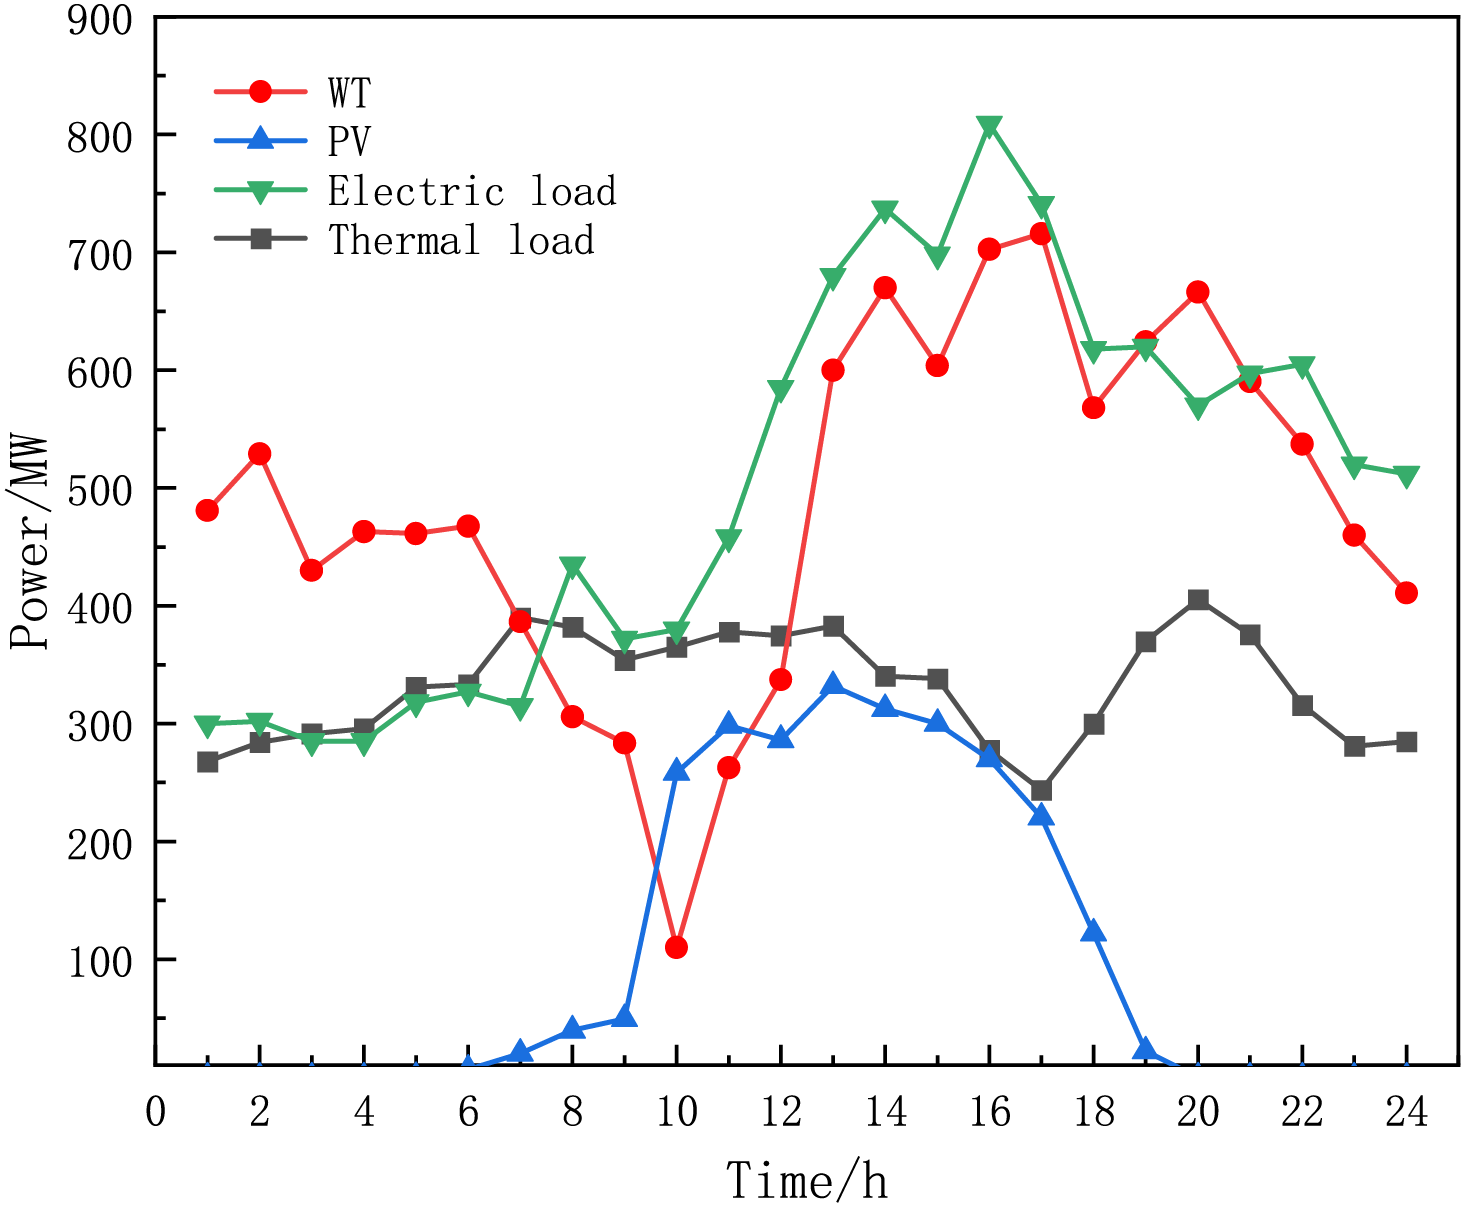
Figure 3: Power prediction curve

7.2 Analysis of Different Optimization Scenarios
This study establishes three comparative scenarios to evaluate how integrating P2G and CCS enhances both cost efficiency and carbon reduction in optimizing IES. Scenario 1 does without consider P2G and CCS coupling; Scenario 2 considers P2G and CCS coupling; and Scenario 3 considers P2G and CCS coupling but without a gaming framework. The comparison results of the above 3 scenarios in terms of operation are shown in Table 3.

The absence of CCS-P2G integration in Scenario 1, is as shown in Table 3, so carbon dioxide will be emitted into the atmosphere in large quantities, and the corresponding cost of carbon emissions becomes higher, which also makes the ability to consume wind power and PV lower. In addition, natural gas can only be obtained from the gas grid or electricity to gas, because Scenario 2 considers CCS and P2G equipment, so the choice becomes less relative to Scenario 2, the cost of purchasing gas becomes higher, and the total cost also increases by 250,200 yuan. The absence of CO2 capture and utilization mechanisms in Scenario 1 leads to elevated carbon market expenses and an additional 290.32 t of carbon emissions.
Scenario 2 uses more conversion energy equipment than the other scenarios, so it has a higher O&M cost. Nevertheless, its cumulative costs remain lower than those of Scenario 1, primarily due to diminished carbon market expenditures and reduced financial outlays for externally sourced energy procurement. In terms of carbon transaction costs, Scenario 2 reduces carbon emissions through carbon capture by converting carbon dioxide into natural gas through methanation, so the carbon transaction costs are 211,900 yuan less than Scenario 1. In terms of energy purchase costs, Scenario 2 can realize P2G conversion as well as carbon capture, which is more choices compared to the cost of purchasing natural gas from the gas grid, so the costs are also lower. In conclusion, Scenario 2, which considers CCS and P2G added at the same time, improves both the environmental and economic benefits of IES, and there is also a certain synergy effect between the two, which can further jointly enhance the system’s comprehensive advantages.
To assess the functional performance of the master-slave game framework in the optimal scheduling process, Scenario 2 and Scenario 3 can conduct a comparative performance evaluation. In Scenario 3, the ES trades directly with the upper networks, so the energy selling prices of the ES are the feed-in tariff, the lower limit of the heat price, and the lower limit of the gas price, and the purchasing prices are the time-sharing tariff, the upper limit of the heat price, and the upper limit of the gas price, respectively. In Scenario 2, the masters can obtain high profits, but the carbon emissions and O&M costs are high. This is because the real-time electricity, heat, and gas prices set by the IESO in the hierarchical decision-making paradigm incentivize the units to operate, however, the carbon capture as well as the hydrogen and natural gas production of the coupled CCS-P2G system have been lower than the carbon emissions as well as the hydrogen and natural gas consumption of the system. Therefore, the actual carbon emissions and the purchased energy increase as the output or energy consumption increases. Moreover, since IESO assumes the expenses associated with coordinating external power, heating, and gas systems, participants operating under the master-slave game framework can achieve higher financial gains. This outcome underscores the practical value of the master-slave approach in harmonizing the diverse interests of multiple stakeholders.
In summary, under the gaming framework, after considering the coupling of CCS and P2G, Scenario 2 is superior to the other scenarios both in terms of economic and environmental benefits, and can further improve the comprehensive benefits of the system. With the evolutionary refinement of the cap-and-trade framework, the synergistic co-benefits brought by Scenario 2 will further increase.
The optimization iteration process of each subject is shown in Fig. 4, where the subject in the master-slave game is the upper-level IESO, and the lower-level ES, ESO, and LA are on the side of the followers. The upper-level IESO transmits prices to the lower-level followers, and each follower calculates its revenue separately and uploads it to the upper-level leader, there is no information interaction between the lower-level followers, so it is a two-party game. As can be seen from Fig. 4, the convergence effect is achieved in the 130th iteration. Through iterative progression, the leader’s gain monotonically converges, while the follower’s gain shows an oscillating or decreasing trend, which reflects the game process between the subjects; when the game equilibrium is reached, the subject’s gain is no longer significantly changed, which indicates that either subject can not independently change the strategy to obtain higher the return of each subject is no longer obvious change after reaching the game equilibrium. This proves that in the two-party master-slave game framework of the leader IESO and the follower reached the equilibrium solution of the game.
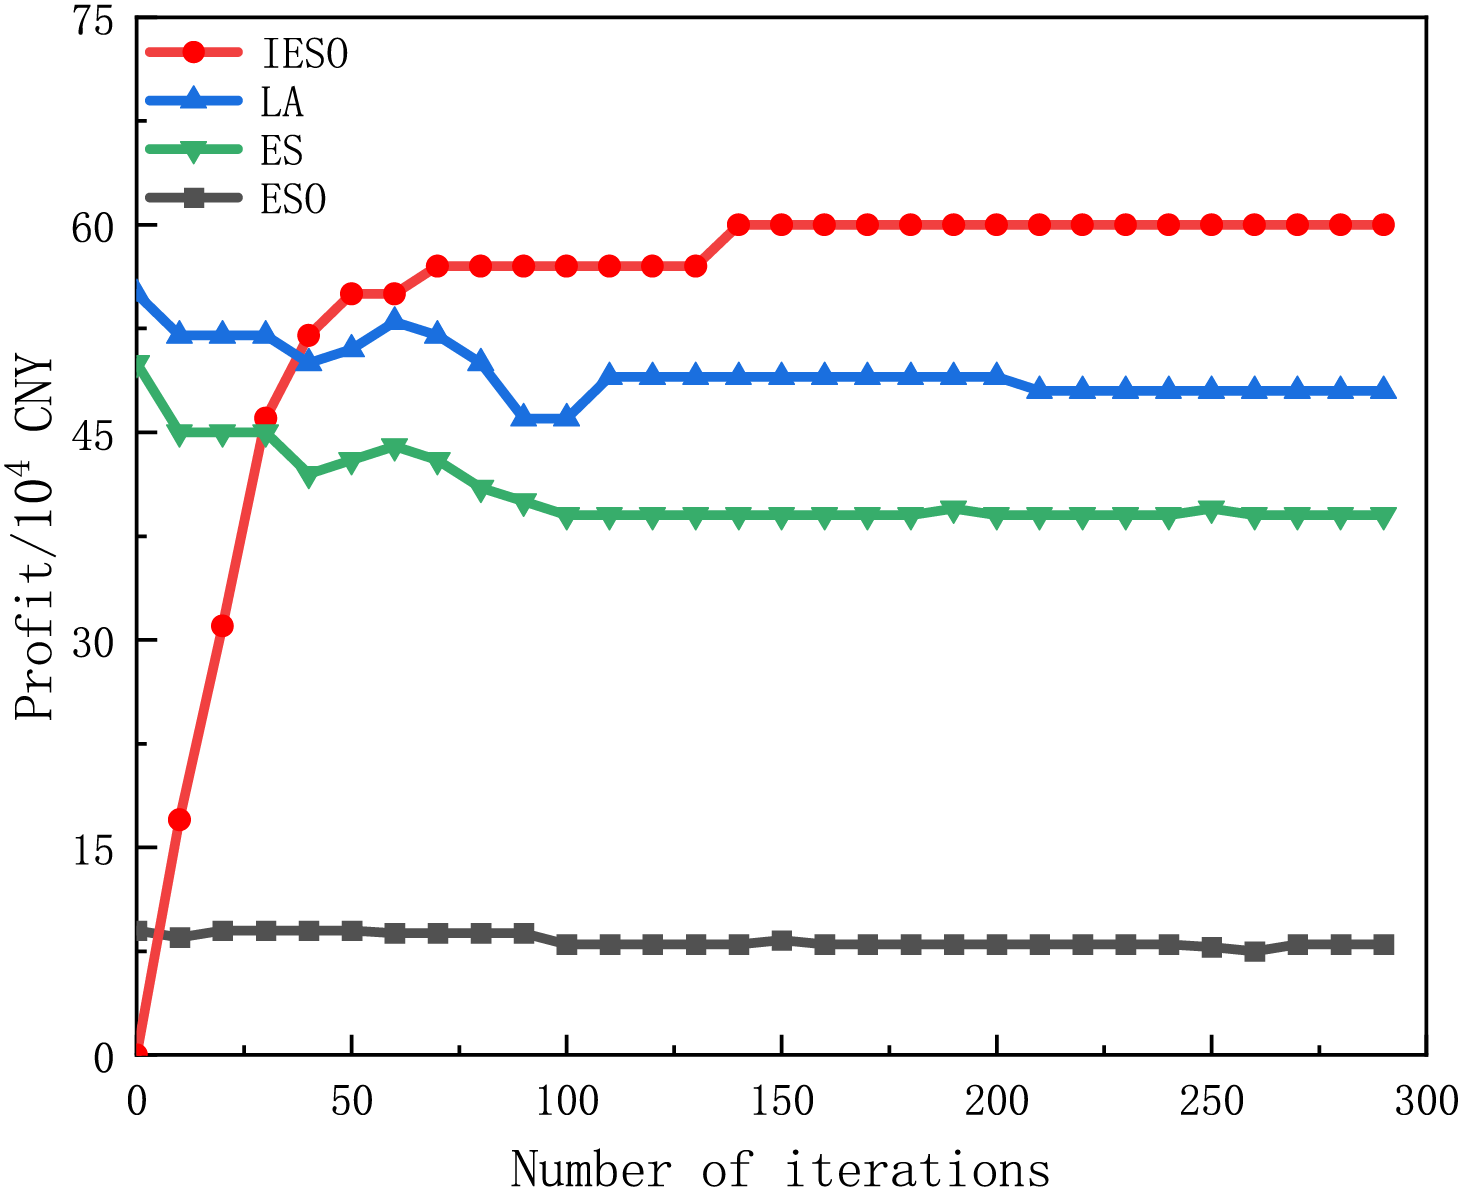
Figure 4: Convergence results
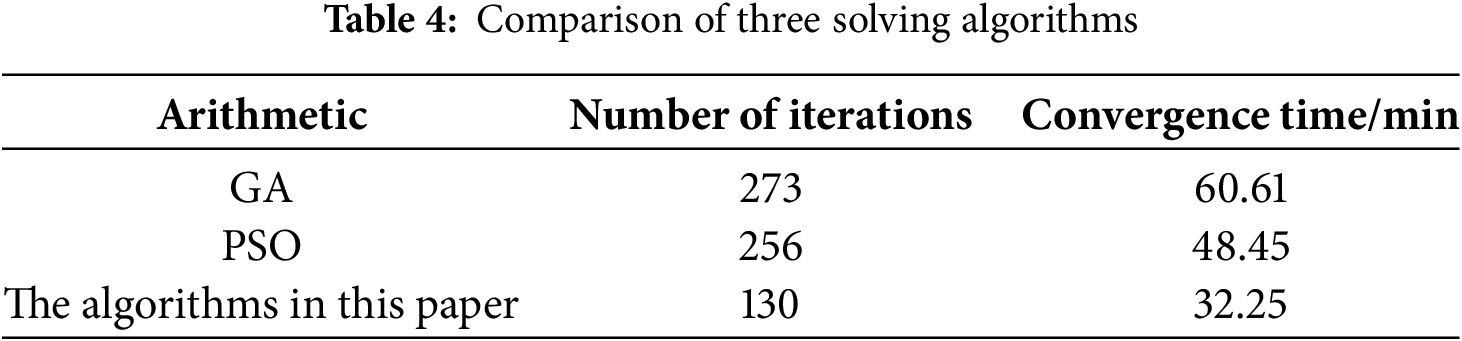
In addition, in terms of mutation operation, in contrast to the traditional genetic algorithm (GA) and particle swarm optimization (PSO) algorithm which have the phenomenon of early convergence, the method used in this paper is improved in the inertia weights, which makes the convergence speed faster. Our hybrid optimizer outperformed conventional GA and PSO, respectively, in the convergence time, as detailed in Table 4’s three-way comparative analysis. The algorithms in this paper have significant improvements over the 2 traditional algorithms in terms of the number of iterations and convergence time. The proposed hybrid computational framework, integrating a modified differential evolution architecture with a decentralized quadratic programming equilibrium formulation, ensures the privacy of each subject’s commercial information and enhances its global optimization-seeking ability, allowing the game strategy to be optimized optimally compared to traditional GA and PSO.
7.3 Sensitivity Analysis of Market Trading Mechanisms
A parameter sensitivity assessment of the emissions trading framework (GCT-CET) was performed under Scenario 3 operational parameters. As depicted in Fig. 5, the system exhibits inverse cost elasticity to CET baseline price adjustments when GCT pricing remains constant, while demonstrating positive cost sensitivity to GCT benchmark variations under fixed CET parameters, revealing critical cross-market interaction effects. This is because GCT and CET base prices affect the incentives of GCT and CET interactions. On the one hand, when the GCT base price is lower, the incentives of GCT and CET interactions increase, and ESs are more inclined to use the excess green certificates to offset part of their carbon emissions, thus obtaining more carbon credits and minimizing the cost of CET. On the other hand, when the GCT base price is high, ES must bear high CET costs. When weakening market interaction significantly amplifies compliance costs, confirming the joint mechanism’s ability to internalize carbon externality costs through enhanced price signal transmission efficiency.
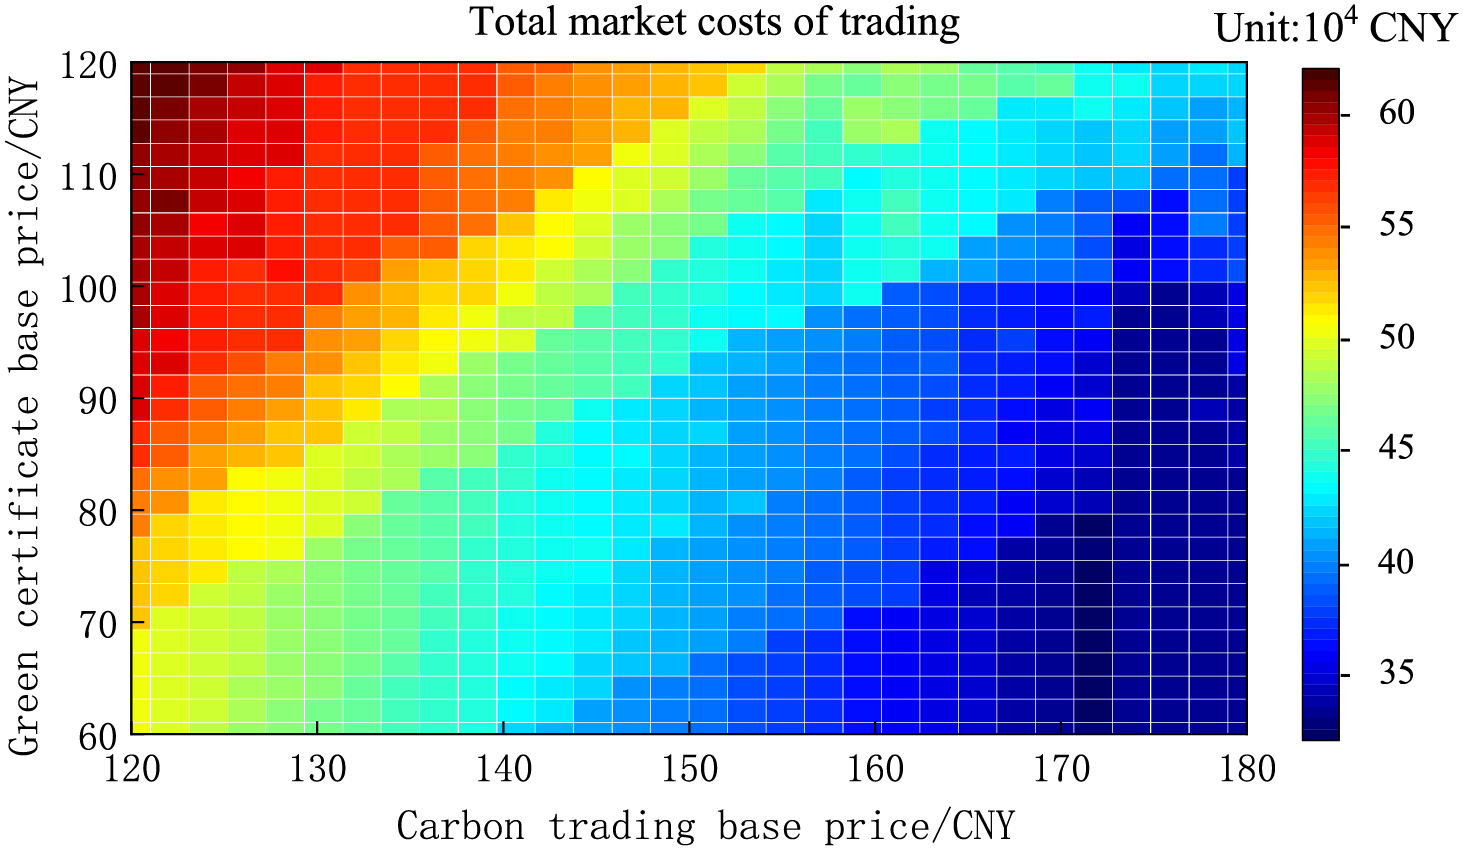
Figure 5: Total costs of GCT-CET
7.4 Sensitivity Analysis of Market Trading Mechanisms
The electric power balance diagram when reaching the game is shown in Fig. 6. ES power supply resources are mainly photovoltaic, wind turbine, gas turbine, coal-fired unit, and fuel cell. The observed 24-h dispatch dominance of gas turbine units over coal-fired counterparts stems from the comparative economic advantage where the total levelized expenditure (comprising operational maintenance and carbon pricing externalities) of coal generation exceeds the fuel procurement expenditures of natural gas combustion systems. From the point of view of economic and environmental friendliness, gas turbines are better than coal-fired units. During 01:00–07:00, the PV unit cannot generate electricity and the electric load is in the valley load period, but due to the wind at night, the gas turbine is affected by the heat to determine the power also needs to output part of the heat, thus causing the electric load supply exceeds demand, the price of electricity is relatively low, in this period ESO to purchase electricity at a low price to be stored in the battery. In 11:00–15:00 and 19:00–23:00 this period the electric load demand is large, and the price of electricity is relatively high, in addition to gas turbines and photovoltaic wind turbines mainly to provide electricity, the lack of part of the ESO to provide, the ESO in the peak period of electricity will be stored in the battery power to sell, through this method to realize arbitrage.
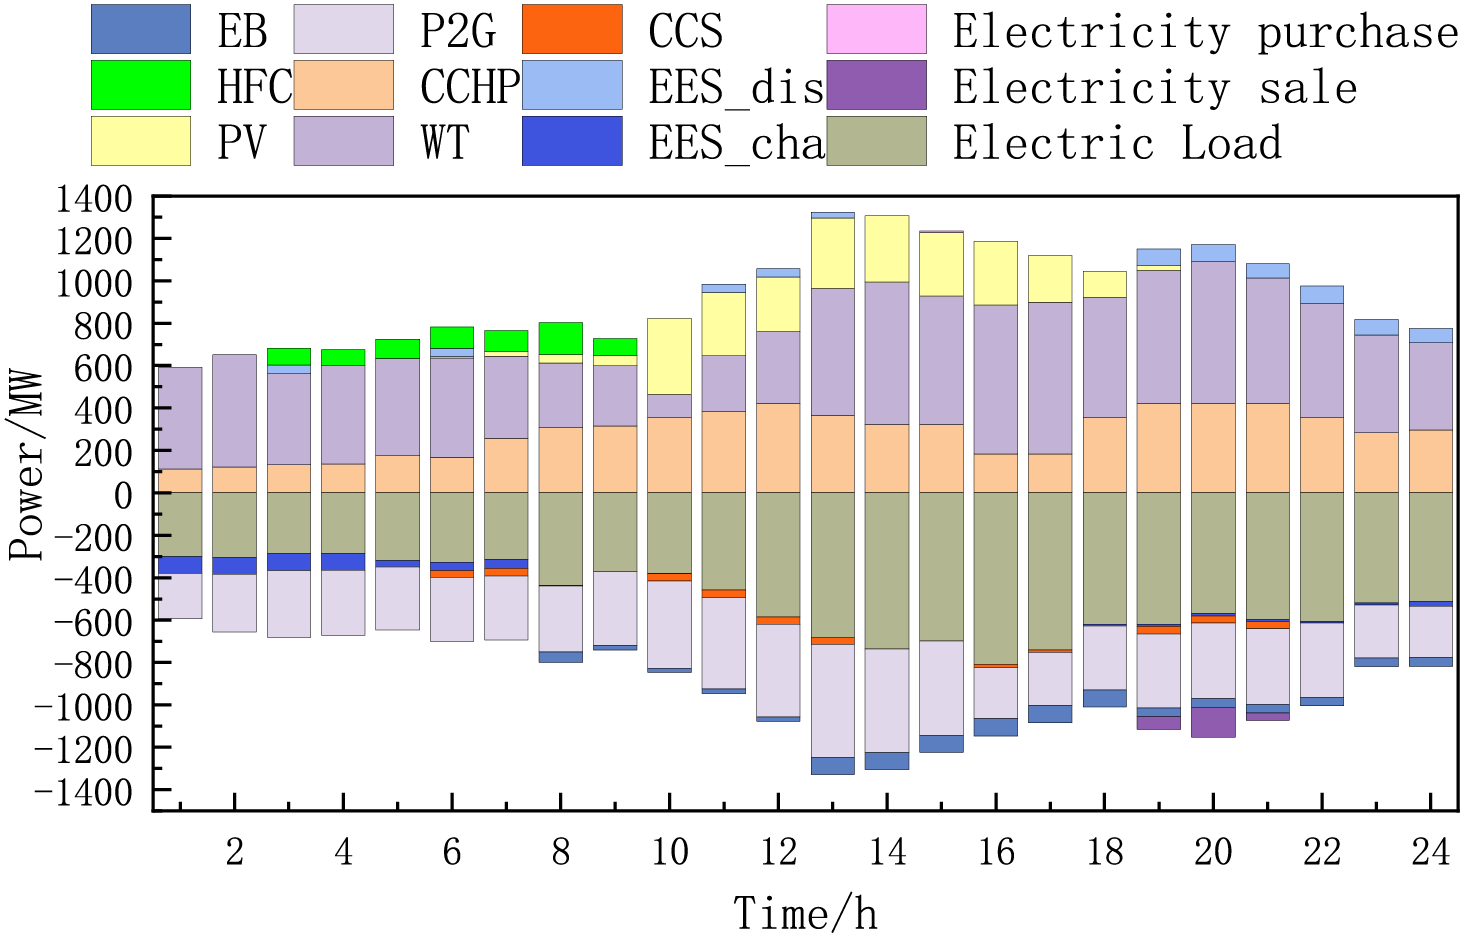
Figure 6: Electric power balance diagram
The heat power balance diagram when reaching the game is shown in Fig. 7. The main ES heating resources are electric boilers, gas boilers, CCHP units, and fuel cells. Overall, the CCHP heat supply is larger than GB, which is because GB has lower carbon emissions than the gas boiler and a corresponding lower carbon trading cost. During the periods 10:00–14:00 and 19:00–21:00, the output of the CCHP unit increases, and during this time, ESO purchases excess heat at a low price to be stored in TST. In addition, the demand is met by regulating the thermal power and utilizing the charge-discharge cycle of storage equipment. During the period from 22:00 to 2:00, IESO purchases heat at a higher price, gas boiler output increases, and the shortfall is supplemented through TST selling heat at a higher price.
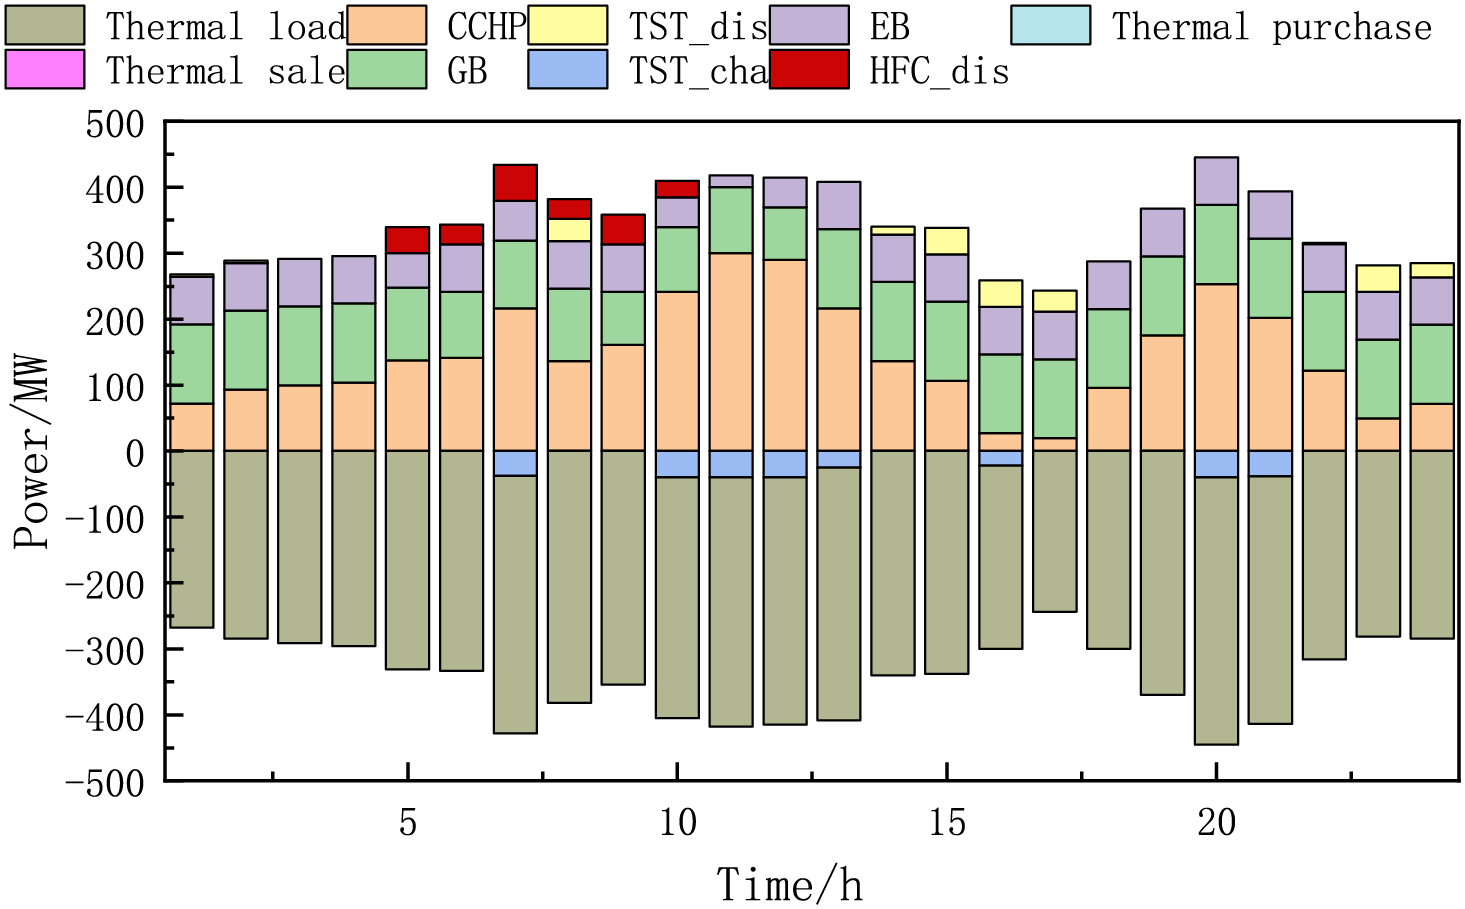
Figure 7: Heat power balance diagram
The gas power balance diagram when reaching the game is shown in Fig. 8. The gas supply resources are gas purchased from the main network and gas produced by mechanization. The gas-using resources are gas boilers and gas turbines. During the period of 06:00–12:00, the gas purchased from the main grid is mainly relied on, and the gas produced by mechanization decreases to provide gas power for the CCHP unit. During the period 19:00–21:00, gas purchases increase, methane production decreases and gas turbines continue to produce power.
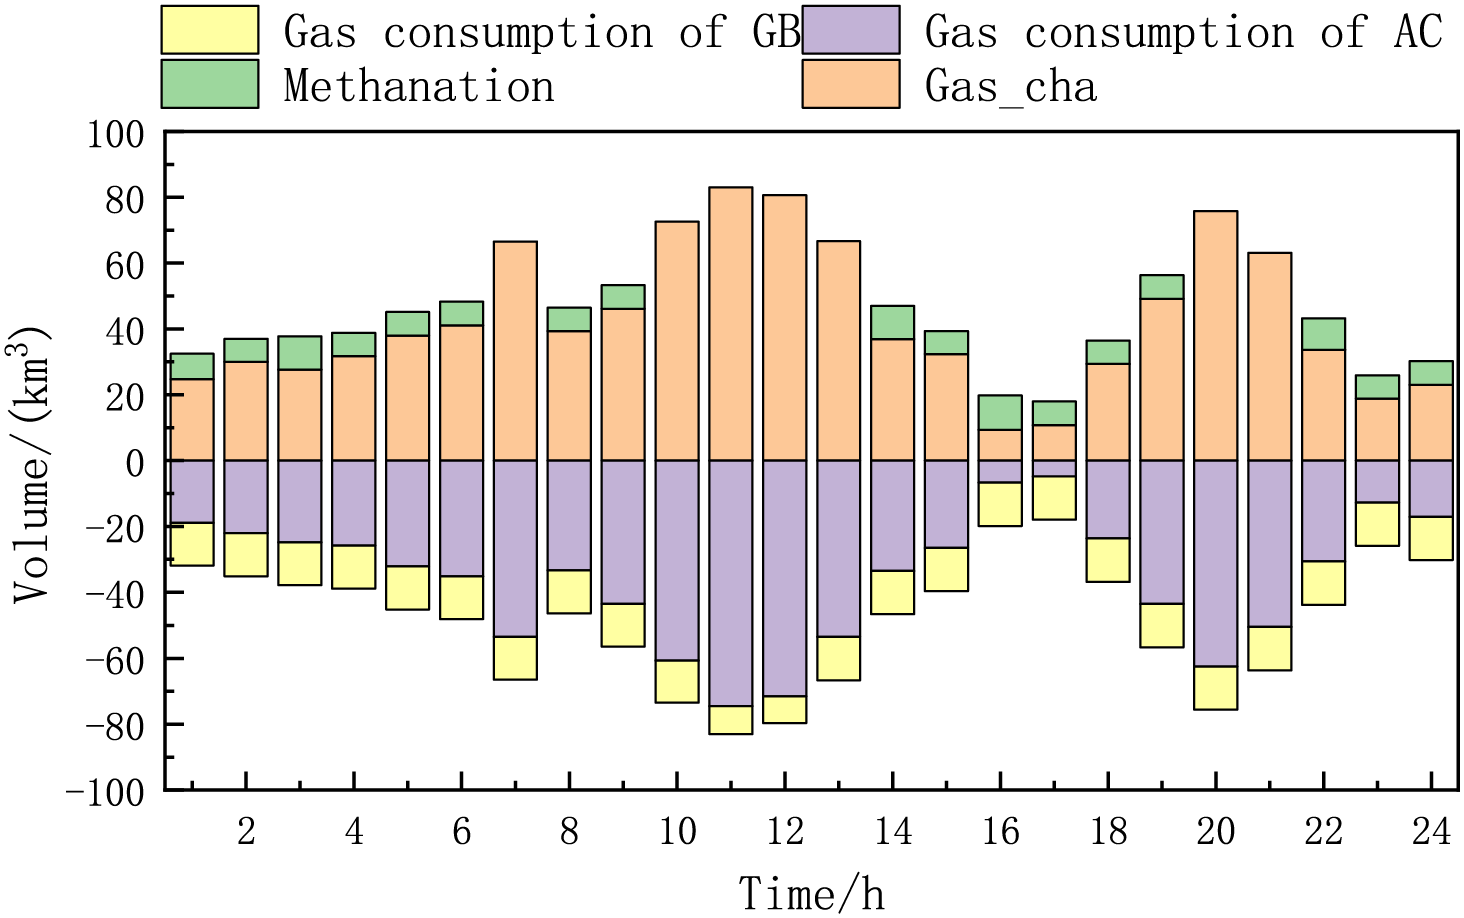
Figure 8: Gas power balance diagram
The hydrogen power balance diagram when reaching the game is shown in Fig. 9. During valley load periods, alkaline electrolysis cell are employed to transform surplus renewable generation from wind-PV systems into hydrogen for pressurized storage. Conversely, in peak demand intervals, regenerative fuel cells activate to deliver combined heat and power generation through hydrogen oxidation, thereby establishing a demand-side management strategy with ancillary service provision capabilities. In addition to this, a certain amount of high-purity hydrogen can be sold, providing a new profit model for the ESO. Hydrogen storage equipment not only plays the role of elimination but also reduces the energy consumption of non-essential equipment. The addition of CCS and P2G reduces the carbon emission cost of ES greatly reduced, and even enables the system to obtain carbon trading income, enriching the system’s source of income, so CCS, P2G, and HST also have important synergistic effects in improving the system’s economy.
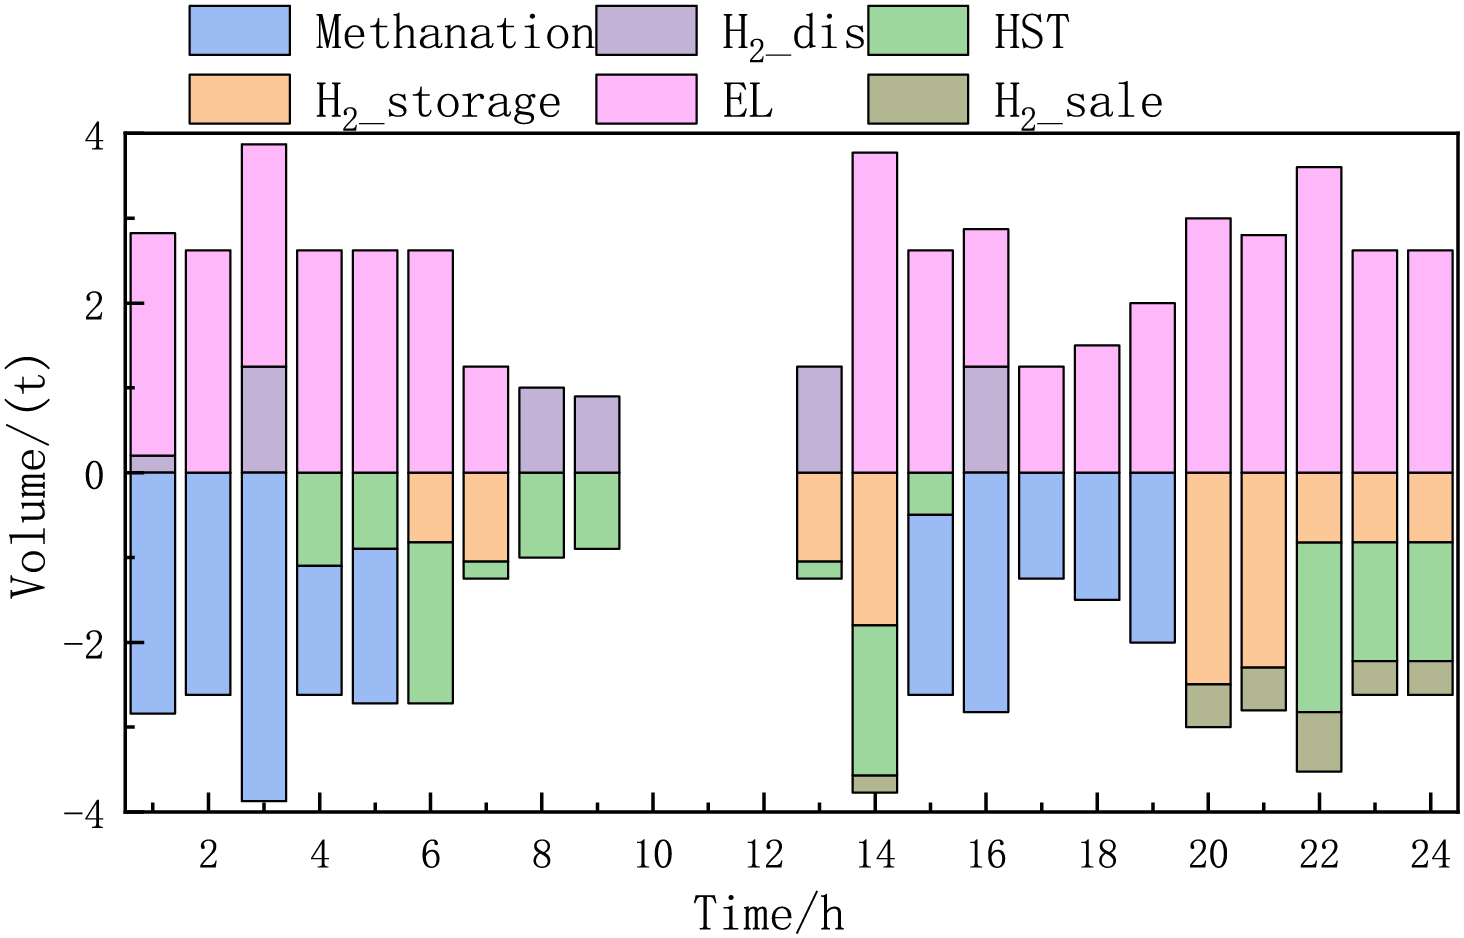
Figure 9: Hydrogen power balance diagram
In this paper, to realize the low-carbon economic benefits of the IES, an optimization model of the IES considering CCS and P2G synergy under the game framework is proposed. Based on the premise of protecting the privacy of each subject and improving the economy and stability, IESO is taken as the upper-level leader, and ES, ESO, and LA are the lower-level followers, and the operation optimization strategy is formulated under the master-slave game framework. Practical numerical analyses conclusively yield the following determinations.
(1) Considering the interaction between source-load-storage, IESO implements dynamic pricing mechanisms to coordinate ES system dispatch, ESO charge-discharge cycles, and LA demand response patterns. Through optimizing a reasonable price strategy, and reaching the game equilibrium state after many games to establish a multi-agent collaborative dispatching framework for heterogeneous energy carriers.
(2) CCS and P2G coupling can enhance new energy consumption capacity, reduce carbon emissions, optimize energy conversion and storage, enhance system flexibility, and improve economic efficiency, as well as have a certain reference value for IES market decision-making. With hydrogen energy storage, synergistic operation can play the role of cost reduction and efficiency. Consequently, the pathways for achieving low-carbon synthesis and multifaceted deployment of hydrogen energy systems warrant systematic investigation in subsequent research endeavors.
(3) A systematic evaluation of the market trading mechanism’s operational efficacy is conducted. The adoption of GCT and CET mechanisms can effectively stimulate the carbon reduction potential of IES and broaden the space of IESO’s price strategy, making the whole game process more flexible.
Acknowledgement: Not applicable.
Funding Statement: This work was supported by the National Natural Science Foundation of China (No. 52077137).
Author Contributions: Study conception and design: Yunfeng Liu; data collection: Yunfeng Liu, Ximin Cao; analysis and interpretation of results: Yunfeng Liu, Yanchi Zhang; draft manuscript preparation: Yunfeng Liu; review and editing: Ximin Cao. All authors reviewed the results and approved the final version of the manuscript.
Availability of Data and Materials: The data presented in this study are available on request from the corresponding author. The data are not publicly available due to patent protection.
Ethics Approval: Not applicable.
Conflicts of Interest: The authors declare no conflicts of interest to report regarding the present study.
Nomenclature
| IES | Integrated energy system |
| CCS | Carbon capture system |
| P2G | Power-to-gas |
| IESO | Energy system operator |
| ES | Energy suppliers |
| ESO | Energy storage operators |
| LA | Load aggregators |
| WT | Wind turbine |
| PV | Photovoltaic |
| GB | Gas boiler |
| EB | Electric boiler |
| MT | Microturbine |
| HRB | Heat recovery boiler |
| AC | Absorption chiller |
| HFC | Hydrogen fuel cell |
| ERU | Electric refrigeration unit |
| CCHP | Combined cooling, heating, and power |
| EL | Electrolysis cell |
| MR | Methane reactor |
| EES | Electric energy storage |
| TST | Thermal storage tank |
| HST | Hydrogen storage tank |
| CET | Carbon emission trading |
| GCT | Green certificate trading |
References
1. Zhang B, Shao C, Li C, Guo T, Lei A, Guan X, et al. Optimal scheduling of an electric-hydrogen-integrated energy system considering virtual energy storage. Front Energy Res. 2024;12:1359123. doi:10.3389/fenrg.2024.1359123. [Google Scholar] [CrossRef]
2. Li L, Jin W, Shen M, Yang L, Chen F, Wang L, et al. Coordinated dispatch of integrated energy systems considering the differences of multiple functional areas. Appl Sci. 2019;9(10):2103. doi:10.3390/app9102103. [Google Scholar] [CrossRef]
3. Chen Z, Zhang Y, Ji T, Cai Z, Li L, Xu Z, et al. Coordinated optimal dispatch and market equilibrium of integrated electric power and natural gas networks with P2G embedded. J Mod Power Syst Clean Energy. 2018;6(3):495–508. doi:10.1007/s40565-017-0359-z. [Google Scholar] [CrossRef]
4. Herzog H. Scaling up carbon dioxide capture and storage: from megatons to gigatons. Energy Econ. 2011;33(4):597–604. doi:10.1016/j.eneco.2010.11.004. [Google Scholar] [CrossRef]
5. Wu Q, Li C. Modeling and operation optimization of hydrogen-based integrated energy system with refined power-to-gas and carbon-capture-storage technologies under carbon trading. Energy. 2023;270(1–5):126832. doi:10.1016/j.energy.2023.126832. [Google Scholar] [CrossRef]
6. Franki V, Višković A, Šapić A. Carbon capture and storage retrofit: case study for Croatia. Energy Sources Part A Recovery Util Environ Eff. 2021;43(24):3238–50. doi:10.1080/15567036.2019.1587077. [Google Scholar] [CrossRef]
7. Prakash D, Singh O. Thermo-economic study of combined cycle power plant with carbon capture and methanation. J Clean Prod. 2019;231(4):529–42. doi:10.1016/j.jclepro.2019.05.217. [Google Scholar] [CrossRef]
8. Voll D, Wauschkuhn A, Hartel R, Genoese M, Fichtner W. Cost estimation of fossil power plants with carbon dioxide capture and storage. Energy Proc. 2012;23:333–42. doi:10.1016/j.egypro.2012.06.038. [Google Scholar] [CrossRef]
9. Zhou R, Xiao J, Tang X, Zheng Q, Lu J, Cao J. Coordinated opti-mization of carbon utilization between power-to-gas renewable energy accommodation and carbon capture power plant. Electr Power Autom Equip. 2018;38(7):61–7. (In Chinese). [Google Scholar]
10. Jiao SM, Qiao XB, Li Y, Yao TY, Cao YJ.Joint optimal configuration of P2G equipment and PV considering life-cycle carbon emissions and carbon trading of IES. Electr Power Autom Equip. 2021;41(9):156–63. [Google Scholar]
11. Zhou R, Deng Z, Xu J, Zhu J, Wang Y. Optimized operation using carbon recycling for the benefit of virtual power plant with carbon capture and gas thermal power. Electr Power. 2020;53(9):166–71. [Google Scholar]
12. Zhang B, Xia Y, Peng X. Robust optimal dispatch strategy of integrated energy system considering CHP-P2G-CCS. Glob Energy Interconnect. 2024;7(1):14–24. doi:10.1016/j.gloei.2024.01.002. [Google Scholar] [CrossRef]
13. Wang J, Mao J, Hao R, Li S, Bao G. Multi-energy coupling analysis and optimal scheduling of regional integrated energy system. Energy. 2022;254:124482. doi:10.1016/j.energy.2022.124482. [Google Scholar] [CrossRef]
14. Bo Y, Li YL, Sun YX, Liu WQ. A critical review of microgrid power trading based on game theory. J Kunming Univ Sci Technol. 2023;48(3):105–18. (In Chinese). [Google Scholar]
15. Zhang X, Zhang Y. Multi-objective optimization model for park-level electricity-heat-gas integrated energy system considering P2G and CCS. Electr Power Constr. 2020;41(12):90–9. (In Chinese). [Google Scholar]
16. Shakrina Y, Margossian H. A Stackelberg game-inspired model of real-time economic dispatch with demand response. Int Trans Electr Energy Syst. 2021;31(11):e13076. doi:10.1002/2050-7038.13076. [Google Scholar] [CrossRef]
17. Wu H, Liu Y, Yang Q, Xu L, Zhong L. Optimal RIES operation strategy based on sistributionally robust game considering demand response. Electr Power Constr. 2022;43:108–18. (In Chinese). [Google Scholar]
18. Yan J, Duan ZQ, Gao JM, Chen SY, Zhou B, Wang YJ. Coordinated control strategy of electricity-heat-gas integrated energy system considering renewable energy uncertainty and multi-agent mixed game. Front Energy Res. 2022;10:943213. doi:10.3389/fenrg.2022.943213. [Google Scholar] [CrossRef]
19. Ye Y, Xing H, Mi Y, Yan Z, Dong J. Low-carbon optimal scheduling of integrated energy system considering low-carbon demand response and Stackelberg game. Autom Electr Power Syst. 2024;48(9):34–43. (In Chinese). doi:10.1016/j.energy.2024.131928. [Google Scholar] [CrossRef]
20. Moghaddam AH, Esfandyari M, Jafari D, Sakhaeinia H. Multi-factor optimization of bio-methanol production through gasification process via statistical methodology coupled with genetic algorithm. Results Eng. 2023;20:101477. doi:10.1016/j.rineng.2023.101477. [Google Scholar] [CrossRef]
21. Moghaddam AH, Esfandyari M, Sakhaeinia H. Optimization of amine-based carbon capture: simulation and energy efficiency analysis of absorption section. Results Eng. 2024;24:103574. doi:10.1016/j.rineng.2024.103574. [Google Scholar] [CrossRef]
22. Jordehi AR, Mansouri SA, Tostado-Véliz M, Safaraliev M, Hakimi SM, Nasir M. A tri-level stochastic model for operational planning of microgrids with hydrogen refuelling station-integrated energy hubs. Int J Hydrogen Energy. 2024;96(2):1131–45. doi:10.1016/j.ijhydene.2024.11.401. [Google Scholar] [CrossRef]
23. Jordehi AR, Mansouri SA, Tostado-Véliz M, Sirjani R, Safaraliev M, Nasir M. A three-level model for integration of hydrogen refuelling stations in interconnected power-gas networks considering vehicle-to-infrastructure (V2I) technology. Energy. 2024;308(1):132937. doi:10.1016/j.energy.2024.132937. [Google Scholar] [CrossRef]
24. Xiao B, Liu J, Zhang B, Wu F. Optimal configuration of grid-connected microgrid with hydrogen energy storage considering ladder-type carbon trading and demand response. Electr Power Autom Equip. 2023;43(1):121–9. (In Chinese). doi:10.3390/en17010139. [Google Scholar] [CrossRef]
25. Wang L, Liu X, Li Y, Chang D, Ren X. Low-carbon optimal dispatch of integrated energy system considering demand response under the tiered carbon trading mechanism. Electr Power Constr. 2024;45(02):102–14. (In Chinese). doi:10.21203/rs.3.rs-4782796/v1. [Google Scholar] [CrossRef]
26. Zhang H, Zhang R, Zhou J, Sun F, Jiang D. Low-carbon economic dispatch of integrated energy system in campus based on stackelberg game and hybrid carbon policy. Acta Energiae Solaris Sin. 2023;44(9):9–17. (In Chinese). [Google Scholar]
Cite This Article
 Copyright © 2025 The Author(s). Published by Tech Science Press.
This work is licensed under a Creative Commons Attribution 4.0 International License , which permits unrestricted use, distribution, and reproduction in any medium, provided the original work is properly cited.
 Downloads
 Citation Tools