
 Submit a Paper
 Propose a Special lssue
 Open Access
ARTICLE

Simulation on H2S Migration and Elutriation during Cyclic Operationof Underground Sour Gas Storage
1 Chongqing Gas District, PetroChina Southwest Oil & Gasfield Company, Chongqing, 400021, China
2 School of Petroleum Engineering, Chongqing University of Science and Technology, Chongqing, 401331, China
* Corresponding Author: Shilai Hu. Email:
(This article belongs to the Special Issue: Integrated Geology-Engineering Simulation and Optimizationfor Unconventional Oil and Gas Reservoirs)
Energy Engineering 2025, 122(7), 2819-2843. https://doi.org/10.32604/ee.2025.065481
Received 14 March 2025; Accepted 29 April 2025; Issue published 27 June 2025
 View Full Text
 Download PDF
Abstract
The construction and operation of sulfur-containing gas storage are often more difficult than a non-sulfur storage facility due to the need to prevent environmental contamination from H2S leaks, as well as the corrosive effects of H2S on production facilities. Rapid elutriation of H2S from the reservoir during the construction of the gas storage is an effective way to avoid these problems. However, the existing H2S elutriation method has low efficiency and high economic cost, which limits the development of reconstructed gas storage of sulfur-containing gas reservoirs. To improve the efficiency of H2S elutriation in sulfur-containing gas reservoirs and enhance the economic benefits, a numerical simulation model of multiphase flow components was established to study the migration law of H2S in the multi-cycle operation of gas storage. Based on the H2S migrate law, the displacement H2S elutriation method was developed, and the elutriation mechanism and elutriation efficiency of the two methods were compared and analyzed. In addition, the main controlling factors affecting the H2S elutriation efficiency were investigated, and the H2S elutriation scheme of H gas storage was optimized. The results indicate that H2S migrates between near-well and far-well regions under pressure differentials. The traditional H2S elutriation method relies on concentration gradient diffusion, whereas the displacement elutriation approach leverages pressure differentials with higher H2S elutriation efficiency. For the displacement elutriation method, higher reservoir permeability enhances the peak-shaving capacity of the gas storage but has a minor impact on H2S elutriation when the formation permeability is between 30 and 100 mD. The elutriation efficiency is significantly higher when wells are drilled in the high structural parts of the reservoir compared to the low structural parts. Longer displacement elutriation time within a cycle improves H2S elutriation efficiency but reduces the working gas volume of the storage. Therefore, the optimal displacement time for H gas storage is 60 days. An optimized H2S elutriation scheme enabled the working gas to meet the national first-class natural gas standard within 10 cycles. This study elucidates H2S migration patterns, H2S elutriation mechanisms, and key influence factors on H2S elutriation efficiency, offering valuable technical insights for sour gas storage operations.Keywords
As the global energy structure shifts towards cleaner sources, natural gas has emerged as a key energy source due to its high combustion efficiency and low emissions [1,2]. Underground gas storage plays a crucial role in meeting gas demand and ensuring energy security [3–5]. Globally, most underground gas storage facilities are converted from non-sulfur-containing depleted gas reservoirs, which are relatively safe and straightforward to operate [6,7]. However, due to geological constraints, a significant portion of the gas storage facilities built and under construction in China are sour gas storage [8]. For example, the Yong 22 and Changqing Shan 224 gas storage facilities in North China, as well as the Tongluoxia, Huangcaoxia, Laowengchang, and Moujiaping gas storage facilities under construction in the Sichuan Basin, are all sour gas storage facilities [9,10]. These facilities must not only prevent environmental pollution and human poisoning accidents caused by gas leaks but also address the corrosion issues caused by acidic H2S on production equipment and pipelines. This significantly increases the difficulty of construction and operation [11–13]. Currently, the industry commonly uses corrosion-resistant operational equipment to extract high-sulfur gas and inject sulfur-free or micro-sulfur natural gas mixtures, followed by desulfurization purification [14–16]. Prolonged desulfurization not only leads to high operational costs but also increases the risk of hydrogen sulfide leakage due to intensive injection and production [17,18]. Therefore, efficient handling of reservoir H2S is crucial for the safe construction, sustainable operation, and economic efficiency of sour gas storage [19]. Given this, it is necessary to conduct in-depth research on H2S-related issues in sour gas storage.
Despite extensive research on H2S corrosiveness and solubility, studies on H2S elutriation mechanisms in sour gas storage remain limited [20–24]. Chen et al. [24] used numerical simulation to study the distribution of H2S and the changes in H2S mole fraction in produced gas during injection and production, finding that there is an internal low H2S concentration zone near the wellbore, an external high H2S concentration zone, and a transient medium H2S concentration zone between the internal and external zones. Yang et al. [25] studied the production of H2S under different engineering parameters, finding that the peak H2S production increases with the number of operation cycles when the depletion gas reservoir recovery rate is below 70% and decreases when the recovery rate is above 70%. The higher the working gas ratio, the higher the H2S Elutriation Efficiency. Besides, the gas production rate has a negligible impact on H2S elutriation. Lin et al. [26] found that sulfur-free natural gas injected into the formation displaces H2S to the far end, and H2S migrates towards the production well during production. Wang et al. [27] suggested that the H2S content in the produced gas decreases logarithmically, and the elutriation of acidic gases accelerates with increasing gas production.
In summary, existing studies have mainly focused on the impact of gas storage operating parameters on the production of H2S, with gaps in the mechanism of H2S elutriation and insufficient understanding of H2S migration during the injection and production process. We use numerical simulation to study the above problem for a high sulfur-containing gas reservoir in China, design a new H2S elutriation method, and study the key factors affecting the efficiency of H2S elutriation. Our investigation can provide scientific guidance for the conversion of sulfur-containing gas reservoirs into gas storage.
H gas storage is located in the Sichuan Basin of China, belonging to a high-steep anticline structure trending northeast-southwest. The main reservoirs are Jia-1 and Jia-2, with an elevation difference of 100–300 m. Core and logging interpretations indicate that the properties of the upper and lower reservoirs are different, with average porosities of 5.4% and 4.6% and average permeabilities after acidification of 23
3 H2S Migration and Elutriation Mechanisms
To analyze the migration of H2S during injection and production, a numerical simulation model of the gas storage was established based on the 3D geological interpretation data, cross-section data, and production data by tNavigator numerical simulation software. The model is divided into three layers, from bottom to top: Jia-1 gas reservoir, interlayer, and Jia-2 gas reservoir (Fig. 1). The physical property parameters of the model are shown in Table 2. Based on the well stream fluid analysis results, the Peng-Robinson equation of state was used to establish the fluid composition model of the gas storage [28–31]. The model is set up with two injection-production wells, with combined injection and production in Jia-1 and Jia-2. After evaluating the productivity of the gas well and calculating the critical erosion flow and critical liquid carrying flow, the injection and production rate of the gas well is designed according to the peak regulation requirement of gas storage. The injection rate is 140 × 104 m3/day for 6 months, followed by a 2-month shut-in period, and then a production rate of 270 × 104 m3/day for 4 months, simulating one cycle of H2S elutriation.

Figure 1: Schematic of the multilayered conceptual model
From the distribution of H2S in the reservoir before injection, after injection, after shut-in balance, and after production (Fig. 2), it can be seen that after injecting sulfur-free/micro-sulfur natural gas into the reservoir, three regions are formed: a sulfur-free/micro-sulfur region (H2S mole fraction below 0.0040), a medium-sulfur region (H2S mole fraction between 0.0040 and 0.0120), and a high-sulfur region (H2S mole fraction above 0.0120). Some regions have H2S mole fractions exceeding the original formation H2S mole fraction. After the shut-in balance, a small portion of H2S diffuses towards the operation wells. After one operation cycle, the highest H2S content in the reservoir decreases, with a significant decrease in H2S concentration near the wells. Notably, after production, the H2S concentration in a large area of the reservoir increases again, with only a small area near the wells becoming a medium-sulfur zone. The simulation results are similar to Yang et al. [25] and Lin et al. [26].

Figure 2: Distribution of H2S concentration in the reservoir at different stages: (a) before gas injection, (b) after gas injection, (c) after well shut-in, (d) after gas production
Our investigation shows that during gas injection, under the pressure differential displacement between the injection pressure and formation pressure, H2S in the near-well region is displaced to the far-well region and accumulates differentially between wells. At this time, an H2S concentration gradient is formed, and H2S from the high-concentration far-well region diffuses towards the low-concentration near-well region. Similarly, during production, H2S migrates towards the low-pressure region under the pressure differential, as shown in Fig. 3. Additionally, the concentration gradient diffusion of H2S is much smaller than the pressure differential displacement effect. The injection-production cycle causes some H2S in the reservoir to migrate back and forth between the far-well and near-well regions under the pressure differential.

Figure 3: Conceptual sketch of H2S migration during cycle operation: (a,b) pressure distribution, (c–e) H2S concentration distribution (The yellow arrows show the flow of gas between the wellbore and the formation during the injection and production process; The change in color in each subplot indicates the change in formation pressure and H2S concentration, the darker the color, the greater the pressure or H2S concentration)
3.2.1 Traditional Elutriation Method
The traditional H2S elutriation method (Scheme 1) involves gas injection and production operations through the same well. Both concentration diffusion and pressure differential displacement of H2S are evident during the elutriation process, which spans the entire operation cycle of the gas storage. The elutriation mechanism is illustrated in Fig. 4. During the gas injection phase, sulfur-free or low-sulfur natural gas is injected into the native high-sulfur reservoir. The high-sulfur gas in the near-well region is gradually displaced to the far-well region, resulting in a significantly higher average H2S concentration in the far-well region compared to the near-well region. At this stage, driven by the H2S concentration gradient, the high-concentration H2S in the far-well region begins to diffuse towards the near-well region. During the well shut-in and pressure equilibrium phase, H2S diffuses further as pressure equilibrates, leading to a continuous increase in H2S concentration in the near-well region. In the gas production phase, the H2S that has diffused into the near-well region is carried out by the produced natural gas, thereby achieving the objective of H2S elutriation.

Figure 4: Mechanism of H2S elutriation in Scheme 1
3.2.2 Displacement Elutriation Method
Based on the migration patterns of H2S during the injection and production processes, an H2S displacement and elutriation method using separate wells (Scheme 2) was designed. This method involves distinct wells for injection and production operations. Specifically, a subset of wells is used for gas injection to displace H2S, while another subset is utilized for gas production to elutriate H2S. This approach also incorporates both pressure differential displacement and concentration diffusion processes. The elutriation mechanism is illustrated in Fig. 5. During the gas injection phase, the peripheral production wells are shut in, while the central injection wells inject sulfur-free or low-sulfur natural gas into the reservoir, displacing the high-sulfur gas from the near-well regions to the far-well regions for enrichment. In the displacement and elutriation phase, gas is injected through one set of wells while the previously shut-in wells are opened at appropriate times to produce the displaced high-sulfur gas. During the well shut-in and pressure equilibrium phase, H2S continues to migrate and diffuse under the influence of the concentration gradient. In the gas production phase, all injection and production wells are opened to elutriate H2S from the reservoir rapidly.

Figure 5: Mechanism of H2S elutriation in Scheme 2
When using Scheme 1 for H2S elutriation, all wells are simultaneously opened or closed throughout the process. Under this scheme, the majority of H2S in the reservoir migrates back and forth between the near-well and far-well regions driven by the pressure differential, while a small portion of H2S may become trapped in the narrow pores of the reservoir and remain immobile. Since the pressure-driven displacement effect is significantly stronger than the concentration-driven diffusion effect, the direction of H2S diffusion due to the concentration gradient during the gas injection phase is opposite to that of the pressure-driven displacement. As a result, the elutriation of H2S primarily relies on concentration-driven diffusion and migration during the well shut-in and pressure equilibrium phase. The more H2S that diffuses and migrates to the production wells during the operation cycle, the more H2S is carried out by the produced natural gas. H2S in the near-well region can be elutriated more quickly due to the shorter diffusion distance to the wells, whereas H2S in the far-well region, with its longer diffusion distance, may require multiple injection-production cycles to be gradually elutriated. Additionally, as the H2S concentration in the reservoir decreases, the concentration-driven diffusion effect diminishes. In cases of strong reservoir heterogeneity, the differentially accumulated H2S in the far-well region may not be effectively elutriated.
In contrast, Scheme 2 primarily relies on the pressure-driven displacement effect during the gas injection phase. If the injected sulfur-free or low-sulfur natural gas effectively displaces the high-sulfur gas toward the far-well production end, and the production wells are opened at the appropriate time for H2S elutriation, this approach can rapidly reduce the H2S content in the reservoir. Unlike Scheme 1, the concentration-driven diffusion effect in Scheme 2 is not conducive to H2S elutriation, as the goal of gas injection displacement is to drive high-concentration H2S toward the production wells. However, concentration-driven diffusion may cause the differentially accumulated H2S to migrate in the opposite direction of displacement, particularly during the well shut-in and pressure equilibrium phase, where H2S diffuses back toward the injection wells.
Simulations of 20 cycles were conducted to evaluate the performance of different H2S elutriation methods. In Scheme 1, two wells simultaneously injected gas at a rate of 140 × 104 m3/d for 6 months, followed by a 2-month shut-in period, and then produced gas at a rate of 270 × 104 m3/d for 4 months (Fig. 6). In Scheme 2, Well W1 injected gas at a rate of 100 × 104 m3/d for 6 months, during which Well W2 produced gas at a rate of 50 × 104 m3/d for 2 months starting from the 4th month. Subsequently, both wells produced gas simultaneously at a rate of 270 × 104 m3/d for 4 months after a 2-month shut-in period (Fig. 7).

Figure 6: Injection and production gas rate as a function of time under Scheme 1

Figure 7: Injection and production gas rate as a function of time under Scheme 2
Based on the H2S concentration distribution around the wells at the end of the production phase for different cycles (Figs. 8 and 9), both schemes effectively elutriated H2S from the reservoir. However, the H2S elutriation efficiency of Scheme 2 was significantly higher than that of Scheme 1. Additionally, due to the limited pressure propagation range of the injection and production wells, H2S in the far-well regions could not be fully elutriated within a short period. This was particularly evident in the traditional elutriation method (Scheme 1), where a substantial amount of H2S remained in the far-well regions even after 20 elutriation cycles.

Figure 8: Distribution of H2S concentration after a certain cycle under Scheme 1: (a) the first cycle, (b) the fifth cycle, (c) the fifteenth cycle, (d) the twentieth cycle
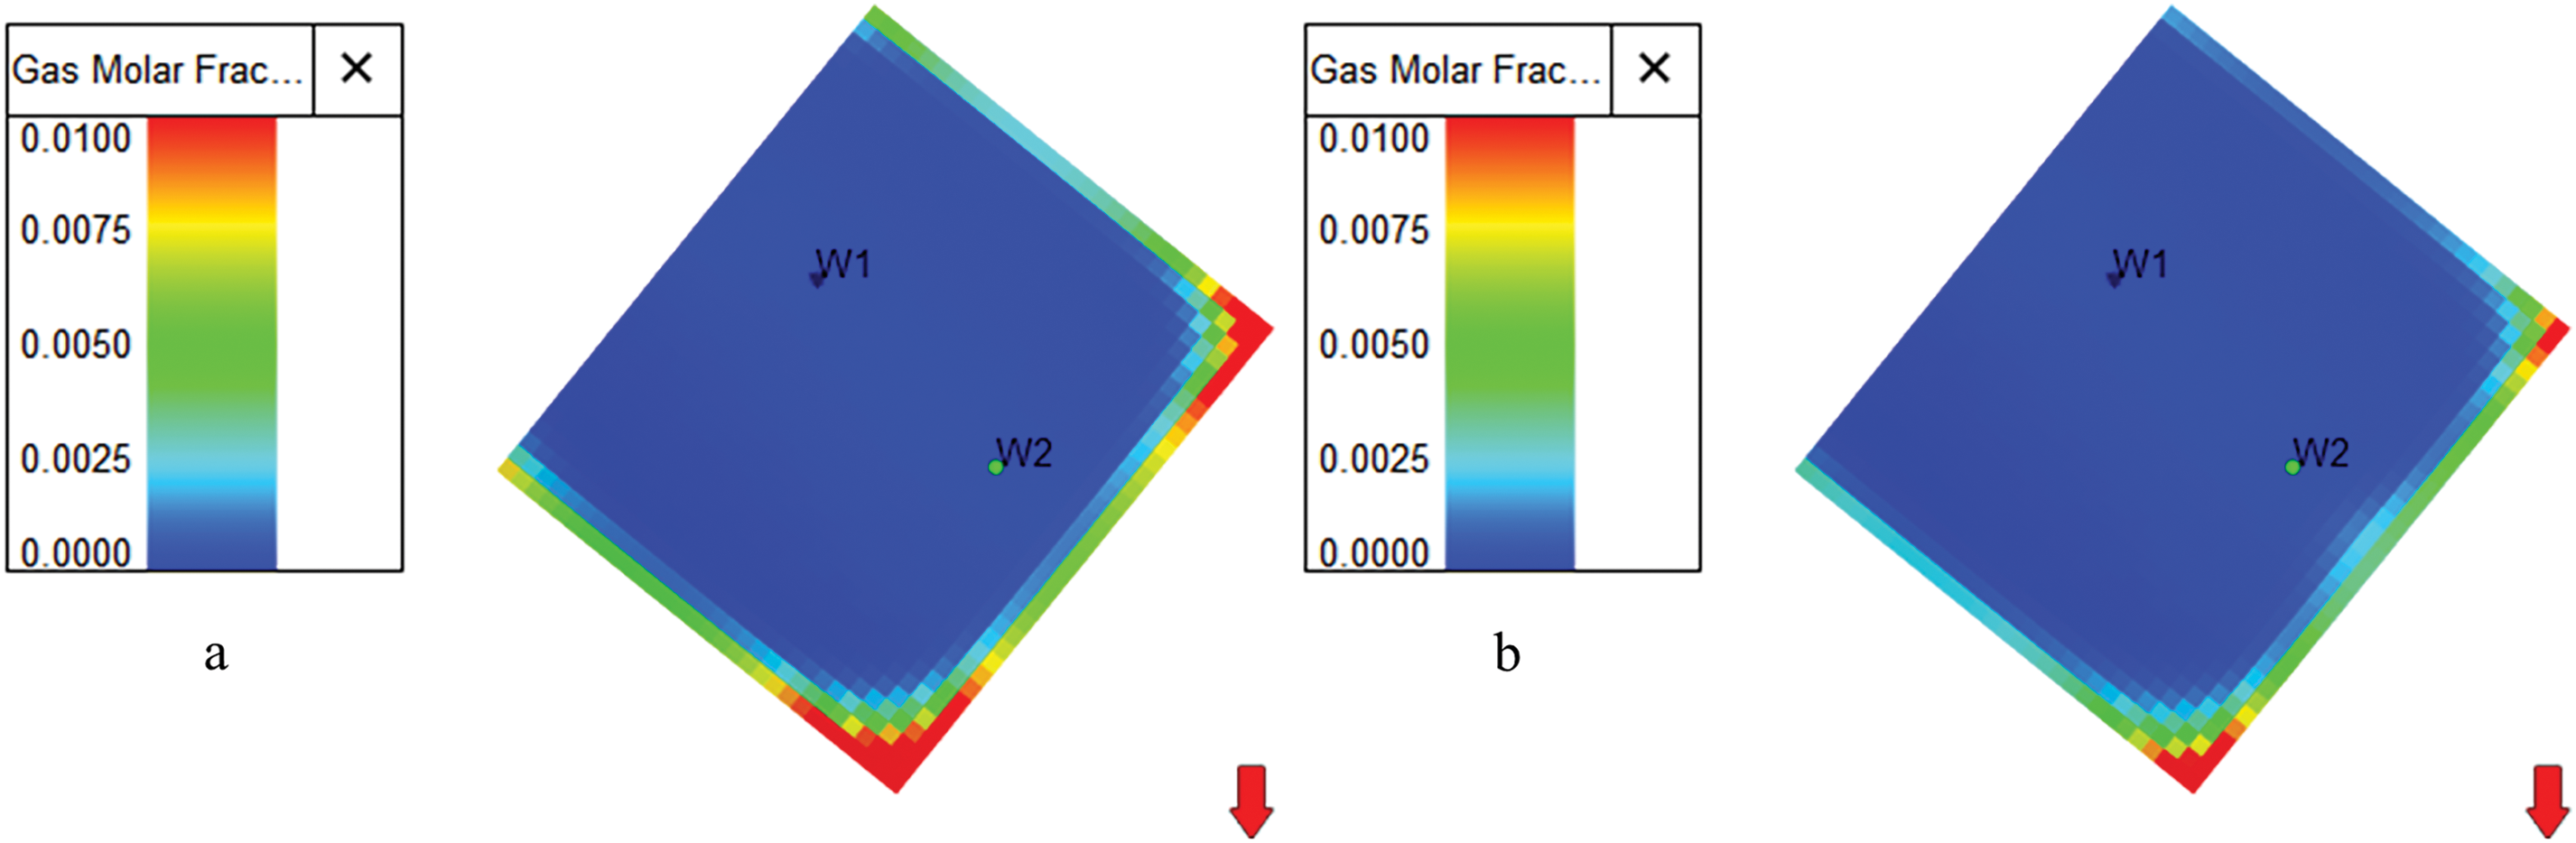

Figure 9: Distribution of H2S concentration after a certain cycle under Scheme 2: (a) the first cycle, (b) the fifth cycle, (c) the fifteenth cycle, (d) the twentieth cycle
From the temporal variation of the H2S mole fraction in the produced natural gas over the cycles (Fig. 10), it is evident that the H2S mole fraction in Scheme 2 consistently decreases, whereas in Scheme 1, it initially rises slowly before gradually declining. In the early cycles, the H2S mole fraction in Scheme 2 is significantly higher than that in Scheme 1 and exhibits a stepwise decrease. After 7 cycles, due to the substantial reduction in reservoir H2S content, the H2S mole fraction in Scheme 2 drops to a relatively low level. In contrast, the H2S mole fraction in Scheme 1 remains in an upward trend at this stage. The H2S elutriation efficiency (the amount of H2S e elutriated per cubic meter of produced natural gas) for different elutriation schemes across various injection-production cycles was calculated, as shown in Fig. 11. The H2S elutriation efficiency of Scheme 2 is significantly higher than that of Scheme 1, enabling a rapid reduction in reservoir H2S content within a shorter number of cycles. From the temporal variation of the remaining H2S content in the reservoir over the 20 cycles (Fig. 12), it is observed that Scheme 1 retains approximately 35% of the original H2S content after 20 cycles, whereas Scheme 2 nearly elutriates all the H2S from the reservoir within the first 10 cycles.

Figure 10: Value of H2S fraction in recovered natural gas as a function of time

Figure 11: H2S elutriation efficiency as a function of operation cycles

Figure 12: Residual H2S content in reservoirs as a function of time
Our investigation reveals that the migration of H2S in the reservoir is primarily driven by the pressure differential during gas injection and production, causing H2S to move back and forth between the near-well and far-well regions along the direction of the pressure gradient. However, although concentration-driven diffusion also contributes to H2S migration, its effect is significantly weaker compared to that of the pressure differential.
Both traditional H2S elutriation and displacement elutriation methods can reduce the H2S content in the reservoir, but the latter demonstrates far superior elutriation efficiency compared to the former. For the traditional H2S elutriation method, if the goal is to rapidly elutriate H2S from the reservoir, its efficiency is much lower than that of the displacement elutriation method. Even if the objective is to achieve the national Class I natural gas standard for H2S content (GB17820-2018, ≤6 mg/m3), this method remains unsuitable due to its irregular elutriation efficiency and the fact that the H2S content often significantly exceeds 6 mg/m3 over extended periods. Therefore, for gas storage reservoirs with high sulfur content, the displacement elutriation method is recommended to reduce the reservoir H2S content.
Additionally, it should be noted that the H gas reservoir is a typical high-steep anticlinal structure. The H2S is mainly distributed in the high part of the structure, and the Wells in the high part may wash out more H2S in the first few cycles of operation. However, H gas storage is heterogeneous, and if there is a dominant seepage channel or a local pressure drop funnel, part of H2S may not be elutriated. In contrast, drilling wells in the low part of the reservoir structure can increase the area of displacement and displace more H2S into the production wells, which in turn improves the efficiency of H2S elutriation. Therefore, the third chapter of this paper studies the influence of well location on H2S elutriation efficiency. Displacement elutriation is the process of gas injection in some Wells and gas production in some Wells simultaneously. The longer the displacement elutriation time, the better the effect of H2S elutriation may be, but the working volume of gas storage will decrease. Therefore, the third chapter also studied the influence of displacement elutriation time on H2S elutriation efficiency to get the best H2S elution effect while meeting the peak demand of gas storage. In addition, the flow capacity of the formation fluid is different under different permeability conditions, and the ability of natural gas to carry H2S is also different during gas recovery. Therefore, the influence of reservoir permeability on H2S elutriation efficiency is also discussed in Section 3.
4 Factors Influencing H2S Elutriation Efficiency
Two well placement scenarios were designed, with injection and production wells located in the structural high and low points of the reservoir, respectively, as illustrated in Fig. 13. The injection and production controls for both scenarios were identical and consistent with the displacement elutriation scheme described in Section 2. Simulations of 10 injection-production cycles were conducted for both scenarios. From the temporal variation of the remaining H2S content in the reservoir over the 10 cycles (Fig. 14), it is observed that placing wells in the structural high points rapidly reduces the reservoir H2S content, whereas placing wells in the low points results in a slower elutriation of H2S. After 10 cycles, the remaining H2S content in the reservoir with wells in the low points is still approximately 35% of the original content, while wells in the high points nearly elutriate all the H2S from the reservoir. The H2S elutriation efficiencies for the two well placement scenarios are shown in Fig. 15. For wells in the high points, the H2S elutriation efficiency decreases steadily from its peak and rapidly drops to a lower level. In contrast, the elutriation efficiency for wells in low points fluctuates significantly over time.

Figure 13: Injection wells at different tectonic sites: (a) well drilling in the low part of the reservoir, (b) well drilling in the high part of the reservoir

Figure 14: Residual H2S content in reservoirs as a function of time

Figure 15: H2S elutriation efficiency as a function of operation cycles
Displacement elutriation durations of 30, 60, 90, 120, and 150 days were designed, with a shut-in equilibrium period of 65 days and a gas production peak-shaving period of 120 days. Simulations of 10 injection-production cycles were conducted for each scenario, with injection and production rates consistent with the displacement elutriation scheme described in Chapter 2. The injection and production timelines for each scenario are summarized in Table 3. From the variation of H2S elutriation efficiency over the operational cycles (Fig. 16), it is observed that in the first three cycles, longer displacement elutriation durations result in higher elutriation efficiencies. After the fourth cycle, the reservoir H2S content decreases significantly, leading to a rapid decline in elutriation efficiency. The average H2S elutriation efficiency over the first five cycles increases with longer displacement elutriation durations (Fig. 17). The remaining H2S content in the reservoir (Fig. 18) indicates that longer displacement durations yield better elutriation outcomes. However, extending the displacement elutriation time reduces the working gas volume of the storage reservoir, thereby shortening the duration of high production capacity during the peak-shaving period, as shown in Fig. 19. Therefore, the H2S elutriation strategy for gas storage reservoirs must carefully balance elutriation efficiency and working gas volume.
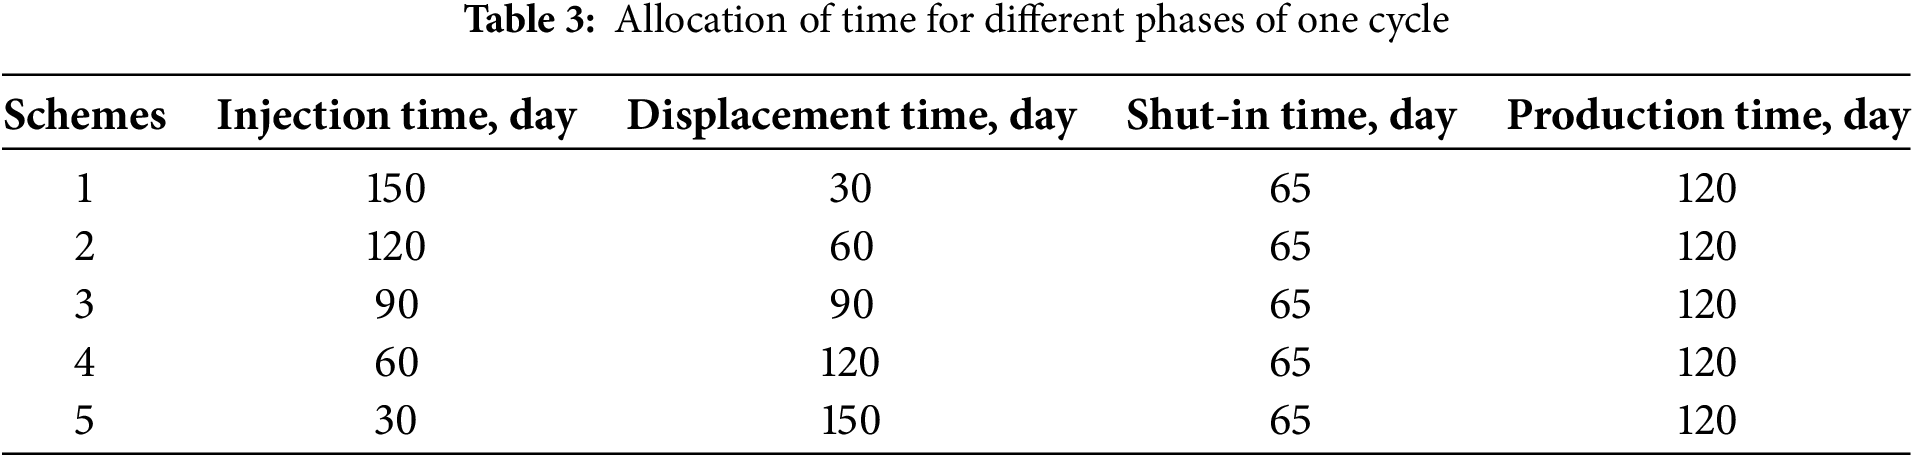

Figure 16: H2S elutriation efficiency as a function of operation cycles

Figure 17: Average H2S elutriation efficiency with different displacement times in first 5 cycles

Figure 18: Residual H2S content in reservoirs as a function of time

Figure 19: Natural gas recovered a function of time
To investigate the influence of reservoir permeability on H2S elutriation performance, four scenarios with permeabilities of 30, 50, 80, and 100
Figure 20: Injection and production gas rate as a function of time in one cycle
The analysis of H2S elutriation efficiency across injection-production cycles for varying permeabilities, as depicted in Fig. 21, along with the average H2S elutriation efficiency during the initial five cycles (Fig. 22), reveals that an increase in permeability is associated with a marginal reduction in H2S elutriation efficiency. Furthermore, the evaluation of the remaining H2S content within the reservoir (Fig. 23) and the cumulative volume of produced natural gas over time (Fig. 24) demonstrates that while higher permeability leads to a greater total volume of gas production, the quantity of H2S elutriated exhibits only negligible fluctuations.

Figure 21: H2S elutriation efficiency as a function of operation cycles

Figure 22: Average H2S elutriation efficiency with different permeability in 10 cycles

Figure 23: Residual H2S content in reservoirs as a function of time
Figure 24: Total amount of natural gas recovered as a function of time
Our investigation reveals that wells drilled at the structural highs of the reservoir exhibit significantly higher H2S elutriation efficiency compared to those at the structural lows. The displacement elutriation approach can markedly reduce the H2S content in the reservoir within relatively fewer cycles, especially during the initial cycles of injection and production, where the H2S elutriation efficiency at highs is more than double that at lows. Prolonged displacement and elutriation time enhance the H2S elutriation efficiency; however, it concurrently reduces the working gas volume of the gas storage and shortens the peak shaving duration of high productivity. It is recommended that the displacement and elutriation time for H gas storage be set at 60 days. This duration not only meets the peak shaving operational requirements of the gas storage but also maximizes the H2S elutriation from the reservoir. Higher reservoir permeability enhances the injection and production capacity of gas wells, thereby improving the peak-shaving operational capability of the gas storage. Nevertheless, the impact of reservoir permeability on H2S elutriation in sulfur-containing gas storage is minimal. When the permeability does not exceed 100
5 Optimization of H2S Elutriation Scheme
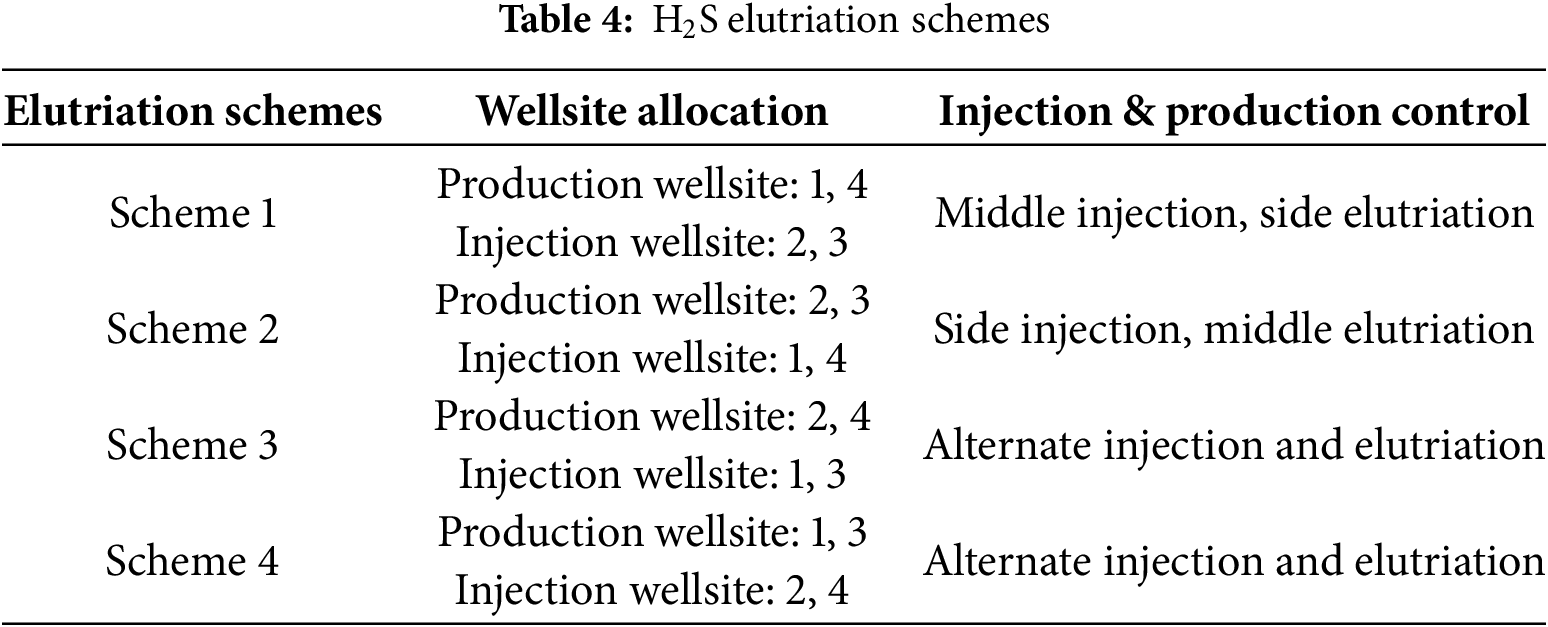
Based on the aforementioned research findings, a numerical simulation model for H gas storage was built (Fig. 25) to optimize the H2S elutriation strategy. We used the method of fitting wellhead oil pressure with a fixed daily gas volume and achieved production history fitting through inter-well permeability adjustment and local fine-tuning porosity. The fitting curve of some well production history is shown in Figs. 26 and 27. The fitting accuracy is high, and the model can be used for the prediction of subsequent projects. The gas storage facility comprises 11 injection-production wells, organized into four well pads, as shown in Fig. 28. Owing to the pronounced heterogeneity of the reservoir, the accumulation and migration of H2S exhibit irregular patterns. Consequently, four distinct H2S displacement and elutriation schemes were designed by modifying the injection-production controls of the well pads. The specific injection-production parameters for each scheme are detailed in Table 4 and Fig. 28. Taking into account the influence of the structural positioning of the injection-production wells, the duration of displacement, and elutriation on H2S elutriation efficiency while ensuring the gas storage’s peak-shaving operational requirements, wells were strategically drilled at the structural highs of the reservoir. During the gas injection phase, the injection wells operated at a rate of 100 × 104 m3/d for 120 days. In the displacement and elutriation phase, the production wells operated at a rate of 50 × 104 m3/d for 60 days. All wells were shut in for 65 days during the well shut-in phase. In the net gas production phase, all wells operated at a rate of 100 × 104 m3/d for 120 days. A comprehensive 20-cycle injection-production simulation was performed for each scheme to evaluate their effectiveness.

Figure 25: Numerical simulation model of H gas storage reservoir

Figure 26: History fitting curve of well C1: (a) gas production fitting curve, (b) pressure drop fitting curve

Figure 27: History fitting curve of well C5: (a) gas production fitting curve, (b) pressure drop fitting curve

Figure 28: Wellsite distribution and allocation for the four H2S elutriation schemes: (a) Scheme 1, (b) Scheme 2, (c) Scheme 3, (d) Scheme 4
As illustrated in Fig. 29, the gas injection and production volumes per cycle are identical across all schemes. Since the initial cycles of the gas storage involve a capacity expansion and production ramp-up process, the total gas injection volume exceeds the total gas production volume. The H2S elutriation efficiency under different schemes and cycles, as shown in Fig. 30, indicates that the elutriation efficiency of all schemes initially increases with the number of cycles. Among them, Scheme 2 achieves the highest elutriation efficiency after the first cycle and significantly outperforms the other schemes in the subsequent four cycles. After five cycles, due to a substantial reduction in H2S content within the reservoir, the elutriation efficiency of all schemes gradually declines. Within the first five cycles, Scheme 2 exhibits the highest average H2S elutriation efficiency, as depicted in Fig. 31. The variation in the remaining H2S content in the reservoir over time, as shown in Fig. 32, reveals that after 10 cycles of elutriation, the remaining H2S content in the reservoir for each scheme is 53%, 47%, 58%, and 60% of the original content, respectively. Scheme 2 demonstrates the best H2S elutriation performance, with the H2S content in the produced natural gas decreasing to 6 mg/m3, meeting the national Class I natural gas standard.

Figure 29: Injection and production gas volume as a function of time

Figure 30: H2S elutriation efficiency as a function of operation cycles

Figure 31: Average H2S elutriation efficiency with different schemes in the first 5 cycles

Figure 32: Residual H2S content in reservoirs as a function of time
This study investigated H2S migration and elutriation mechanisms in a medium-sulfur gas storage facility in China through numerical simulation. The optimized H2S elutriation scheme for the gas storage leads to the following conclusions:
1. H2S migrates back and forth between near and far wells. It is primarily driven by pressure differences, with concentration gradients playing a secondary role.
2. The displacement elutriation method, which leverages pressure differentials, is significantly more efficient than the traditional elutriation method relying on concentration gradient diffusion.
3. Higher reservoir permeability enhances the gas storage’s peak-shaving capacity but has a limited impact on H2S elutriation efficiency. Wells drilled at the structural highs of the reservoir exhibit significantly better H2S elutriation efficiency than those at the lows. An optimal displacement time of 60 days is recommended, as longer displacement durations reduce the working gas volume and shorten the high-productivity period.
4. For H gas storage, the optimized displacement elutriation scheme involves drilling wells at the structural highs, a net gas injection period of 120 days, and a displacement elutriation period of 60 days. Using Well Pads 1 and 4 for injection and Well Pads 2 and 3 for production, this scheme can effectively elutriate H2S while meeting the gas storage’s peak-shaving requirements. The produced natural gas meets the national Class I natural gas standard after 10 cycles.
Acknowledgement: The authors appreciated the support from PetroChina Southwest Oil and Gas Field Company Chongqing Gas Mine and Chongqing University of Science and Technology.
Funding Statement: This work is supported by the Science and Technology Research Program of Chongqing Municipal Education Commission (KJQN202401501, KJZD-M202401501).
Author Contributions: The authors confirm contribution to the paper as follows: study conception and design: Siji Chen, Gang Chen, Mukun Ouyang, Lianghua Zhang; analysis and interpretation of results: Wei Wang, Han Liu, Gang Chen, Wanhong Zhang, Wei Tang; draft manuscript preparation: Gang Chen; review: Shilai Hu. All authors reviewed the results and approved the final version of the manuscript.
Availability of Data and Materials: All data that support the findings of this study are included within the article.
Ethics Approval: Not applicable.
Conflicts of Interest: The authors declare no conflicts of interest to report regarding the present study.
References
1. Shah SAR, Zhang Q, Abbas J, Balsalobre-Lorente D, Pilar L. Technology, urbanization and natural gas supply matter for carbon neutrality: a new evidence of environmental sustainability under the prism of COP26. Resour Policy. 2023;82:103465. doi:10.1016/j.resourpol.2023.103465. [Google Scholar] [CrossRef]
2. Zhang T, Yu Y, Wang G, Peng Y, Dong Z. Air lift technologies and their application to deep sour gas wells, Sichuan-Chongqing area. Nat Gas Explor Dev. 2024;47(4):112–8. (In Chinese). doi:10.12055/gaskk.issn.1673-3177.2024.04.013. [Google Scholar] [CrossRef]
3. Zhang J, Tan Y, Zhang T, Yu K, Wang X, Zhao Q. Natural gas market and underground gas storage development in China. J Energy Storage. 2020;29:101338. doi:10.1016/j.est.2020.101338. [Google Scholar] [CrossRef]
4. Azin R, Malakooti R, Helalizadeh A, Zirrahi M. Investigation of underground sour gas storage in a depleted gas reservoir. Oil Gas Sci Technol—Rev IFP Energ Nouv. 2014;69(7):1227–36. doi:10.2516/ogst/2012003. [Google Scholar] [CrossRef]
5. Plaat H. Underground gas storage: why and how. Geol Soc. 2009;313(1):25–37. doi:10.1144/SP313.4. [Google Scholar] [CrossRef]
6. Al-Shafi M, Massarweh O, Abushaikha AS, Bicer Y. A review on underground gas storage systems: natural gas, hydrogen and carbon sequestration. Energy Rep. 2023;9:6251–66. doi:10.1016/j.egyr.2023.05.236. [Google Scholar] [CrossRef]
7. Zheng DW, Xu HC, Wang JM, Sun JC, Zhao K, Li C, et al. Key evaluation techniques in the process of gas reservoir being converted into underground gas storage. Pet Explor Dev. 2017;44(5):840–9. doi:10.1016/S1876-3804(17)30095-2. [Google Scholar] [CrossRef]
8. Zhang G, Li B, Zheng D, Ding G, Wei H, Qian P, et al. Challenges to and proposals for underground gas storage (UGS) business in China. Nat Gas Ind B. 2017;4(3):231–7. doi:10.1016/j.ngib.2017.07.025. [Google Scholar] [CrossRef]
9. Zhang X, Li Q, Simon M, Zheng G, Tan Y. Effect of H2S content on relative permeability and capillary pressure characteristics of acid gas/brine/rock systems: a review. J Rock Mech Geotech Eng. 2022;14(6):2003–33. doi:10.1016/j.jrmge.2022.03.014. [Google Scholar] [CrossRef]
10. Hemme C, van Berk W. Potential risk of H2S generation and release in salt cavern gas storage. J Nat Gas Sci Eng. 2017;47:114–23. doi:10.1016/j.jngse.2017.09.007. [Google Scholar] [CrossRef]
11. Chen Z, Xu M, Hu T, Xue G, Chen F, Zhao H, et al. Effects of H2S content on the corrosion behavior of gas storage reservoir injection and production pipeline steel in CO2-H2S environment. Mater Today Commun. 2024;41:110364. doi:10.1016/j.mtcomm.2024.110364. [Google Scholar] [CrossRef]
12. Eparu CN, Prundurel AP, Doukeh R, Stica DB, Ghetiu IV, Suditu S, et al. Optimizing underground natural gas storage capacity through numerical modeling and strategic well placement. Processes. 2024;12(10):2136. doi:10.3390/pr12102136. [Google Scholar] [CrossRef]
13. Melo DMA, De Souza JR, Melo MAF, Martinelli AE, Cachima GHB, Cunha JD. Evaluation of the zinox and zeolite materials as adsorbents to remove H2S from natural gas. Colloids Surf A Physicochem Eng Asp. 2006;272(1–2):32–6. doi:10.1016/j.colsurfa.2005.07.005. [Google Scholar] [CrossRef]
14. Wiheeb AD, Shamsudin IK, Ahmad MA, Murat MN, Kim H, Othman MR. Present technologies for hydrogen sulfide removal from gaseous mixtures. Rev Chem Eng. 2013;29(6):449–70. doi:10.1515/revce-2013-0017. [Google Scholar] [CrossRef]
15. Habeeb OA, Kanthasamy R, Ali GAM, Sethupathi S, Yunus RBM. Hydrogen sulfide emission sources, regulations, and removal techniques: a review. Rev Chem Eng. 2018;34(6):837–54. doi:10.1515/revce-2017-0004. [Google Scholar] [CrossRef]
16. Xu Q, Liu H, Song Z, Dong S, Zhang X. Dynamic risk assessment for underground gas storage facilities based on Bayesian network. J Loss Prev Process Ind. 2023;82:104961. doi:10.1016/j.jlp.2022.104961. [Google Scholar] [CrossRef]
17. Abotaleb A, Gladich I, Alkhateeb A, Mardini N, Bicer Y, Sinopoli A. Chemical and physical systems for sour gas removal: an overview from reaction mechanisms to industrial implications. J Nat Gas Sci Eng. 2022;106:104755. doi:10.1016/j.jngse.2022.104755. [Google Scholar] [CrossRef]
18. Bihua X, Bin Y, Yongqing W. Anti-corrosion cement for sour gas (H2S-CO2) storage and production of HTHP deep wells. Appl Geochem. 2018;96:155–63. doi:10.1016/j.apgeochem.2018.07.004. [Google Scholar] [CrossRef]
19. Subramaniam R, Yasa S, Bertrand T, Fontenot B, Dupuis TF, Hernandez R. Advanced simulation of H2S scavenging process with triazine at different depths of gas well. J Nat Gas Sci Eng. 2018;49:417–27. doi:10.1016/j.jngse.2017.11.025. [Google Scholar] [CrossRef]
20. Raczkowski J, Turkiewicz A, Kapusta P. Elimination of biogenic hydrogen sulfide in underground gas storage. A case study. In: SPE Annual Technical Conference and Exhibition? 2004 Sep 26–29; Houston, TX. SPE-89906. doi:10.2118/89906-MS. [Google Scholar] [CrossRef]
21. Chang Q, Huang L, McKenzie K, Carere C, Stott M, Nicol A, et al. Influence of hydrogen sulfide on gas-water interface in underground hydrogen storage: a molecular dynamics study. J Energy Storage. 2024;97:112766. doi:10.1016/j.est.2024.112766. [Google Scholar] [CrossRef]
22. Zhang Z, Wood DA. Virtual special issue: sour gas reservoirs and sulfur-removal technologies. J Nat Gas Sci Eng. 2015;26:1506–7. doi:10.1016/j.jngse.2015.08.022. [Google Scholar] [CrossRef]
23. Ghanbarabadi H, Khoshandam B. Simulation and comparison of Sulfinol solvent performance with Amine solvents in removing sulfur compounds and acid gases from natural sour gas. J Nat Gas Sci Eng. 2015;22:415–20. doi:10.1016/j.jngse.2014.12.024. [Google Scholar] [CrossRef]
24. Chen Z, Liao X, Zhao X, Chen C, Zhu L, Zhang F, et al. Optimization of injection and production parameters for sour gas storages: a case study. In: Offshore Technology Conference Asia; 2016 Mar 22–25; Kuala Lumpur, Malaysia; D022S001R018. doi:10.4043/26686-MS. [Google Scholar] [CrossRef]
25. Yang Y, Li L, Wang X, Qin N, Zhang R, Zhao Y, et al. Simulation study of hydrogen sulfide removal in underground gas storage converted from the multilayered sour gas field. Int J Coal Sci Technol. 2023;10(1):71. doi:10.1007/s40789-023-00631-3. [Google Scholar] [CrossRef]
26. Lin H, Zhang S, Yu B, Sun P, Liu M, Huang X. Numerical Simulation for movement laws of hydrogen sulfide during UGS injection and production. Oil Gas Storage Transp. 2016;35(11):1173–8. (In Chinese). [cited 2025 Apr 11]. Available from: https://www.nstl.gov.cn/paper_detail.html?id=618281d900d83f8d940bf8b3d986fc3a. [Google Scholar]
27. Wang D, Han X, Li J, Zhang J, Yang Q, Xia Y. The numerical simulation of gas injection-production in X acid gas storage. In: International Field Exploration and Development Conference; 2021 Oct 20–22; Qingdao, China. Singapore: Springer Nature Singapore; 2021. p. 1269–77. doi:10.1007/978-981-19-2149-0_117. [Google Scholar] [CrossRef]
28. Iwaszczuk N, Prytula M, Prytula N, Pyanylo Y, Iwaszczuk A. Modeling of gas flows in underground gas storage facilities. Energies. 2022;15(19):7216. doi:10.3390/en15197216. [Google Scholar] [CrossRef]
29. Zhuang X, Wang W, Su Y, Shi M, Dai Z. Life-cycle prediction and optimization of sequestration performance in CO2 mixture huff-n-puff development for tight hydrocarbon reservoirs. Appl Energy. 2025;388:125618. doi:10.1016/j.apenergy.2025.125618. [Google Scholar] [CrossRef]
30. Huang B, Wang Y, Wang MH, Chen T, Zhuo Y, Wang CX, et al. Drilling difficulties in Huangcaoxia UGS and their countermeasures. Nat Gas Explor Dev. 2024;47(6):80–6. (In Chinese). doi:10.12055/gaskk.issn.1673-3177.2024.06.010. [Google Scholar] [CrossRef]
31. Yang L, Wang H, Xu H, Guo D, Li M. Experimental study on characteristics of water imbibition and ion diffusion in shale reservoirs. Geoenergy Sci Eng. 2023;229:212167. doi:10.1016/j.geoen.2023.212167. [Google Scholar] [CrossRef]
Cite This Article
 Copyright © 2025 The Author(s). Published by Tech Science Press.
This work is licensed under a Creative Commons Attribution 4.0 International License , which permits unrestricted use, distribution, and reproduction in any medium, provided the original work is properly cited.
 Downloads
 Citation Tools