
 Submit a Paper
 Propose a Special lssue
 Open Access
ARTICLE

Coordinated Charging Scheduling Strategy for Electric Vehicles Considering Vehicle Urgency
1 College of Electrical Engineering, Northeast Electric Power University, Jilin, 132011, China
2 State Grid Changchun Electric Power Supply Company, Changchun, 130021, China
* Corresponding Author: Hongwei Li. Email:
Energy Engineering 2025, 122(8), 3223-3242. https://doi.org/10.32604/ee.2025.063615
Received 19 January 2025; Accepted 02 April 2025; Issue published 24 July 2025
 View Full Text
 Download PDF
Abstract
Aiming at the problem of increasing the peak-to-valley difference of grid load and the rising cost of user charging caused by the disorderly charging of large-scale electric vehicles, this paper proposes a coordinated charging scheduling strategy for multiple types of electric vehicles based on the degree of urgency of vehicle use. First, considering the range loss characteristics, dynamic time-sharing tariff mechanism, and user incentive policy in the low-temperature environment of northern winter, a differentiated charging model is constructed for four types of vehicles: family cars, official cars, buses, and cabs. Then, we innovatively introduce the urgency parameter of charging demand for multiple types of vehicles and dynamically divide the emergency and non-emergency charging modes according to the difference between the regular charging capacity and the user’s minimum power demand. When the conventional charging capacity is less than the minimum power demand of the vehicle within the specified time, it is the emergency vehicle demand, and this type of vehicle is immediately charged in fast charging mode after connecting to the grid. On the contrary, it is a non-emergency demand, and the vehicle is connected to the grid to choose the appropriate time to charge in conventional charging mode. Finally, by optimizing the objective function to minimize the peak-to-valley difference between the grid and the vehicle owner’s charging cost, and designing the charging continuity constraints to avoid battery damage, it ensures that the vehicle is efficiently dispatched under the premise of meeting the minimum power demand. Simulation results show that the proposed charging strategy can reduce the charging cost of vehicle owners by 26.33%, reduce the peak-to-valley difference rate of the grid by 29.8%, and significantly alleviate the congestion problem during peak load hours, compared with the disordered charging mode, while ensuring that the electric vehicles are not overcharged and meet the electricity demand of vehicle owners. This paper solves the problems of the existing research on the singularity of vehicle models and the lack of environmental adaptability and provides both economic and practical solutions for the cooperative optimization of electric vehicles and power grids in multiple scenarios.Keywords
In recent years, due to environmental issues and fossil energy tension, new energy technology, and electric vehicle (EV) rapid development [1]. By the conclusion of 2022, China’s electric vehicles had surpassed 13.1 million. Large-scale EVs connected to the power grid during peak hours will intensify the load fluctuations of the distribution system [2,3], leading to an exacerbation of the peak-valley difference, resulting in “peak on-peak” and other complications, and precipitating equipment overload, loss increase, and other deleterious effects [4–6].
Electric vehicles have good flexibility, and the load pressure of the power grid can be reduced through reasonable charging scheduling [7]. The scheduling strategy includes but is not limited to controlling EV charging start time, charging duration [8], charging power, and other parameters [9]. Literature [10] clusters electric vehicles with similar travel characteristics, integrates EV load resources through aggregators and provides differentiated services for users with different consumption preferences. Literature [11] proposed a cluster EV master-slave game optimization strategy. This strategy involves the simulation of user travel behavior, the integration of EV load resources, the optimization of pricing and charging and discharging strategies, and the achievement of Nash equilibrium. The result of this strategy is improved grid revenue and user satisfaction. In literature [12], the scheduling priority is determined by combining the actual charging demand of EVs in each period, and the charging coefficient is modified according to the priority to ensure the fairness of charging. In literature [13], the first-level optimization objective is to reduce the charging cost of the vehicle owner, and the second-level optimization objective is to reduce the load fluctuation of the power grid. The low-complexity scheduling algorithm for EVs is employed to ascertain the EV charging demand priority, with this determination being informed by the EV charging characteristic index. Literature [14] considered the starting and ending charging time of electric vehicles, coordinated the charging time and charging power of vehicles, and avoided a large number of EVs charging at the peak load of the power grid. As demonstrated in the literature [15], the integration of deep learning models with machine learning algorithms to predict demand has been shown to enhance charging efficiency, grid stability, and user experience. Literature [16] proposes bidirectional power flow to enhance grid flexibility and stability and combines it with a photovoltaic system to promote renewable energy consumption. However, it relies on specific hardware, with high promotion costs. The coordination method proposed in the literature [17] transfers the load demand from the peak period to the trough period and determines the charging power according to the power demand and charging time, respectively from the daytime and the charging time. Look for the minimum peak-valley difference scheduling method on both nights. However, its coordinated charging method is to charge multiple times when the electricity price is low instead of continuous charging, which has a great impact on the battery and causes the owner to be reluctant to participate in the scheduling. Literature [18] takes the lowest charging cost of electric vehicle owners as the goal and fully considers the charging economy. However, there is a lack of consideration of the urgency of the vehicle, and the charging needs of electric vehicle owners are usually different.
In addition, various time-of-use electricity price mechanisms are proposed to guide the user’s electricity consumption behavior and reduce the load fluctuation of the distribution network and the user’s charging cost. Literature [19] proposed the charging strategy of electric buses under the time-of-use electricity price scenario and established an optimization model with the goal of minimizing the fluctuation of vehicle charging load, which reduced the load fluctuation of microgrids and saved the charging cost. Literature [20] proposed an economic dispatching strategy for a regional power grid was developed, taking into account the variation in time-of-use electricity prices. This strategy was found to result in a reduction in charging costs and an enhancement in economic efficiency. Literature [21] established a hierarchical charging model for large-scale electric vehicles, considering the charging price, user demand, charging power, and other characteristics to find the optimal charging scheme and access the charging load at the valley of the grid load. Nevertheless, given the paucity of models, it is impracticable to accurately match large-scale electric vehicles. Based on the operation of the power grid, literature [22] established a time-of-use pricing model related to the charging price and the charging load of the vehicle. Considering the charging cost, driving time, and travel distance, a charging scheduling scheme with charging price guiding users is proposed. Nevertheless, this approach fails to consider the issue arising when a significant number of loads connect to the power grid during low-cost periods, potentially creating a new peak in demand.
The northern region’s geographic location is associated with low temperatures during winter months, which, when compounded with prolonged in-vehicle heating and external low temperatures, can impede the effective charging of electric vehicles. This issue is further exacerbated by the accelerated rate of EV power consumption. To address these challenges, this paper proposes an EV charging scheduling model that incorporates an urgency parameter to assess charging demand. The research methodology involves a comprehensive study of the time and driving characteristics of four models to establish an EV load model. Subsequently, the EV charging and power consumption model is introduced, taking into account the actual situation, including the range depreciation problem and charging continuity problem in northern winter. A coordinated charging strategy that considers the urgency of charging demand is proposed. Finally, the effectiveness of the strategy proposed in this paper is validated through simulations. The findings indicate that the proposed scheduling strategy effectively reduces the charging cost for vehicle owners while enhancing the security and stability of the power grid. Furthermore, it has been observed that this strategy can effectively transfer the load demand from peak hours to off-peak hours.
2 Electric Vehicle Charging Load Model
2.1 Electric Vehicle Time Characterization Model
The travel time characteristics of electric vehicles obey normal distribution, and this paper sets each electric vehicle to participate in dispatching only once a day. Four types of electric vehicle groups with different characteristics are fully considered to better fit reality, and electric vehicles are categorized into family cars, business cars, buses, and cabs.
In the case of domestic vehicles, EV owners initiate the charging process upon returning home from work and conclude it before departure for work. For buses, the vehicle’s operational hours and routes are relatively fixed, with charging occurring during nocturnal hours and concluding during diurnal hours. Both types of vehicles are connected to the grid during nocturnal hours and disengaged from the grid during diurnal hours, exhibiting analogous time characteristics. Through function fitting, the EV arrival time and departure time adhere to a normal distribution:
Official vehicles are used for daily official travel, and in order to prevent problems when charging is left unmanaged at night, the charging time of the official vehicles is set to place the vehicles in the parking lot for charging during the daytime after the staff members have gone to work. The temporal occurrence of the official vehicle’s connection to and disconnection from the grid conforms to a normal distribution:
The charging of taxis is characterized by a high degree of randomness due to their operation throughout the day. To address this issue, the Monte Carlo method was employed to randomly select taxi start charging times.
2.2 Electric Vehicle Scheduling Time Division
In order to improve the scheduling accuracy as well as the reasonableness of the charging cost calculation, the scheduling plan is executed in time segments, where the 24 h of the day are divided into 96 times segments in the model, each of which is 15 min in length, and the scheduling behavior, as well as the charging cost, are calculated according to the time segments. Therefore, the arrival period and departure period of each vehicle are:
In the aforementioned formula: the quantity of vehicles is denoted by N;
2.3 Electric Vehicle Daily Driving Range
The daily range of electric vehicles is a critical metric for evaluating the performance of different EV models. It quantifies the amount of electricity consumed by an EV over the course of a day and serves as a determining factor in the vehicle’s state of charge (SOC) when it is connected to the grid. The 2021 American Household Travel Survey Data (NHTS2021) serves as the primary data source for this study. Through rigorous statistical analysis, including function fitting techniques, it has been determined that the number of EVs follows a lognormal distribution, with a density function expressed as:
In Eq. (7): x is the EV daily mileage expressed in kilometers;
To prevent overcharging from affecting vehicle batteries, this paper sets the charge state of all-electric vehicles when they are disconnected from the grid as Sdis, 0.8 < Sdis < 1. Through the daily mileages of each vehicle, the state of charge Sc when each vehicle starts to charge can be calculated as follows:
In Eq. (8): α represent the proportion of electrical energy consumed by an electric vehicle for traveling one kilometer. In consideration of the research background of this paper, which is suitable for the low-temperature environment in winter, α includes the electric energy consumed by the vehicle driving and the electric energy consumed by heating. As delineated in Eq. (9), α1 signifies the proportion of power consumption allocated to the operation of the electric vehicle motor, while α2 denotes the percentage of electric energy expended for vehicle heating [23].
2.3.1 Electric Private Car Model
The utilization of electric private vehicles is primarily for daily commuting and suburban activities. With regard to long-distance travel, private cars are connected to the power grid after the owner returns home at approximately 6:00 p.m. Conversely, the vehicle is disconnected from the power grid when the owner departs at 8:00 a.m. The time at which the electric vehicle is connected to and subsequently disconnected from the power grid follows a normal distribution [24]. In this paper, the “BYD Qin” electric vehicle is selected as the object of data simulation, and the driving is carried out in the case of pure electricity by default. The battery capacity of the car is 18 kW·h, the full power mileage is 120 km, and the power consumption per 100 km is 14.5 kW·h, α1 = α2 = 1. This paper does not consider long-distance travel, and the daily mileage of private cars is about 40 km. Pursuant to the aforementioned analysis, the mean and variance of the time of private cars connected to the power grid are as follows: μ1tc = 18, δ1tc = 3.3, the mean and variance of the time of leaving the power grid are: μ1tdis = 8, δ1tdis = 3.24, and the daily mileage obeys the lognormal distribution N (3.8,0.722).
2.3.2 Electric Business Car Model
The electric official vehicle is connected to the power grid for charging during the period from the morning management staff to the evening management staff, and the charging behavior is carried out during the day. In order to unify the analysis, the “BYD Qin” electric vehicle is used as the object of data simulation, and the driving is performed by default in the case of pure electricity. The battery capacity of the car is 18 kW·h, the full power mileage is 120 km, and the power consumption per 100 km is 14.5 kW·h. The power consumption characteristics of official cars are the same as those of private cars, α1 = α2 = 1. It has been demonstrated that charging official vehicles once per day is sufficient to meet their travel requirements. Official vehicles are used for daily administrative affairs commuting, regardless of long-distance driving, and their daily mileage is similar to that of private cars. Pursuant to the aforementioned analysis, the mean and variance of the time of official vehicles connected to the power grid are as follows: μ2tc = 8.5, δ2tc = 3.3, and the mean and variance of the time of leaving the power grid are: μ2tdis = 17.5, δ2tdis = 3.24. Daily mileage obeys lognormal distribution N (3.8,0.722).
Given their indispensable role in urban mobility, buses must operate continuously during the day. According to the survey, bus operation hours are from 6:00 a.m. to 9:00 p.m. The daily mileage of buses is approximately 140 km. The “BYD K9” model is used as the object of data simulation. The battery capacity of this model of electric vehicle is 324 kW·h, the full power range is 250 km, and the power consumption per 100 km is 140 kW·h, α1 = 0.4, α2 = 0.2. The research situation in this paper is winter. Long-term heating will consume a certain amount of electricity, so it needs to be charged every night. According to the aforementioned analysis, the mean and variance of the bus access time to the grid are as follows: μ3tc = 22, δ3tc = 1, and the mean and variance of the time to leave the grid are: μ3tdis = 5.5, δ3tdis = 1. Daily mileage obeys lognormal distribution N (4.4,0.352).
Electric taxi owners have high requirements for charging time and the charging time period is not fixed. In this paper, it is set that all taxis adopt fast charging mode and randomly generate the time of access to the power grid. From the start of fast charging to the satisfaction of the required battery capacity, the taxi is disconnected from the power grid. According to the survey, the daily mileage of taxis is approximately 300 km. The “BYD E6” electric vehicle, with its battery capacity of 82 kW·h, a range of 400 km, and a power consumption of 20.5 kW·h per 100 km, has been selected as the object of data simulation. α1 = 0.3, α2 = 0.2. According to the above analysis, the daily mileage data is found to be distributed according to the lognormal distribution, N (5.1,0.352).
2.4 Dynamic Time-of-Use Electricity Price and Incentive Policy
The dynamic time-of-use electricity price model examined in this section employs a two-level price composition mechanism. The objective of this mechanism is to achieve coordinated optimization of electric vehicle load and power grid operation through the use of economic incentives. The model is composed of two components: the basic electricity price and the dynamic floating coefficient. The mathematical representation is demonstrated in Eq. (10):
In the aforementioned formula, C(r) denotes the charging price for period r; C1 represents the fundamental electricity price in the region; Ck signifies the floating ratio of each period relative to the base price; and k = 1, 2, 3, 4. The entire day-long operation cycle is segmented into four distinct periods, which correspond to the period of peak electricity consumption, the ordinary period of electricity consumption, the period of low electricity consumption, and the period of low electricity consumption. The value of Ck in each period is determined by the principle of “positive correlation between load level and electricity price”.
The implementation of specific incentive policies aimed at incentivizing electric vehicle users can serve to mobilize their enthusiasm for participation in grid interaction. It is imperative to note that electric vehicles are designed to adhere to the scheduling strategy outlined in this paper, with a maximum frequency of once per day. The compensation mechanism outlined in this paper is contingent upon the daily load of electric vehicles that are engaged in the scheduling process for charging. The incentive for the i-th EV is shown in the following equation:
As delineated in the aforementioned formula, the excitation coefficient is denoted by λa, and the charging amount of the i-th electric vehicle engaged in the scheduling process is indicated by
3 Electric Vehicle Scheduling Strategy Considering the Urgency of Charging Demand
3.1 Electric Vehicle Orderly Charging Scheduling Strategy
The sequential charging scheduling strategy for EVs in this paper is illustrated in Fig. 1:
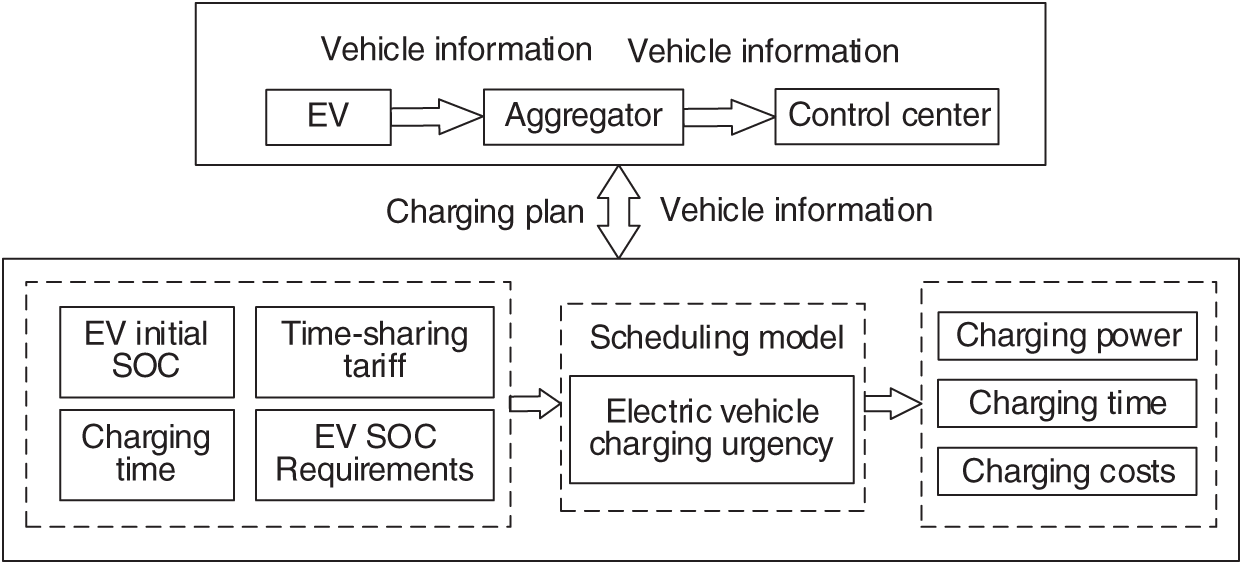
Figure 1: Electric vehicle scheduling model
While the EV is connected to the microgrid, the owner sets the lower state of charge of the electric vehicle demand, the higher SOC of the electric vehicle battery demand, and the expected time to leave the grid through the vehicle-machine interface. The aggregator integrates the owner’s information, the current electricity price, the vehicle access time, and the SOC when the electric vehicle is connected to the microgrid. The objective of the scheduling is to satisfy the user’s travel demand, thereby minimizing the consumer’s charging overhead and distribution network load fluctuations. Furthermore, the scheduling serves to reduce the peak-to-valley difference in the power grid.
3.2 Emergency Determination of Charging Demand
The scheduling model suggested in this article is based on the user’s charging demand, which needs to be scheduled during the time period when the electric vehicle is plugged into the grid. The time period for electric vehicles to access the microgrid is:
In the above equation:
The classification of electric vehicles is divided into four categories. Among them, private cars and official cars are divided into fast charging and conventional charging according to the urgency of charging demand. The taxi model employs a rapid charging method, while the bus model utilizes a conventional charging approach. In this article, the emergency parameter A of electric vehicle charging demand is determined by the charging amount E of conventional charging mode and the minimum load requirement M of the electric vehicle within the specified time:
In the above equation: Ps denotes the conventional charging power employed for EVs; The parameter η signifies the efficiency with which electric vehicles are charged;
3.3 Selection of Different Emergency Charging Modes for Electric Vehicles
In this paper, two charging modes are considered: fast charging and conventional charging. These modes are selected based on the actual situation. Fast charging mode reduces the charging time of electric vehicles by employing a higher charging current and voltage. However, this mode also has an impact on battery life. Consequently, fast charging mode is typically used in emergency situations. In the scheduling mode of this paper, the selection of charging mode is determined by the emergency parameter A of charging demand:
In the above equation: Pi represents the charging power specific to the i-th EV; Pf denotes the power utilized during rapid charging sessions; Ps is designated to represent the conventional charging power.
This paper defines the scheduling parameter x to fit different electric vehicle charging states and charging costs:
In the above equation: the scheduling parameter x is a 0–1 variable, and when x = 0, the i-th vehicle is not charging at the r-th time period. When x = 1, the i-th vehicle is charging at the r-th time period. In the event that the i-th vehicle has an emergency charging demand, it is possible to set it to 1 in the time period connected to the power grid until the end of charging. It is essential to ensure that EVs with emergency charging requirements can be charged to a higher SOC during charging time.
3.4 Optimization Model Considering Charging Urgency of Electric Vehicles
The objective of the scheduling methodology presented herein is twofold: to mitigate the peak-to-valley load disparity within the microgrid and reduce the charging fees that car owners need to pay. The aggregate load on the microgrid comprises the baseline load and the charging load, with the latter further categorizable as rapid-charging load and standard-charging load for EVs. The grid load during the r-th time interval is given by:
In the aforementioned equation:
The grid load curve variance is indicative of the magnitude of load fluctuation in the grid during a day. As demonstrated in Eq. (19), the greater the variance, the more significant the load fluctuation during that time period. Conversely, the smaller the variance of the load curve, the more uniform the load change of the grid during that time period:
In the above equation: T represents the total number of scheduling time intervals, which is set to 96 for the purposes of this analysis; Pt is the total system load after adding EV charging load at time period t; ¯P signifies the average load of the system.
This study establishes a scheduling model based on time-sharing tariff mechanisms. The primary objectives are to reduce the peak-to-valley differences in grid load and to decrease the charging costs for EV owners. The model optimizes the charging periods of EVs as the variable of interest, while also taking into account the interests of EV owners in a practical manner.
The main objective of EV scheduling is to mitigate the peak-to-valley disparity in the electrical grid. Accordingly, the objective function f1 is formulated as follows:
In the above equation: f1 is the minimum value of the peak-to-valley disparity in the electrical grid;
Based on the dynamic time-of-use price mechanism, the charging cost is saved by charging at the time of lower tariffs in the trough of the grid load, so the objective function f2 is described as:
In the above equation: f2 denotes the minimum value of charging cost; N represents the total number of EVs;
Due to the disparity in orders of magnitude and quantities of the grid load peak-to-valley disparity and charging cost, the microgrid peak-to-valley disparity is minimized as the primary objective. Therefore, the two objective functions are subjected to normalization, thereby transforming the multi-objective optimization challenge into a singular-objective issue, as delineated in Eq. (22):
In the aforementioned equation:
In circumstances where the demand for electric vehicle charging is urgent but the urgency is minimal, the implementation of continuous fast charging from
The i-th EV stops charging time period
The aforementioned equation compares the time period in which the owner sets the departure time period and the time period in which the maximum charging demand of the EV is met so that the EV charging time period ends at the integer time period preceding the smaller value of the two, which avoids battery damage due to overcharging.
For the conventional charging mode EV, it is necessary to constrain the SOC of the EV when it leaves the grid to meet at least the minimum power demand set by the owner:
In the above equation:
In order to prevent the emergence of new load peaks, the grid is constrained so that the maximum load of the grid under coordinated charging is lower than the maximum load of the grid when the maximum power demand of the vehicle owner is satisfied under non-coordinated charging:
Moreover, in practice, while certain vehicles can be connected to the power grid for extended periods throughout the day, considerations of owner convenience and the detrimental effects of frequent charging on battery longevity necessitate the implementation of charging constraints to regulate continuous EV charging:
The above formula is a charging constraint on the i-th car, using the 0–1 variable to make the absolute value of the difference between the charging parameters of the i-th car in the two time periods before and after the day sum to 2. It is imperative to ensure that each electric vehicle is constrained to charging and stopping charging once a day.
3.5 The Scheduling Process Considering the Emergency of Electric Vehicle Charging
Fig. 2 illustrates the process of calculating the charging cost and the total load on the grid when the charging mode is selected based on the degree of urgency, and the EV leaves with a charge between the owner’s maximum and minimum power demand.
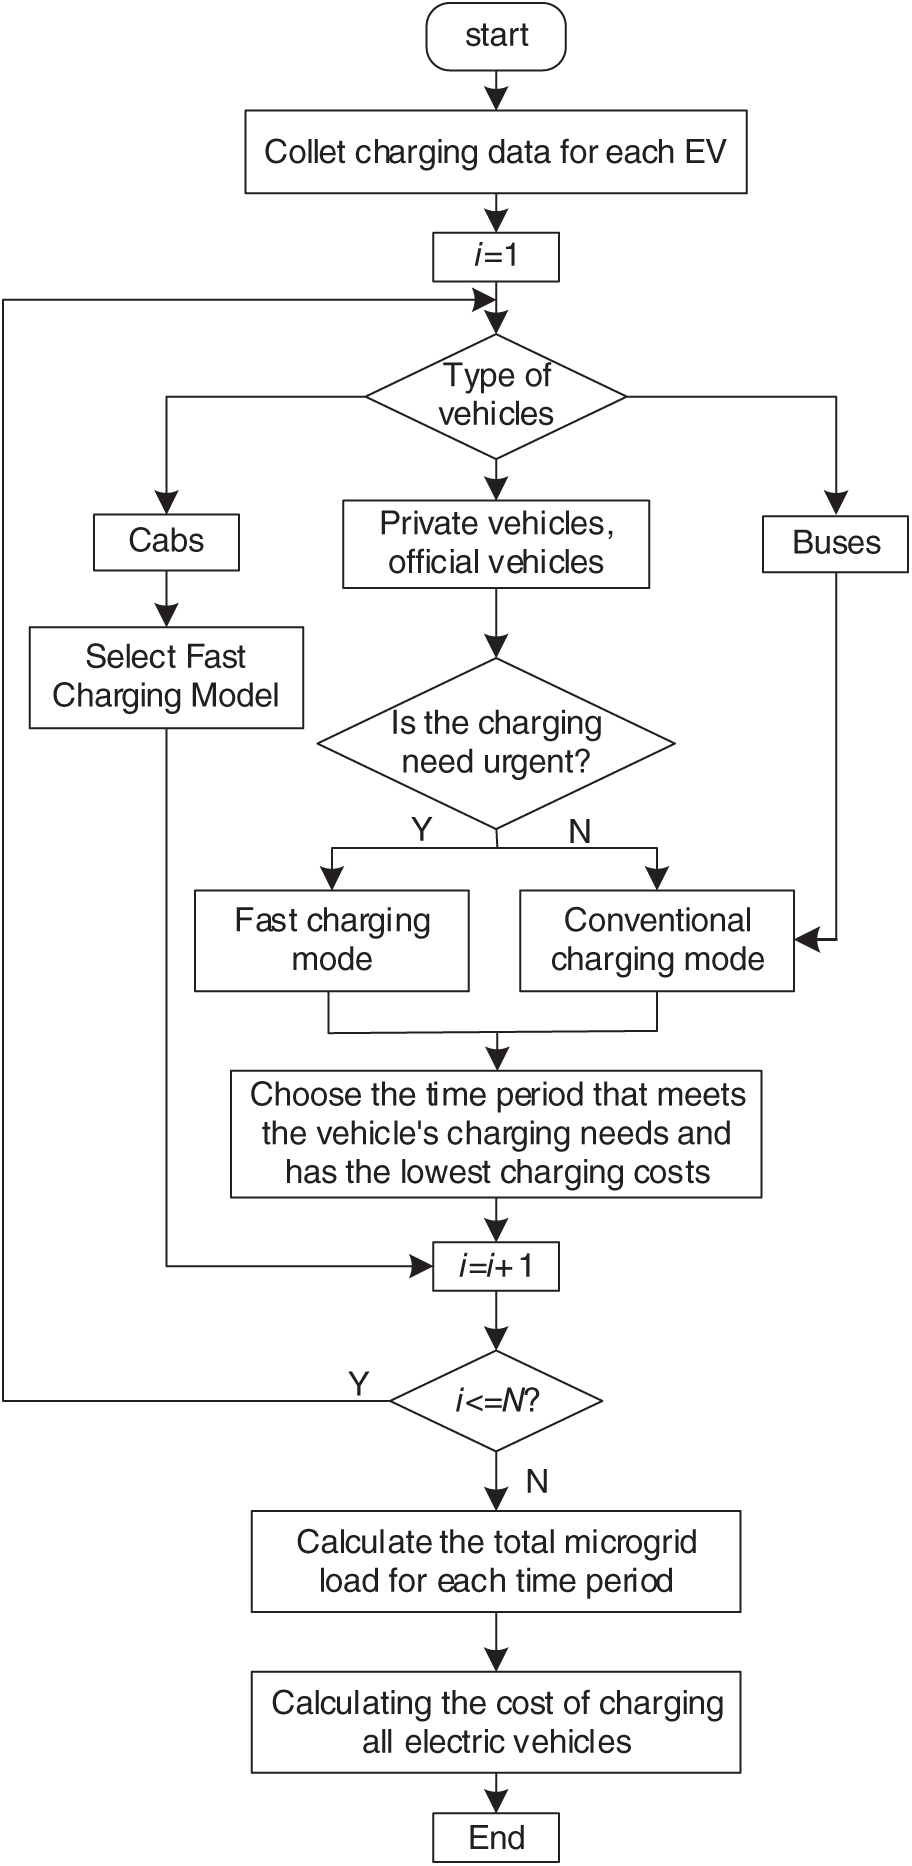
Figure 2: Coordinate the charging flow chart
This thesis, takes the charging of EVs connected to the grid in a commercial living area scenario as an example. The thesis proposes two disordered charging modes and one ordered charging mode, which are then considered. By comparing the charging cost and the peak-valley difference of the two disordered charging modes satisfying Smax and Smin, the efficacy of the proposed scheduling strategy has been demonstrated.
4.1 Scenarios and Parameter Settings
In this thesis, the total scheduling time T is set to be 24 h, and the time interval is 15 min. Based on the division of peak-valley periods, the peak-valley electricity price is established according to the average value of the optimized dynamic electricity price. The peak-valley electricity price used in the simulation is shown in Fig. 3, and the excitation parameter of λa set at 0.1. 100, 200, and 300 vehicles are used for simulation, and the ratio of private cars, official cars, buses, and cabs is set to be 5:2:2:1. Smin is set to be randomly and uniformly taken out between 0.8 and 0.9, and Smax is set to be randomly and uniformly taken out between 0.9 and 1.0.
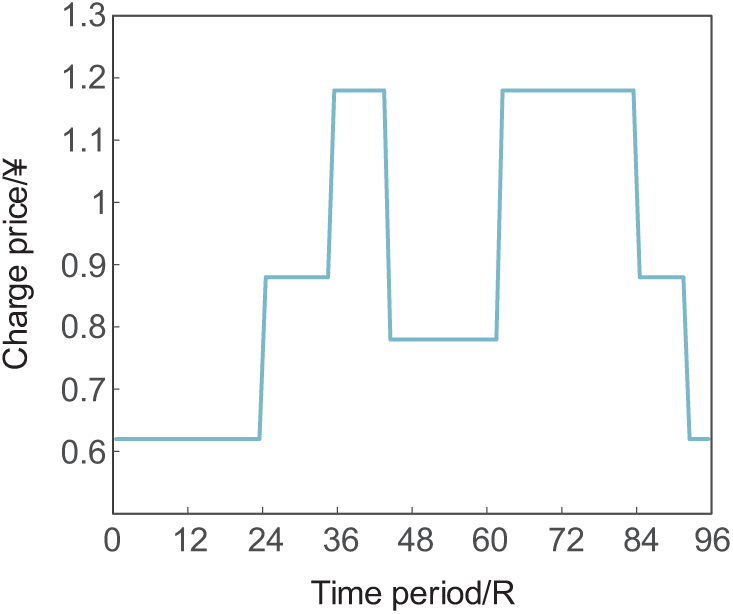
Figure 3: Time-of-use electricity tariff
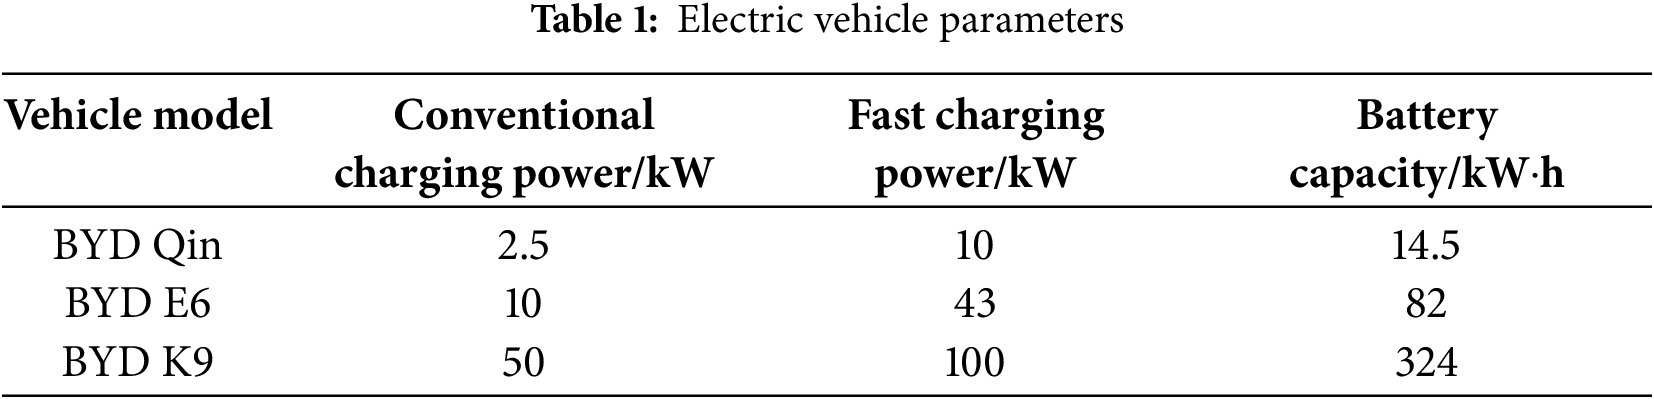
A selection of electric vehicles was made for private and official cars, with the BYD Qin model being selected for this purpose. For taxis, the BYD E6 model was chosen, and for buses, the BYD K9 model was selected. The parameters for the three types of vehicles are presented in Table 1.
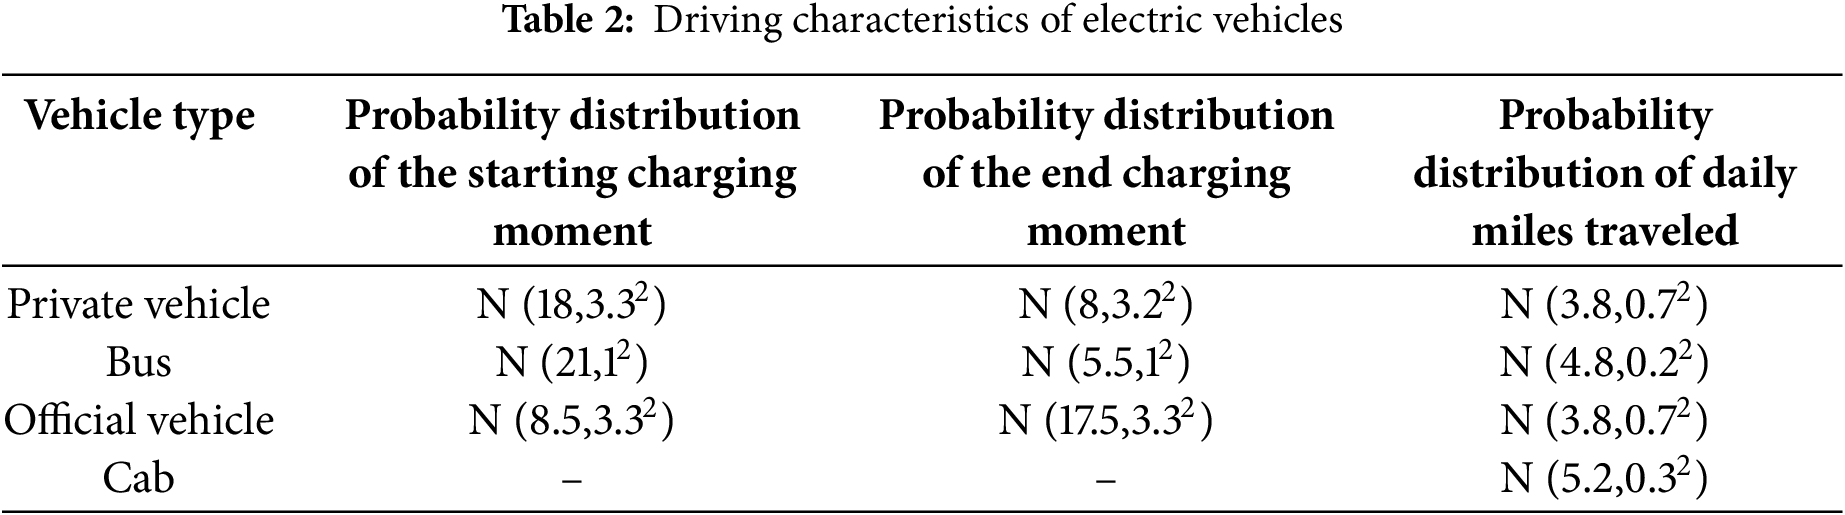
The departure and arrival time of EVs are found to adhere to a normal distribution, while their daily mileage exhibits a log-normal distribution. Consequently, the MCS is employed in this study to generate data for each EV. The parameters characterizing the driving behavior of EVs are detailed in Table 2.
The fundamental load of the study area is modeled according to the power consumption mode, and the results are displayed in Fig. 4.
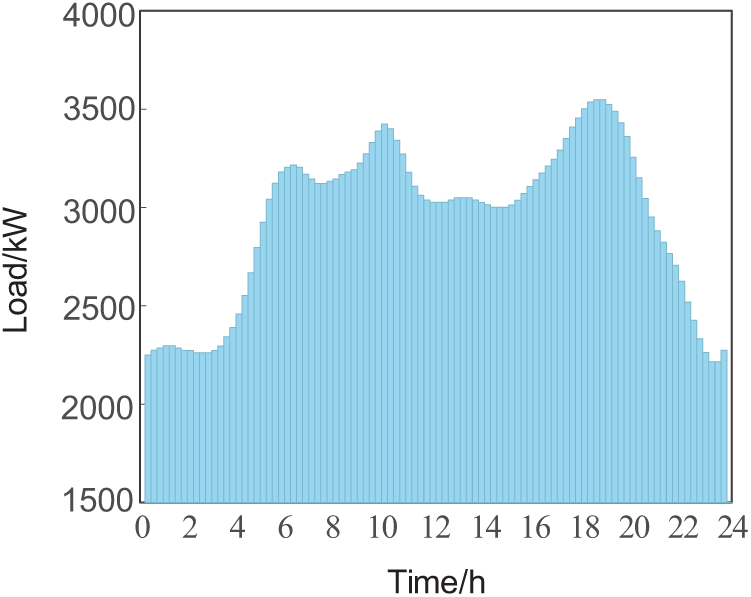
Figure 4: Microgrid baseload
Fig. 4 illustrates the typical base load distribution of a regional microgrid over a daily cycle. Notably, peaks occur approximately at 6 a.m., 10 a.m., and 6 p.m., with the highest load reaching 3547.8 kW and the lowest at 2216.1 kW. The peak-to-valley difference is 1331.7 kW, and the variance is 164, 186.88 kW2.
4.2 Scheduling Results and Comparative Analysis
In the simulation, the scheduling time is set from 0:00 to 24:00 in a day, and the period of a day is divided into 96 equal time periods with 15 min as a time period. To validate the effectiveness of the strategies proposed in this study, three distinct charging scenarios were established and subjected to comparative analysis.
Case 1: The EV adopts the disordered charging mode to meet the minimum power demand of the electric vehicle owner for charging.
Case 2: The EV adopts the disordered charging mode to meet the maximum power demand of the electric vehicle owner for charging.
Case 3: A coordinated charging strategy considering urgency is adopted for charging.
Under the uncoordinated charging mode, electric vehicles initiate charging upon connection and persist until either the designated departure time or the fulfillment of the EV’s maximum or minimum charging requirements. The experimental outcomes pertaining to EVs employing three distinct charging methodologies are depicted in Fig. 5. Specifically, Fig. 5a–c corresponds to the load diagrams of a microgrid under scenarios involving the charging of 100, 200, and 300 vehicles, respectively.
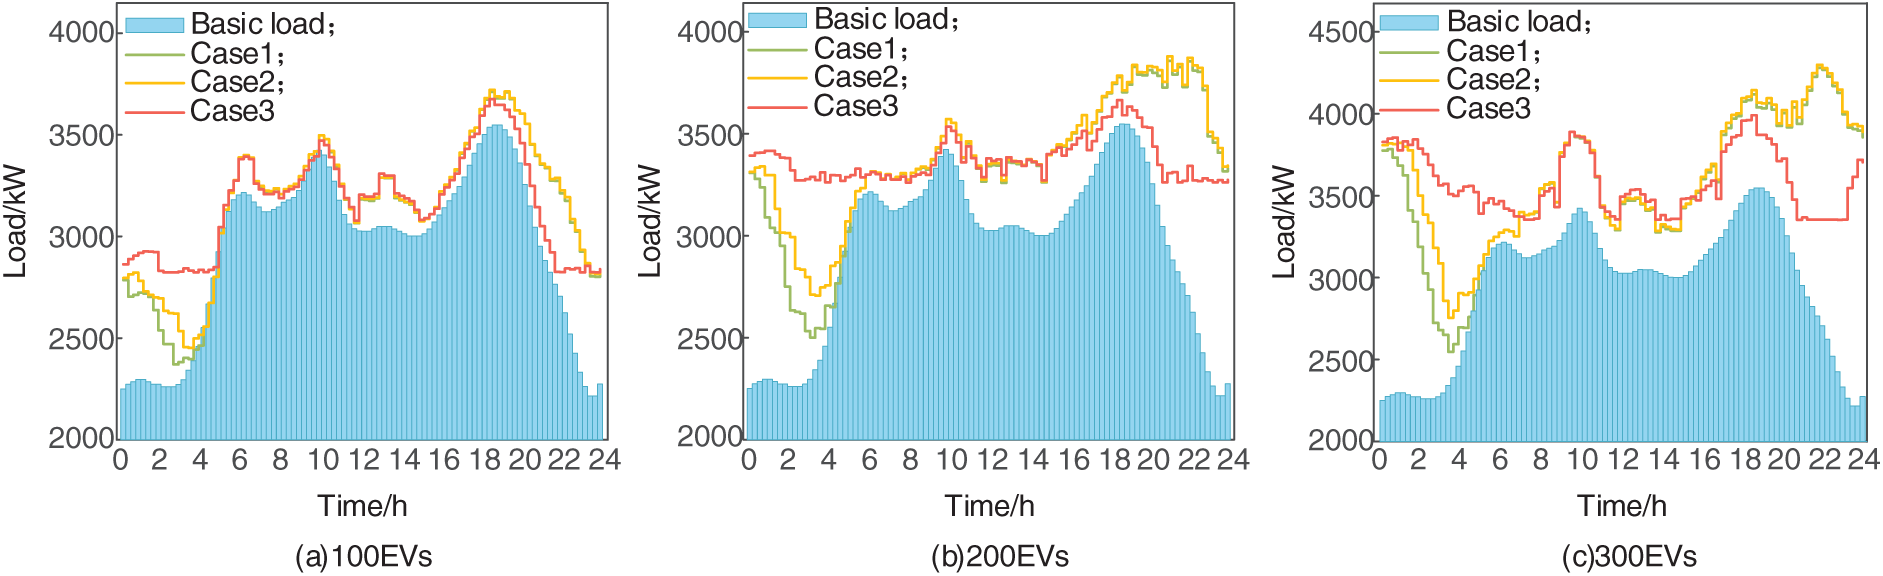
Figure 5: The total load of the microgrid under different scenarios. (a) Total load of the microgrid with 100 vehicles participating in the dispatch under different scenarios; (b) Total load of the microgrid with 200 vehicles participating in the dispatch under different scenarios; (c) Total load of the microgrid with 300 vehicles participating in the dispatch under different scenarios
Through the analysis of case 1 and case 2 in the above diagram, it is found that when the disordered charging method is adopted, a large number of owners charge the vehicle immediately after returning home. It coincides with the basic load of residents’ daily electricity consumption, resulting in a further escalation of the grid load peak around 18 o’clock, which seriously affects the security and stabilization of the electrical power grid. Under the same vehicle scale, the peak-to-valley disparity of the microgrid and the fluctuation of load in case 1 are greater than those in case 2. This is due to the relatively low base load level of the microgrid at night and the limited number of vehicles available for charging at night. Under unorganized charging, it is difficult to evenly distribute the charging load of EVs at all hours of the night. Conversely, in case 2, the larger charging load results in a longer charging time under the same charging power, thereby partially compensating for the lack of sufficient charging during off-peak hours. This phenomenon leads to a reduction in the peak-to-valley disparity and variance of the microgrid compared to case 1.
In the comparison of the three vehicle sizes, case 3 is effective in reducing the load fluctuations on the grid compared to cases 1 and 2. This is attributed to the fact that the coordinated charging approach proposed in this paper cuts down the load peaks from 18:00 to 22:00 h and boosts the early morning load troughs from 01:00 to 05:00 h. The time period during which EVs are connected to the microgrid is fully utilized, which leads to an even distribution of vehicle charging loads during that time period, and the charging periods of the same type of non-emergency vehicles may be distributed over multiple low-tariff windows instead of a single time period, thus avoiding the formation of new load spikes. Not only does it effectively reduce load fluctuations, but it also reduces the peak-to-valley and variance of the total load.
Using the scheduling method considering the emergency degree proposed in this article, the overall charging load of the EV is between the maximum SOC demand and the minimum SOC demand. It is proved that the EV charging load meets the owner’s vehicle demand and there is no overcharging condition.
Fig. 6 compares the three cases from the aspect of charging cost. Compared with case 1, case 2 has a larger charging load and costs more. Compared with case 2, case 3 can reduce the charging cost by 24.81%, 27.67%, and 26.51% respectively under the three vehicle scales. At the same time, it is proved that the coordinated charging strategy considering the urgency of the vehicle used in case 3 effectively utilizes the charging period provided by the owner. When the electricity price is low, the charging is carried out. Compared with case 2, the owner is charged at home, and the average charging cost of the owner is saved by 26.33%.
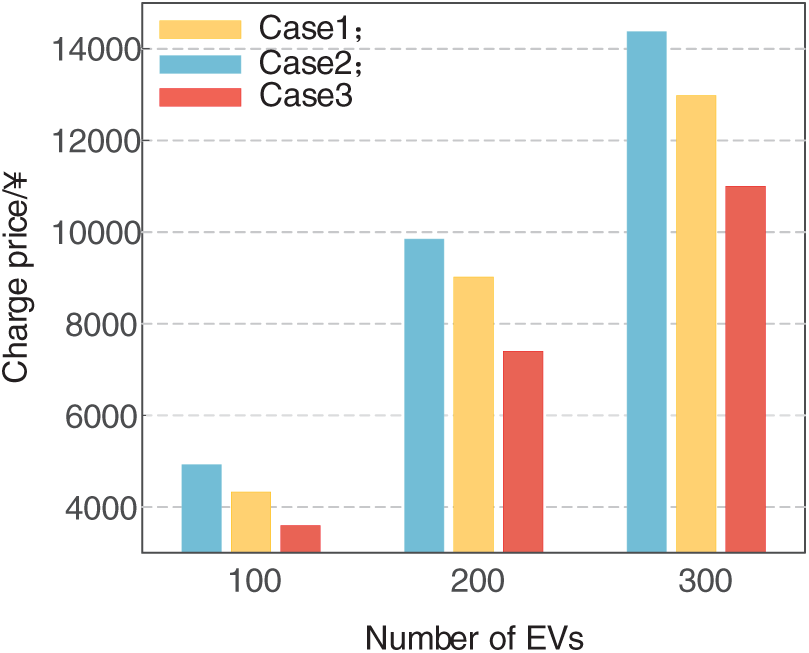
Figure 6: Electric vehicle charging costs under different circumstances
However, with the increase of vehicle size, the percentage of charging cost reduction in case 3 is not further reduced compared with case 2 but has a gradual upward trend. The reason is that the charging cost depends on the battery capacity of the vehicle and the charging time. Under the established microgrid conditions, the system usually arranges the vehicle to be charged during a period of low grid load and low charging cost. However, when the number of electric vehicles requiring charging reaches a certain threshold, to avoid generating a new load peak, some vehicles must be charged during other time periods. This results in a relative increase in charging costs. Consequently, this study demonstrates that the paper is based on distinct charging requirements rather than on the scheduling of all vehicles collectively.
Fig. 7 compares the influence of electric vehicle charging mode on the basic load in three cases. From Fig. 7, we can observe that the two disordered charging methods in case 1 and case 2 have a certain effect on reducing the microgrid base load variance when the number of charging vehicles is small, but the effect is not obvious. When the number of vehicles increases, uncoordinated charging will significantly increase the load variance of the microgrid and enhance the microgrid load volatility. Conversely, the implementation of coordinated charging has been observed to lead to a substantial reduction in microgrid base load variance, with the variance decreasing by 62.1%, 86.2%, and 83.4% for 100, 200, and 300 EVs, respectively. This indicates that coordinated charging significantly mitigates the load fluctuation of a microgrid.
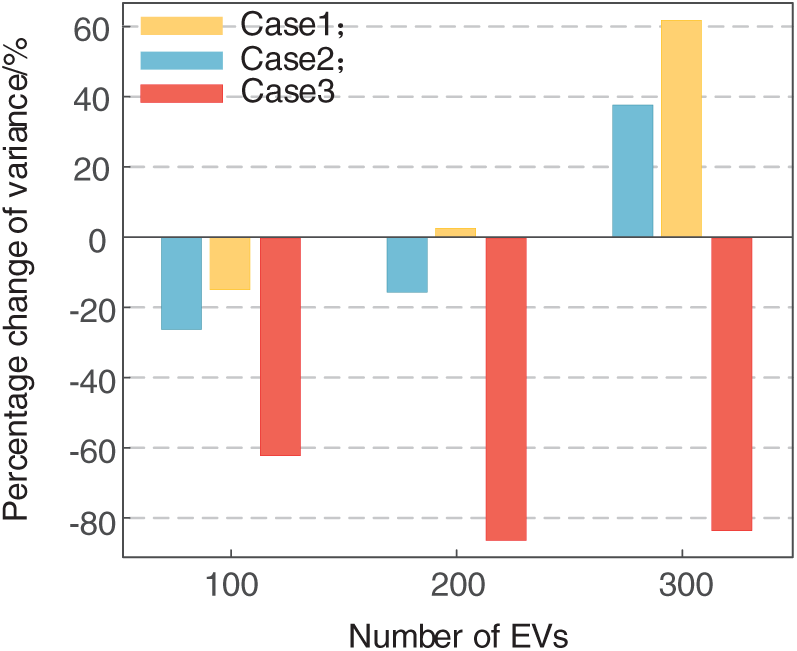
Figure 7: The effect of different scenarios on the variance of the base load
Figs. 8 and 9 compare the three situations from the aspects of micro-grid peak-to-valley disparity and micro-grid variance. It can be seen that under the three vehicle scales, compared with case 2, case 3 can reduce the peak-to-valley disparity of the total load of the microgrid by 40.95%, 64.34%, and 70.97%, respectively, and reduce the variance of the microgrid by 48.41%, 83.57% and 87.93%, respectively. It can be seen that regardless of the number of charging vehicles, the peak-to-valley difference and the volatility of the microgrid can always be significantly reduced by using the coordinated charging strategy proposed in this paper, which takes into account the degree of urgency of the vehicles, as compared to the unorganized charging.
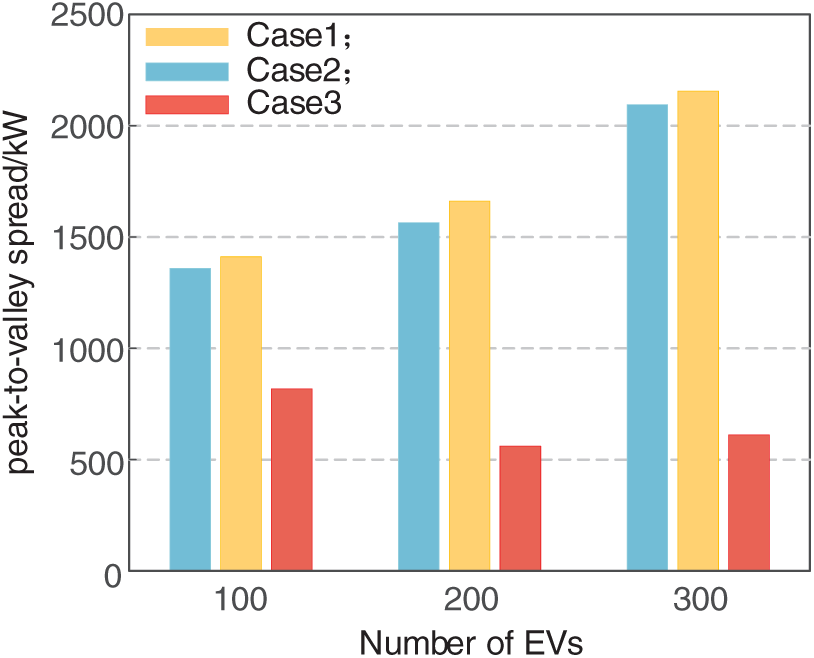
Figure 8: The peak-to-valley disparity of the microgrid under different scenarios
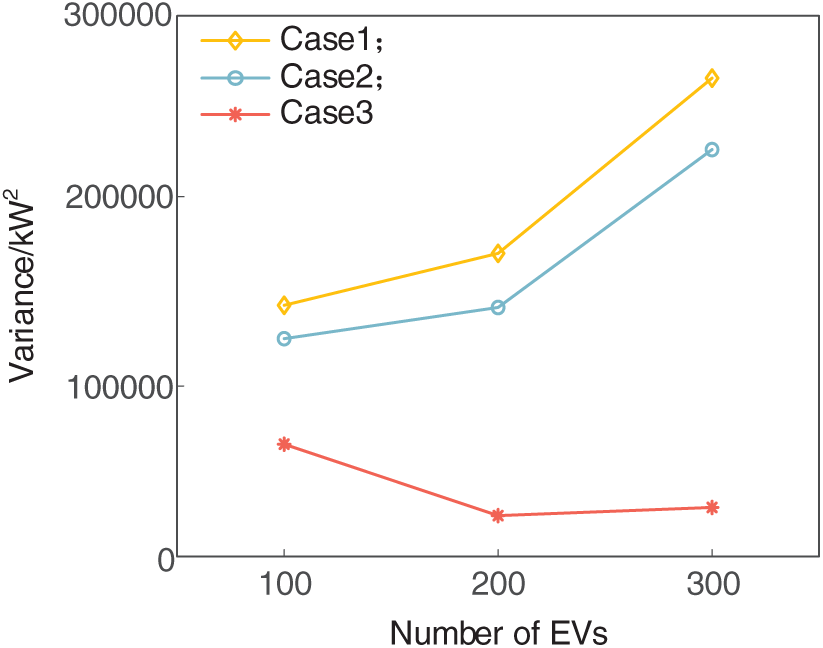
Figure 9: The variance of the microgrid under different scenarios
However, in case 3, when the number of EVs participating in coordinated charging is 300, the load variance of microgrid is larger than that when the number of vehicles is 200, and in the three cases, when the number of vehicles participating in the scheduling is 200, the variance of microgrid reaches the minimum. This is due to the limitation of the basic load of the microgrid, the charging power of EVs, and the charging time of EVs. When the number of electric vehicles increases, the peak-to-valley disparity and volatility of microgrids will not continue to decrease. Therefore, it is imperative to regulate the number of electric vehicles participating in the dispatching of the power grid for a specific research area to ensure the security and stability of the power grid.
4.3 Analysis of the Results Compared with Other Literature
Table 3 gives a comparison of the results of this paper’s strategy with those of other strategies proposed in the literature. Literature [25] considered multiple types of electric vehicles constructed charging load probability prediction models for each type of vehicle, and proposed a multi-objective cooperative scheduling strategy based on a genetic algorithm. Literature [26] considered the initial SOC and average daily mileage of electric vehicles and proposed an orderly charging strategy based on fuzzy logic and particle swarm algorithm.
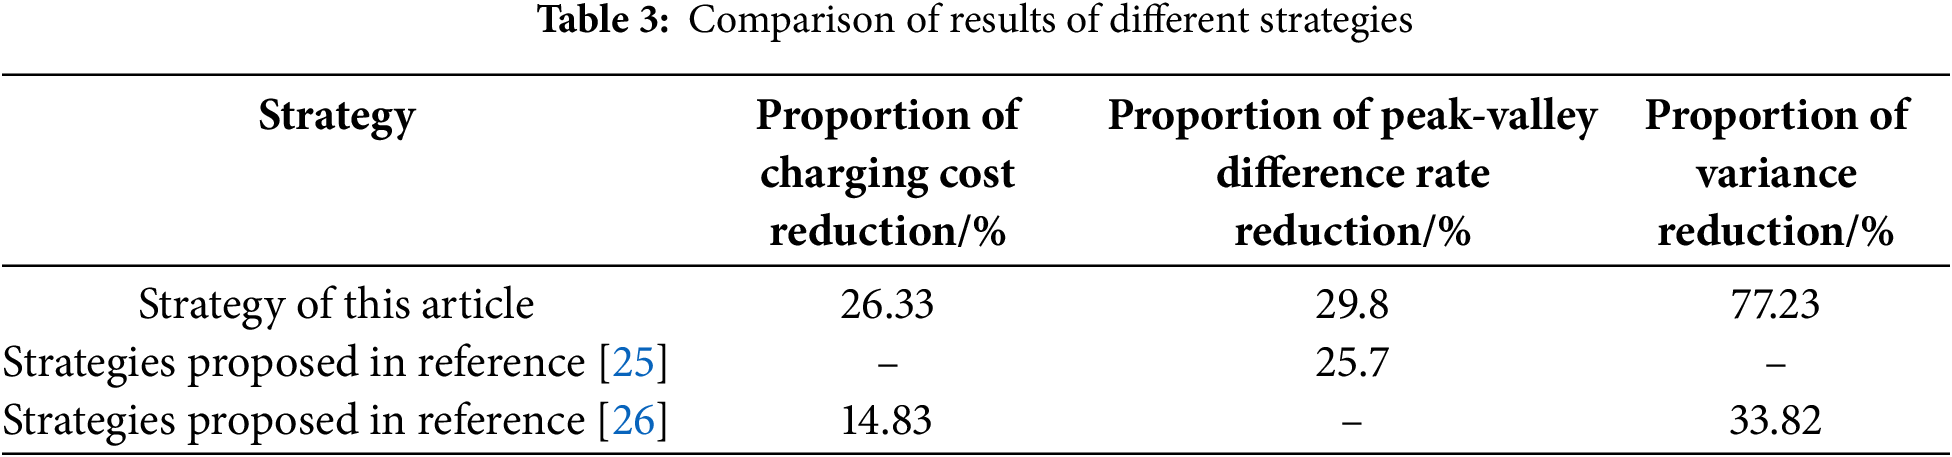
Using the scheduling strategy in this paper, compared with the case 2 disordered charging situation, the microgrid peak-to-valley difference rate is reduced by 29.8%, the user charging cost is reduced by 26.33% on average, and the microgrid variance is reduced by 77.23% on average. It can be seen that this strategy effectively reduces the peak-to-valley difference and relieves the pressure on the grid while saving the charging cost of vehicle owners.
This paper proposes a coordinated charging model for electric vehicles that accounts for the charging expenses of vehicle owners and the variance of the microgrid load. The model addresses the issues of uncoordinated charging of large-scale EVs leading to exacerbated peak loads on the grid and the insufficient consideration of charging costs. The model proposes the concept of emergency degree for different types of electric vehicles and controls the charging behavior of each electric vehicle by analyzing the remaining rechargeable time and the time required to reach the target state of charge. The effectiveness of this approach is verified through case studies, with the main conclusions presented as follows:
(1) In this paper, the emergency parameters of charging demand are introduced to schedule each electric vehicle independently, which avoids the problem of insufficient charging or overcharging that may occur in the overall scheduling, and has practical application value. The implementation of the proposed scheduling strategy has been shown to result in a 26.33% reduction in the average charging cost for vehicle owners and a 77.23% reduction in the average variance of microgrids. This approach achieves a mutually beneficial economic outcome while concurrently enhancing the safety of power grid operation.
(2) In light of the numerous types of electric vehicles available, and the recognition that a single model may not adequately address specific needs, this paper puts forth a classification system comprising four primary categories of EVs, deemed more practical. In the process of charging scheduling of electric vehicles, the charging continuity is fully considered, and the problem that some vehicle owners are reluctant to participate in the scheduling is solved after the EV is connected to the power grid many times in a short time to charge the vehicle and damage the battery.
In the simulation analysis of this paper, the microgrid and quantity of EVs involved in charging are in a relatively balanced state. If the number of dispatching vehicles and the scale of the microgrid are further expanded, the model considering the vehicle emergency scheduling strategy proposed in this article will be able to deal with the scale of the problem more fully. Subsequent steps in the research will entail an in-depth study of the balance between the number of vehicles involved in the microgrid and its internal dispatch.
Acknowledgement: Not applicable.
Funding Statement: This research was funded by Science and Technology Project of SGCC (SGJLCC00KJJS2203595).
Author Contributions: Conceptualization, Writing—review & editing, Supervision: Zhenhao Wang; Writing, Original draft, Conceptualization, Methodology: Hongwei Li; Data curation, Visualization: Jinming Ge; Investigation, Formal analysis: Dan Pang. All authors reviewed the results and approved the final version of the manuscript.
Availability of Data and Materials: The data that support the findings of this study are available from the corresponding author, Hongwei Li, upon reasonable request.
Ethics Approval: Not applicable.
Conflicts of Interest: The authors declare no conflicts of interest to report regarding the present study.
References
1. Gan L, Chen X, Yu K, Zheng J, Du W. A probabilistic evaluation method of household EVs dispatching potential considering users multiple travel needs. IEEE Trans Ind Appl. 2020;56(5):5858–67. doi:10.1109/TIA.2020.2989690. [Google Scholar] [CrossRef]
2. Mukherjee JC, Gupta A. A review of charge scheduling of electric vehicles in smart grid. IEEE Syst J. 2015;9(4):1541–53. doi:10.1109/JSYST.2014.2356559. [Google Scholar] [CrossRef]
3. Yue H, Zhang Q, Zeng X, Huang W, Zhang L, Wang J. Optimal scheduling strategy of electric vehicle cluster based on index evaluation system. IEEE Transact Indus Applicat. 2023;59(1):1212–21. doi:10.1109/TIA.2022.3213639. [Google Scholar] [CrossRef]
4. Salam SSA, Raj V, Petra MI, Azad AK, Mathew S, Sulthan SM. Charge scheduling optimization of electric vehicles: a comprehensive review of essentiality, perspectives, techniques, and security. IEEE Access. 2024;12(1):121010–34. doi:10.1109/ACCESS.2024.3433031. [Google Scholar] [CrossRef]
5. Nimalsiri NI, Ratnam EL, Smith DB, Mediwaththe CP, Halgamuge SK. Coordinated charge and discharge scheduling of electric vehicles for load curve shaping. IEEE Transact Intell Transport Syst. 2022;23(7):7653–65. doi:10.1109/TITS.2021.3071686. [Google Scholar] [CrossRef]
6. Zhong S, Che Y, Zhang S. Electric vehicle charging load optimization strategy based on dynamic time-of-use tariff. Energy Eng. 2024;121(3):603–18. doi:10.32604/ee.2023.044667. [Google Scholar] [CrossRef]
7. Elghanam E, Abdelfatah A, Hassan MS, Osman AH. Optimization techniques in electric vehicle charging scheduling, routing and spatio-temporal demand coordination: a systematic review. IEEE Open J Vehicular Technol. 2024;5(15):1294–313. doi:10.1109/OJVT.2024.3420244. [Google Scholar] [CrossRef]
8. Wang S, Liu B, Hua Y, Li Q, Tang B, Zhou J, et al. Dispatchable capability of aggregated electric vehicle charging in distribution systems. Energy Eng. 2025;122(1):129–52. doi:10.32604/ee.2024.054867. [Google Scholar] [CrossRef]
9. Zhang S, Yu JJQ. Electric vehicle dynamic wireless charging system: optimal placement and vehicle-to-grid scheduling. IEEE Internet Things J. 2022;9(8):6047–57. doi:10.1109/JIOT.2021.3109956. [Google Scholar] [CrossRef]
10. Shen J, Wang L, Zhang J. Integrated scheduling strategy for private electric vehicles and electric taxis. IEEE Transact Indus Inform. 2022;17(3):1637–47. doi:10.1109/TII.2020.2993239. [Google Scholar] [CrossRef]
11. Liu D, Wang L, Wang W, Li H, Liu M, Xu X. Strategy of large-scale electric vehicles absorbing renewable energy abandoned electricity based on master-slave game. IEEE Access. 2021;9:92473–82. doi:10.1109/ACCESS.2021.3091725. [Google Scholar] [CrossRef]
12. Chen Q, Folly KA. Application of artificial intelligence for EV charging and discharging scheduling and dynamic pricing: a review. Energies. 2023;16(1):146. doi:10.3390/en16010146. [Google Scholar] [CrossRef]
13. Tan M, Ren Y, Pan R, Wang L, Chen J. Fair and efficient electric vehicle charging scheduling optimization considering the maximum individual waiting time and operating cost. IEEE Transact Vehicul Technol. 2023;72(8):9808–20. doi:10.1109/TVT.2023.3257547. [Google Scholar] [CrossRef]
14. Chaudhari K, Kandasamy NK, Krishnan A, Ukil A, Gooi HB. Agent-based aggregated behavior modeling for electric vehicle charging load. IEEE Trans Ind Infor. 2019;15(2):856–68. doi:10.1109/TII.2018.2823321. [Google Scholar] [CrossRef]
15. Joshua KP, Ranga J, Prasad PV, Mallala B, Rajendiran M, Maranan R. Optimized scheduling of electric vehicles charging in smart grid using deep learning. In: 2024 International Conference on Expert Clouds and Applications (ICOECA); 2024; Bengaluru, India. p. 408–12. [Google Scholar]
16. Bharti KP, Ashfaq H, Kumar R, Singh R. Designing a bidirectional power flow control mechanism for integrated EVs in PV-Based grid systems supporting onboard AC charging. Sustainability. 2024;16(20):8791. doi:10.3390/su16208791. [Google Scholar] [CrossRef]
17. Zhou K, Cheng L, Wen L, Lu X, Tao D. A coordinated charging scheduling method for electric vehicles considering different charging demands. Energy. 2020;213(18):118882. doi:10.1016/j.energy.2020.118882. [Google Scholar] [CrossRef]
18. Wu W, Lin Y, Liu R, Li Y, Zhang Y, Ma C. Online EV charge scheduling based on time-of-use pricing and peak load minimization: properties and efficient algorithms. IEEE Trans Intell Transp Syst. 2022;23(1):572–86. doi:10.1109/TITS.2020.3014088. [Google Scholar] [CrossRef]
19. Kapoor A, Patel VS, Sharma A, Mohapatra A. Centralized and decentralized pricing strategies for optimal scheduling of electric vehicles. IEEE Transact Smart Grid. 2022;13(3):2234–44. doi:10.1109/TSG.2022.3141261. [Google Scholar] [CrossRef]
20. Hafez O, Bhattacharya K. Integrating EV charging stations as smart loads for demand response provisions in distribution systems. IEEE Trans Smart Grid. 2018;9(2):1096–106. doi:10.1109/TSG.2016.2576902. [Google Scholar] [CrossRef]
21. Wang X, Sun C, Wang R, Wei T. Two-stage optimal scheduling strategy for large-scale electric vehicles. IEEE Access. 2020;8:13821–32. doi:10.1109/ACCESS.2020.2966825. [Google Scholar] [CrossRef]
22. Qi T, Ye C, Zhao Y, Li L, Ding Y. Deep reinforcement learning based charging scheduling for household electric vehicles in active distribution network. J Modern Pow Syst Clean Ene. 2023;11(6):1890–901. doi:10.35833/MPCE.2022.000456. [Google Scholar] [CrossRef]
23. Yan J, Zhang J, Liu Y, Lv G, Han S, Alfonzo IEG. EV charging load simulation and forecasting considering traffic jam and weather to support the integration of renewables and EVs. Renew Energy. 2020;159(2):623–41. doi:10.1016/j.renene.2020.03.175. [Google Scholar] [CrossRef]
24. Chen L, Yu T, Chen Y, Guan W, Shi Y, Pan Z. Real-time optimal scheduling of large-scale electric vehicles: a dynamic non-cooperative game approach. IEEE Access. 2020;8:133633–44. doi:10.1109/ACCESS.2020.3009039. [Google Scholar] [CrossRef]
25. Zhang H, Xu X, Huang J, Rashed GIR. Optimal scheduling strategy for multi-type electric vehicle charging based on improved GA. In: 2024 6th International Conference on Energy Systems and Electrical Power (ICESEP); 2024; Wuhan, China. p. 1383–6. [Google Scholar]
26. Ma Y, Wang W, Bai Y, Yang K, Song Z, Meng J. Research on orderly charging strategy for electric vehicles based on fuzzy logic and PSO algorithm. In: 2024 CPSS & IEEE International Symposium on Energy Storage and Conversion (ISESC); 2024; Xi’an, China. p. 642–7. [Google Scholar]
Cite This Article
 Copyright © 2025 The Author(s). Published by Tech Science Press.
This work is licensed under a Creative Commons Attribution 4.0 International License , which permits unrestricted use, distribution, and reproduction in any medium, provided the original work is properly cited.
 Downloads
 Citation Tools