
 Submit a Paper
 Propose a Special lssue
 Open Access
ARTICLE

Hierarchical Optimal Scheduling Strategy for High Proportion New Energy Power Systems Considering Balanced Response to Grid Flexibility
1 Key Laboratory of Modern Power System Simulation and Control & Renewable Energy Technology, Ministry of Education (Northeast Electric Power University), Jilin, 132012, China
2 Power Dispatching and Control Branch, Inner Mongolia Electric Power Group Co., Ltd., Hohhot, 010020, China
* Corresponding Author: Junhui Li. Email:
Energy Engineering 2025, 122(8), 3055-3077. https://doi.org/10.32604/ee.2025.064440
Received 16 February 2025; Accepted 11 April 2025; Issue published 24 July 2025
 View Full Text
 Download PDF
Abstract
The penetration rate of new wind and photovoltaic energy in the power system has increased significantly, and the dramatic fluctuation of the net load of the grid has led to a severe lack of flexibility in the regional grid. This paper proposes a hierarchical optimal dispatch strategy for a high proportion of new energy power systems that considers the balanced response of grid flexibility. Firstly, various flexibility resource regulation capabilities on the source-load side are analyzed, and then flexibility demand and flexibility response are matched, and flexibility demand response assessment is proposed; then, a hierarchical optimal dispatch model of the grid taking flexibility adjustment capability into account is established, and the upper model optimizes the net load curve with the objectives of minimizing the fluctuation of the net load, maximizing the benefits of energy storage and controllable loads, and optimizing the flexibility adjustment capability. The upper layer model optimizes the net load curve by minimizing net load fluctuation, maximizing energy storage and controllable load revenue, and optimizing flexibility adjustment capability. In contrast, the lower layer model optimizes the power allocation of thermal power units and regulates the lost load of wind and solar power generation by minimizing the total system operating cost. The results show that the proposed strategy improves the flexibility of the grid by 15.2%, gives full play to the regulation capability of each flexibility resource, and reduces the fluctuation of the net load by 15.6% to achieve optimal coordination between different types of flexibility resources.Keywords
With China’s ‘dual-carbon’ goal [1–3], the penetration of new energy sources has been increasing and has become an integral part of the power system. However, this also exacerbates the randomness and volatility of power grid operations [4–7]. As the proportion of new energy continues to rise, it is crucial to explore how to utilize different types of energy to complement one another to reduce the abandonment of wind and photovoltaic power and enhance the overall flexibility of the power grid. This presents an urgent problem that must be addressed. In traditional grid scheduling and control, new energy sources operate in conjunction with the grid but do not participate in active control, resulting in a significant shortage of regulated resource capacity at the receiving end of the grid [8–11]. As net load fluctuations increase, many optimal scheduling strategies struggle to achieve timely balanced regulation of flexibility resources since grid scheduling primarily prioritizes the economic operation of the system [12–15]. This focus complicates the ability to ensure adequate flexibility and diminishes the grid’s resilience to risks.
In terms of grid flexibility [16–19], domestic and international studies primarily focus on the power side and the grid side, with numerous investigations dedicated to assessing flexibility resources [20,21]. One study presents a day-ahead scheduling method for renewable energy systems that balances flexibility and economy [22]. This study proposes a new Integrated Resource Strategic Planning Framework for Interregional Flexibility (IRSP-IF) that assesses cross-regional flexibility needs and optimizes cross-regional power resource allocation [23]. In the paper, an optimization strategy for flexible operation is proposed at the system level to guide the real-time flexible ramping of the grid, and a ramping factor is proposed as a flexibility metric, which focuses more on flexibility than on economics compared to the traditional model [24]. Combining the advantages of the capacity expansion model SWITCH-China and the production simulation model PLEXOS, this study analyses the flexibility options for China’s renewable energy-dominated power system under different Scenarios and finds that a larger balancing area can lead to direct flexibility advantages [25]. One study presents a comprehensive three-phase framework for unlocking the flexibility capabilities of energy communities and microgrids in balancing markets, aiming to eliminate real-time imbalances between energy production and consumption [26]. One study proposes a new methodology to assess the flexibility of DC renewable energy systems when covering regional lines. It introduces a new quantitative metric called the Flexibility Deployment Index (FDI) [27].
To enhance the balanced regulation of flexible resources over time, extensive research has been conducted on optimal scheduling strategies for energy management [28]. Key studies have focused on optimizing the use of regional energy sources with an emphasis on flexibility and reliability [29–31]. A study proposes an energy storage behavioral decision-making model based on the Soft Behavioural Critique (SAC) algorithm for energy storage system (ESS) scheduling, and by analyzing the output characteristics of wind farms, the output of the wind power prediction model can be used as a wind farm scheduling plan [32]. The study proposes an integrated energy system configuration and optimal scheduling method for hydrogen-to-ammonia and ammonia-mixed-oxygen-enriched combustion in thermal power units, which enriches the system products and improves the economic efficiency through the introduction of an ammonia synthesis system [33]. This study uses a two-stage optimization technique to solve the problem of optimal location and sizing of battery energy storage (BES) devices [34]. This study proposes an optimal scheduling strategy for ES-MCS under the Integrated Carbon Green Certificate Trading (ICGCT) mechanism to further reduce the carbon emission level of the Energy Storage-Multiple Complementary System (ES-MCS) and to improve the economics of the system operation [35]. This study proposes a three-objective scheduling strategy for island microgrids based on the Improved Multi-Objective Particle Swarm Optimisation (IMOPSO) algorithm, which considers the economic cost, renewable energy utilization, and user satisfaction [36]. A study models stochastic electric utility outages caused by flooding and develops appropriate power system dispatch strategies for extreme precipitation events [37]. This study proposes an electricity-steam-based coordinated optimal scheduling method for virtual power plants to effectively address the challenges of customer load regulation in the textile industry [38]. The article presents an innovative active and reactive power optimal dispatch model to maximize community welfare [39]. This article presents a Membrane Search Algorithm (MSA) based on the theory of membrane computation, which is improved for the problem of minimizing ORPD transmission losses in complex, non-convex, non-linear, and discrete power systems [40]. This study describes a framework for multiple incentives for PEDF parks, a type of building energy system that employs PEDF technology, and the proposed incentives include both economic and non-economic aspects [41]. Lastly, a unique characterization method [42] is proposed, featuring a learning module and an updating module. This approach tackles the challenges posed by conventional methods when managing AC currents and numerous Renewable Distributed Energy Resources (RDERs), providing a more accurate evaluation.
The existing literature extensively evaluates various flexibility resources and suggests effective methods. However, these studies primarily focus on assessing flexibility supply capacity, often overlooking the crucial aspect of matching supply with demand. The full potential of user-side resources remains untapped, highlighting the need for advanced modeling and control techniques to represent user behavior in demand response Scenarios accurately. Furthermore, current research rarely considers the integrated use of multiple flexibility resource types, which can complement each other. This oversight hinders the efficient utilization of all available resources within the grid. To address these gaps, a more holistic approach is essential for optimizing grid resource management.
In summary, this paper proposes a hierarchical optimal scheduling strategy for high-ratio new energy power systems that considers the balanced response of grid flexibility. The details are as follows: first, the regulation capabilities of various flexibility resources on the source-load side are analyzed, and then the flexibility demand/response module is established to determine the flexibility resources and their constraints involved in dispatch at each period by calculating the matching results during the demand response dispatch cycle. Then, a two-layer optimization is used, where the upper model takes the minimum net load fluctuation, the maximum benefit of storage and controllable load, and the optimal flexibility adjustment capability as the objectives and considers the storage and controllable load constraints to optimize the net load curve. The lower model takes the minimum total operating cost as the objective and considers the thermal constraints, power balance constraints and so on to enable the thermal units to allocate power. Finally, simulation verification through the arithmetic system shows that the scheduling strategy improves the flexibility of the grid and promotes the coordination between flexible resources while considering the economy.
This paper’s innovations are as follows: it matches the supply and demand of grid flexibility, which improves the applicability of flexibility resources to the grid; it actively uses load-side resources to participate in scheduling, which increases the scheduling range and improves the economy of system operation; and it adopts a two-layer optimization model, which takes into account the temporal equilibrium of grid flexibility.
2 Source-Load Side Adjustable Resource Capacity Analysis and Scheduling Strategy Framework
2.1 Source-Load Side Adjustable Resource Capacity Analysis
This paper explores diverse adjustable resources within the regional power grid, including new energy stations, thermal power plants, pumped storage facilities, energy storage sites, and controllable loads. As illustrated in Fig. 1, these resources face challenges due to the high volatility of net load. This results in the underutilization of flexibility resource capacity on the source-load side. Additionally, the load side comprises various flexibility resources, hindering the development of large-scale flexibility regulation resources.
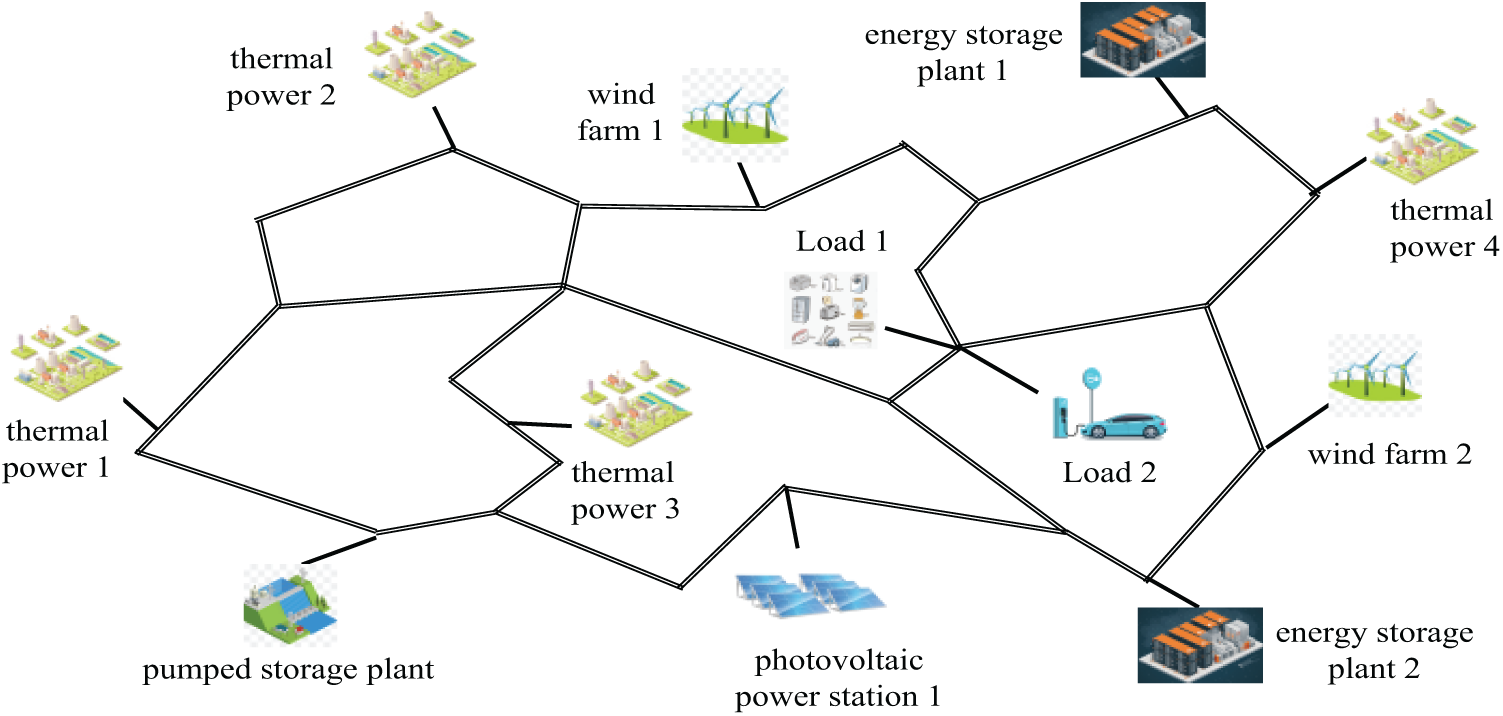
Figure 1: Schematic of a regional grid with multiple flexibility resources
The regional power grids boast diverse flexibility resources, integrating numerous distributed power sources, various energy storage solutions, and different types of loads. These resources are characterized by their uncertainty and decentralization. To effectively enhance the capability of regional power grids to handle unpredictability, achieving an optimal balance between supply and demand is essential. This optimization enhances the grid system’s economic, temporal, and spatial attributes. Flexibility resources are primarily located on both the power supply and load sides. The power supply side includes thermal power units, hydropower units, wind power units, photovoltaic systems, pumped storage power stations, and various energy storage facilities. On the load side, flexibility is provided by curtailable loads, transferable loads, and several energy storage technologies. Conventional units, renewable energy sources, diverse energy storage systems, and controllable loads form the backbone of the regional power grid’s flexibility resources, ensuring improved grid reliability and efficiency.
Traditional energy units offer upward and downward flexibility by increasing or decreasing their output in the realm of flexibility resources. On the other hand, renewable energy sources, such as wind and solar power, provide downward flexibility by occasionally curtailing wind or light usage. The capabilities for adjusting this flexibility, both upward and downward, are detailed in Eqs. (1) and (2) [43].
Style:
Electrochemical energy storage systems and pumped storage solutions both excel in offering upward and downward flexibility regulation. These methods are recognized as highly regulated flexibility resources, as demonstrated in Eq. (3) [43].
Style:
Controllable loads offer significant flexibility in energy management by allowing the adjustment of power usage. Switching loads on or off can effectively increase upward and downward regulation capabilities. This makes them an excellent resource for enhancing system flexibility while delivering substantial benefits. Eq. (4) [43] demonstrates the ability to manage power demand efficiently through controllable loads.
Style:
This subsection comprehensively evaluates the flexibility resources available within the regional grid. It identifies the grid’s capacity for flexibility adjustments, crucial for conducting future flexibility demand response assessments. This evaluation helps lay the groundwork for practical regional flexibility demand response analysis.
2.2 Scheduling Strategy Framework
This paper introduces a hierarchical optimal scheduling strategy to enhance the cost and performance of flexible resources in new energy power systems, such as thermal power units and energy storage plants. By focusing on both the source and load sides, our approach seeks to achieve a balanced response in grid flexibility. Initially, the strategy involves a comprehensive data collection process that assesses the flexibility of demand response. This assessment gathers crucial information, including new energy output data, load data, and parameters of flexibility resources. These insights then match the flexibility demand with the flexibility adjustment capacity. Furthermore, we identify the power and start-stop constraints of flexibility resources, which are incorporated into a grid hierarchical optimal dispatch model, emphasizing flexibility adjustment capacity. The model operates through two key layers: the power allocation layer and the total operating cost optimization layer. Together, they deliver optimized scheduling results, ensuring efficient power distribution and minimized operational costs. For a detailed overview of the framework, please refer to Fig. 2. By implementing this strategy, power systems can significantly improve flexibility and cost-efficiency, ultimately leading to more sustainable energy management.
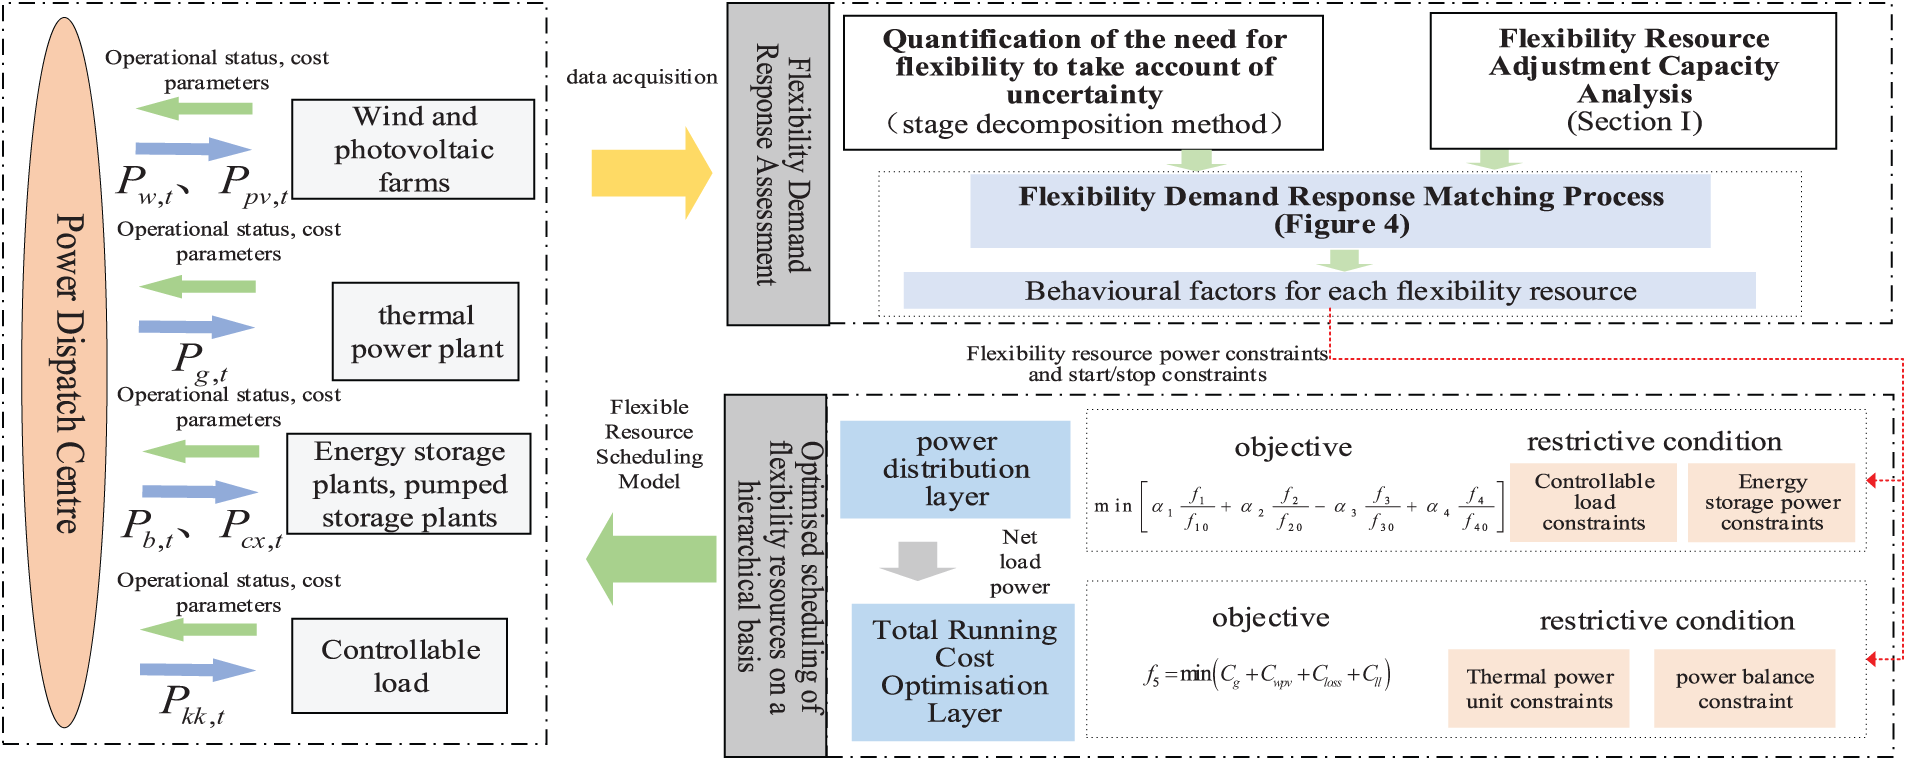
Figure 2: Block diagram of hierarchical optimal dispatch strategy for multi-energy systems considering balanced response to grid flexibility
3 Flexibility Demand Response Assessment
Fig. 3 illustrates the framework for aligning flexibility needs with appropriate responses. This process primarily involves aligning decomposed flexibility demand analyses with the capabilities of flexibility resources. To begin with, a flexibility demand quantification method calculates the range of flexibility needs. Next, a stage decomposition method identifies the extreme points on the flexibility demand curve. By integrating and differentiating the curve between these points, the total flexibility demand for this stage is determined. Incorporating keywords seamlessly into your content will enhance its visibility to your target audience.
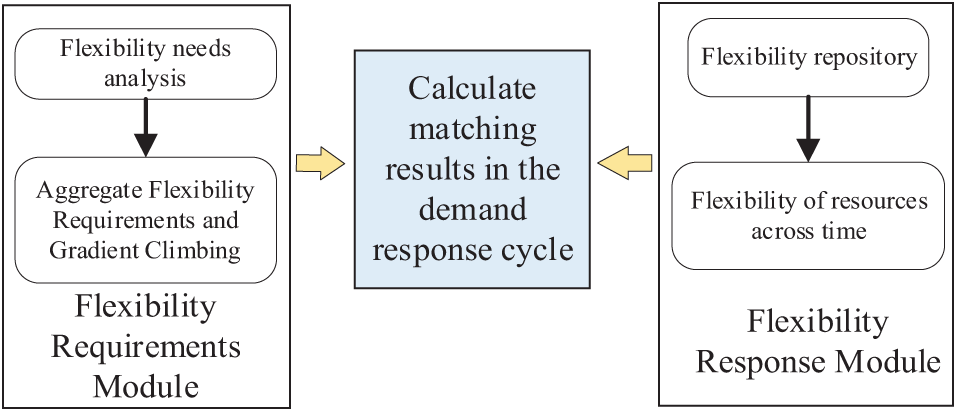
Figure 3: Flexible demand response matching framework
To accurately assess the total flexibility demand and the climb demand for each period, it is essential to consider the dynamic range of flexibility phases. This can be achieved by integrating and differentiating the flexibility curves. Understanding these phases can provide deeper insights into meeting flexibility demands effectively. Fulfill a condition
In this phase, the limitations of flexibility resources are determined based on their roles in scheduling priorities. This includes constraints related to power balance and equipment output. As outlined in Eq. (5), at any given time (t), the output power of flexibility resources must meet the specified modal power demand. Additionally, the maximum output power for each type of flexibility resource at time (t) is detailed in Section 2.1.
Style:
Finally, the overall flexibility demand response matching process is shown in Fig. 4.
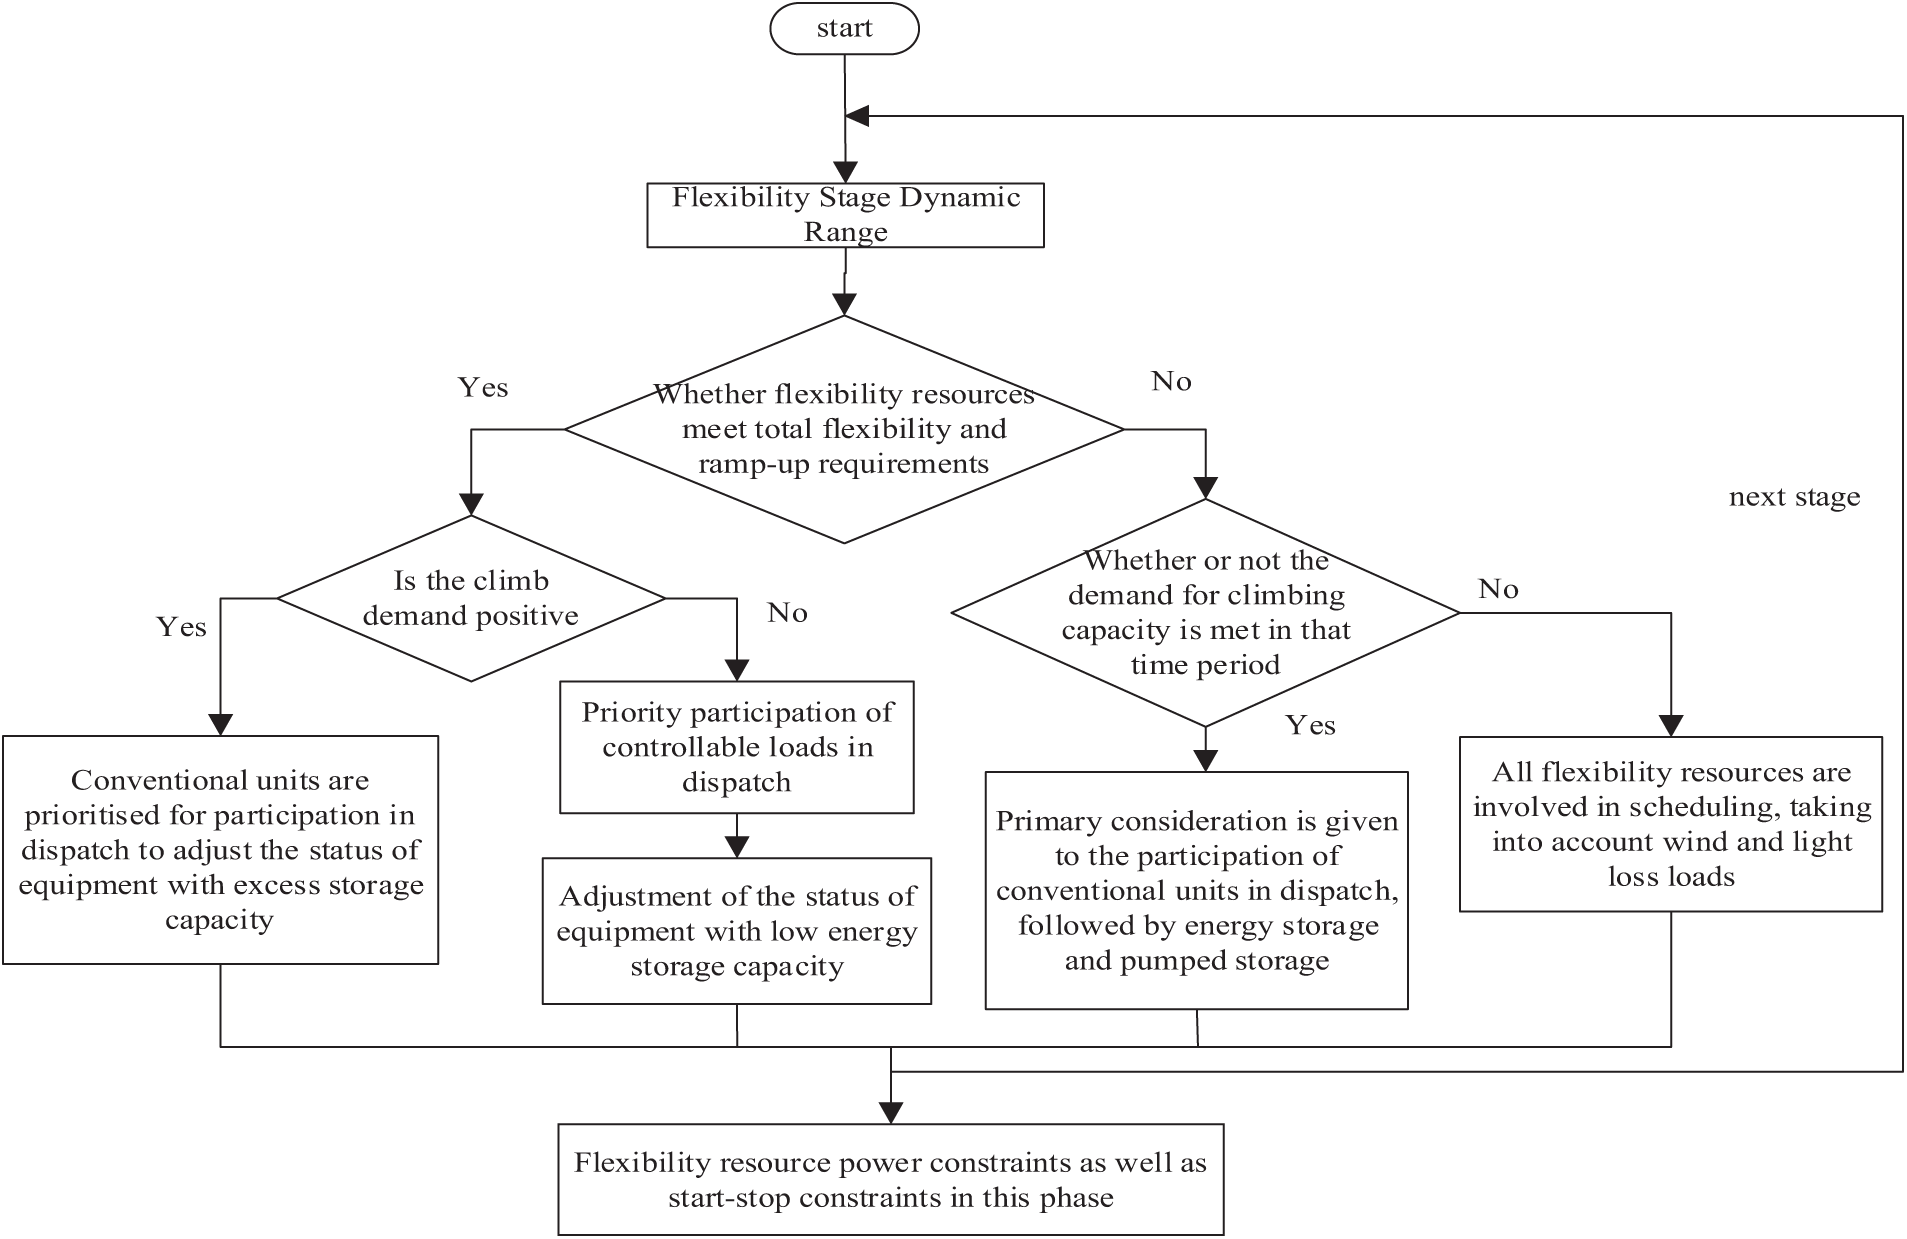
Figure 4: Flexibility demand response matching process
4 A Hierarchical Optimal Dispatch Model for Power Grids with Flexibility Adjustment Capability
Economic management is crucial for optimizing flexibility resource aggregation in the electrical grid, with balance playing an essential role. Flexibility resource aggregation involves mapping the adjustable power range of a grid’s flexibility resources to the nodes connecting regional grids to a larger grid, all while considering network and equipment constraints. By consolidating dispersed resources, grid scheduling becomes more flexible and precise, enhancing overall system efficiency. However, promptly balancing flexibility regulation capabilities can lead to security risks. To ensure timely and balanced flexibility, regulation, scheduling, and safety must be prioritized in this aggregation process. This paper suggests a hierarchical optimal dispatch model designed explicitly for regional grids to enhance grid efficiency and reliability, incorporating flexibility adjustment capacity.
In this study, we quantify grid flexibility and develop a hierarchical optimal dispatch model by leveraging flexibility from both the energy source and load perspectives. The upper-level model is designed with several key objectives: minimizing net load fluctuations, reducing operating costs for pumped and energy storage, maximizing controllable load benefits, and optimizing flexibility adjustment capabilities. This model prioritizes the adjustment of power from energy and pumped storage, and it forwards the residual power and output from identified flexibility resources to the lower-level model. The lower-level model aims to minimize costs associated with thermal power operation, wind and solar curtailment, and loss-of-load penalties. It also considers constraints related to thermal power unit operations, power balance, contact line power limits, and operational security. The dispatch model aims to enhance grid efficiency and reduce costs by addressing these objectives and constraints.
The primary goal of the upper-level model is to achieve the following: minimize net load fluctuations, reduce operating costs associated with pumped storage, maximize gains from controllable loads, and optimize flexibility adjustment capabilities. This is accomplished using the following formulae:
Style: f1, f2, f3, f4 are the four subfunctions of the objective function; T is the total number of times in the scheduling cycle;
To begin with, the four objective functions undergo normalization. Significant adjustments in the net load fluctuation weight coefficients can impact the economic efficiency of energy storage and controllable loads. This section evaluates the flexibility requirements at each stage to determine the optimal net load fluctuation weights and achieve a balanced system that prioritizes economy and flexibility. As a result, it derives various weight coefficients. Consequently, the refined objective function is:
Style:
4.1.2 Upper Level Model Constraints
(1) Energy storage and pumped storage constraints
Since pumped storage can also be regarded as energy storage, their constraints are basically the same, with the following equations [44].
① Energy storage charge/discharge constraints
Style:
② Charge state constraints
Style:
③ Charge and discharge power constraints
Style:
(2) Controllable load constraints [45]
Style:
The objective function is to minimize the total operating cost, excluding energy storage and controllable loads
Style:
4.2.2 Lower Level Model Constraints
(1) Power balance constraint [46]
(2) Fire crew constraints [47]
Style:
(3) Contact line power constraints [47]
Style:
(4) Operational safety constraints [48]
Style:
4.3 Construction of Flexibility Indicators for Regional Grids
The balance between supply and demand in a regional power grid is heavily influenced by the flexibility of various resources, including power-side, grid-measured, and load-side flexibility options. As flexibility demand fluctuates with changes in load, it is crucial to ensure that grid load activity stays within a specific flexibility regulation range to meet this demand effectively. This section assesses regional grid flexibility to evaluate whether flexibility resource issues are addressed and to measure their regulatory capabilities. It considers each resource’s regulation capabilities, as detailed in the previous section, and introduces two key metrics: the flexibility dynamic range and the flexibility equilibrium degree.
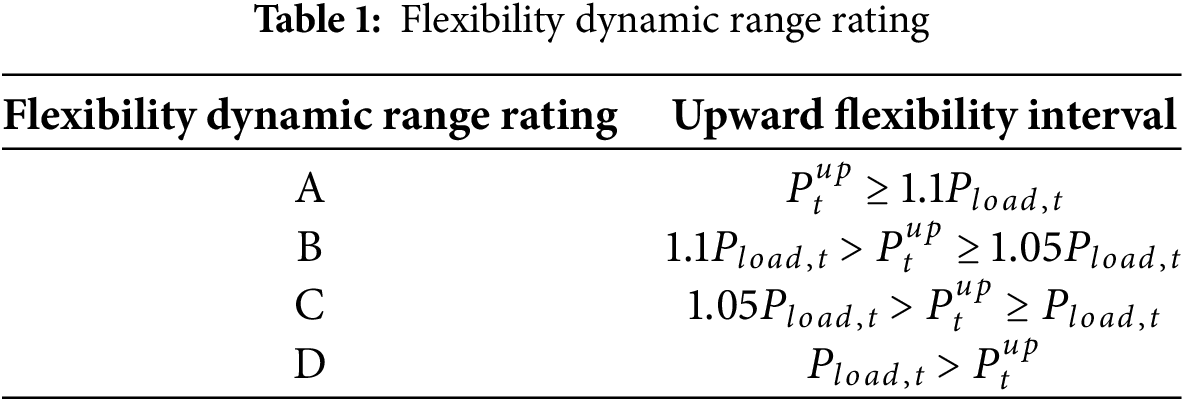
This section highlights the dynamic range of flexibility inherent in the system, showcasing its adaptability. A higher upward flexibility value indicates the grid’s enhanced capacity to handle uncertainties effectively. Conversely, a lower value suggests reduced reliability.
Style:
This section evaluates the flexibility dynamic range by categorizing it into four grades—A, B, C, and D—based on various upward flexibility intervals. Refer to Table 1 for detailed classification and analysis.
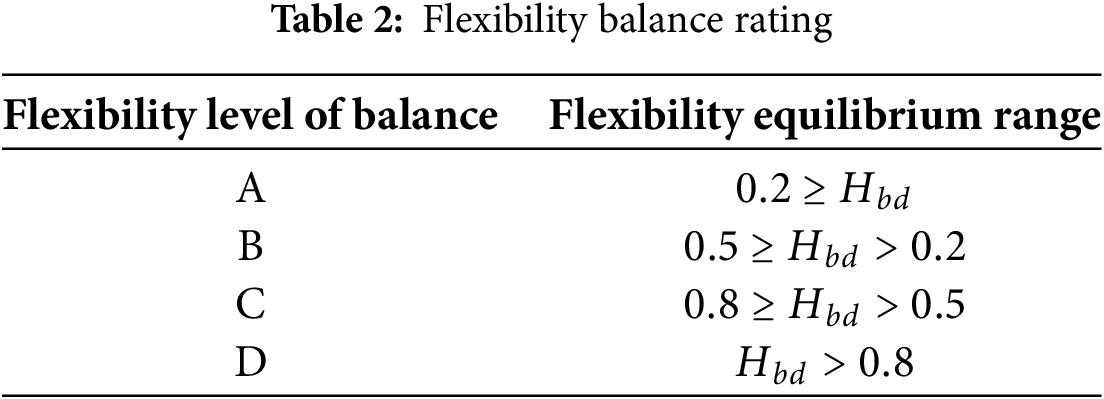
This paper introduces the concept of “grid flexibility balanced in time” to assess how effectively grid flexibility aligns with dispatch times in the power distribution network. As renewable energy sources increasingly penetrate the power grid, China has achieved a substantial total installed capacity of 58.69 GW in pumped storage power stations and 28,650 MW in electrochemical energy storage. Consequently, concerns about insufficient downward regulation capability are minimal during steady-state operations, particularly with the availability of controllable loads that enhance system operations. When it comes to grid flexibility, upward flexibility is more crucial than downward flexibility. Addressing downward flexibility can be managed by reducing reliance on wind and solar power and by utilizing energy storage charging. This paper, however, focuses exclusively on grid upward flexibility. The “flexibility balance degree” is a metric that indicates how evenly grid upward flexibility is distributed over time; a smaller value signifies a more balanced temporal distribution of this adjustment capability.
Style:
To facilitate the measurement of the temporal equilibrium of flexibility resources, this subsection categorizes the flexibility equilibrium degree into four levels: A, B, C, and D, as shown in Table 2. The reserve capacity of a regional power grid is typically set between 0.24 and 0.3. The reserve capacity requirement is still met when the flexibility equilibrium degree is 0.2. However, when the flexibility equilibrium degree reaches 0.8, it only marginally satisfies the spinning reserve demand. Based on these thresholds, the flexibility equilibrium degree is classified into the aforementioned four levels.
Different scheduling strategies can significantly impact the flexibility curves of the grid, affecting both the upward and downward flexibility ranges. The upward flexibility range is calculated by subtracting the load curve from the upward flexibility curve. In contrast, the downward flexibility range is determined by subtracting the downward flexibility curve from the load curve. The hierarchical optimal dispatch strategy for new energy power systems, which factors in balanced grid flexibility responses, is detailed in the previous section. This strategy operates on a 15-min time frame, as illustrated in Fig. 5.
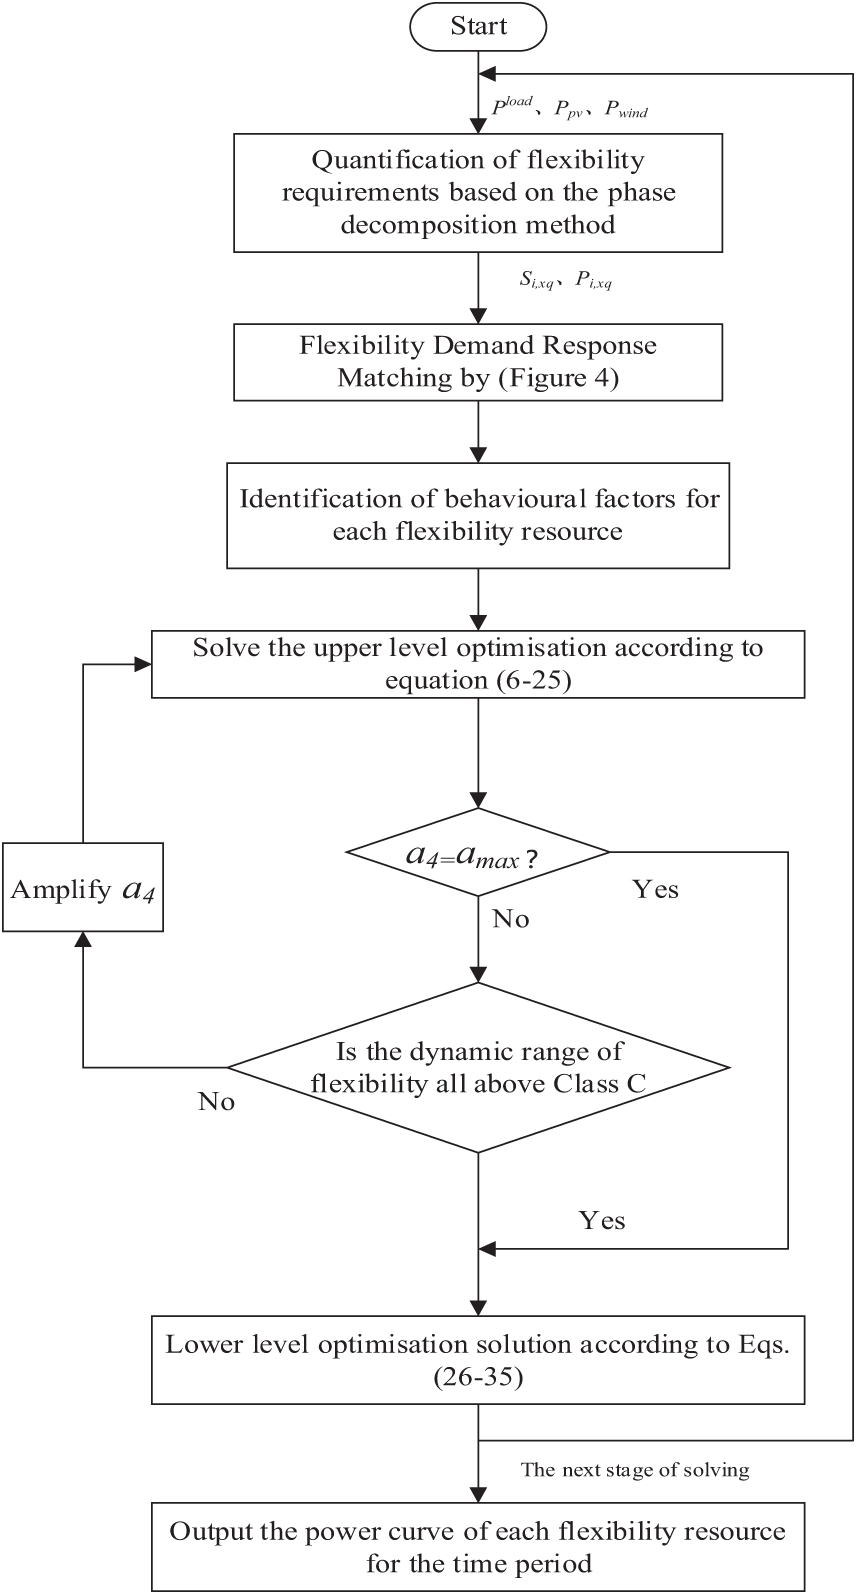
Figure 5: Optimising the control strategy process
5.1 Introduction to Algorithmic System
In this study, we conducted an arithmetic analysis to evaluate the efficiency of the hierarchical optimal scheduling strategy for a new energy power system with an improved ratio. The system includes the following installed capacities: 900 MW of thermal power, 300 MW of wind power, 200 MW of photovoltaic (PV) power, 150 MW of pumped storage, and 30 MW of electrochemical storage. The setup comprises four thermal power units, one wind farm, one PV power plant, two pumped storage facilities, two energy storage stations, and a 20 MW controllable load. Thermal power serves as the foundation of the power system, while pumped storage facilities, energy storage stations, and controllable loads significantly enhance system flexibility. Key parameters include a unit penalty for wind and solar curtailment set at 500 yuan/MWh, with a maximum allowable curtailment rate of 10%. A minor amount of load shedding is permissible. The electrochemical storage system features a charging and discharging efficiency of 95%, with maximum and minimum operational powers of 28 MWh and 2 MWh, respectively. The cost for charging and discharging is calculated at [10,000 yuan · (MW · h)−1] × 0.002. The total dispatch duration is configured for 6 h, with operations planned at 1-min intervals.
5.2 Optimised Scheduling Analysis
Traditional clustering algorithms require the input of the number of clusters, which leads to subjective interference in the clustering results; some algorithms randomly select the clustering center or search direction, which may lead to the clustering results falling into the local optimum [49]. AP clustering algorithms do not require human intervention in the whole process, so they are more objective. The new energy output curves of typical scenes are obtained through the AP clustering method, as shown in Fig. 6, and four typical scenes are clustered.
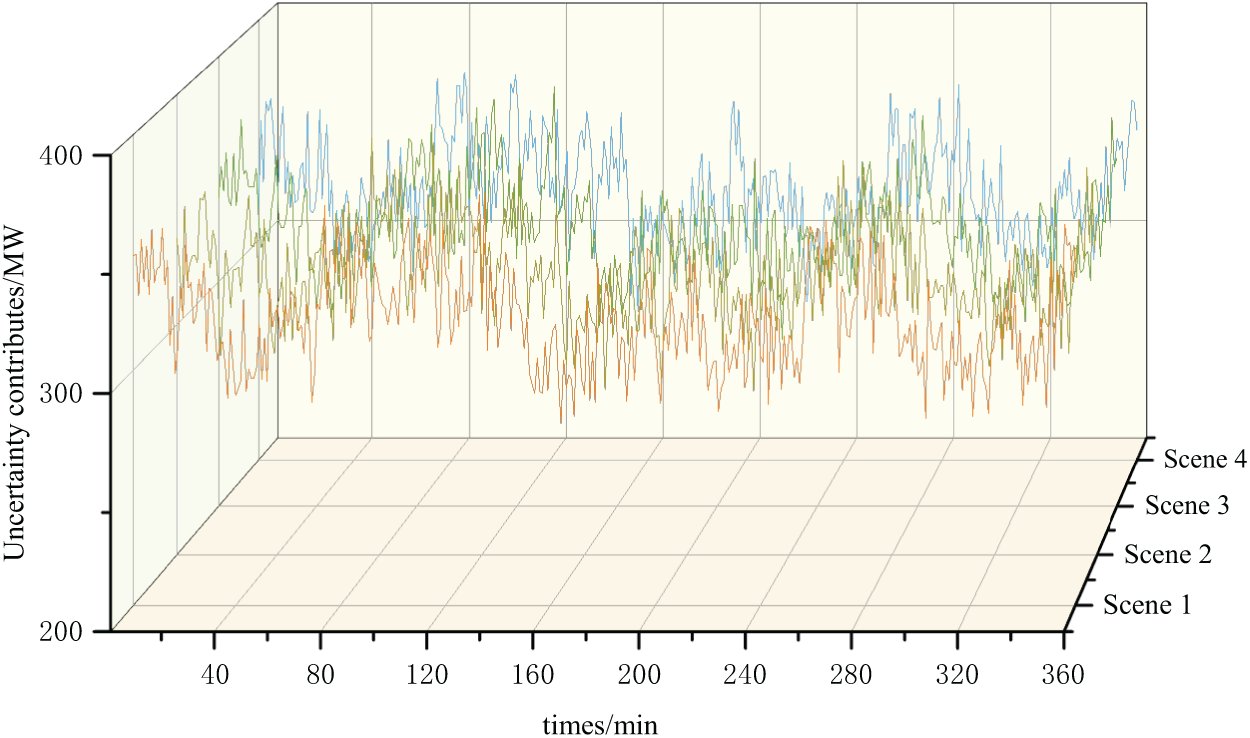
Figure 6: New energy uncertainty contributes
The additional operating cost for the conventional unit’s upgraded model is calculated at $91.2 million. Under Scene 2, the net load curves before and after optimal scheduling via the upgraded system are illustrated in Fig. 7. After implementing upper-tier pumped storage and energy storage optimization, the net load volatility difference under Scene 2 is reduced by 15.6%. During the 120–160 min and 240–310 min intervals, the net load reaches a trough period. Here, the optimized net load profile exceeds the pre-optimization levels as controllable loads are activated, and both pumped storage and energy storage systems are charged. This strategy improves operating revenue and minimizes net load fluctuations. In the 150–190 min period, when the net load peaks, previously accumulated surplus power from the pumped storage and energy storage is available to help shift the peak load effectively. This optimization process demonstrates that fluctuations in net load are reduced, helping to alleviate the strain on thermal power units and enhance the overall economic efficiency of system operations.
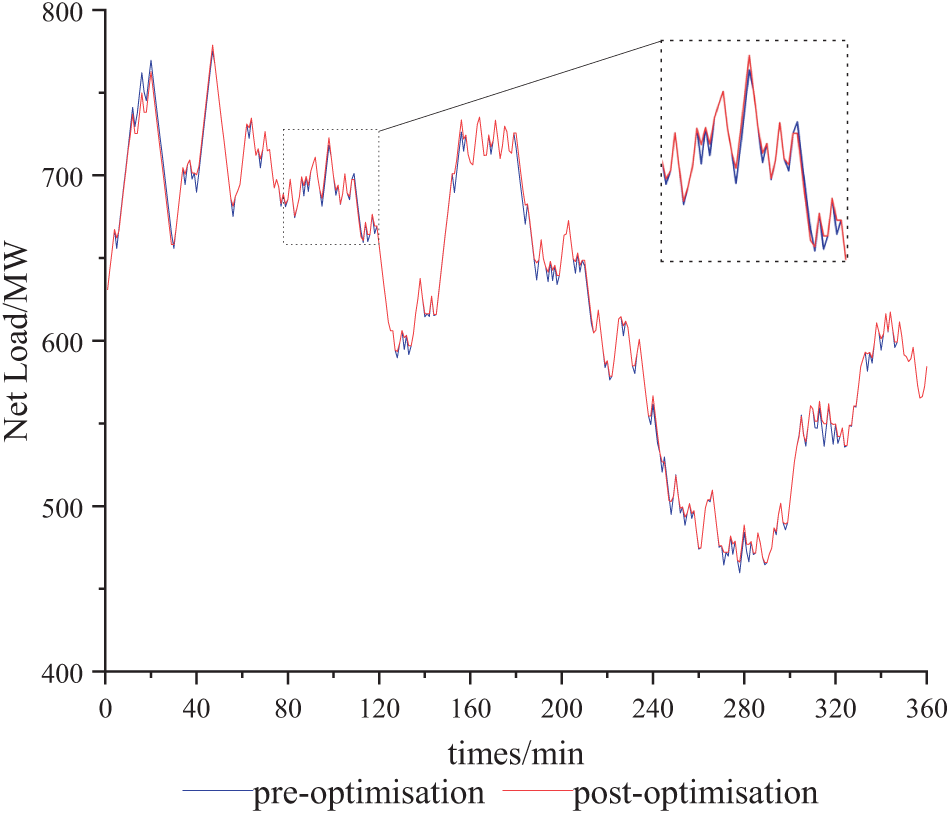
Figure 7: Net load profile before and after optimal scheduling in the lower upper tier of Scene 2
After the optimized scheduling of the upper and lower layers, the flexibility power curves under four typical Scenes with more extended periods are shown in Fig. 8, with a small amount of load loss occurring in Scene 1–4. The loss of load phenomenon occurs in the periods around 150 and 240 min, which fully uses the flexibility resources and enables the system to meet the flexibility dynamic requirements in 98.9% of the periods. Using two-tier optimal scheduling significantly improves the system’s immunity to interference and reduces the lost load.
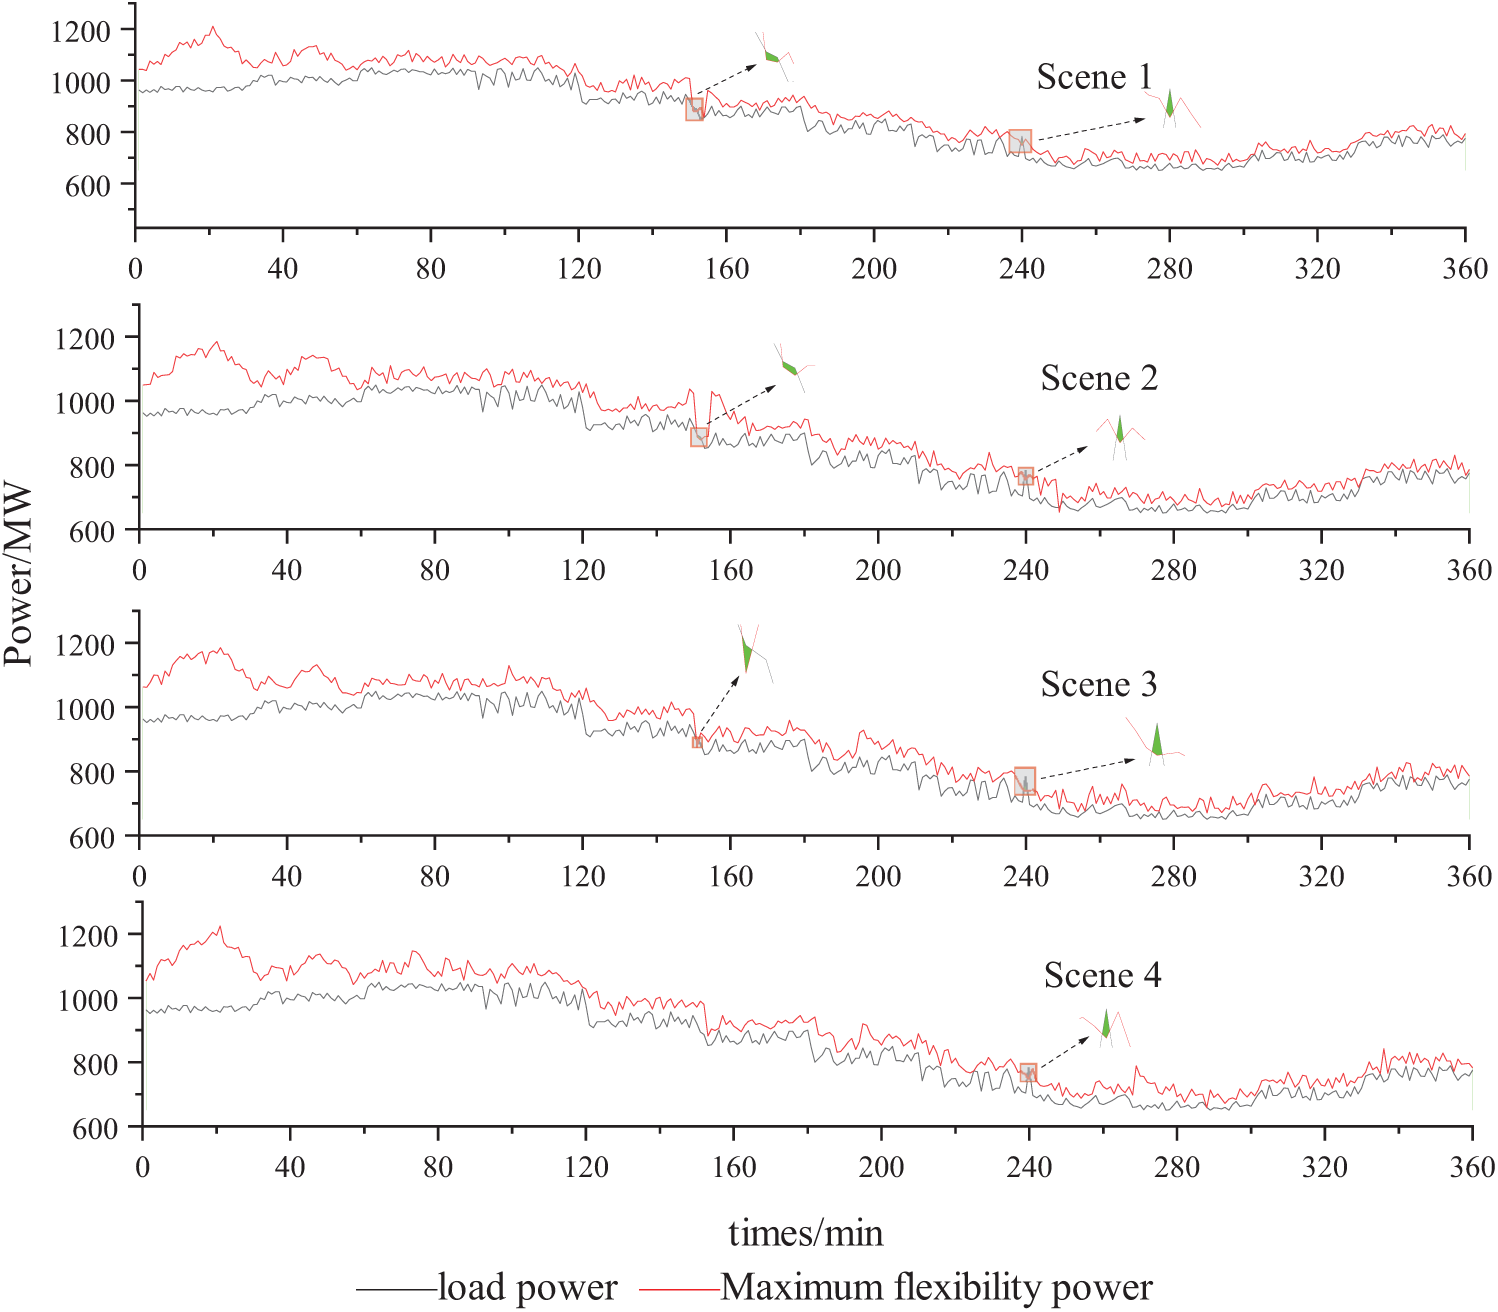
Figure 8: Maximum flexibility curve vs. load curve
The article compares the energy storage relative to the remaining power for the four Scenes, as shown in Fig. 9. Energy storage dispatch is categorized into three flexibility demand stages: high, medium, and low. During high flexibility demand, the relative residual power of energy storage across four Scenes ranges significantly from 0.42 to 0.92. Scene 3 experiences the most significant variation, while Scene 4 predominantly remains within 0.5 to 0.7, exhibiting minimal fluctuations. In this stage, energy storage is crucial in meeting peak demand, as thermal power and controllable loads fall short. In the medium flexibility demand stage, the residual power of energy storage varies slightly, from 0.2 to 0.42. Scene 2 shows the highest variability, whereas Scenes 3 and 4 typically range from 0.3 to 0.4. Here, energy storage demonstrates enhanced regulating capability. Finally, during low flexibility demand, the remaining power of storage across all Scenes is consistent, ranging from 0.1 to 0.2. The system becomes less dependent on storage for regulation, relying more on thermal power and controllable loads to manage peaks and optimize storage operation costs.
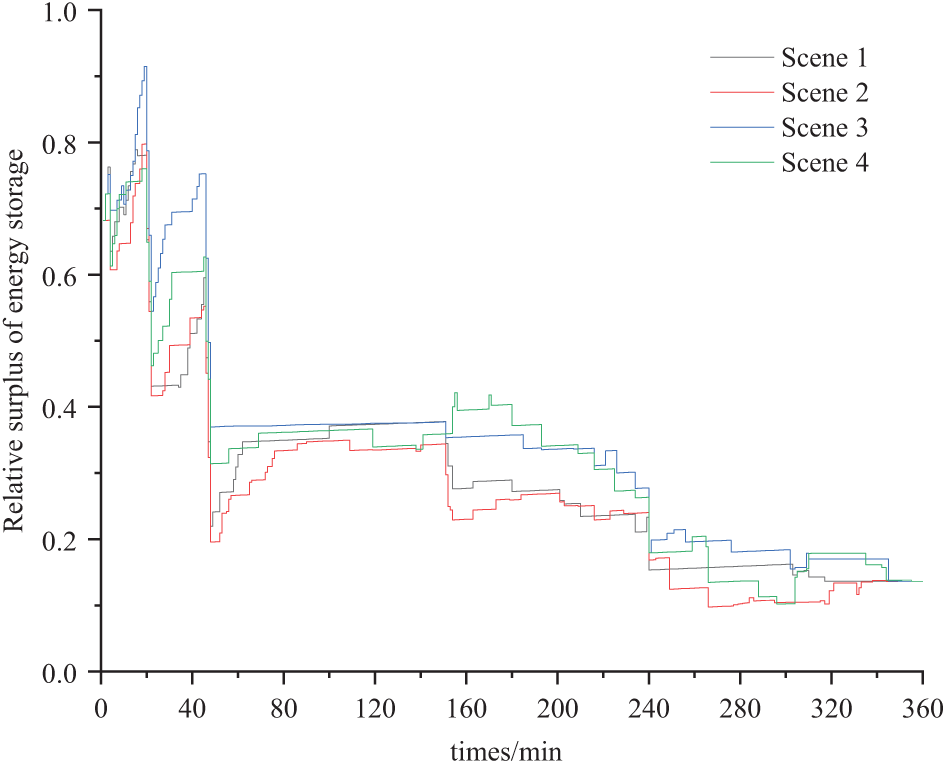
Figure 9: Comparison of the relative residual power of energy storage for 4 Scenes
5.3 Comparison of Optimal Scheduling Results under Different Scenarios
Translate the following content: In order to verify the effectiveness of this strategy, from the perspective of system operation economy and flexibility, to study the impact of the configuration of pumped storage power plants, controllable loads, and the consideration of flexibility balancing on the results of the optimal grid dispatch taking into account the flexibility of the adjustment capacity, the following Options are set up for case study analysis and comparison: Option 1, without the configuration of pumped storage power plants and controllable loads; Option 2, based on Option 1, considering Option 2, based on Option 1, considers the participation of pumped storage power plants in regulation and the participation of controllable loads in dispatch; Option 3, based on Option 1, considers the participation of pumped storage power plants in regulation and the overall flexibility of the regional grid; Option 4, based on Option 3, considers the participation of controllable loads in dispatch.
The generating unit outputs for the four Options are depicted in Fig. 10. In Option 1, thermal power units reach their limit in power output during the 5–60 min period, with a peak output of 890 MW. Only energy storage and thermal power units are used for peaking, leading to frequent high-frequency load losses and wind and solar energy abandonment. Option 2 introduces a pumped storage power plant, resulting in a 40 MW reduction in the minimum output and a 140 MW reduction in the maximum output of thermal power units compared to Option 1. This adjustment significantly diminishes the output fluctuations of thermal power units. The pumped storage plant effectively participates in peak shifting from the 25th to the 50th minute, significantly reducing both the abandonment of wind and solar energy and the occurrence of load losses. In Option 3, controllable loads are added to Option 2’s configuration. These loads bolster thermal power output between the 180th and 220th minutes, effectively curbing downward fluctuations. Their involvement enhances the system’s operational revenue. Option 4 builds on Option 3 by aiming for superior grid flexibility regulation throughout the dispatch cycle. It achieves more balanced flexibility by adjusting the output of thermal power units: increasing output when flexibility is low and decreasing it when flexibility is high. This dynamic adjustment ensures optimal grid flexibility regulation.
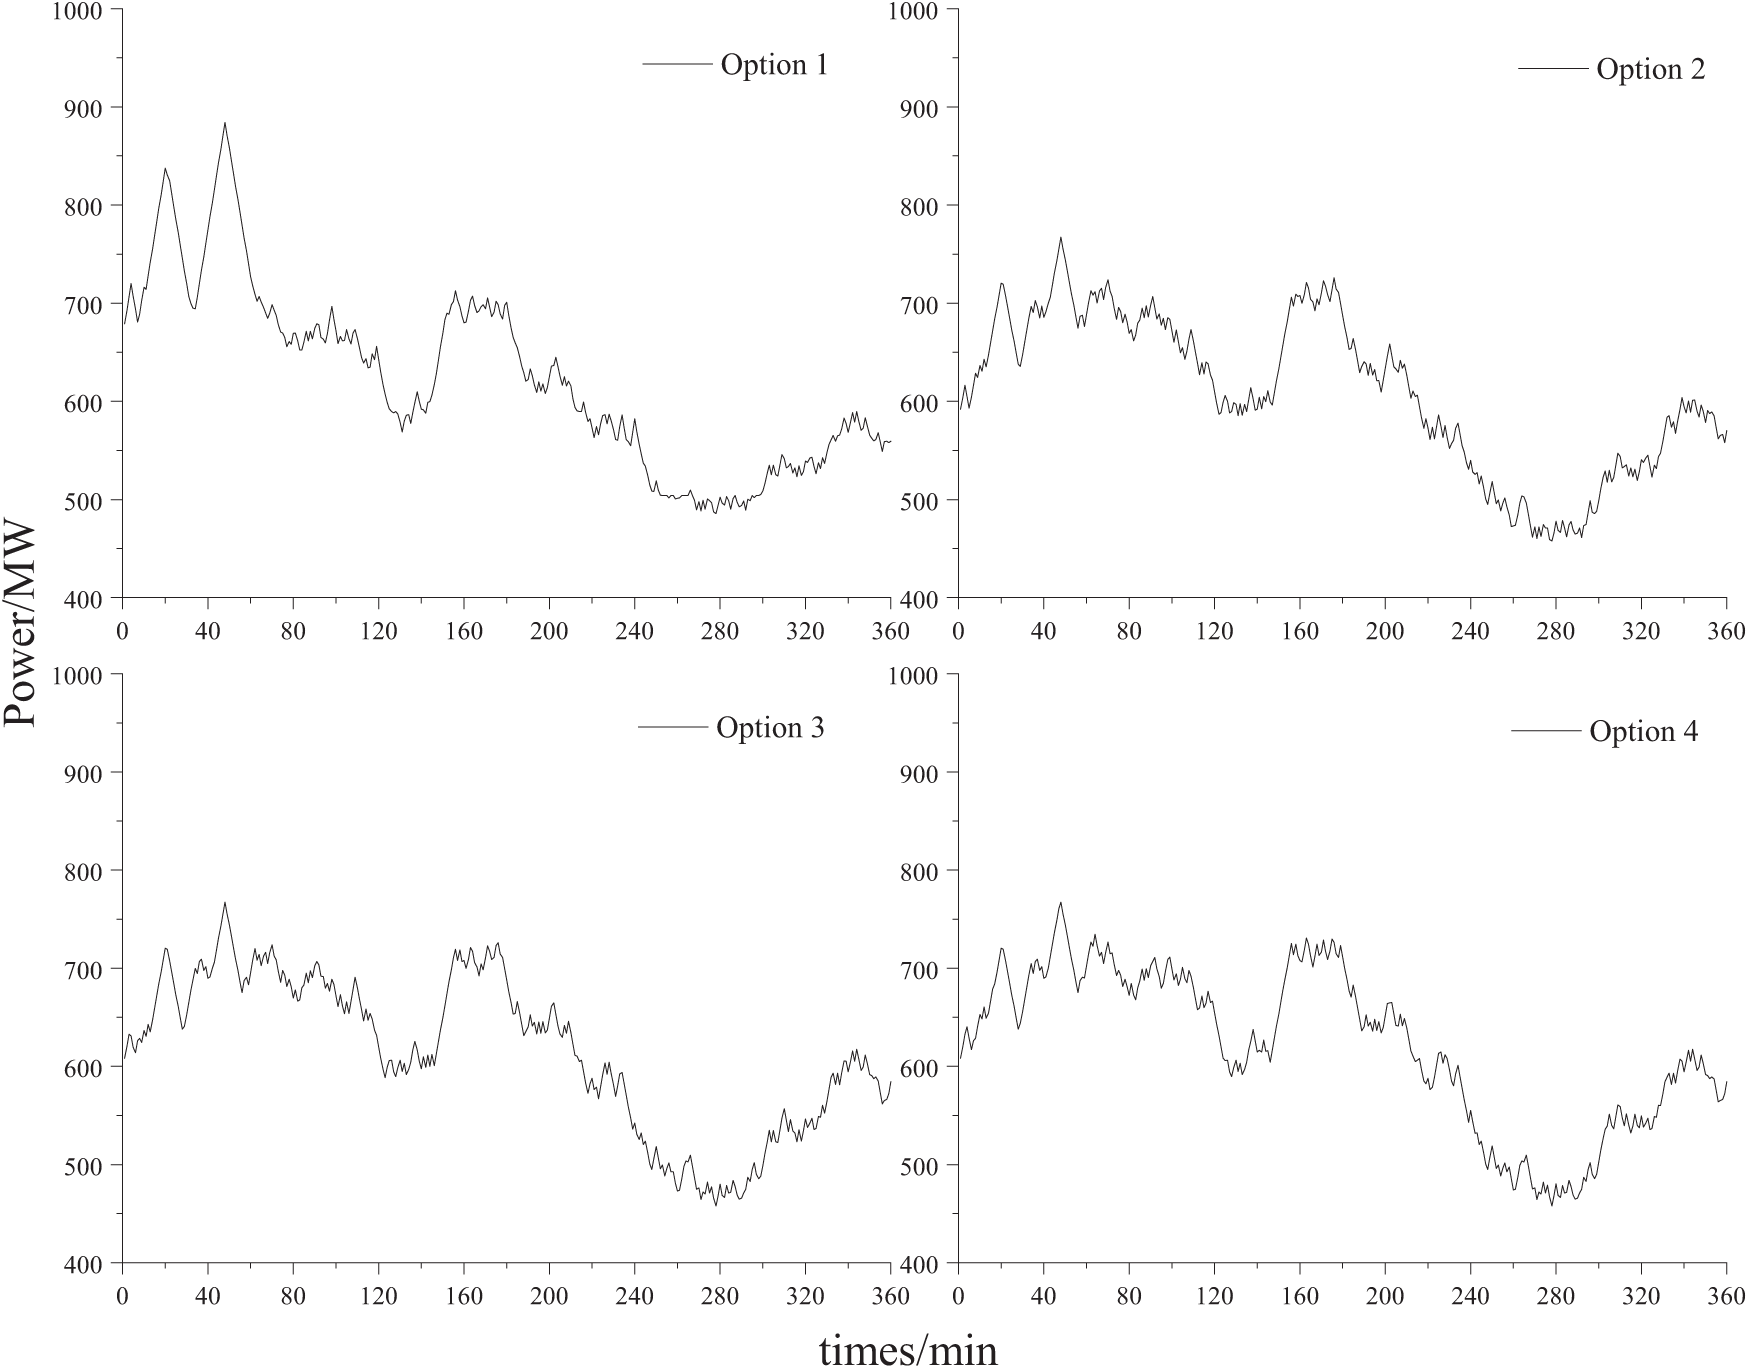
Figure 10: Output curves of thermal power units for 4 Options
Regarding grid flexibility, upward flexibility is more crucial than downward flexibility. Addressing downward flexibility can be managed by reducing reliance on wind and solar power and utilizing energy storage charging. In contrast, enhancing upward flexibility requires increasing the output capacity of flexible resources. To validate the effectiveness of the methodology presented in this study, we compared the upward flexibility of the grid across four different Options, as illustrated in Fig. 11. In Option 1, the upward flexibility curve, when compared to the load curve, reveals a slight load loss during the 200–240 min interval, indicating insufficient upward flexibility. Option 2 demonstrates a 15.2% enhancement in overall upward flexibility due to the integration of pumped storage. Although Option 3 does not show an increase in upward flexibility compared to Option 2 with the incorporation of controllable loads, it does reflect economic gains by maintaining system flexibility during the 50–180 min interval when controllable loads are operational. Option 4 achieves an 11.3% gain in overall flexibility compared to Option 3, with reduced flexibility intervals (upward flexibility-load) between the 50–100 min and 200–250 min intervals. These findings underscore that our proposed strategy significantly improves the quality of the upward flexibility curve and its economic viability.
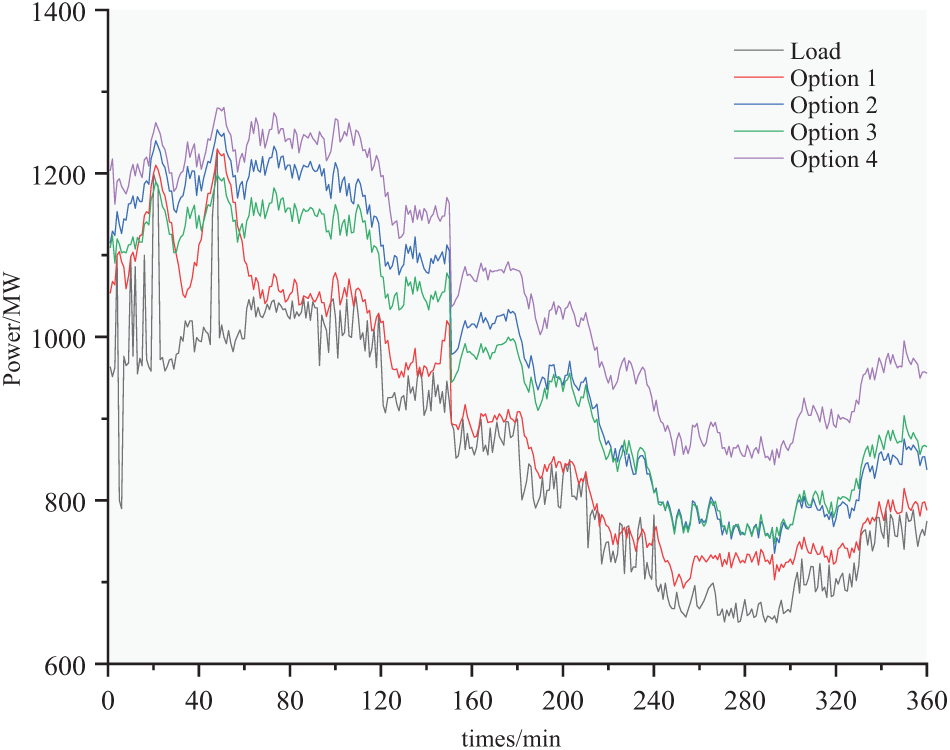
Figure 11: Grid upward flexibility comparison chart
To better understand system flexibility balancing, we introduced the concept of relative flexibility quantity. This measures the difference between upward flexibility and load during a specific period compared to the average difference over the dispatch cycle. This is visualized in Fig. 12. In Option 1, relative flexibility mostly exceeds two during the 0–50 min period but falls below zero between 200–240 min. This results in numerous lost load situations, signaling inadequate grid flexibility. Conversely, Option 2 achieves a maximum relative flexibility of 1.4 from 160–200 min, which is 0.1 and 0.13 higher than Options 3 and 4, respectively. This suggests that the flexibility resources are underutilized. During the 160–200 min period, Options 3 and 4 maintain relative flexibility between 0.8 and 1.2, meeting the A-level balance standard. Notably, Option 4 achieves this balance more optimally, maintaining the 0.8–1.2 range as early as 40 min into the cycle, demonstrating superior flexibility balance management.
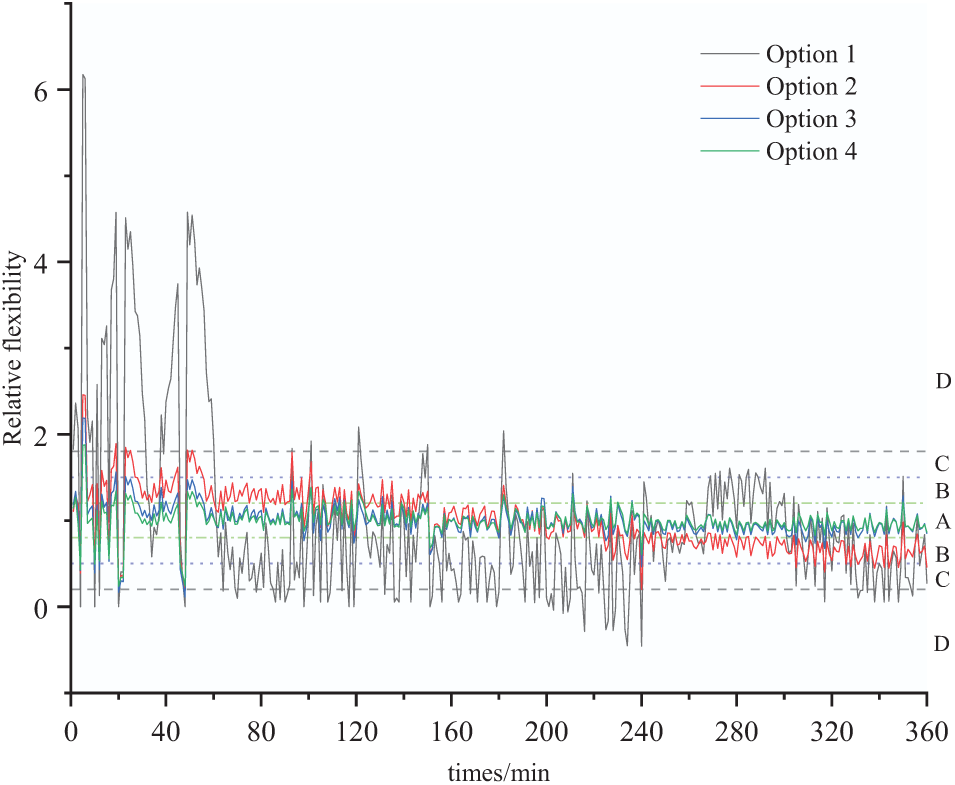
Figure 12: Relative flexibility comparison chart
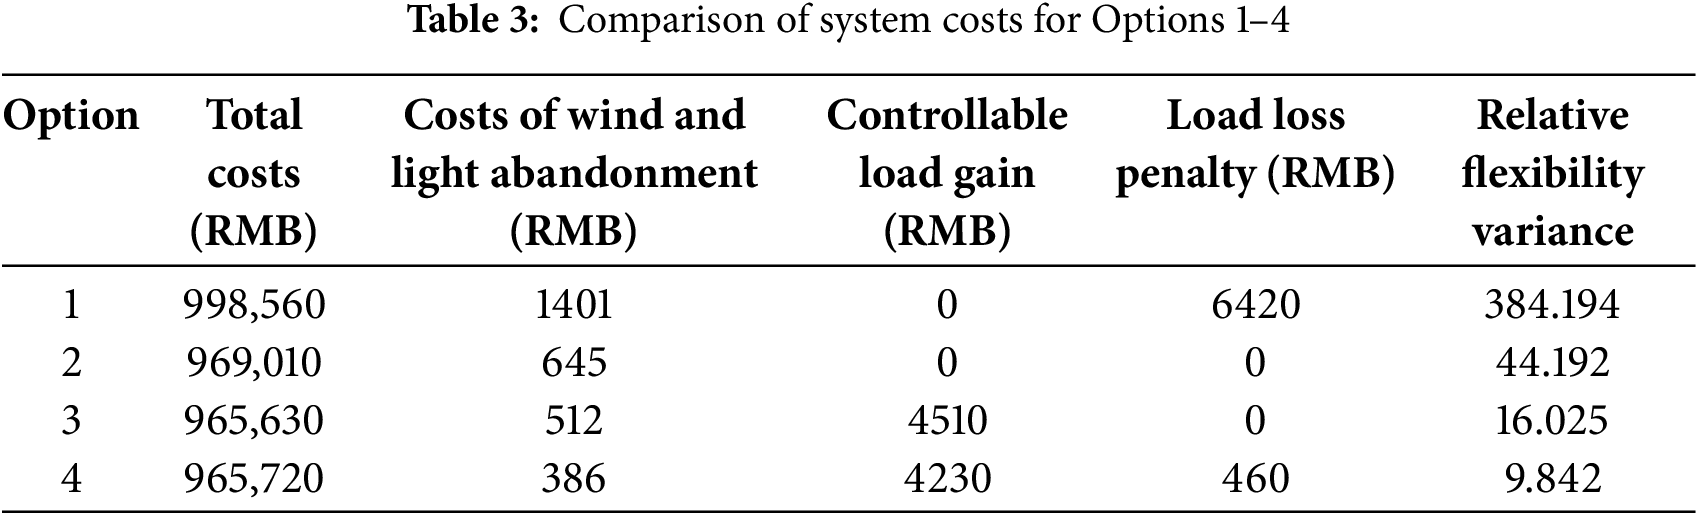
In order to verify the effectiveness of the method proposed in this paper, an arithmetic analysis is carried out to compare the four proposed Options. As seen from Table 3, Option 2 reduces the operating cost by 29,550 RMB yuan compared with Option 1, effectively reduces wind and light abandonment, eliminates the loss of load, and improves a lot in terms of the degree of flexibility and balance. The total cost of Option 3 is reduced by 3380 RMB yuan after the addition of controllable loads, mainly relying on the benefits of controllable loads, and the degree of flexibility and balance is also improved. Compared to Option 3, the strategy in this paper increases the total cost by 90 RMB yuan but improves 62.8% in terms of grid flexibility, and the cost of wind and light abandonment is also reduced by 720 RMB yuan.
This paper introduces a hierarchical optimal scheduling strategy to address the challenge of efficiently coordinating optimal scheduling in power systems to enhance the utilization of flexibility resources and maintain regional grid balance. This approach is designed for high proportions of new energy within power systems and focuses on achieving a balanced grid flexibility response. The key findings of the study are as follows:
(1) The hierarchical optimal scheduling strategy aligns with actual peaking market rules, effectively leveraging the peaking capacity of energy storage and controllable loads. Compared to robust and economically optimal scheduling, it offers significant advantages regarding operational revenue and flexibility planning.
(2) By quantifying system flexibility resources to determine its regulation capability, we can efficiently evaluate and plan flexibility demand responses. This approach ensures that flexibility demand is met while minimizing the iteration cycle.
(3) Utilizing a two-layer optimization model enhances system output while maintaining safety. This model results in scheduling decisions that achieve optimal economic benefits and superior flexibility regulation capabilities.
This study has not conducted profound research on the downward regulation capability of flexibility. It has not done a good enough job regarding the economy while considering flexibility. Future research aims to improve the economics of scheduling by considering the factors of the electricity market in scheduling.
Acknowledgement: This work was supported by Inner Mongolia Autonomous Region Department of Science and Technology Leading Project-Topic 4 “New Energy Storage Dispatching Strategy and Optimal Control Technology Adapting to Diversified and Multi-Scenarios” (Project Number is 2022JBGS0044).
Funding Statement: The authors received no specific funding for this study.
Author Contributions: Cuiping Li: Conceptualization, Methodology, Writing—original draft. Jiacheng Sun: Methodology, Software, Writing—original draft. Qiang Li: Data curation, Formal analysis. Qi Guo: Investigation, Data curation. Junhui Li: Conceptualization, Methodology, Data curation, Formal analysis, Writing—review & editing. Shuo Yu: Data curation, Formal analysis. Jingbo Wang: Data curation, Methodology. Wenze Li: Data curation, Formal analysis. All authors reviewed the results and approved the final version of the manuscript.
Availability of Data and Materials: The data used to support the findings of this study are available from the corresponding author upon request.
Ethics Approval: Not applicable.
Conflicts of Interest: The authors declare no conflicts of interest to report regarding the present study.
References
1. Talebi A, Rahvar MA, Mohammadi-Ivatloo B, Zare K, Anvari-Moghaddam A. An IGDT-stochastic model for low-carbon economic dispatch of integrated electricity-natural gas systems considering grid-enhancing technologies. IET Gener Transm Distrib. 2024;18(24):4042–64. doi:10.1049/gtd2.13327. [Google Scholar] [CrossRef]
2. Alahyari A, Patsios C, Zografou-Barredo NM, Saifutdinov T, Sarantakos I. A stochastic multi-range robust approach for low carbon technology participation in electricity markets. Int J Electr Power Energy Syst. 2024;157(2):109825. doi:10.1016/j.ijepes.2024.109825. [Google Scholar] [CrossRef]
3. Wang YW, Levin T, Kwon J, Baker E. The value of hydropower flexibility for electricity system decarbonization. Energy Rep. 2025;13:2711–21. doi:10.1016/j.egyr.2025.02.019. [Google Scholar] [CrossRef]
4. Arwa EO, Schell KR. Impact of direct air capture process flexibility and response to ambient conditions in net-zero transition of the power grid. Appl Energy. 2025;386(6):125549. doi:10.1016/j.apenergy.2025.125549. [Google Scholar] [CrossRef]
5. Ladino JT, González WG, Ruiz AG. An efficient Wirtinger calculus-based algorithm for quasi-dynamic power flow analysis in distribution grids. Electr Power Syst Res. 2025;243(3):111506. doi:10.1016/j.epsr.2025.111506. [Google Scholar] [CrossRef]
6. Jia JQ, Wu TY, Zhou J, Cai WC. Assessment method of new energy hosting capacity in distribution grid considering rotary power flow controllers and demand response. Electr Power Syst Res. 2025;244(5):111566. doi:10.1016/j.epsr.2025.111566. [Google Scholar] [CrossRef]
7. Sayarshad HR. Designing vehicle-to-grid (V2G) aggregator fleet capacity for power grid reliability against cyberattacks. Electr Power Syst Res. 2025;244(6):111554. doi:10.1016/j.epsr.2025.111554. [Google Scholar] [CrossRef]
8. Li YH, Song FC, Guo WC. Transient characteristics and operation regulation of grid-connected variable speed pumped storage-wind-solar hybrid power system. Energy Sci Eng. 2024;13(1):416–33. doi:10.1002/ese3.2013. [Google Scholar] [CrossRef]
9. Cheng CY, Sun J, Song X, Wang X, Zhang Q. Wind power-based model predictive grid frequency regulation with wind disturbance compensation utilizing power response delay. Electr Eng. 2024;2024(1):1–14. doi:10.1007/s00202-024-02811-z. [Google Scholar] [CrossRef]
10. Zhang MZ, Li WD, Yu SS, Li HM, Lv YL, Shen JK. A day-ahead self-dispatch optimization framework for load-side virtual control units participating in active power regulation of power grids. Energy. 2025;318(5):134791. doi:10.1016/j.energy.2025.134791. [Google Scholar] [CrossRef]
11. Tiwari K, Singh B. Regulation of parallel converters based AC microgrid considering non-ideal grid conditions. Energy Convers Econ. 2025;6(1):1–12. doi:10.1049/enc2.70001. [Google Scholar] [CrossRef]
12. Feng H, Zhang CX, Zhang HB, Ye JC, Ding N, Xu YH. Research on the operation optimization of aggregate resources under the dual factors of power grid and economy. E3S Web Conf. 2024;580(4):01006. doi:10.1051/e3sconf/202458001006. [Google Scholar] [CrossRef]
13. Yang P, Dong JY, Rong SY, Liang JF, Wang HJ. Research on optimization and control technology of transmission grid for low carbon economy. Appl Math Nonlinear Sci. 2024;9(1):1–21. doi:10.2478/amns-2024-3088. [Google Scholar] [CrossRef]
14. Zhang DF, Han RT, Wan YN, Qin JH, Ran LL, Ma QC. Robust optimal energy management with dynamic price response: a non-cooperative multi-community aggregative game perspective. Int J Electr Power Energy Syst. 2023;154(1):109395. doi:10.1016/j.ijepes.2023.109395. [Google Scholar] [CrossRef]
15. Falk H, Reinhold L. The power grids need to be made ready for a circular and bio-based economy. Next Sustain. 2023;2:100010. doi:10.1016/j.nxsust.2023.100010. [Google Scholar] [CrossRef]
16. Doma A, Ouf MM, Amara F, Morovat N, Athienitis AK. Occupancy-informed predictive control strategies for enhancing the energy flexibility of grid-interactive buildings. Energy Build. 2025;332(5):115388. doi:10.1016/j.enbuild.2025.115388. [Google Scholar] [CrossRef]
17. Fang J, Li WW, Chen DC. Electric vehicle and soft open points co-planning for active distribution grid flexibility enhancement. Energies. 2025;18(3):694. doi:10.3390/en18030694. [Google Scholar] [CrossRef]
18. Cebeci C, Parker M, Recalde-Camacho L, Campos-Gaona D, Anaya-Lara O. Variable-speed hydropower control and ancillary services: a remedy for enhancing grid stability and flexibility. Energies. 2025;18(3):642. doi:10.3390/en18030642. [Google Scholar] [CrossRef]
19. Ikuta K, Aki H. Multi-timescale management models for distributed energy resources and a two-stage incentive design for demand-side grid flexibility provision. Sustain Energy Grids Netw. 2025;41(2):101618. doi:10.1016/j.segan.2024.101618. [Google Scholar] [CrossRef]
20. Khani M, Moghaddam MS, Noori T, Ebrahimi R. Integrated energy management for enhanced grid flexibility: optimizing renewable resources and energy storage systems across transmission and distribution networks. Heliyon. 2024;10(20):e39585. doi:10.1016/j.heliyon.2024.e39585. [Google Scholar] [PubMed] [CrossRef]
21. Li SX, Li ZY. Coordinating and valuing the flexibility resources in a rural integrated energy system by considering correlated source-load uncertainty. Renew Energy. 2024;237(Pt A):121576. doi:10.1016/j.renene.2024.121576. [Google Scholar] [CrossRef]
22. Yang Z, Xiong W, Wang PY, Shen NQ, Liao SY. A day-ahead economic dispatch method for renewable energy systems considering flexibility supply and demand balancing capabilities. Energies. 2024;17(21):5427. doi:10.3390/en17215427. [Google Scholar] [CrossRef]
23. Yuan JH, Mou QL, Du K, Ding BD, Zhang YX, Wu ZF, et al. Integrated resource strategic planning considering inter-regional flexibility supply-demand balance: a case study for the northwest and central grid in China. Sustain Energy Technol Assess. 2024;71(1):104019. doi:10.1016/j.seta.2024.104019. [Google Scholar] [CrossRef]
24. Hu SL, Zhao YC, Guo XW, Zhang ZM, Cai WB, Cao LF, et al. A power external transmission strategy for regional power grids considering internal flexibility supply and demand balance. Energies. 2023;16(17):6323. doi:10.3390/en16176323. [Google Scholar] [CrossRef]
25. Lin J, Abhyankar N, He G, Xu L, Yin SF. Large balancing areas and dispersed renewable investment enhance grid flexibility in a renewable-dominant power system in China. iScience. 2022;25(2):103749. doi:10.1016/j.isci.2022.103749. [Google Scholar] [PubMed] [CrossRef]
26. Berg S, Blaume L, Nilges B. Quantifying the operational flexibility of distributed cross-sectoral energy systems for the integration of volatile renewable electricity generation. Energies. 2023;17(1):90. doi:10.3390/en17010090. [Google Scholar] [CrossRef]
27. Bagheritabar M, Hakimi SM, Derakhshan G, Jordehi AR. A three-stage optimization framework for unlocking demand-side flexibility in highly renewable electricity grids. Energy. 2025;320(5):135158. doi:10.1016/j.energy.2025.135158. [Google Scholar] [CrossRef]
28. Ju LW, Lv SS, Li P. A review of new demand-side flexibility resource spatio-temporal co-optimisation and dynamic equilibrium mechanism for power systems. Electr Power Constr. 2024;45(9):142–63. doi:10.12204/j.issn.1000-7229.2024.09.013. [Google Scholar] [CrossRef]
29. Zhang ZW, Wang CF, Wu QW, Dong XM. Optimal dispatch for cross-regional integrated energy system with renewable energy uncertainties: a unified spatial-temporal cooperative framework. Energy. 2024;292(9):130433. doi:10.1016/j.energy.2024.130433. [Google Scholar] [CrossRef]
30. Igliński B, Kiełkowska U, Pietrzak MB, Skrzatek M, Kumar G, Piechota G. The regional energy transformation in the context of renewable energy sources potential. Renew Energy. 2023;218(3):119246. doi:10.1016/j.renene.2023.119246. [Google Scholar] [CrossRef]
31. Samadi S, Fischer A, Lechtenböhmer S. The renewables pull effect: how regional differences in renewable energy costs could influence where industrial production is located in the future. Energy Res Soc Sci. 2023;104:103257. doi:10.1016/j.erss.2023.103257. [Google Scholar] [CrossRef]
32. Li ZP, Xiang Y, Liu JY. Forecasting error-aware optimal dispatch of wind-storage integrated power systems: a soft-actor-critic deep reinforcement learning approach. Energy. 2025;318(14):134798. doi:10.1016/j.energy.2025.134798. [Google Scholar] [CrossRef]
33. Li WH, Liu WL, Lin YJ, Liu CL, Wang X, Xu JH. Optimal dispatching of integrated energy system with hydrogen-to-ammonia and ammonia-mixed/oxygen-enriched thermal power. Energy. 2025;316(6):134514. doi:10.1016/j.energy.2025.134514. [Google Scholar] [CrossRef]
34. Mumtahina U, Alahakoon S, Wolfs P. Optimal allocation and sizing of battery energy storage system in distribution network using mountain gazelle optimization algorithm. Energies. 2025;18(2):379. doi:10.3390/en18020379. [Google Scholar] [CrossRef]
35. Tong X, Zhao SY, Chen H, Wang XY, Liu WY, Sun Y, et al. Optimal dispatch of a multi-energy complementary system containing energy storage considering the trading of carbon emission and green certificate in China. Energy. 2025;314:134215. doi:10.1016/j.energy.2024.134215. [Google Scholar] [CrossRef]
36. Zhao G, Luo JW, Song NF, Shu J. Multi-objective optimal dispatch of island microgrid considering a novel scheduling resource. Electr Power Syst Res. 2025;241:111378. doi:10.1016/j.epsr.2024.111378. [Google Scholar] [CrossRef]
37. Wang LC, Su CD, Liang BM, Feng CS, Zhang YB. Security constrained optimal power system dispatch considering stochastic power facility failures under extreme precipitation. Electr Power Syst Res. 2025;239(20):111214. doi:10.1016/j.epsr.2024.111214. [Google Scholar] [CrossRef]
38. Chai TY, Liu C, Xu YC, Ding MR, Li MY, Yang HY, et al. Optimal dispatching strategy for textile-based virtual power plants participating in GridLoad interactions driven by energy price. Energies. 2024;17(20):5142. doi:10.3390/en17205142. [Google Scholar] [CrossRef]
39. De Oliveira-De Jesus PM, Yusta JM. Optimal power dispatch for maximum energy community welfare by considering closed distribution systems and renewable sources. Energies. 2024;17(18):4707. doi:10.3390/en17184707. [Google Scholar] [CrossRef]
40. Lai WH, Song Q, Zheng XL, Chen HL. The study of optimal reactive power dispatch in power systems based on further improved membrane search algorithm. Appl Energy. 2025;377(Pt A):124433. doi:10.1016/j.apenergy.2024.124433. [Google Scholar] [CrossRef]
41. Chen W, Zhao Y, Wu X, Cai Z, Guo M, Lu Y. Stackelberg game-based optimal dispatch for PEDF park and power grid interaction under multiple incentive mechanisms. Energy Eng. 2024;121(10):3075–93. doi:10.32604/ee.2024.051404. [Google Scholar] [CrossRef]
42. Lin W, Wang CY, Zhang WJ, Liang ZP, Chung CY. Integration flexibility of renewable distributed energy resources in active distribution networks: a two-module data-driven characterization method. Energy. 2024;304:132139. doi:10.1016/j.energy.2024.132139. [Google Scholar] [CrossRef]
43. Chen YH, Li XL, Liu JS, Lin SF. Collaborative planning of energy storage and smart soft open points considering flexibility supply-demand matching degree and network transmission in distribution networks. Electr Power Constr. 2024;45(9):49–62. (In Chinese). doi:10.12204/j.issn.1000-7229.2024.09.005. [Google Scholar] [CrossRef]
44. Chen ZY, Chen YB. Self-scheduling strategy for energy storage considering cycle life and electric energy-frequency regulation market clearing. Autom Electr Power Syst. 2024;48(14):28–41. doi:10.7500/AEPS20230928002. [Google Scholar] [CrossRef]
45. Chu S, Zhang ST, Ge WC, Li YX, Liu C, Cai GW. A dynamic settlement method for bilateral transactions in peak regulation ancillary service markets considering interruptible loads. Autom Electr Power Syst. 2023;47(18):49–59. (In Chinese). doi:10.7500/AEPS20220914003. [Google Scholar] [CrossRef]
46. Zhang HL, Wang YB, Cai GW, Liu C, Ge WC. Source-load coordinated optimization strategy for wind power accommodation and electric melting magnesium high-energy load regulation. Trans China Electrotech Soc. 2022;37(17):4401–10. (In Chinese). doi:10.19595/j.cnki.1000-6753.tces.211113. [Google Scholar] [CrossRef]
47. Zhao SQ, Song JL, Wang AE, Li ZW. Operation optimization of electricity spot market considering new energy-thermal power bilateral peak-shaving transaction and time-sharing bidding game. Acta Energiae Solaris Sin. 2024;45(10):153–61. (In Chinese). doi:10.19912/j.0254-0096.tynxb.2023-0905. [Google Scholar] [CrossRef]
48. Wang ZW, Zhang ZY, Li Z, Xu HC, Fan JJ, Wang JH, et al. Optimal allocation of DSSC to enhance the hosting capacity of high-penetration renewable energy grids. Power Syst Prot Control. 2023;51(6):179–87. (In Chinese). doi:10.19783/j.cnki.pspc.220813. [Google Scholar] [CrossRef]
49. Chen XG, Liu JY, Li LG, Mei YL, Ji YN. Integrated planning method for charging stations/photovoltaic stations based on ap clustering algorithm. Renew Energy Resour. 2024;42(10):1371–80. (In Chinese). doi:10.13941/j.cnki.21-1469/tk.2024.10.014. [Google Scholar] [CrossRef]
Cite This Article
 Copyright © 2025 The Author(s). Published by Tech Science Press.
This work is licensed under a Creative Commons Attribution 4.0 International License , which permits unrestricted use, distribution, and reproduction in any medium, provided the original work is properly cited.
 Downloads
 Citation Tools