
 Submit a Paper
 Propose a Special lssue
 Open Access
ARTICLE

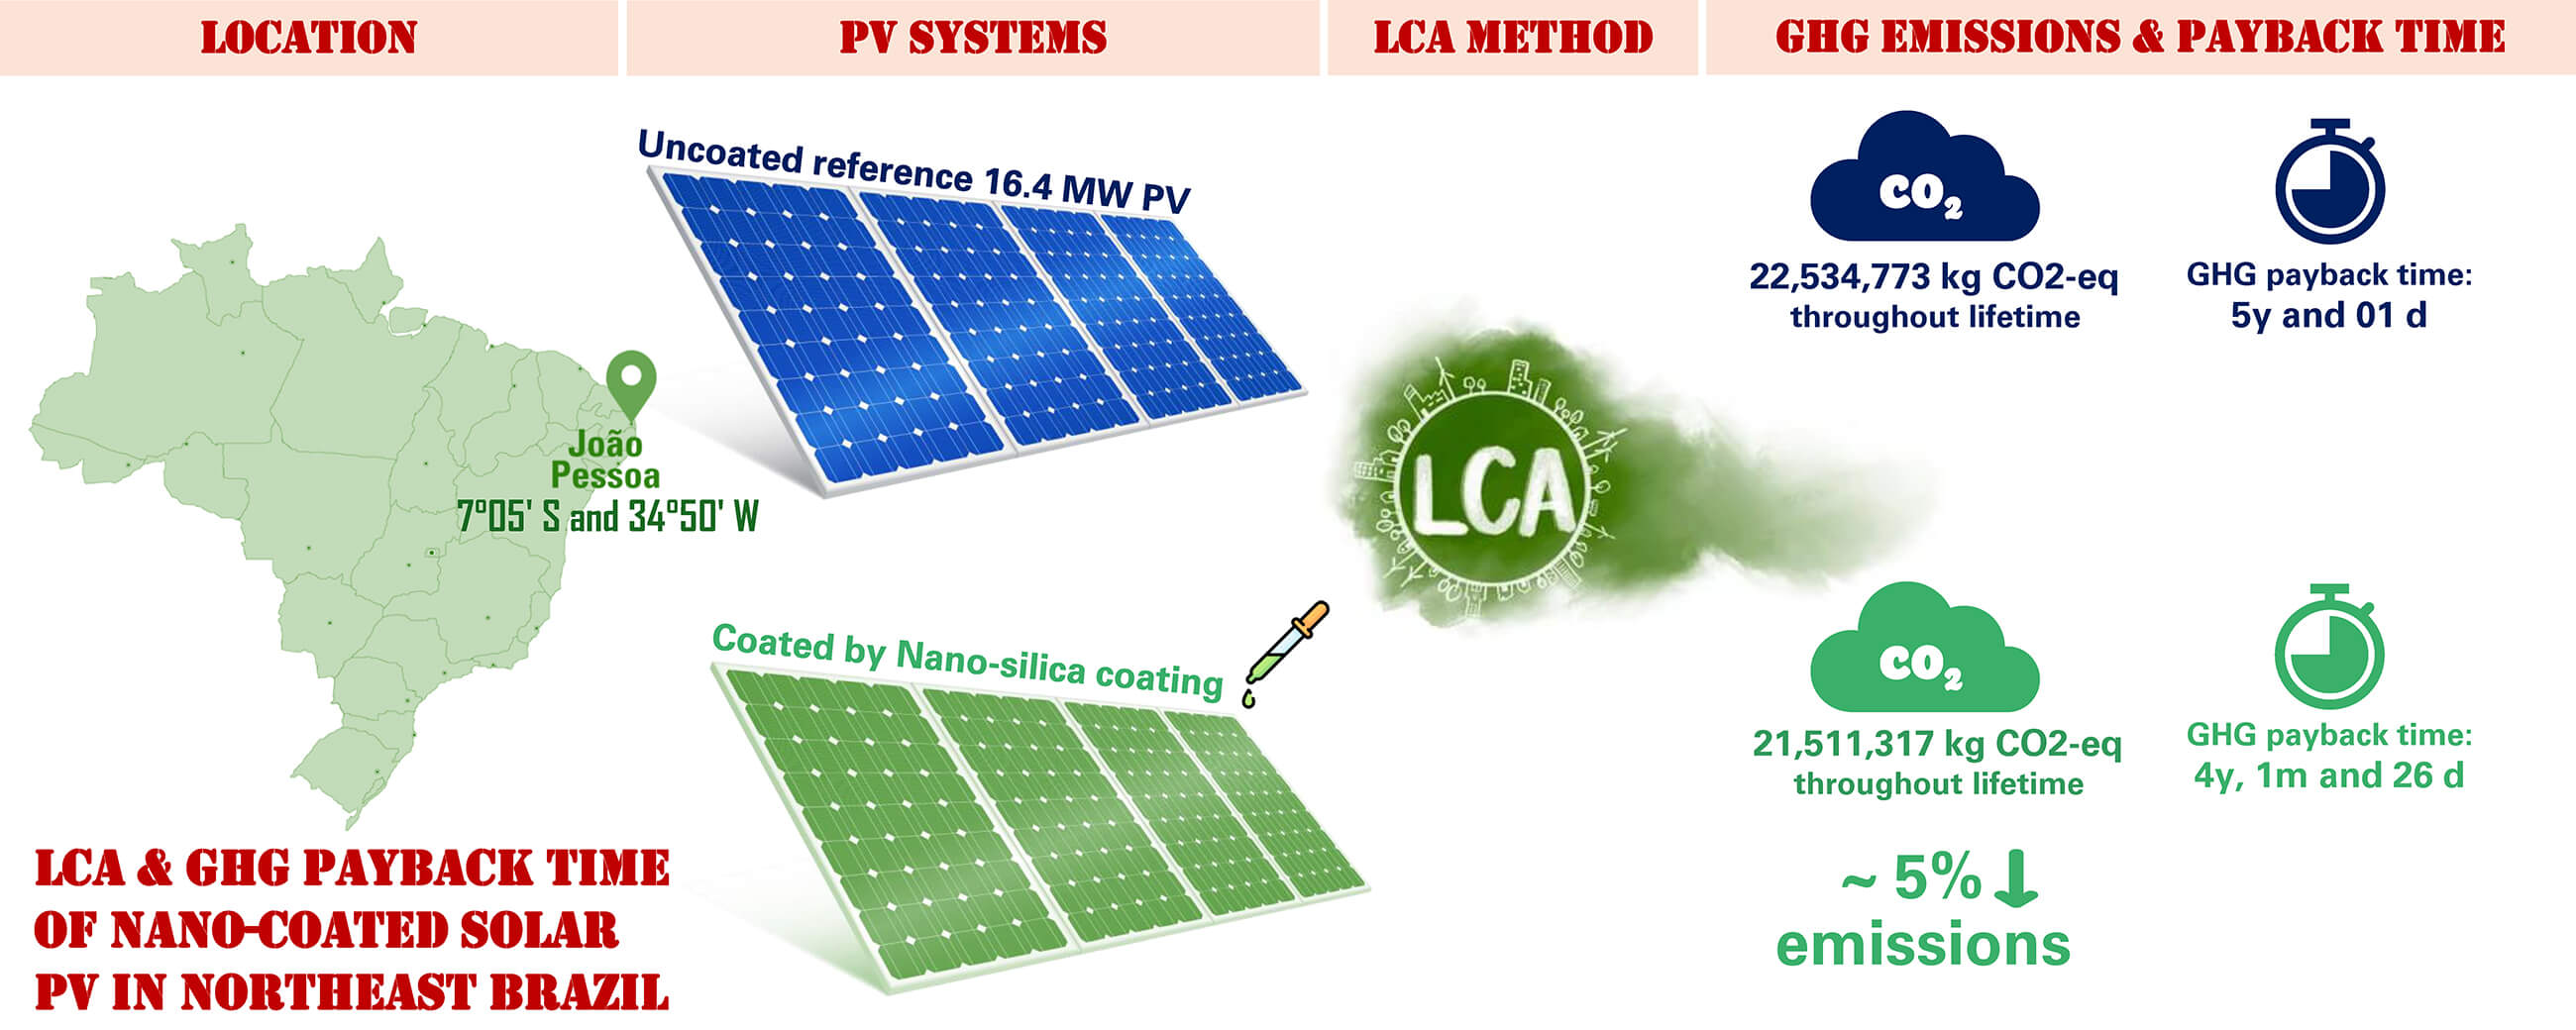
Greenhouse Gas Payback of a Solar Photovoltaic System in Northeast Brazil: Effects of the Application of a Solar Coating
1 Department of Renewable Energy Engineering, Federal University of Paraíba, João Pessoa, 58051-900, Brazil
2 Graduate Program in Mechanical Engineering, Federal University of Paraíba, João Pessoa, 58051-900, Brazil
3 Department of Chemical Engineering, Faculty of Science and Engineering, Université Laval, Québec, QC G1V 0A6, Canada
4 Aragón Institute for Engineering Research (I3A), University of Zaragoza, Zaragoza, 50009, Spain
* Corresponding Author: Monica Carvalho. Email:
(This article belongs to the Special Issue: Recent Advances in Sustainable Solar Thermal and PV Systems)
Energy Engineering 2025, 122(8), 3265-3283. https://doi.org/10.32604/ee.2025.066218
Received 01 April 2025; Accepted 17 June 2025; Issue published 24 July 2025
 View Full Text
 Download PDF
Abstract
The application of different coatings on solar photovoltaic (PV) panels can be an efficient solution to increase performance and further mitigate the emission of greenhouse gases. This study uses the Life Cycle Assessment (LCA) methodology and the environmental payback concept to analyze the effects of the application of a nano-silica coating on a solar PV system installed in the Brazilian Northeast. Firstly, an uncoated reference 16.4 MW PV system is designed, and the detailed inventory is presented (PV panels, supporting structure, inverters, junction boxes, cables, transportation, maintenance and operation—including the replacement of equipment). The results of the LCA quantify the greenhouse gas emissions associated with the PV system. Electricity production is estimated by technical and local climate data. Subsequently, the environmental payback time of the system is calculated, which is the time required for the PV system to offset the emissions associated with system manufacturing, operation, and disposal. This is the first Brazilian study to verify the effects of a self-cleaning coating on a solar PV system throughout its lifetime, compared to the uncoated (reference system). The original photovoltaic system emitted 22,534,773 kg CO2-eq, with an environmental payback of 5 years and 1 day. When the self-cleaning coating is applied, the emissions are 21,511,317 kg CO2-eq (almost 5% lower) with a payback of 4 years, 1 month and 26 days. The application of self-cleaning coatings reduces the required area for installation (due to increased efficiency), and not only reduces emissions but is also aligned with global sustainability targets and contributes to the concept of sustainable and intelligent cities.Graphic Abstract
Keywords
Solar photovoltaic (PV) energy systems are a fundamental component of sustainability due to their demonstrated environmental [1] and economic [2] advantages. When compared with other energy generation technologies, solar PV systems present reduced environmental impacts: although the manufacture and disposal of PV panels and materials emit greenhouse gases (GHG), these are usually much lower than their fossil-fuel counterparts [3].
PV systems need energy and raw materials for manufacture, transportation, installation and final disposal. Each of these phases needs to be evaluated so that the environmental impacts can be estimated throughout the lifetime of the energy systems [4,5]. Advances in manufacturing processes and end-of-life scenarios (increased recycling, for example) can further reduce component-related emissions, consequently reducing the overall impact associated with PV systems. This increases the potential for using PV systems to generate low-carbon electricity and realize environmental benefits regarding avoided emissions [6].
The transition to low-carbon electricity generation has become a central focus of global energy policy, driven by the urgent need to mitigate climate change. This shift has been reinforced by international agreements such as the Paris Agreement, which commits signatory countries to reduce greenhouse gas emissions and promote sustainable energy systems [7]. Decarbonizing the electricity sector—through the adoption of renewable energy sources like solar, wind, and hydro—is essential to meeting global climate targets [8,9]. Consequently, national governments and regulatory bodies have implemented a range of policies and incentives to accelerate the deployment of low-carbon technologies, including feed-in tariffs, renewable portfolio standards, and carbon pricing mechanisms [10].
Brazil’s electricity matrix is predominantly composed of low-carbon energy sources, with a significant share derived from hydroelectric power, biomass, wind, and solar energy. According to the Brazilian Energy Research Office (better known by its acronym in Portuguese, EPE), more than 80% of the country’s electricity generation in recent years has originated from renewable or low-emission technologies, positioning Brazil as one of the global leaders in low carbon energy production [11]. This reliance on low-carbon energy sources is critical for meeting both international and domestic climate commitments. In particular, the Paris Agreement—ratified by Brazil in 2016—establishes legally binding objectives to limit global warming to well below 2°C above pre-industrial levels, with efforts to limit the increase to 1.5°C [7]. To support these targets, Brazil has developed national frameworks, including its Nationally Determined Contributions (NDCs) and the Ten-Year Energy Expansion Plan 2034, which outlines strategies for expanding renewable energy capacity, improving energy efficiency, and reducing GHG emissions [12]. These initiatives underscore the strategic role of low-carbon electricity in achieving climate resilience and sustainable development.
Increasing the efficiency of PV systems is highly relevant today because it impacts not only the performance and economics of the systems but also the sustainability and viability of projects. By focusing on reducing environmental impacts, higher efficiency means a smaller area is needed to install a PV system [13]. This is beneficial for land conservation and can reduce the environmental impact associated with the installation of large solar systems. Higher efficiency also means fewer panels are required, reducing the use of materials and resources in manufacturing and the amount of waste generated [14].
Enhancing the efficiency of solar PV systems is crucial for advancing solar energy adoption. Coating technologies, particularly anti-reflective and self-cleaning films, have shown significant promise in improving PV panel performance. Anti-reflective coatings can reduce light loss and increase the amount of light absorbed by PV panels [15], and self-cleaning coatings can reduce the need for manual maintenance and improve efficiency [16].
A study conducted in Morocco [17] demonstrated that an anti-reflective coating improved the annual performance ratio and energy yield of solar panels by 2% and 5.5%, respectively, under desert conditions. Additionally, there was a 2.7% reduction in the levelized cost of energy, indicating a more cost-effective energy generation process. The study of Ben Gouider Trabelsi et al. [18] explored the use of silicon dioxide (SiO2) and zirconium dioxide (ZrO2) as an anti-reflective coating for polycrystalline silicon solar cells and obtained minimized reflection losses and enhanced light absorption properties.
Regarding self-cleaning coatings, a polydimethylsiloxane/SiO2 nanocoating demonstrated a 30.7% increase in panel efficiency compared to uncoated panels [19]. The coated panels exhibited reduced dust accumulation, leading to sustained energy output. Research on another nanocomposite coating revealed that it enhanced the durability, superhydrophilicity, and photocatalytic activity of the panels [20]. The coating maintained its effectiveness over a period of more than three years, resulting in approximately a 3% increase in power generation over 420 days.
Self-cleaning coatings have been in the research spotlight due to the easiness of manufacture and integration within solar energy systems [21]. Although suitable cleaning methods are used to regularly remove the dust deposited (e.g., manual or automatic cleanings), passive surface treatments decrease the losses associated with dust accumulation on the glass surface and power generation efficiency increases accordingly [22]. The losses associated with dust deposition on solar PV systems have been well studied, and can reach up to 70% [23]. The study of Zhao and Lu [24] verified that dust deposition on the coated glass sample was significantly lower compared with the bare glass sample, and the self-cleaning efficiency of super-hydrophilic coating reached more than 92%. The utilization of a spectral filter, employing ZnO-water nanofluid, was the focus of [25], who obtained an increase of 11.2% in electrical performance. Although the presence of dust decreased the outlet temperature of the filter, it led to a 66.79% improvement with the adoption of the self-cleaning method. A self-cleaning and transmission-enhancing multifunctional coating was fabricated through the sol-gel method by [26], and the results demonstrated that the coating exhibited superhydrophilic characteristics and outstanding anti-fogging performance. Also, there was a 1.24% increase in power generation, confirming the positive effects regarding dust and dirt elimination from the surface of PV panels and enhance power generation efficiency. A superhydrophobic composite coating with transparency, long-term durability and self-healing properties was developed by Xiang et al. [27], who verified that the maximum output power of the coating-covered photovoltaic panels increased by 2.03%. This represents a promising solution for the sustainable maintenance of solar infrastructures by integrating preventive self-cleaning with damage-responsive self-healing mechanisms in a synergistic manner.
Nevertheless, with the technological advances in solar coatings and PV panels, and considering their lifecycle, it is essential to understand the environmental repercussions. The current phase of technological development presents a critical window of opportunity to implement strategic adjustments that can significantly reduce potential negative impacts. At this early stage, innovations are still flexible and adaptable, making it far easier and more cost-effective to incorporate sustainable practices, ethical considerations, and safety measures before these technologies are scaled up and widely adopted in the global market [28].
Currently, one of the most widely used methodologies to analyze the environmental impact of products and energy systems is Life Cycle Assessment (LCA). LCA provides a comprehensive framework for evaluating the potential environmental impacts and associated liabilities of a product, process, or activity throughout its entire life cycle—from raw material extraction to end-of-life disposal [29]. By quantifying these impacts LCA enables meaningful comparisons between alternative products or processes. This evidence-based approach supports informed decision-making by highlighting trade-offs, identifying opportunities for improvement, and guiding the selection of more sustainable and responsible options. An additional criterion often employed to evaluate energy systems is the environmental payback. This concept refers to the duration required for the embedded GHG emissions—those generated during the manufacturing, transportation, and installation phases—to be offset by the system’s operational emissions savings [30]. Essentially, it represents the time needed for a technology to “amortize” its initial environmental debt through its ongoing, lower-impact operation.
Fonseca and Carvalho [30] assessed the greenhouse gas payback time (GPBT) of a wind turbine installed in the Brazilian Northeast. Their LCA revealed that the wind turbine had an emission factor of 0.0083 kg CO2-eq/kWh and a GPBT of 276 days, underscoring the rapid environmental benefits of wind energy in the region [31] evaluated the environmental payback of a wind turbine across different locations in the Brazilian Northeast, concluding that the wind turbine could offset its manufacturing-related carbon emissions within the first two years of operation in all analyzed locations. The study of Chen et al. [32] reported that the GPBT of PV systems in China, the largest manufacturing and installation country, have decreased from 2.89 to 0.83 years from 2009 to 2019. In the USA, Grant et al. [33] reported on the GPBP for all 50 states considering the regional differences in solar potential and electricity mixes. The lowest GPBP was around 2 years for Colorado, Indiana, Missouri, New Mexico, Utah, West Virginnia, and Wyoming. The highest GPBT was 113 years for the state of Vermont due to its low carbon electricity grid, with 60% hydroelectricity 20% wood and 20% other renewables. The authors concluded with the remark that choosing solar PV locations with shorter GPBT will result in more pronounced environmental benefits and that LCA and GPBT should be combined to measure the sustainability and prioritization of solar PV systems compared to prioritizing using solar potential alone. On a broader perspective, Xie et al. [34] calculated the pollutant payback time of Chinese multi-crystalline photovoltaic production, including chemical oxygen demand, chloride, fluoride, ammonia gas, nitric oxide, sulfur dioxide, hydrogen chloride, hydrogen fluoride and carbon dioxide. The latter was 0.884 years, but most of the pollutants could be paid back within the expected lifetime of the PV system.
In the light of the above, the objective of this study is to present an environmental performance analysis concerning a 16.4 MW monocrystalline PV system installed in João Pessoa, Northeastern Brazil, which is one of the highest solar-irradiated cities in the world. The study presented herein employs LCA to quantify GHG emissions, empirical equations to calculate the electricity output of the system, and the GPBT concept. A state-of-the-art nano-silica-based self-cleaning coating has been investigated as a strategy to enhance PV system efficiency by mitigating particulate deposition and reducing water consumption associated with manual or mechanical cleaning. The performance of this advanced surface treatment is evaluated in terms of its potential to increase energy yield and lower the life cycle environmental impact of PV installations. A comparative analysis between uncoated (baseline) and coated PV modules is conducted to assess the extent to which such surface-engineering innovations can accelerate progress toward more sustainable solar energy systems, particularly in regions characterized by high solar irradiance and harsh environmental conditions.
This section begins with an explanation of the LCA procedure and detailed construction of the inventory for the reference (uncoated system). All equipment and materials employed are listed, along with the considerations made for the end-of-life scenario of the PV system. Then the calculation procedure for electricity production is thoroughly explained, followed by the payback concept. The section ends with the inventory for the coating.
LCA is a powerful environmental management tool that can be used to determine the potential environmental impacts associated with a product, process, or activity [35]. An LCA can encompass the entire life cycle (manufacture, transportation, installation, operation, maintenance, and disposal) or just a specific phase.
LCA is standardized by ISO 14040 [36] and ISO 14044 [37], which in Brazil are equivalent to standards of the Brazilian Association of Technical Standards (better known by its acronym in Portuguese, ABNT), NBR 14040 [38] and NBR 14044 [39]. There are basically four phases for an LCA [36,37]: definition of the objective and scope, inventory analysis, assessment of environmental impacts, and interpretation of results.
The first step of an LCA is defining objective and scope, involving important decisions regarding the system boundaries and the functional unit used. The functional unit is a key concept that refers to a quantified description of the function of the product, process, or service being assessed. It serves as a reference point to which all inputs, outputs, and environmental impacts are related. This phase also defines the assumptions, limitations, and depth of the study.
The second step of an LCA is building the inventory, which includes all inputs and outputs related to the FU, including mass and energy flows, and residues.
The third step of an LCA is evaluating environmental impacts. In this step, an impact assessment method is applied. This step evaluates potential environmental impacts based on inventory data. These impacts can be grouped into categories such as Global warming potential (GWP), Acidification potential, Eutrophication potential, and Human toxicity, to name a few. This phase translates inventory data into meaningful environmental impact categories to understand the scale and significance of environmental impacts.
In the final step, the results from the inventory and impact assessment phases are analyzed and interpreted in relation to the goals of the study.
In this study, the LCA was developed within SimaPro software [40], using the Ecoinvent version 3.8 database [41]. The environmental impact assessment method used is the IPCC 2021 GWP 100y [42], which groups GHG emissions in terms of carbon dioxide-equivalents (CO2-eq) throughout 100 years.
The 16.4 MW PV system is based on Schultz and Carvalho [43]. In addition to considering the PV panels and the supporting structure, the analysis also includes the inverters, installation area, cables, transportation, maintenance, and operation throughout its lifetime (which includes necessary equipment changes). Table 1 presents the material composition of the photovoltaic system, along with fuel consumption and replacements during the operation and maintenance phase of the entire system (lifetime 25 years).
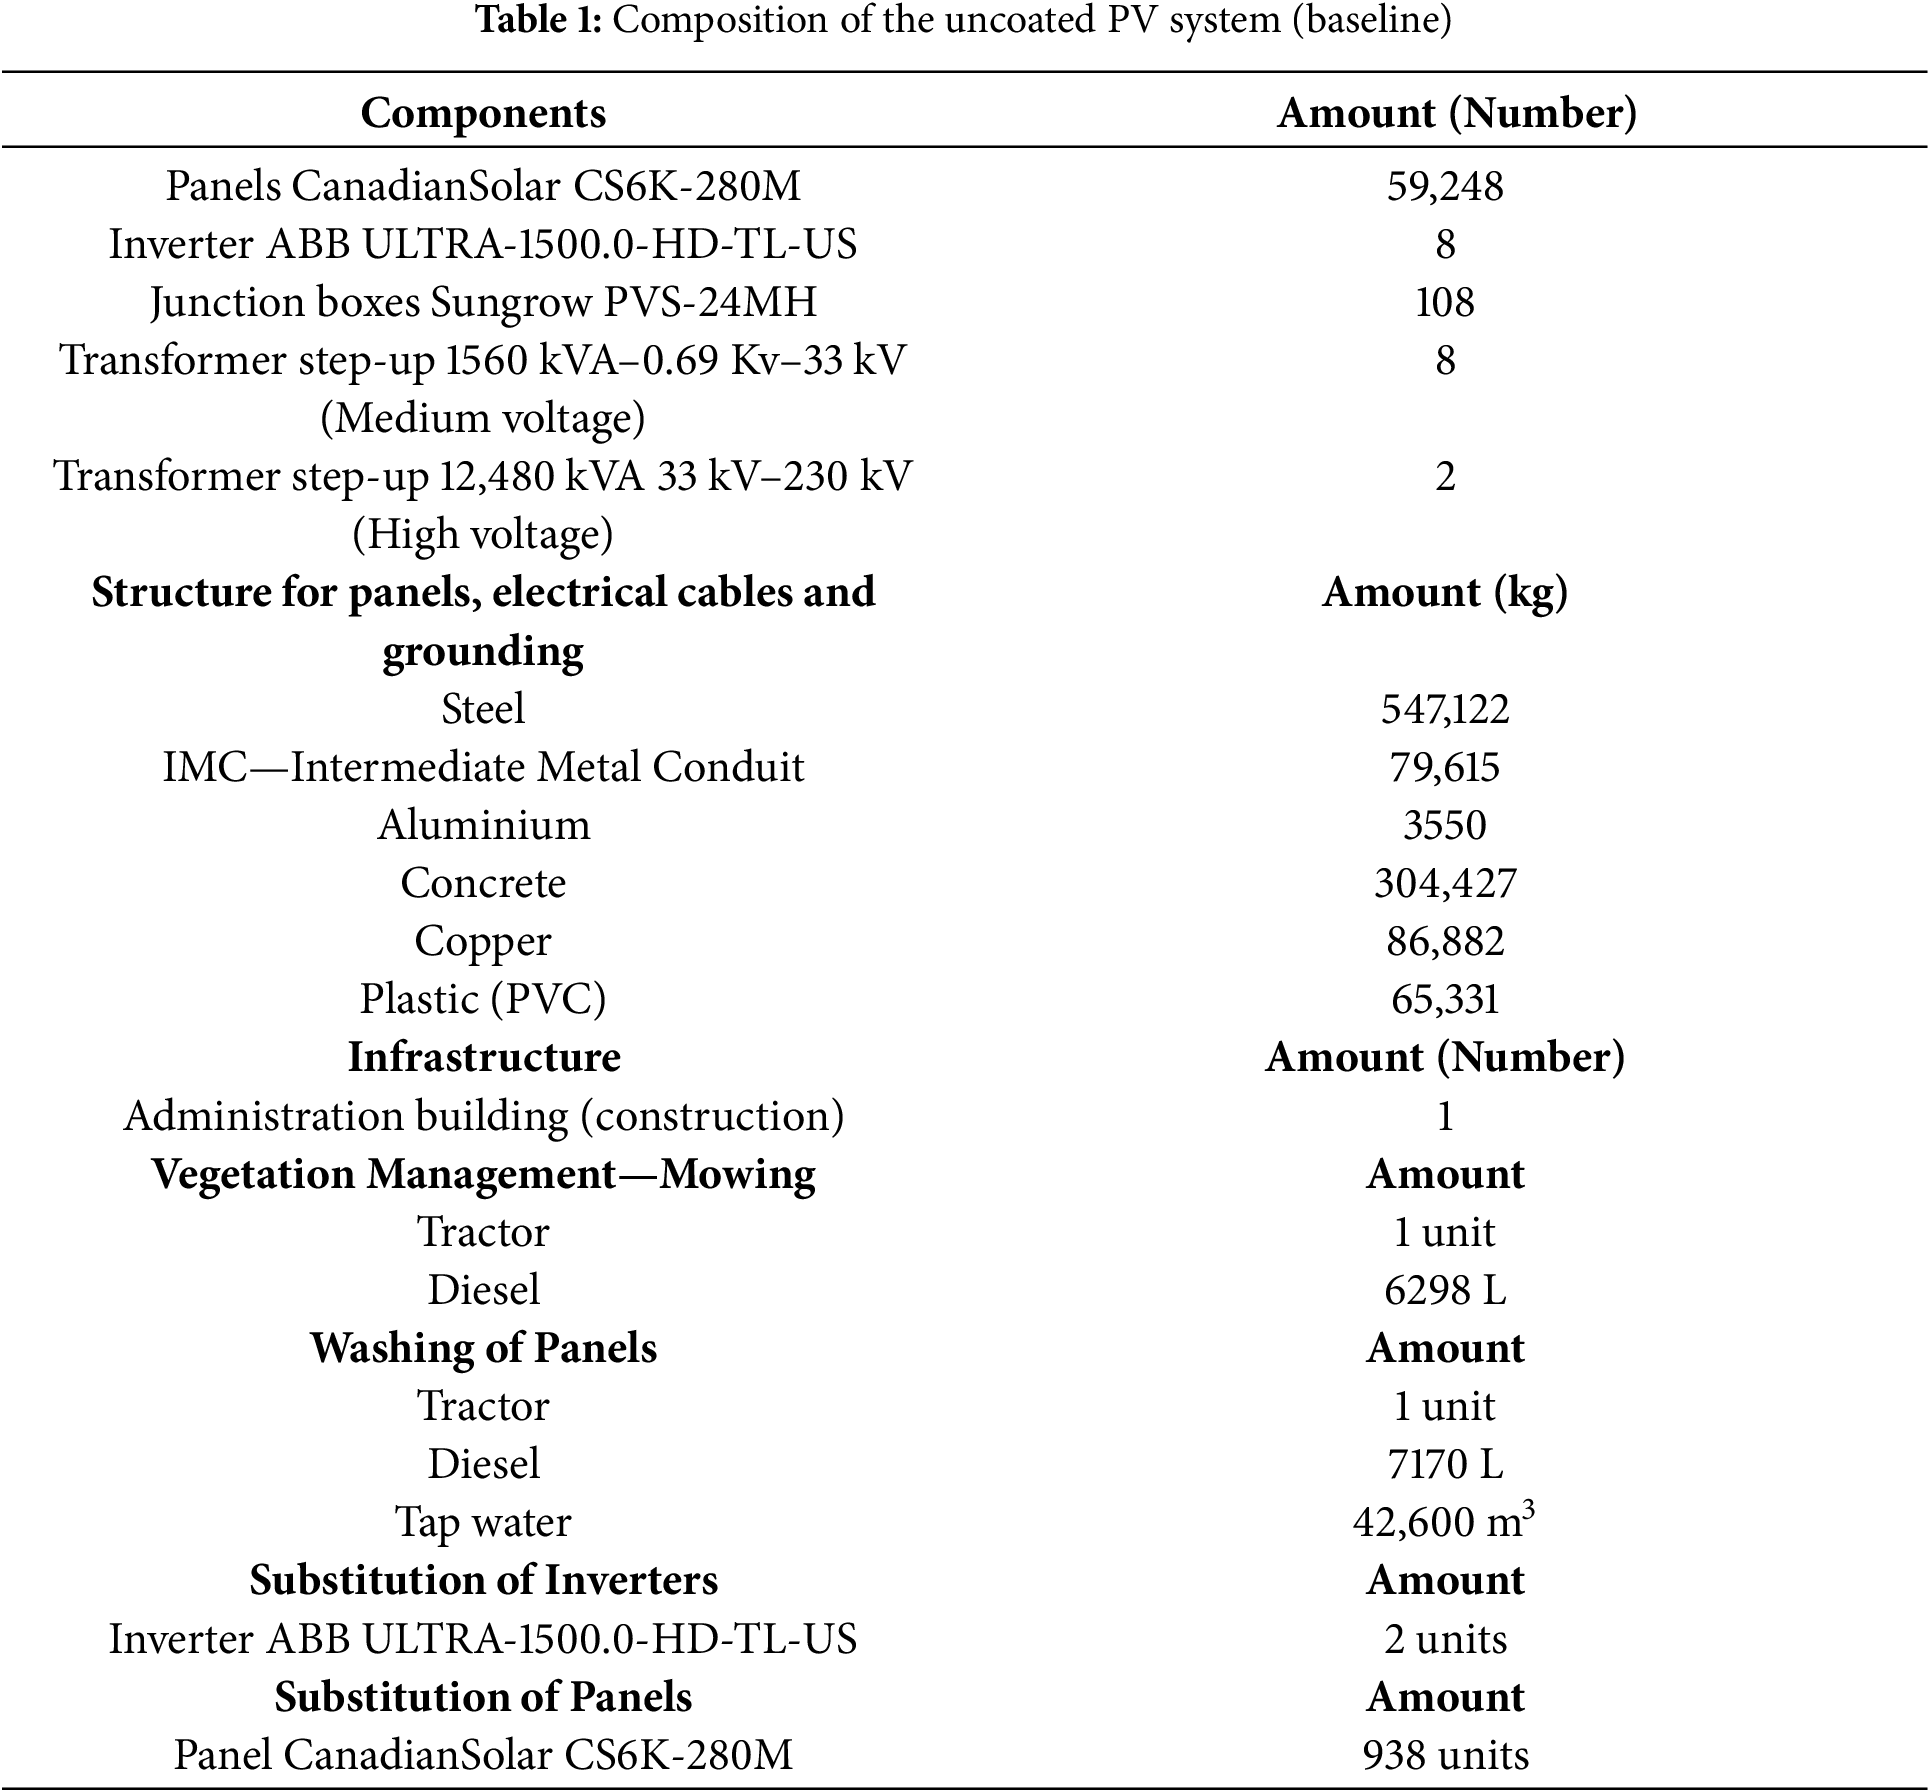
Finally, regarding the final disposal, the PV panels, inverters, junction boxes, and transformers are disassembled, materials are taken to the landfill and waste materials1 are treated. For the structure, electrical cables and grounding, materials are separated and taken to recycling facilities (aluminum, PVC, and steel and iron).
The annual electricity generation from the solar PV system was estimated using parameters provided by the PV module manufacturer under standard test conditions (STC), combined with local average air temperature data (°C) and daily horizontal global solar irradiation values (kWh/m2·day) to calculate site-specific PV output.
The electricity generated by the photovoltaic system, Pday, is calculated by Eq. (1) [44].
in which NIP is the number of installed panels, A is the area of a single photovoltaic panel (m2), eff is the panel efficiency (%), I is irradiation (kWh/m2·day), and ftemp is the operational loss factor as a function of module temperature.
The operational loss factor is given by Eq. (2) [45].
ftemp is calculated according to Eq. (2), where β′ is the temperature power coefficient (=0.0042°C−1), Tcell is the module operating temperature (°C), Tcell,ref is the module operating temperature under standard test conditions (25°C), Gβ is the solar radiation reaching the surface of the module (kWh/m2·day converted into W/m2), Gβ,ref is the solar radiation under standard test conditions (W/m2), and the γ factor is the solar radiation coefficient defined as γ = 0.12 [46].
The operation temperature of the photovoltaic cell, Tcell, can be calculated from Eq. (3) [47].
in which NOCT is the nominal operating temperature of the module (45°C), and Tamb is the ambient temperature (°C).
The estimation method composed by Eqs. (1) to (3) has successfully applied in previous studies [45,48–52]. Eqs. (1) to (3) depend on parameters that are acquired empirically, from the panel datasheet and meteorological databases. Climate data were obtained from the Brazilian National Institute of Meteorology [53] and the Prediction of Worldwide Energy Resource (POWER) Project [54]. The variables obtained from these databases are respectively ambient temperature (°C) and irradiation (kWh/m2·day).
The PV system is considered to be installed in João Pessoa. It is positioned at 7°5′43″ S, 34°50′ 55″ W, situated in the northeast region of Brazil. Its position on the Earth, nearly at the equator, presents an ideal condition to study solar PV systems because of high irradiance throughout the year. The remaining parameters of the solar panels were obtained from the manufacturer datasheet [55].
The environmental payback is calculated by Eqs. (4)–(6).
where GPBT is the GHG payback time in years; Ey is the annual electricity generated by the panels in kWh, and this value varies annually due to the degradation of the panels, where the percentage of annual degradation is is 3% after the first year, 0.7% between the second and sixth year and 0.5% from the seventh to the last year of the panel’s lifetime; EFmix is the emission factor of the national electricity mix, in kg CO2-eq/kWh; EFPV is the emission factor of the photovoltaic system, also in kg CO2-eq/kWh; the factor 1000 converts the calculated annual energy from MWh to kWh; the index “n” is the current year analyzed, which varies from 2 to 25 years, with 25 years being the lifetime established in this paper; Eplant,tot25 is the sum of the energy generated by the photovoltaic system over the 25 years of useful life, considering its annual degradation; and EmissionsPV25 value is obtained from the LCA result, considering the installation’s emissions and emissions during the operation and maintenance (O&M) phases.
The adequate representation of the Brazilian electricity mix required the adaptation of the Ecoinvent database following the methodology proposed by Carvalho and Delgado [56]. The most recent Brazilian electricity mix was considered (National System Operator, 2024): Hydro 68.23%. wind 14.64%. solar 6.77%. biomass 3.74%. natural gas 3.05%. nuclear 2.25%. coal 1.19% and oil 0.12%.
2.4 Application of Solar Coating
The inventory of the self-cleaning coating was based on the environmental study by Laopreecha et al. [57], which developed a nano-silica coating with superhydrophobic properties (water contact angle above 150°), applied by spraying. This study accounted for materials and energy for small-scale production and considered 25 reapplications over the lifetime of the panels. Table 2 presents the life cycle inventory of the coating for the 16.4 MW system, which reduces the required panel area by 6.51% (only requiring 55,391 panels to obtain the same output). Electricity consumption includes the use of the sprayer for the reapplications.
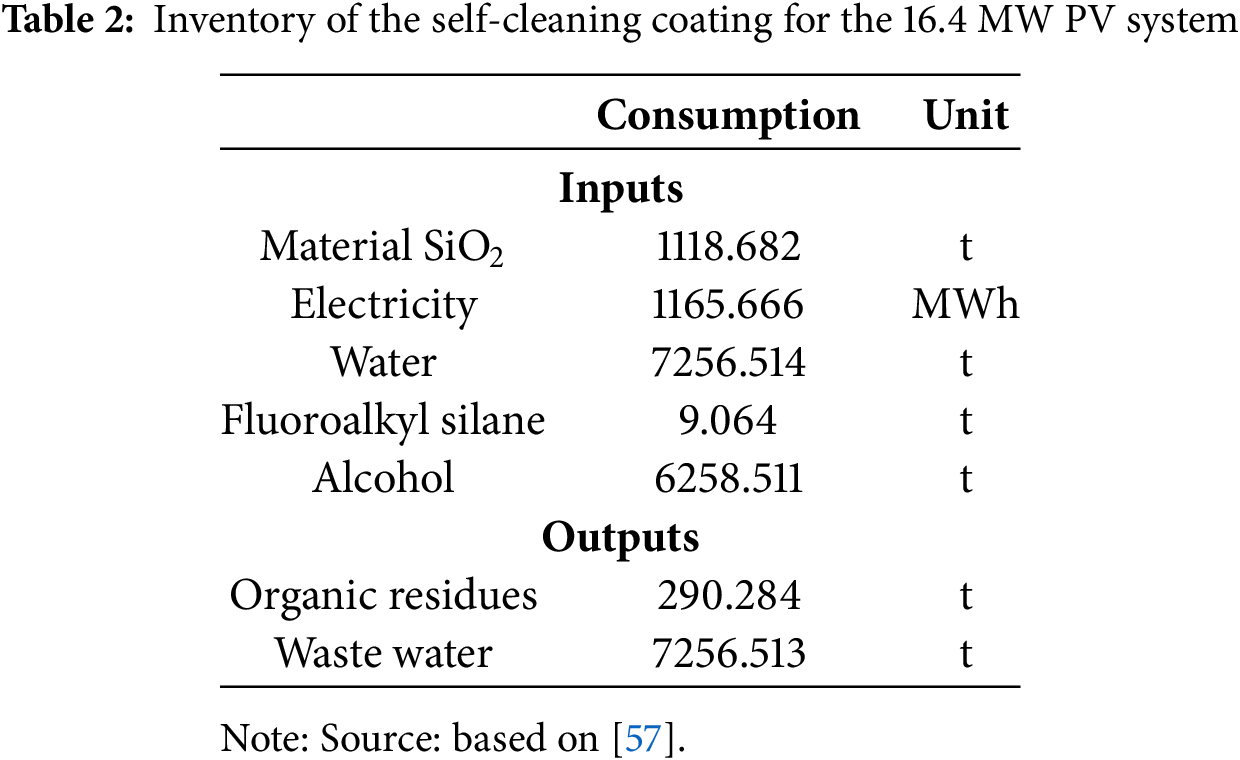
Table 3 shows the carbon footprint for each part of the uncoated and coated PV systems. Due to the reduction in the number of panels in the coated system, all other components were adjusted accordingly (except for the administrative building).
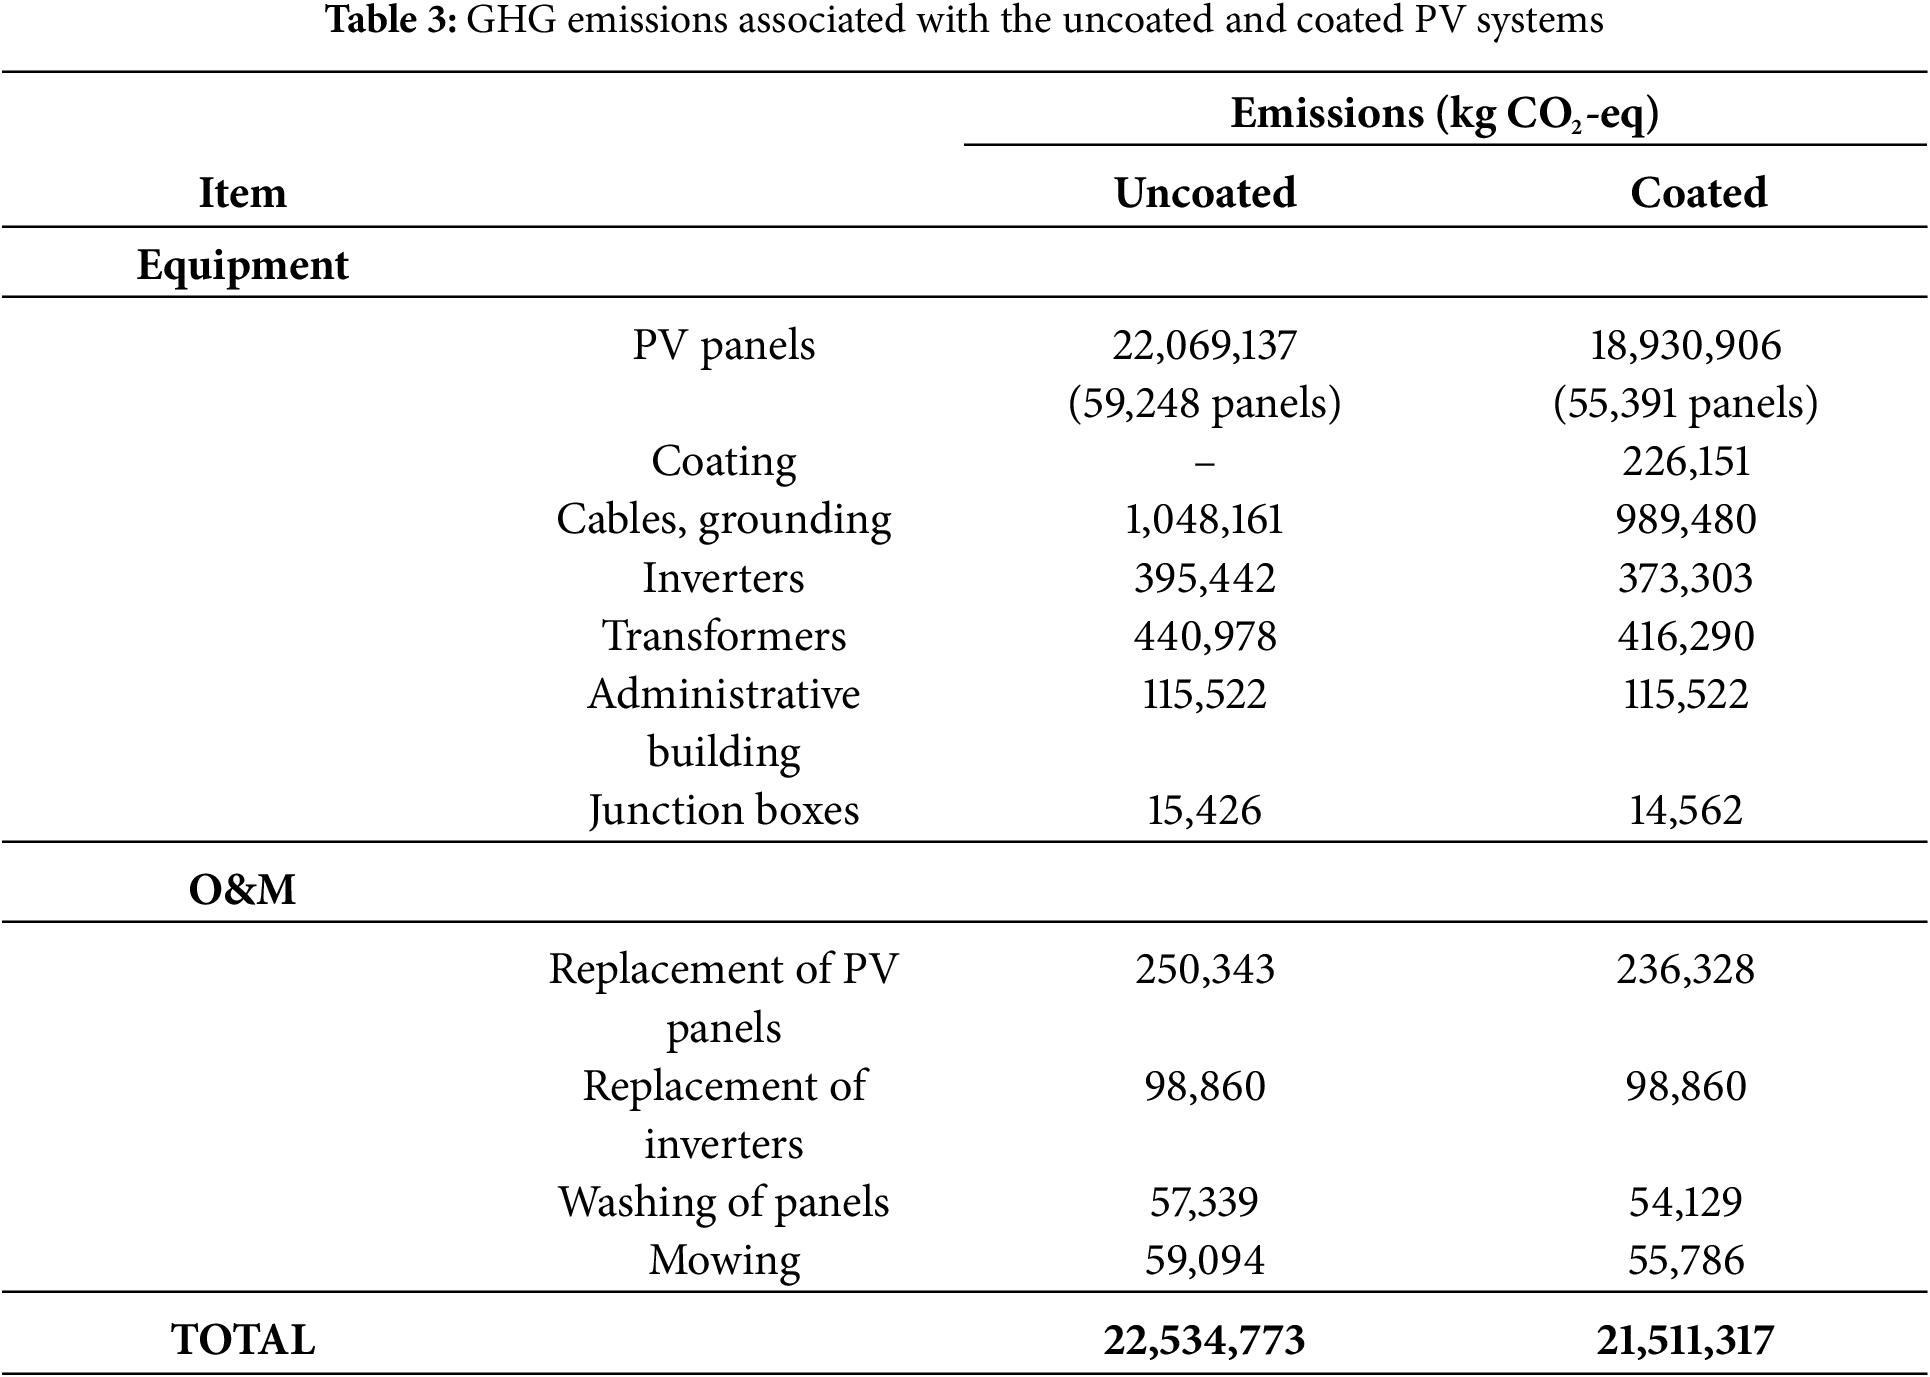
Table 3 shows the installation accounted for the highest percentage of emissions from the PV system, with approximately 89% referring to the panels alone in the case of the uncoated system and 88% for the coated system. The frame, cables, etc. (which refers to the structure and grounding system) account for 4.65% and 4.87% of the uncoated and coated systems, respectively. Table 4 presents the contribution of some materials to the overall GHG emissions.
As for the contribution of O&M, it has 2.07% of total emissions, of which 1.11% refers to the replacement of panels during the 25 years of operation of the PV system. When adding this percentage to the value related to PV panels, approximately 90% of emissions refer to PV panels only.
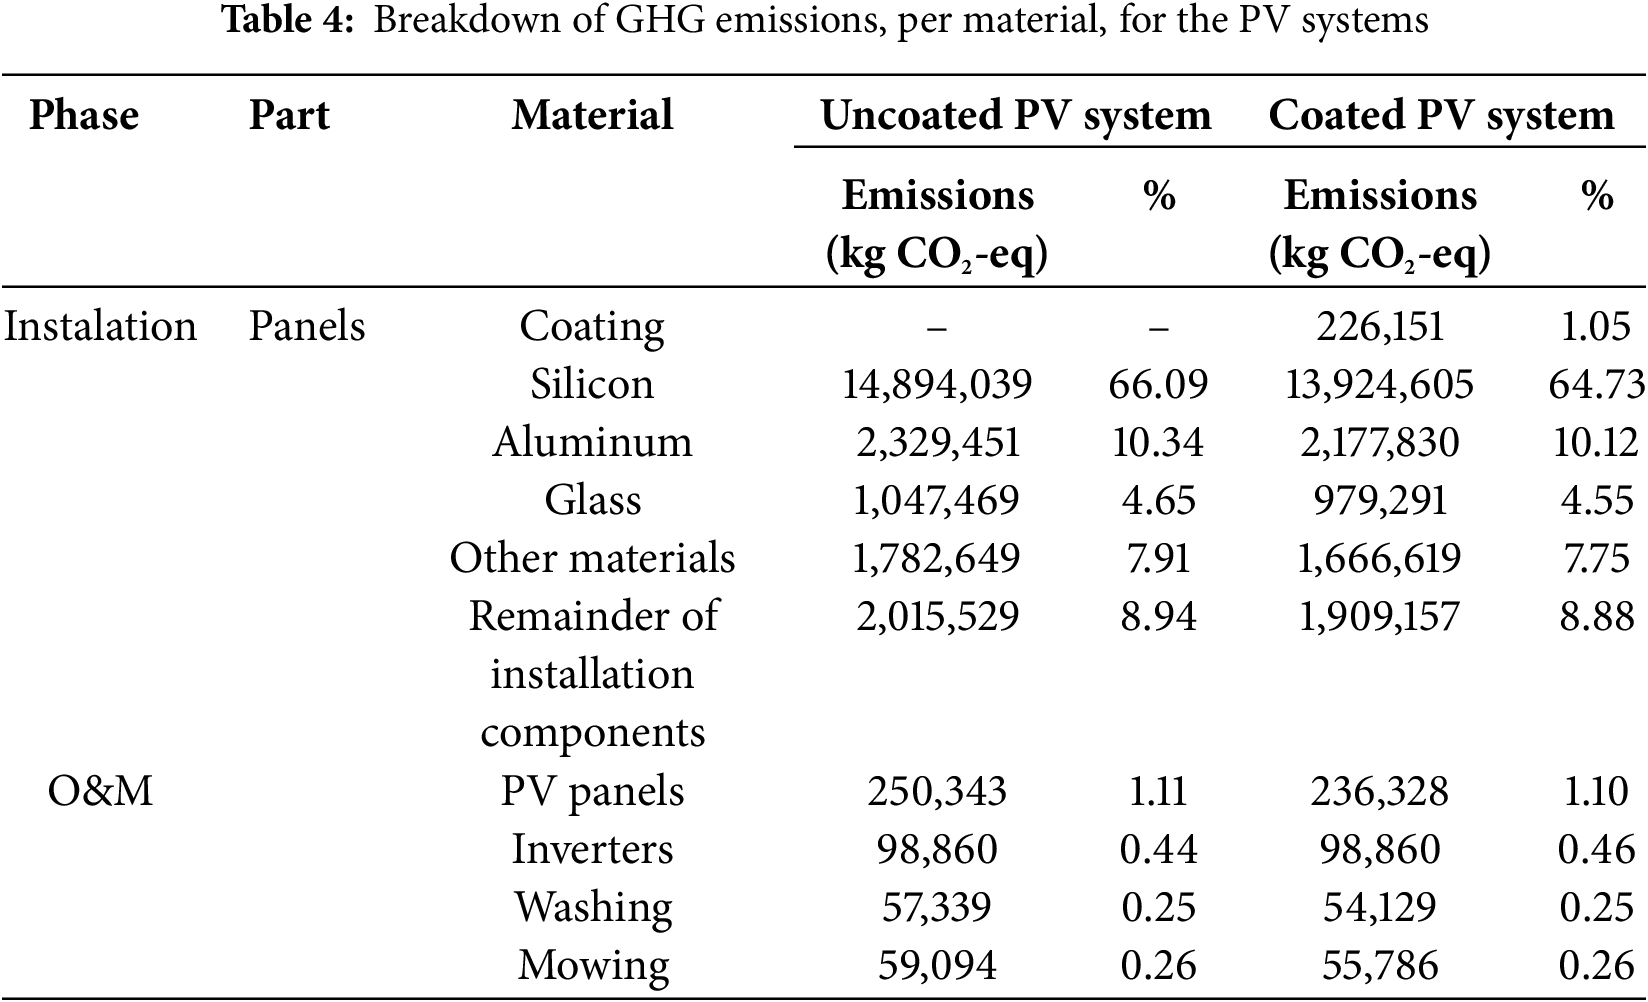
Regarding the calculations of electricity generation, based on Eqs. (1)–(3) and climate data for João Pessoa, the result is 759,039.86 MWh in 25 years. The calculations consider the monthly averages (for each climatological variable), calculated based on daily data from the entire period of data available and evaluating the annual degradation. Fig. 1 shows the electricity production results.
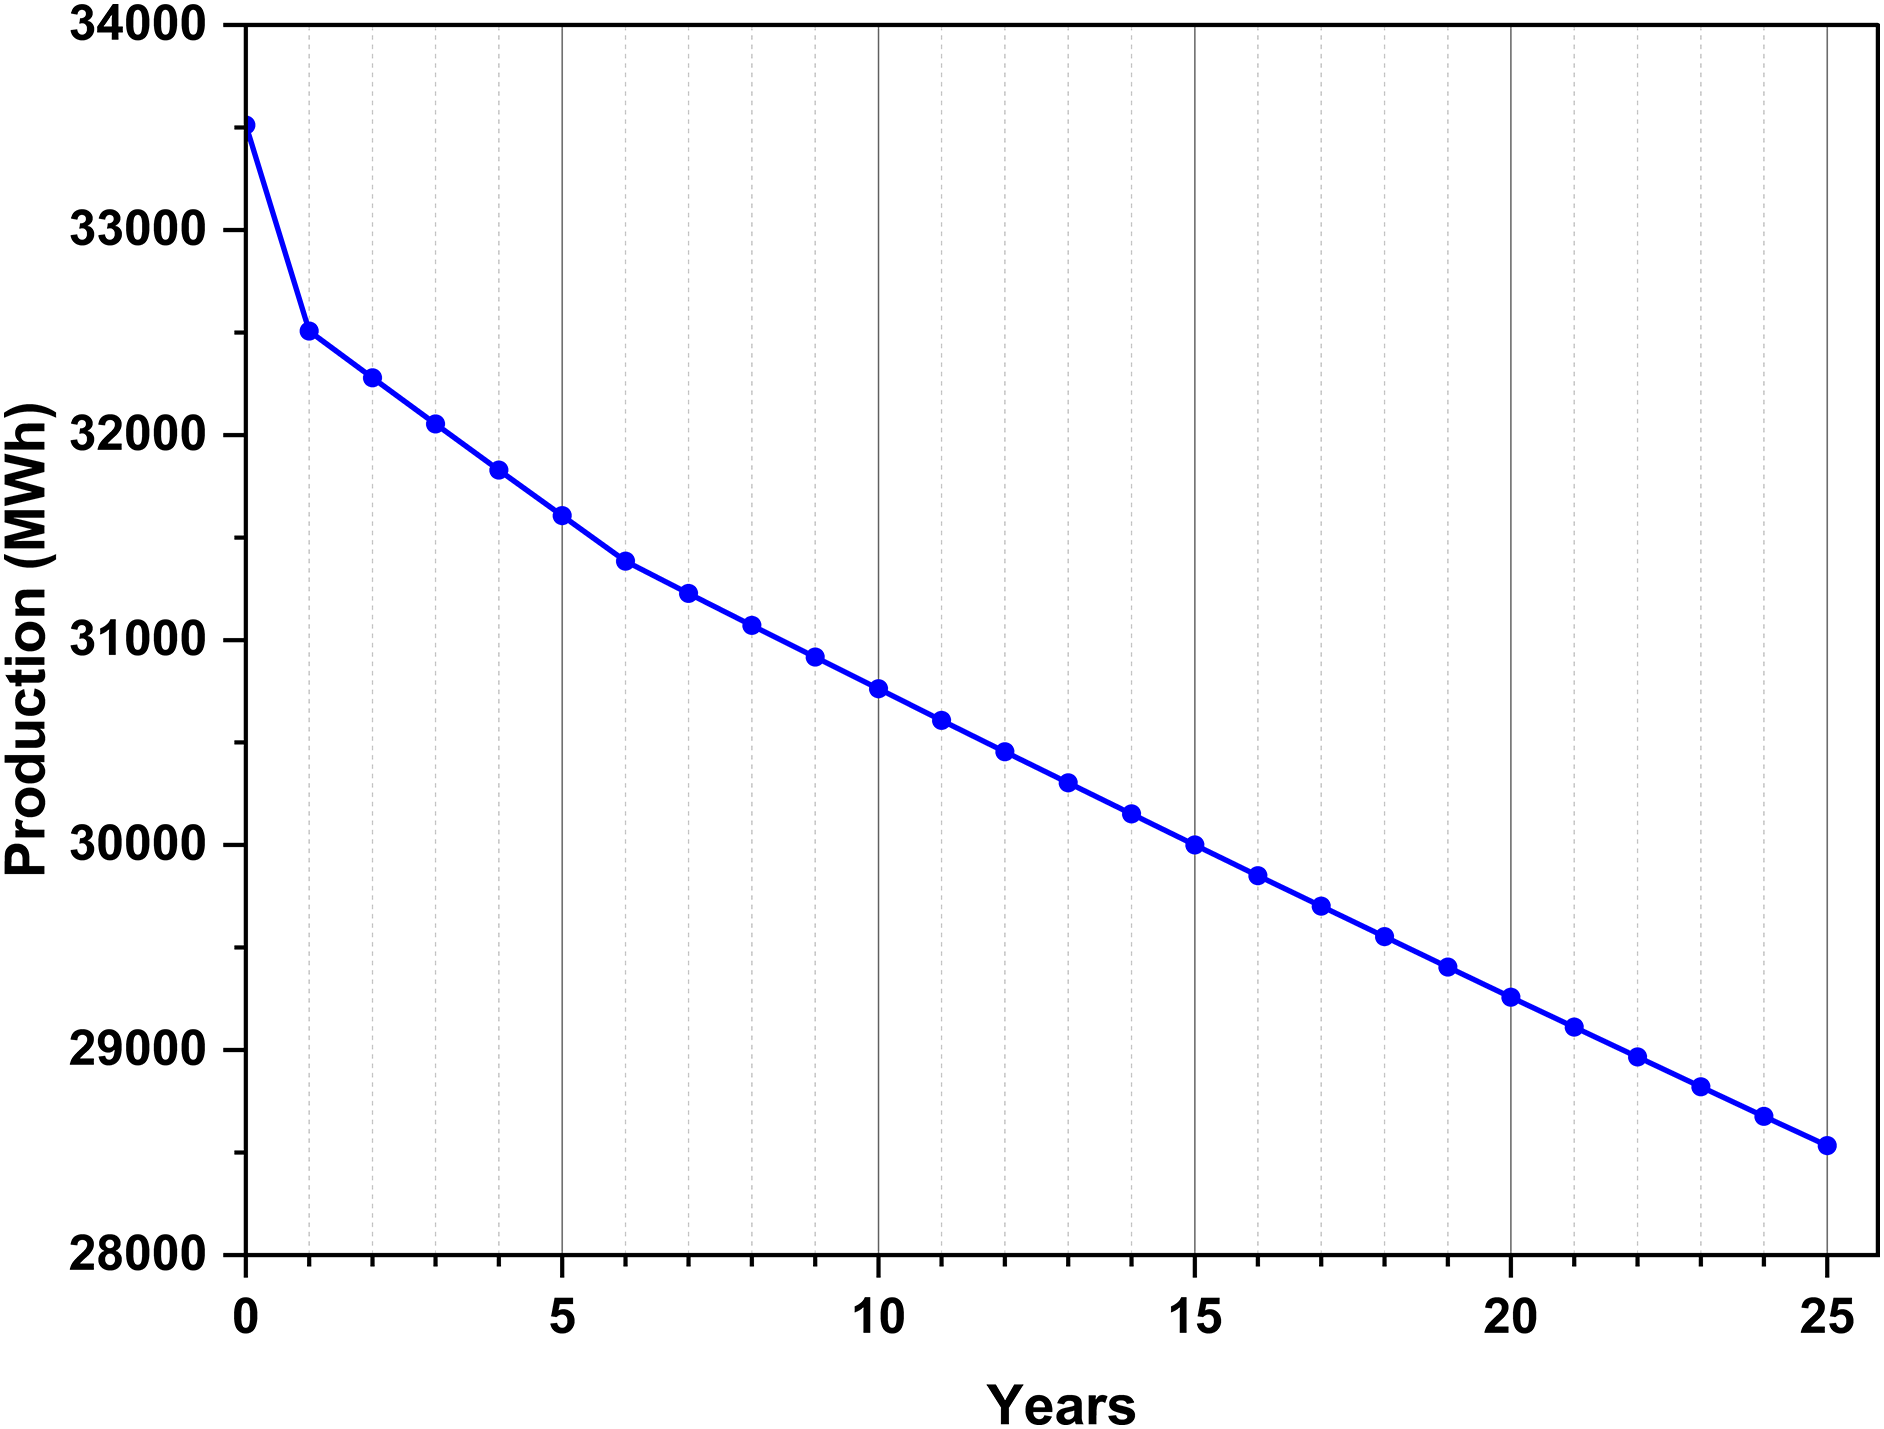
Figure 1: Annual production of electricity, considering the degradation rate, for the PV system
From Fig. 1, it is observed that there is a sharper decrease in production between year 0 (zero) and year 1, as the degradation rate for the first year is higher. For the following years, an almost linear decline is shown.
Considering the Brazilian electricity mix and applying the method of Carvalho and Delgado [56], the GHG emissions associated with electricity consumption from the Brazilian electrical grid are 0.140 kg CO2-eq/kWh consumed. With the electricity production (Eplant,tot25 = 759,039.86 MWh) and LCA results (EmissionsPV25 = 22,534,773 kg CO2-eq), it is possible to calculate the emission factor of the PV system as 0.02969 kg CO2-eq/kWh.
Fig. 2 shows the payback time for the uncoated PV system in João Pessoa. The point at which the line cuts the horizontal axis is the point that represents the system’s payback value for that location. The payback time of the uncoated PV system was 5 years and 1 day for João Pessoa.
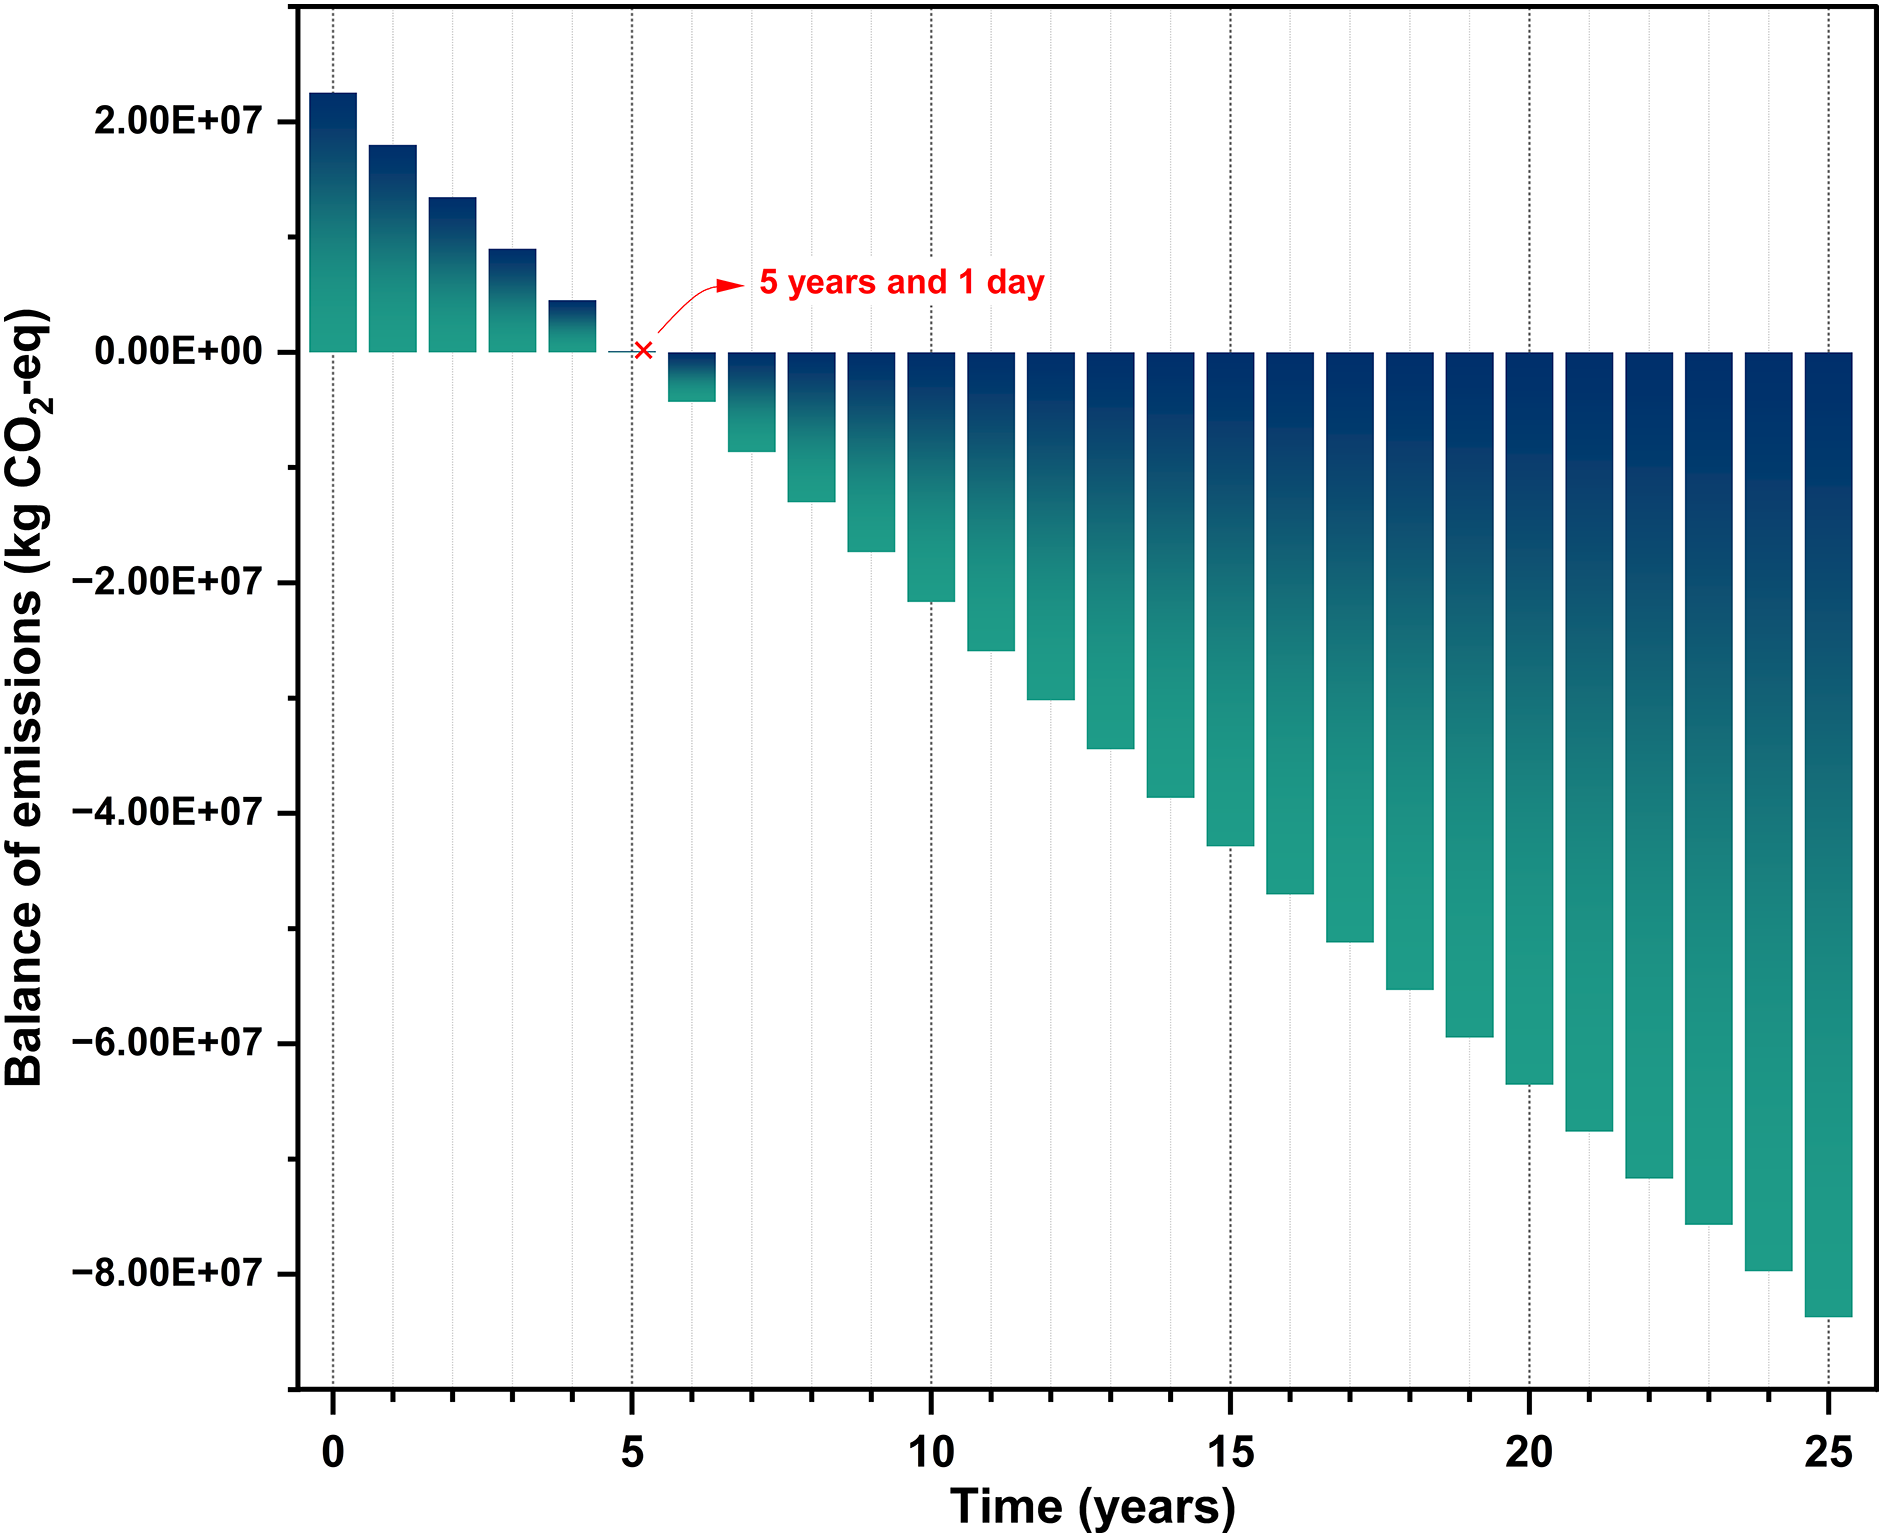
Figure 2: GHG payback time for João Pessoa (uncoated PV system)
The PV system benefits from a reduced installation area due to the enhanced efficiency achieved by applying a self-cleaning coating. Despite the reduced footprint, it maintains consistent electricity production throughout its lifetime, generating a total of 759,032.86 MWh. When dividing the overall emissions, EmissionsFV25 = 21,511,317 kg CO2-eq, by the total electricity production, a carbon emission factor of FEFV = 0.02834 kg CO2-eq/kWh is obtained. The GPBT for the coated PV system in João Pessoa is 4 years, 1 month and 26 days (Fig. 3). The application of a self-cleaning coating reduced the environmental payback period by roughly four months compared to the uncoated system. Additionally, the enhanced efficiency achieved with the coating decreased the area required for system installation.
Figure 3: GHG payback time for João Pessoa (coated PV system)
Schultz and Carvalho [43] obtained an environmental payback period of 5 years, 8 months, and 1 day. This result may have been influenced by variations in installation location and the use of earlier versions of methods and databases. Although the same PV system is considered, a different location is used. Also, the Ecoinvent database and the IPCC method used by Schultz and Carvalho [43] were from earlier versions of the Ecoinvent database and the 2013 IPCC method, while this study used the updated 2021 versions, ensuring more accurate and current data for the analysis. The energy equations used were also slightly different than those employed herein. Despite differences in the study results, due to each system’s specific characteristics, the environmental payback period is significanty shorter than the lifetime of the PV system. This fact reaffirms the environmental advantage of PV technologies, which is in line with international commitments established by agreements such as COP28, which aim to reduce GHG emissions.
Another parameter that can be applied to evaluate a renewable energy system is the lifetime avoided GHG emissions, expressed in t CO2-eq/kWp. Considering the lifetime avoided emissions for the uncoated PV system, these are 61,195,053.88 kg CO2-eq, which leads to 61,195 t CO2-eq/10,570 kWp = 5.79 t CO2-eq/kWp. For the coated system, the avoided emissions are 62,988,155.92 kg CO2-eq, which leads to 5.98 t CO2-eq/kWp.
Lamnatou et al. [58] obtained 9.1 t CO2-eq/kWp for a 150 kWp PV plant with hydraulic storage installed in Catalonia, comparing the supplied electricity with the electricity mix of Spain. Gaiddon and Jedliczka [59] also presented lifetime avoided CO2 emissions (not GHG emissions) for rooftop PV systems in several countries: 2.4 t CO2/kWp for France, 33.3 t CO2/kWp for Australia, 5.7 t CO2/kWp for Austria, 15.9 t CO2/kWp for Spain, and 0.2 t CO2/kWp for Switzerland. There is an extremely wide range of avoided emissions, which highly depend on the global irradiation of the site and the local electric grid composition.
Regarding the concept of GHG payback, from Eq. (5) it can be seen that it depends strongly on the emissions associated with the local supply of electricity. In Brazil, there have been slight fluctuations in the composition of the National electricity mix in recent years, which have led to changes in GHG emissions. Fig. 4 shows the GHG emissions associated with the Brazilian national electric grid for 2019–2023, based on its composition of generation technologies.
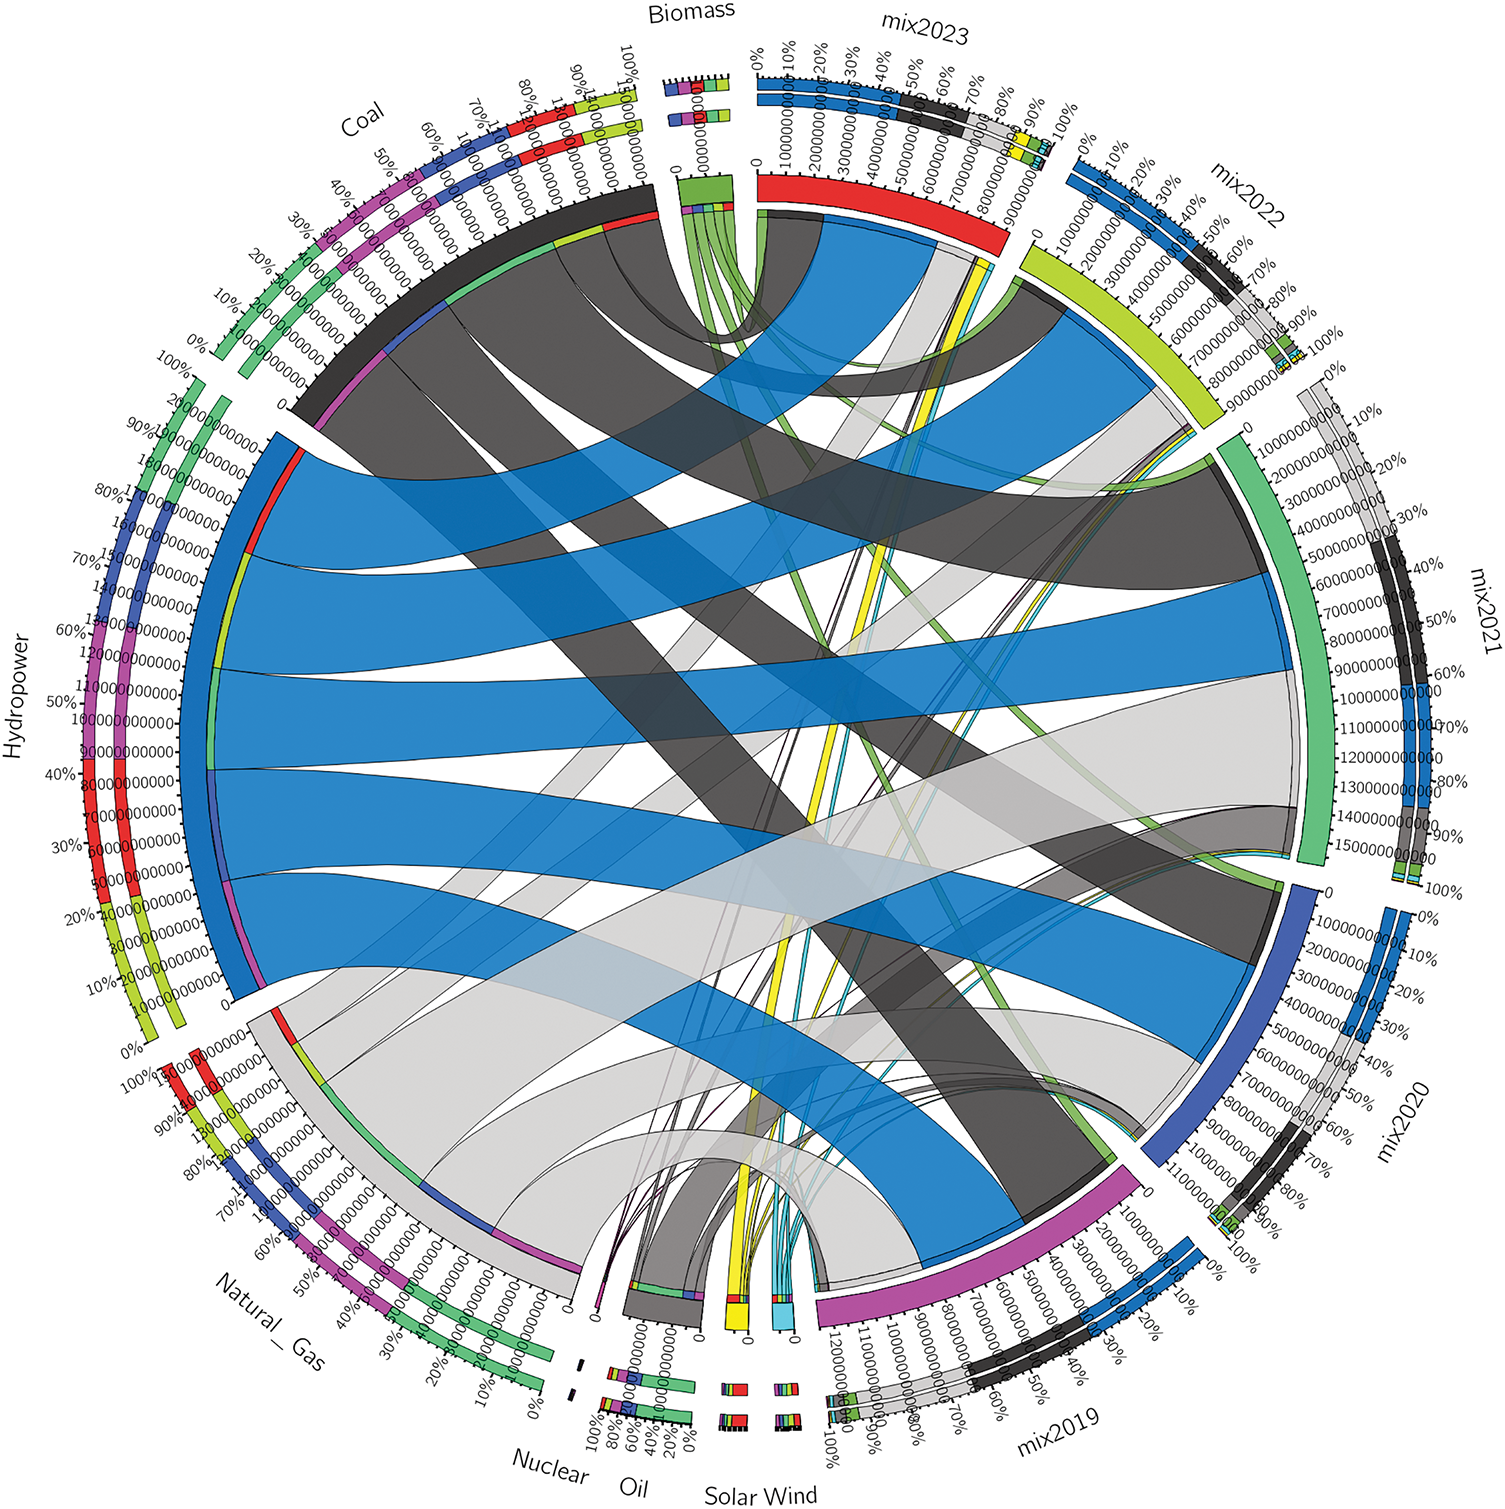
Figure 4: GHG emissions associated with the Brazilian electric grid, 2019–2023
Although the concept of GHG payback is well-established, an adaptation can be implemented to accommodate energy transition efforts and better represent changes in electricity mixes throughout time. Fig. 4 illustrated that the emission factor of the Brazilian electric grid has changed considerably in recent years. In 2023, the emission factor was 0.140 kg CO2-eq/kWh, whereas in 2021, it was notably higher at 0.268 kg CO2-eq/kWh. This would lead to a markedly different environmental payback time, reducing it by approximately two years when considering the lower emission factor of 2023.
Future discussions could explore the potential benefits of increased solar radiation in Northeastern Brazil due to the intensification of climate change, and the association of such findings with air temperature, as pointed by Santos et al. [60]. Also, additional parameters can be investigated to enhance further the results obtained herein, as Ferreira et al. [61] proposed a method to rank the top locations for wind, solar and hybrid electricity generation potential. The IP-PB method [61] can be applied to different regions of the world for the same purpose. A detailed cost-benefit analysis could also be an interesting complementary study, regarding how the initial investment costs for the coating compare to the long-term savings from reduced cleaning frequency and increased efficiency over the system’s 25-year lifespan.
In urban settings where space is at a premium, the reduction in required PV panel area due to the application of solar coatings has several planning and land-use implications. Because smaller arrays can be installed for the same output, building rooftops can host smaller PV systems to meet energy demands, leaving additional space for other uses (e.g., green roofs, recreational areas, HVAC equipment). Also, some rooftops can integrate PV with rooftop farming, gardens, or shaded seating, supporting multifunctional urban infrastructure. An interesting study by Montealegre et al. [62] has characterized building rooftops with LiDAR and Cadastral data, to assess the potential of food-energy-water systems on the rooftops of buildings in Spain. If less PV panel area is required, rainwater harvesting and food production alternatives can also be implemented, contributing to the concept of sustainable and intelligent cities.
It is also important to consider regional variability when assessing the effectiveness of self-cleaning solar coatings. In desert regions, where dust often contains larger, abrasive particles like silica, coatings will wear out faster or become less effective [63]. In industrial [64] or coastal regions [65], where particles can include soot, salt, or heavy metals, the adhesion and chemical interaction with coatings can differ significantly. In coastal regions there is also the effect of humidity [66]. Frequent, moderate rainfall can aid the cleaning function but in arid or low-rainfall areas, the cleaning action is minimal, potentially leading to long-term accumulation and reduced coating efficacy. Heavy rains, though less frequent, can sometimes wash away loose dust but may also lead to spotting or streaking if not uniformly distributed [67]. Regarding the limitations in extrapolating results, a coating that performs well in a temperate, high-rainfall area may be ineffective in a dry, dusty environment. Also, durability can vary, as the coating lifespan and cleaning performance can degrade faster in harsher climates due to abrasion or UV exposure. There could also be maintenance differences, and in some areas, periodic manual cleaning may still be necessary to maintain optimal performance. Also, regarding real world settings, lab or pilot studies may not account for cumulative environmental stressors experienced over a 25-year system lifespan in different regions.
Considering that some regions are more sensitive or vulnerable to climate change, future climate trends can affect the predictions of energy generation. This has been investigated by Medeiros et al. [50], who verified the influence of climatic variability on the electricity generation potential by renewable sources in the Brazilian semi-arid region. In their study, Ref. [50] showed that annual solar PV electricity production remained relatively stable over the years despite rising temperatures, possibly due to slight reductions in cloud cover offsetting negative impacts. However, production was consistently higher when analyzing only the first 10 years of the data, suggesting a subtle downward trend that could become more significant in the future and should be accounted for in PV system design.
The adoption of coated PV panels can play a pivotal role in enhancing the efficiency and longevity of solar installations. In regions like Brazil, where solar energy potential is abundant, optimizing PV system performance is crucial for meeting renewable energy targets. The Brazilian installed solar capacity has reached 50 GW in 2024, according to the Brazilian Solar Energy Association [68], accounting for 22.2% of Brazil’s total installed electricity capacity, making it the country’s second-largest generation source. The widespread adoption of self-cleaning coated PV systems could further accelerate this growth by enhancing system performance and reducing operational costs. This would contribute to a more sustainable and resilient energy matrix, aligning with Brazil’s NDC commitments. Brazil has committed to reducing its net greenhouse gas emissions by 59% to 67% by 2035, compared to 2005 levels, according to its Nationally Determined Contribution (NDC) submitted to the United Nations Framework Convention on Climate Change (UNFCCC) [69]. Achieving these rather ambitious goals necessitates significant advancements in renewable energy deployment, particularly solar PV systems; and as shown herein, solar coatings can improve energy production by PV panels and even reduce maintenance costs due to the decreased accumulation of dust and other particulate matter.
While self-cleaning coatings can offer technical and environmental benefits, the social implications can significantly influence how widely and effectively they are adopted. This is an important and often overlooked aspect of technological adoption. There could be an impact on local maintenance job markets. The application of solar coatings on PV panels will lead to a decrease in the frequency of manual cleaning [70,71], which could reduce the demand for maintenance labor, particularly in more vulnerable regions where PV cleaning jobs are a significant source of local employment [72]. This could create concerns about job displacement among workers currently employed in PV maintenance, especially in rural or developing areas. Nevertheless, this could lead to a demand for new skills (e.g., installation and monitoring of coated systems), offering opportunities for upskilling and more specialized employment. Overall, the use of solar coatings can be a positive influence: if framed as a way to reduce water use, lower maintenance costs, and improve energy access, adoption may increase—especially in water-scarce or remote areas. In sum, for self-cleaning PV coatings to contribute effectively to national energy and climate goals, policies should address not only technological performance but also the social and economic dimensions of adoption.
This paper presented a detailed life cycle inventory for a self-cleaning coating applied to PV panels to improve performance. The study focused on a 16.4 MW solar PV system, comparing the GHG emissions of both the uncoated and coated systems. The PV system was found to generate 759.04 GWh of electricity over its 25-year lifetime. The uncoated system resulted in 22,534,773 kg CO2-eq of emissions, while the coated system emitted 21,511,317 kg CO2-eq. These figures lead to emission factors of 0.02969 kg CO2-eq/kWh for the uncoated system, and 0.02834 kg CO2-eq/kWh for the coated system. The payback time of the uncoated PV system was approximately 5 years, whereas the coated system’s payback time was 4 years, 1 month and 26 days.
It was demonstrated that the PV system benefited from an increase in efficiency, due to the coating, which also led to a reduction in the required area for installation. Additionally, the results demonstrated that PV systems have the potential to mitigate climate change, being a promising tool for reducing environmental impacts. When integrated into broader initiatives aimed at reducing environmental impacts and fostering sustainable urban development, PV systems offer strategic advantages in advancing sustainability.
Acknowledgement: The authors wish to thank the Laboratory of Environmental and Energy Assessments (LAvAE) at the Federal University of Paraíba (UFPB). Thanks are extended to Dr. Yolanda Bravo for the files on the CIRCOS graphs.
Funding Statement: The authors wish to acknowledge the support of the Paraíba State Research Foundation (FAPESQ) (call No. 09/2021), National Council for Scientific and Technological Development (CNPq Productivity Grants 309452/2021-0, 308753/2021-6), and Scientific Initiation Scholarships (PIBIC) within the Federal University of Paraíba (UFPB). Silvia Guillén Lambea thanks Grant RYC2021-034265-I funded by MCIN/AEI/10.13039/501100011033 and by “European Union NextGenerationEU/PRTR”.
Author Contributions: The authors confirm contribution to the paper as follows: Conceptualization, Monica Carvalho; methodology, Luiz Felipe Souza Fonseca, Monica Carvalho; software, Luiz Felipe Souza Fonseca, João Marcelo Fernandes Gualberto de Galiza, Monica Carvalho; validation, Monica Carvalho; formal analysis, Monica Carvalho; investigation, Luiz Felipe Souza Fonseca, Heitor do Nascimento Andrade, Monica Carvalho; resources, João Marcelo Fernandes Gualberto de Galiza, Hamid Boleydei; data curation, Luiz Felipe Souza Fonseca, Heitor do Nascimento Andrade, João Marcelo Fernandes Gualberto de Galiza, Hamid Boleydei, Silvia Guillén-Lambea; writing—original draft preparation, Luiz Felipe Souza Fonseca, Heitor do Nascimento Andrade; writing—review and editing, João Marcelo Fernandes Gualberto de Galiza, Hamid Boleydei, Silvia Guillén-Lambea, Monica Carvalho, Raphael Abrahão; visualization, João Marcelo Fernandes Gualberto de Galiza, Hamid Boleydei; supervision, Hamid Boleydei; project administration, Raphael Abrahão, Silvia Guillén-Lambea, Monica Carvalho. All authors reviewed the results and approved the final version of the manuscript.
Availability of Data and Materials: The data presented in this study are available on request from the corresponding author.
Ethics Approval: Not applicable.
Conflicts of Interest: The authors declare no conflicts of interest to report regarding the present study.
1Waste plastic follows Brazilian country-specific data, composed by the following technologies: 3% of open burning, 8% of open dump, 88% of unsanitary landfill, 1% of municipal incineration. Waste polyvinylfluoride implies in municipal incineration. Copper and steel are reused (scrap market).
References
1. Assareh E, Delpisheh M, Farhadi E, Peng W, Moghadasi H. Optimization of geothermal- and solar-driven clean electricity and hydrogen production multi-generation systems to address the energy nexus. Energy Nexus. 2022;5(71):100043. doi:10.1016/j.nexus.2022.100043. [Google Scholar] [CrossRef]
2. Delgado D, Carvalho M, Coelho Junior LM, Abrahão R, Chacartegui R. Photovoltaic solar energy in the economic optimisation of energy supply and conversion. IET Renew Power Gener. 2018;12(11):1263–8. doi:10.1049/iet-rpg.2018.0090. [Google Scholar] [CrossRef]
3. Alam E, Xu X. Life cycle assessment of photovoltaic electricity production by mono-crystalline solar systems: a case study in Canada. Environ Sci Pollut Res Int. 2023;30(10):27422–40. doi:10.1007/s11356-022-24077-3. [Google Scholar] [CrossRef]
4. Nishimura A, Hayashi Y, Tanaka K, Hirota M, Kato S, Ito M, et al. Life cycle assessment and evaluation of energy payback time on high-concentration photovoltaic power generation system. Appl Energy. 2010;87(9):2797–807. doi:10.1016/j.apenergy.2009.08.011. [Google Scholar] [CrossRef]
5. Kumar NM, Chopra SS, Rajput P. Life cycle assessment and environmental impacts of solar PV systems. In: Photovoltaic solar energy conversion. Amsterdam, The Netherlands: Elsevier; 2020. p. 391–411. doi:10.1016/b978-0-12-819610-6.00012-0. [Google Scholar] [CrossRef]
6. de Lima K, de Mello Delgado D, Martins D, Carvalho M. Solar energy and biomass within distributed generation for a northeast Brazil hotel. Energies. 2022;15(23):9170. doi:10.3390/en15239170. [Google Scholar] [CrossRef]
7. UNFCCC. Paris agreement. United Nations framework convention on climate change [Internet]. [cited 2025 Jun 16]. Available from: https://unfccc.int/process-and-meetings/the-paris-agreement. [Google Scholar]
8. IEA. Net Zero by 2050: a roadmap for the global energy sector. International Energy Agency [Internet]. [cited 2025 May 1]. Available from: https://www.iea.org/reports/net-zero-by-2050. [Google Scholar]
9. REN21. Renewables 2022 Global Status Report. Renewable Energy Policy Network for the 21st Century [Internet]. 2022 [cited 2025 May 1]. Available from: https://www.ren21.net/gsr-2022/. [Google Scholar]
10. IPCC. Climate change 2022: mitigation of climate change. Intergovernmental Panel on Climate Change [Internet]. 2022 [cited 2025 May 1]. Available from: https://www.ipcc.ch/report/ar6/wg3/. [Google Scholar]
11. Brazil. Ministry of Mines and Energy. National Energy Balance 2024: Summary Report/Base Year [Internet]. [cited 2025 Jun 16]. Available from: https://www.epe.gov.br/sites-pt/publicacoes-dados-abertos/publicacoes/PublicacoesArquivos/publicacao-819/topico-723/BEN2024.pdf. (In Portuguese). [Google Scholar]
12. Brazil. Ministry of Mines and Energy. Ten-Year Energy Expansion Plan 2034: NT energy and environment [Internet]. [cited 2025 Jun 16]. Available from: https://www.epe.gov.br/pt/publicacoes-dados-abertos/publicacoes/plano-decenal-de-expansao-de-energia-2034. (In Portuguese). [Google Scholar]
13. Rabaia MKH, Ali Abdelkareem M, Sayed ET, Elsaid K, Chae KJ, Wilberforce T, et al. Environmental impacts of solar energy systems: a review. Sci Total Environ. 2021;754(1635):141989. doi:10.1016/j.scitotenv.2020.141989. [Google Scholar] [CrossRef]
14. Muteri V, Cellura M, Curto D, Franzitta V, Longo S, Mistretta M, et al. Review on life cycle assessment of solar photovoltaic panels. Energies. 2020;13(1):252. doi:10.3390/en13010252. [Google Scholar] [CrossRef]
15. Law AM, Jones LO, Walls JM. The performance and durability of Anti-reflection coatings for solar module cover glass—a review. Sol Energy. 2023;261(7):85–95. doi:10.1016/j.solener.2023.06.009. [Google Scholar] [CrossRef]
16. Syafiq A, Balakrishnan V, Ali MS, Dhoble SJ, Rahim NA, Omar A, et al. Application of transparent self-cleaning coating for photovoltaic panel: a review. Curr Opin Chem Eng. 2022;36:100801. doi:10.1016/j.coche.2022.100801. [Google Scholar] [CrossRef]
17. Ammari N, Mehdi M, Alami Merrouni A, Benazzouz A. Experimental analysis of anti-reflective coating performance in desert Climate: yield analysis, soiling impact and cleaning durability evaluation. Sustain Energy Technol Assess. 2023;60(16):103547. doi:10.1016/j.seta.2023.103547. [Google Scholar] [CrossRef]
18. Ben Gouider Trabelsi A, Velu Kaliyannan G, Gunasekaran R, Rathanasamy R, Palaniappan SK, Alkallas FH, et al. Surface engineering of SiO2-ZrO2 films for augmenting power conversion efficiency performance of silicon solar cells. J Mater Res Technol. 2024;28:1475–82. doi:10.1016/j.jmrt.2023.12.119. [Google Scholar] [CrossRef]
19. Tayel SA, Abu El-Maaty AE, Mostafa EM, Elsaadawi YF. Enhance the performance of photovoltaic solar panels by a self-cleaning and hydrophobic nanocoating. Sci Rep. 2022;12(1):21236. doi:10.1038/s41598-022-25667-4. [Google Scholar] [CrossRef]
20. Yang L, Yang J, Yang DQ. A durable superhydrophilic self-cleaning coating based on TiO2–SiO2-PAA nanocomposite for photovoltaic applications: long-term outdoor study. Sol Energy Mater Sol Cells. 2024;268(9):112731. doi:10.1016/j.solmat.2024.112731. [Google Scholar] [CrossRef]
21. Adak D, Bhattacharyya R, Barshilia HC. A state-of-the-art review on the multifunctional self-cleaning nanostructured coatings for PV panels, CSP mirrors and related solar devices. Renew Sustain Energy Rev. 2022;159:112145. doi:10.1016/j.rser.2022.112145. [Google Scholar] [CrossRef]
22. Wu Y, Du J, Liu G, Ma D, Jia F, Klemeš JJ, et al. A review of self-cleaning technology to reduce dust and ice accumulation in photovoltaic power generation using superhydrophobic coating. Renew Energy. 2022;185:1034–61. doi:10.1016/j.renene.2021.12.123. [Google Scholar] [CrossRef]
23. Qin J, Lu H. A review of self-cleaning coatings for solar photovoltaic systems: theory, materials, preparation, and applications. Environ Sci Pollut Res Int. 2023;30(40):91591–616. doi:10.1007/s11356-023-28550-5. [Google Scholar] [CrossRef]
24. Zhao W, Lu H. Self-cleaning performance of super-hydrophilic coatings for dust deposition reduction on solar photovoltaic cells. Coatings. 2021;11(9):1059. doi:10.3390/coatings11091059. [Google Scholar] [CrossRef]
25. Sheikholeslami M, Khalili Z, Salehi F, Momayez L. Simulation of sustainable solar thermal storage system involving photovoltaic panel equipped with nanofluid-based splitter considering self-cleaning coating. Sustain Cities Soc. 2025;119(6):106100. doi:10.1016/j.scs.2024.106100. [Google Scholar] [CrossRef]
26. Hong J, Jiang Y, Zhang M, Zhong H, Yao C, Li J, et al. Enhancement of power generation efficiency through the addition of self-cleaning and transmission-enhancing nanopolymer multifunctional coatings on photovoltaic panels. Colloids Surf A Physicochem Eng Asp. 2025;712(5):136458. doi:10.1016/j.colsurfa.2025.136458. [Google Scholar] [CrossRef]
27. Xiang Q, Liu H, Huang M, Zhang Y. A superhydrophobic composite coating with transparency, long-term durability and self-healing properties for cleaning of photovoltaic systems. Colloids Surf A Physicochem Eng Asp. 2025;716:136666. doi:10.1016/j.colsurfa.2025.136666. [Google Scholar] [CrossRef]
28. Altun-Çiftçioğlu GA, Gökulu O, Kadırgan F, Kadırgan MAN. Life cycle assessment (LCA) of a solar selective surface produced by continuous process and solar flat collectors. Sol Energy. 2016;135:284–90. doi:10.1016/j.solener.2016.05.049. [Google Scholar] [CrossRef]
29. Rosenbaum RK, Hauschild MZ, Boulay AM, Fantke P, Laurent A, Núñez M, et al. Life cycle impact assessment. In: Life cycle assessment. Cham, Switzerland: Springer International Publishing; 2017. p. 167–270. doi:10.1007/978-3-319-56475-3_10. [Google Scholar] [CrossRef]
30. Fonseca LFS, Carvalho M. Greenhouse gas and energy payback times for a wind turbine installed in the Brazilian Northeast. Front Sustain. 2022;3:1060130. doi:10.3389/frsus.2022.1060130. [Google Scholar] [CrossRef]
31. Fonseca LFS, Carvalho M. Environmental payback of a wind turbine unstalled in different locations of the Brazilian Northeast. Rev Multidiscip De Educ E Meio Ambiente. 2021;2(3):91. doi:10.51189/rema/2115. [Google Scholar] [CrossRef]
32. Chen S, Lu X, Nielsen CP, McElroy MB, He G, Zhang S, et al. Deploying solar photovoltaic energy first in carbon-intensive regions brings gigatons more carbon mitigations to 2060. Commun Earth Environ. 2023;4(1):369. doi:10.1038/s43247-023-01006-x. [Google Scholar] [CrossRef]
33. Grant C, Garcia J, Hicks A. Environmental payback periods of multi-crystalline silicon photovoltaics in the United States-How prioritizing based on environmental impact compares to solar intensity. Sustain Energy Technol Assess. 2020;39(1):100723. doi:10.1016/j.seta.2020.100723. [Google Scholar] [CrossRef]
34. Xie M, Ruan J, Bai W, Qiao Q, Bai L, Zhang J, et al. Pollutant payback time and environmental impact of Chinese multi-crystalline photovoltaic production based on life cycle assessment. J Clean Prod. 2018;184:648–59. doi:10.1016/j.jclepro.2018.02.290. [Google Scholar] [CrossRef]
35. McManus MC, Taylor CM. Greenhouse gas balances of bioenergy systems: the role of life cycle assessment. In: Greenhouse gases balances of bioenergy systems. Amsterdam, The Netherlands: Elsevier; 2018. p. 29–41. doi:10.1016/b978-0-08-101036-5.00003-3. [Google Scholar] [CrossRef]
36. ISO 14040:2006. Environmental management—life cycle assessment—principles and framework. Genevan, Swizerland: International Organization for Standardization; 2006 [cited 2025 May 1]. Available from: https://www.iso.org/standard/37456.html. [Google Scholar]
37. ISO 14044:200. Environmental management—life cycle assessment—requirements and guidelines. Genevan, Swizerland: International Organization for Standardization; 2006 [cited 2025 May 1]. Available from: https://www.iso.org/standard/38498.html. [Google Scholar]
38. NBR ISO 14040. Environmental management—life cycle assessment—principles and structure. Rio de Janeiro, Brazil: Brazilian Association of Technical Standards; 2014. (In Portuguese). [Google Scholar]
39. NBR ISO 14044. Environmental management—life cycle assessment—requirements and guidelines. Rio de Janeiro, Brazil: Brazilian Association of Technical Standards; 2014. (In Portuguese). [Google Scholar]
40. Pré Sustainability. Simapro software [Internet]. 2024 [cited 2025 Jun 16]. Available from: https://pre-sustainability.com/solutions/tools/simapro/. [Google Scholar]
41. Ecoinvent. Ecoinvent database [Internet]. [cited 2025 Jun 16]. Available from: https://ecoinvent.org/the-ecoinvent-database/#!/releases. [Google Scholar]
42. Intergovernmental Panel on Climate Change. Climate change 2021: the physical science basis [Internet]. 2021 [cited 2025 Jun 16]. Available from: https://www.ipcc.ch/assessment-report/ar6/. [Google Scholar]
43. Schultz HS, Carvalho M. Design, greenhouse emissions, and environmental payback of a photovoltaic solar energy system. Energies. 2022;15(16):6098. doi:10.3390/en15166098. [Google Scholar] [CrossRef]
44. Notton G, Cristofari C, Mattei M, Poggi P. Modelling of a double-glass photovoltaic module using finite differences. Appl Therm Eng. 2005;25(17–18):2854–77. doi:10.1016/j.applthermaleng.2005.02.008. [Google Scholar] [CrossRef]
45. Medeiros SEL, Nilo PF, Silva LP, Santos CAC, Carvalho M, Abrahão R. Influence of climatic variability on the electricity generation potential by renewable sources in the Brazilian semi-arid region. J Arid Environ. 2021;184(2):104331. doi:10.1016/j.jaridenv.2020.104331. [Google Scholar] [CrossRef]
46. Evans DL. Simplified method for predicting photovoltaic array output. Sol Energy. 1981;27(6):555–60. doi:10.1016/0038-092X(81)90051-7. [Google Scholar] [CrossRef]
47. Nolay P. Developpement d’une methode generale d’analyse des systemes photovoltaiques (development of a general method of analysis of photovoltaic systems) [master’s thesis]. Paris, France: ENMP; 1987. [Google Scholar]
48. Althoff TD, Menezes RSC, de Siqueira Pinto A, Pareyn FGC, de Carvalho AL, Martins JCR, et al. Adaptation of the century model to simulate C and N dynamics of Caatinga dry forest before and after deforestation. Agric Ecosyst Environ. 2018;254:26–34. doi:10.1016/j.agee.2017.11.016. [Google Scholar] [CrossRef]
49. de Souza Grilo MM, Fortes AFC, de Souza RPG, Silva JAM, Carvalho M. Carbon footprints for the supply of electricity to a heat pump: solar energy vs. electric Grid. J Renew Sustain Energy. 2018;10(2):023701. doi:10.1063/1.4997306. [Google Scholar] [CrossRef]
50. Medeiros SEL, Abrahão R, da Silva LP, de Medeiros Silva WK. Comparison between observed and estimated data to assess air temperature variability and trends in the Sertão Paraibano mesoregion. Environ Monit Assess. 2019;191(2):63. doi:10.1007/s10661-019-7207-8. [Google Scholar] [CrossRef]
51. Wanderley LSDA, Nobrega RS, Moreira AB, Menezes RSC. The relationship between relief and climate as proposition of characterization of landscape physiology in Pernambuco, Brazil. Geo UERJ. 2019;34(34):1–24. doi:10.12957/geouerj.2019.40942. [Google Scholar] [CrossRef]
52. Araújo NMFTS, Medeiros SEL, Abrahão R. Variability and sensitivity of models used to estimate photovoltaic production. Energies. 2024;17(16):4177. doi:10.3390/en17164177. [Google Scholar] [CrossRef]
53. INMET—brazilian National Institute of Meteorology. INMET Meteorological Database [Internet]. 2023 [cited 2025 Jun 16]. Available from: https://bdmep.inmet.gov.br/. [Google Scholar]
54. United States of America. National Aeronautics and Space Administration. POWER Data Access Viewer [Inter-Net] 2023 [cited 2025 Jun 16]. Available from: https://power.larc.nasa.gov/data-access-viewer/. [Google Scholar]
55. CanadianSolar. Downloads: Module. 2023 [cited 2025 Jun 16]. Available from: https://www.csisolar.com/downloads/. [Google Scholar]
56. Carvalho M, Delgado D. Potential of photovoltaic solar energy to reduce the carbon footprint of the Brazilian electricity matrix. LALCA Rev Lat Am Em Avaliação Do Ciclo De Vida. 2017;1(1):64–85. doi:10.18225/lalca.v1i1.3779. [Google Scholar] [CrossRef]
57. Laopreecha P, Varabuntoonvit V, Kumnorkaew P, Muangnapoh T, Sodsai T. Life cycle assessment of nano-silica coating for solar photovoltaic panel. Asia Pac J Sci Technol. 2022;27(2):11. doi:10.14456/apst.2022.38. [Google Scholar] [CrossRef]
58. Lamnatou C, Guignard N, Chemisana D, Cristofari C, Debusschere V. Photovoltaic power plants with hydraulic storage: life-cycle assessment focusing on energy payback time and greenhouse-gas emissions—a case study in Spain. Sustain Energy Technol Assess. 2023;60(10):103468. doi:10.1016/j.seta.2023.103468. [Google Scholar] [CrossRef]
59. Gaiddon B, Jedliczka M. Compared assessment of selected environmental indicators of photovoltaic electricity in OECD cities. International Energy Agency, Photovoltaic Power Systems Programme (IEA PVPS Task 10, Activity 4.4). Angers, France: French Agency for Environment and Energy Management (ADEME); 2006. 51 p. Report IEA-PVPS T10-01. [cited 2025 Jun 16]. Available from: https://iea-pvps.org/wp-content/uploads/2020/01/rep10_01.pdf. [Google Scholar]
60. de Araújo Santos PR, Medeiros SEL, da Silva LP, Abrahão R. Projeções de radiação solar incidente à superfície e nebulosidade Para a região nordeste do Brasil através de um conjunto de modelos climáticos. Rev Bras Meteorol. 2024;39(6):e39240036. doi:10.1590/0102-77863910036. [Google Scholar] [CrossRef]
61. Ferreira MM, Santos JA, da Silva LR, Abrahao R, da Silva Vitorino Gomes F, Braz HDM. A new index to evaluate renewable energy potential: a case study on solar, wind and hybrid generation in Northeast Brazil. Renew Energy. 2023;217(4):119182. doi:10.1016/j.renene.2023.119182. [Google Scholar] [CrossRef]
62. Montealegre AL, García-Pérez S, Guillén-Lambea S, Monzón-Chavarrías M, Sierra-Pérez J. GIS-based assessment for the potential of implementation of food-energy-water systems on building rooftops at the urban level. Sci Total Environ. 2022;803:149963. doi:10.1016/j.scitotenv.2021.149963. [Google Scholar] [CrossRef]
63. Khodakaram-Tafti A, Yaghoubi M. Experimental study on the effect of dust deposition on photovoltaic performance at various tilts in semi-arid environment. Sustain Energy Technol Assess. 2020;42:100822. doi:10.1016/j.seta.2020.100822. [Google Scholar] [CrossRef]
64. Güngör O, Kahveci H, Gökçe HS. The effect of various industrial dust particles on the performance of photovoltaic panels in Turkey. Environ Sci Pollut Res Int. 2023;30(6):15128–44. doi:10.1007/s11356-022-23216-0. [Google Scholar] [CrossRef]
65. Darwish ZA, Kazem HA, Sopian K, Al-Goul MA, Alawadhi H. Effect of dust pollutant type on photovoltaic performance. Renew Sustain Energy Rev. 2015;41(4):735–44. doi:10.1016/j.rser.2014.08.068. [Google Scholar] [CrossRef]
66. Cui Y, Liu M, Li W, Lian J, Yao Y, Gao X, et al. An exploratory framework to identify dust on photovoltaic panels in offshore floating solar power stations. Energy. 2024;307:132559. doi:10.1016/j.energy.2024.132559. [Google Scholar] [CrossRef]
67. Del Pero C, Aste N, Leonforte F. The effect of rain on photovoltaic systems. Renew Energy. 2021;179(5):1803–14. doi:10.1016/j.renene.2021.07.130. [Google Scholar] [CrossRef]
68. ABSolar. Solar energy reaches 50 GW of installed capacity in Brazil [Internet]. 2024 [cited 2025 Apr 30]. Available from: https://www.absolar.org.br/noticia/https-www-portalsolar-com-br-noticias-mercado-energia-solar-atinge-50-gw-de-capacidade-instalada-no-brasil/. (In Portuguese). [Google Scholar]
69. Brasil. Brazil presents its new climate target aligned with Mission 1.5°C [Internet]. 2024 [cited 2025 Jun 16]. Available from: https://www.gov.br/planalto/en/latest-news/2024/11/brazil-presents-its-new-climate-target-aligned-with-mission-1.5oc#:. [Google Scholar]
70. Hossain MI, Ali A, Bermudez Benito V, Figgis B, Aïssa B. Anti-soiling coatings for enhancement of PV panel performance in desert environment: a critical review and market overview. Materials. 2022;15(20):7139. doi:10.3390/ma15207139. [Google Scholar] [CrossRef]
71. Al-Badra MZ, Abd-Elhady MS, Kandil HA. A novel technique for cleaning PV panels using antistatic coating with a mechanical vibrator. Energy Rep. 2020;6(3):1633–7. doi:10.1016/j.egyr.2020.06.020. [Google Scholar] [CrossRef]
72. IRENA. Renewable energy and jobs—annual Review 2022. International renewable energy agency [Internet]. 2022 [cited 2025 Jun 16]. Available from: https://www.irena.org/publications/2022/Sep/Renewable-Energy-and-Jobs-Annual-Review-2022. [Google Scholar]
Cite This Article
 Copyright © 2025 The Author(s). Published by Tech Science Press.
This work is licensed under a Creative Commons Attribution 4.0 International License , which permits unrestricted use, distribution, and reproduction in any medium, provided the original work is properly cited.
 Downloads
 Citation Tools