
 Submit a Paper
 Propose a Special lssue
 Open Access
ARTICLE

Optimization of Operating Parameters for Underground Gas Storage Based on Genetic Algorithm
1 Chongqing Gas District, PetroChina Southwest Oil & Gasfield Company, Chongqing, 400021, China
2 School of Petroleum Engineering, Chongqing University of Science and Technology, Chongqing, 401331, China
3 School of Electronic and Electrical Engineering, Nanyang Technological University, Singapore, 639798, Singapore
* Corresponding Author: Shilai Hu. Email:
(This article belongs to the Special Issue: Integrated Geology-Engineering Simulation and Optimizationfor Unconventional Oil and Gas Reservoirs)
Energy Engineering 2025, 122(8), 3201-3221. https://doi.org/10.32604/ee.2025.066507
Received 10 April 2025; Accepted 30 May 2025; Issue published 24 July 2025
 View Full Text
 Download PDF
Abstract
This work proposes an optimization method for gas storage operation parameters under multi-factor coupled constraints to improve the peak-shaving capacity of gas storage reservoirs while ensuring operational safety. Previous research primarily focused on integrating reservoir, wellbore, and surface facility constraints, often resulting in broad constraint ranges and slow model convergence. To solve this problem, the present study introduces additional constraints on maximum withdrawal rates by combining binomial deliverability equations with material balance equations for closed gas reservoirs, while considering extreme peak-shaving demands. This approach effectively narrows the constraint range. Subsequently, a collaborative optimization model with maximum gas production as the objective function is established, and the model employs a joint solution strategy combining genetic algorithms and numerical simulation techniques. Finally, this methodology was applied to optimize operational parameters for Gas Storage T. The results demonstrate: (1) The convergence of the model was achieved after 6 iterations, which significantly improved the convergence speed of the model; (2) The maximum working gas volume reached 11.605 × 10⁸ m3, which increased by 13.78% compared with the traditional optimization method; (3) This method greatly improves the operation safety and the ultimate peak load balancing capability. The research provides important technical support for the intelligent decision of injection and production parameters of gas storage and improving peak load balancing ability.Keywords
Under the backdrop of accelerated low-carbon transformation in the global energy structure, natural gas has increasingly demonstrated its strategic significance as a clean and efficient transitional energy source within the energy supply system [1,2]. However, China’s rapid economic development has driven a continuously surging natural gas demand, resulting in a pronounced contradiction between supply and demand [3–5]. Underground gas storage, characterized by large storage capacity, broad peak-shaving capabilities, low operational costs, safety, and reliability, has emerged as the most effective solution to balance this supply-demand imbalance [6–9]. Gas storage operation is a systematic project, and how to improve work efficiency, operation safety, and reduce energy consumption has become the focus in gas storage research [10–12]. Consequently, it is of great engineering value to establish a set of reliable optimal operation methods for gas storage.
Traditional gas storage optimization primarily relies on the step-by-step control and adjustment of a single factor to improve operational efficiency to a certain extent. This approach is widely adopted in practical applications due to its intuitive computation process, ease of implementation, and convenience for engineers. However, since it focuses only on optimizing a single variable, it fails to fully account for the complex coupling relationships and interactions between various factors in gas storage operations, often resulting in suboptimal solutions rather than truly global optimization. Particularly when gas storage facilities face numerous constraints, single-factor adjustments may lead to locally optimal solutions rather than an overall optimal operational strategy, ultimately affecting both economic performance and operational safety. To further enhance the efficiency and effectiveness of gas storage operations, developing a more scientific and rational multi-factor collaborative optimization method has become a key area of interest.
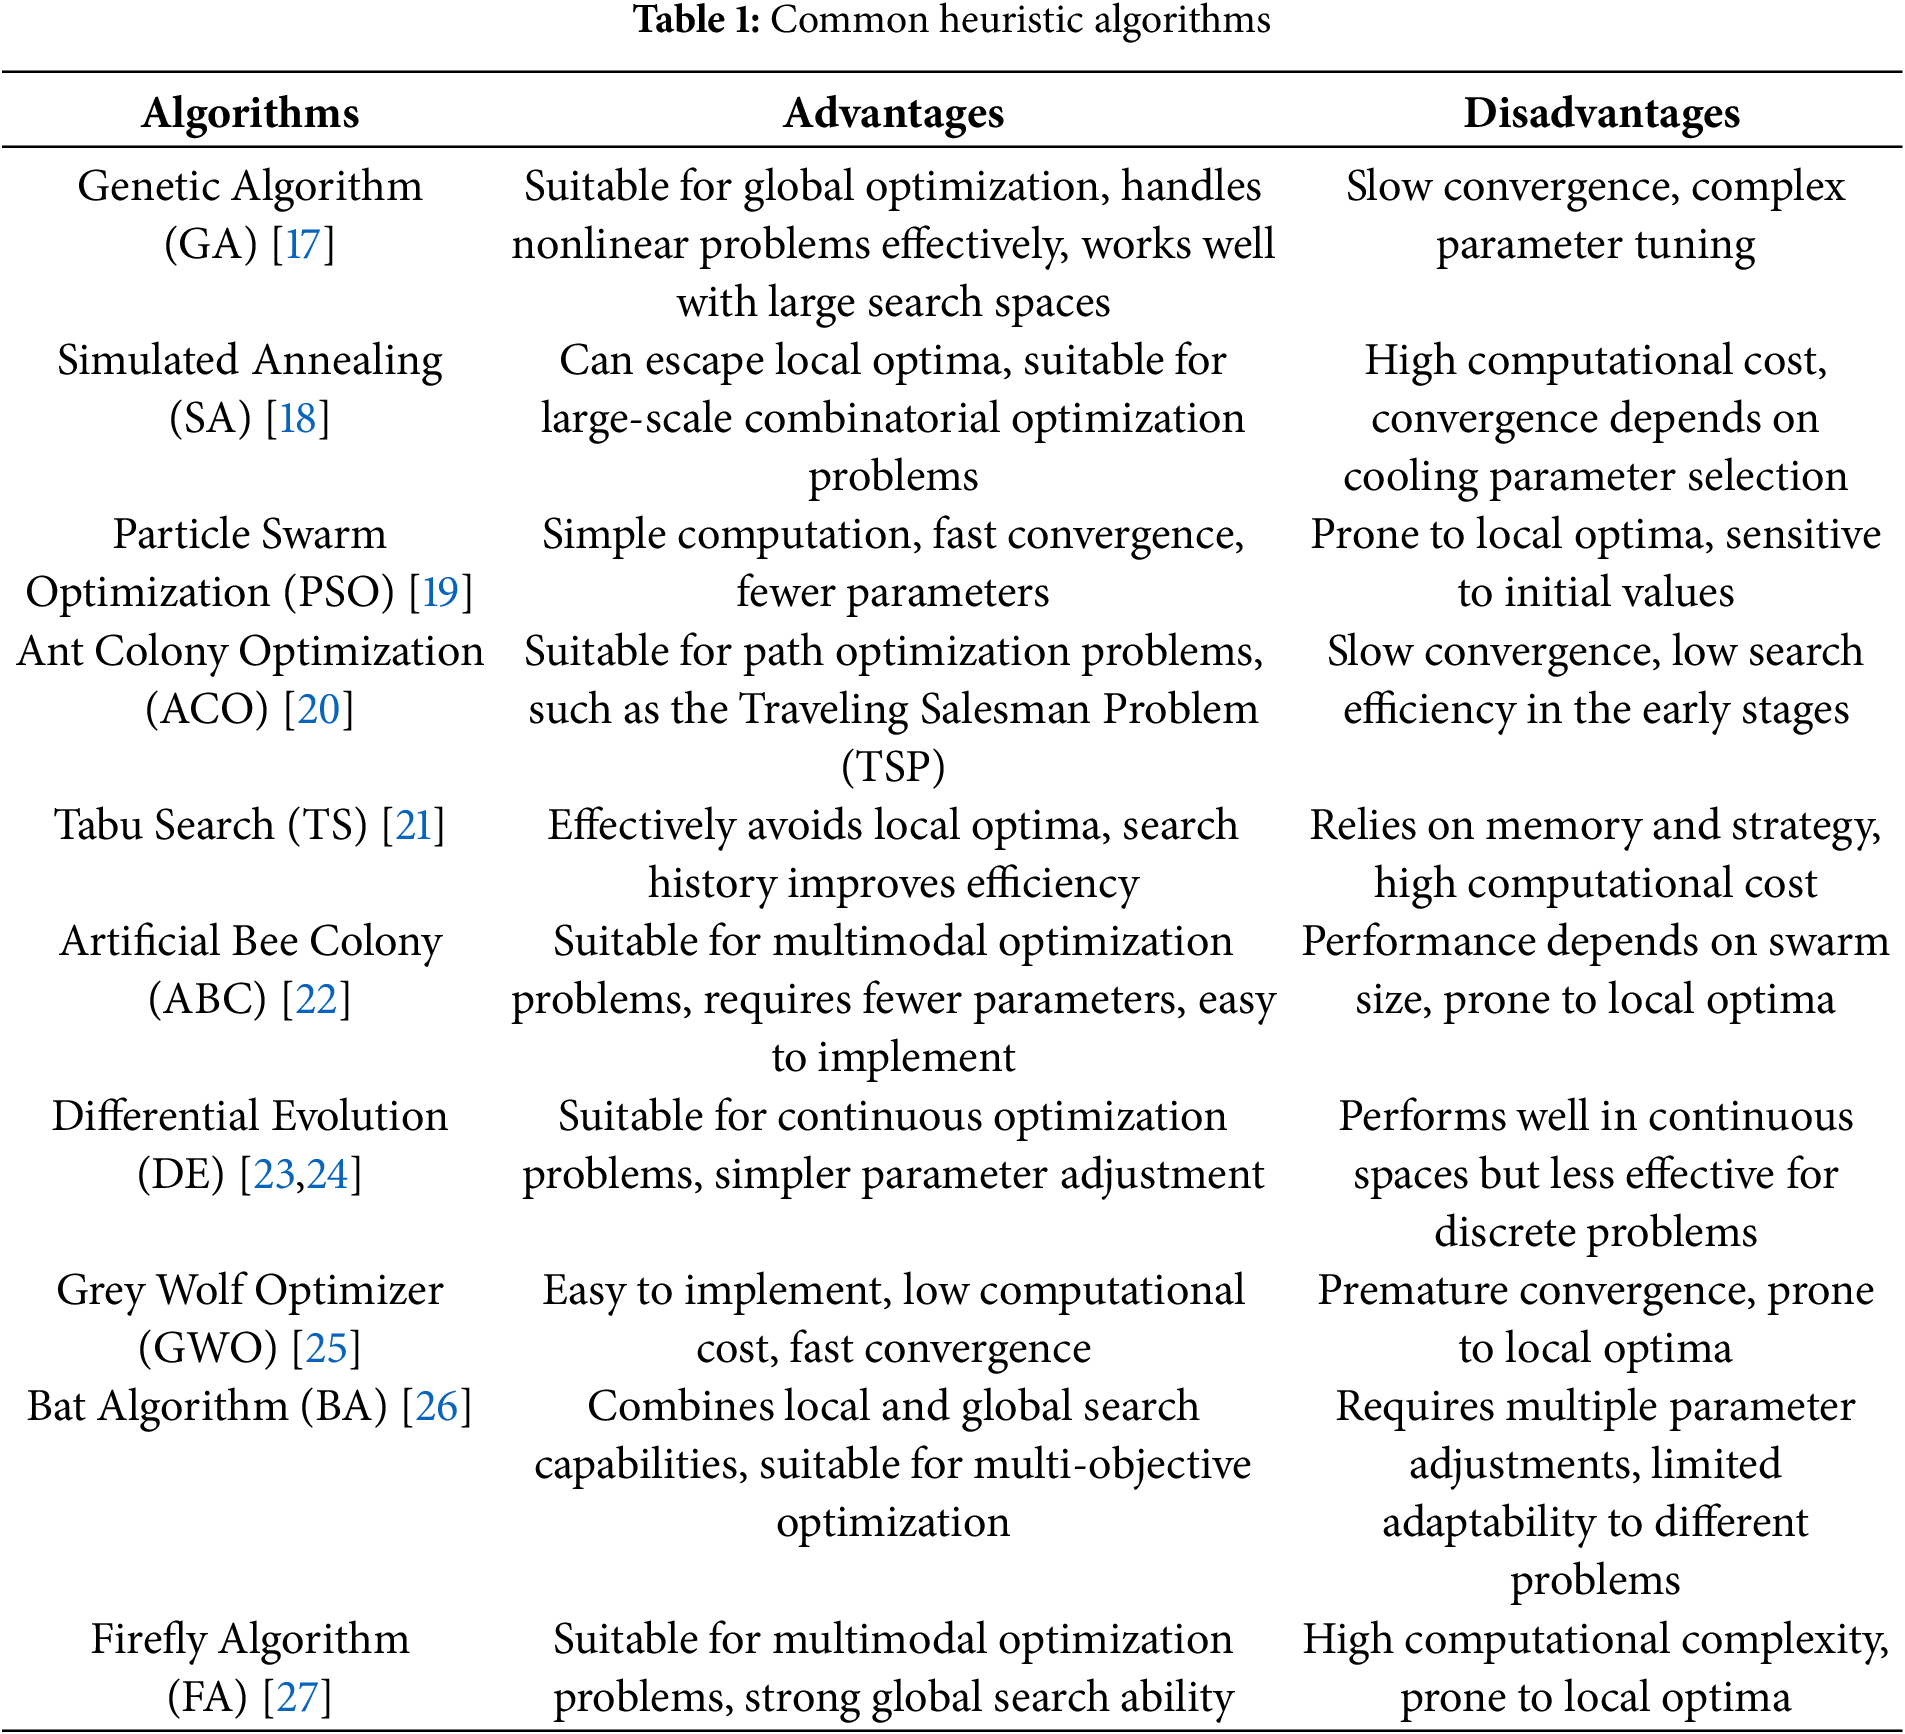
In recent years, with the rapid advancement of computer science and artificial intelligence technology, heuristic algorithms have emerged as innovative solutions for complex nonlinear constrained optimization problems [13]. These algorithms often draw inspiration from natural phenomena and intelligent behaviors observed in biological populations, such as genetic evolution, ant colony foraging, particle swarm optimization, and simulated annealing (Table 1), effectively applying nature’s wisdom to mathematical optimization problems. The core idea is to simulate the intelligent behaviors exhibited by biological systems during evolution, learning, or environmental adaptation, enabling efficient exploration of optimal solutions within complex search spaces. As a result, many researchers have adopted such algorithms to develop multi-factor coordinated optimization methods for gas storage by incorporating the influence of multiple factors. Zhu [7] developed a multi-objective optimization function for gas storage by incorporating the NSGA-II (Non-dominated Sorting Genetic Algorithm II). Liu et al. [14] similarly employed the non-dominated sorting genetic algorithm, utilizing well injection rates as variables and establishing a bi-level objective function based on pipeline hierarchy to optimize gas injection efficiency. Aiming at the pressure equalization problem of multi-block gas storage, Zhou et al. [8] established a full-field cooperative regulation model with the goal of minimizing formation pressure variance based on GAMS platform and integrating DICOPT solver. Xu et al. [15] investigated optimization of injection-production parameters using mixed-integer nonlinear programming models. Nevertheless, two critical limitations persist: First, algorithmic convergence rates remain significantly constrained by high-dimensional nonlinear constraints, with mainstream intelligent algorithms (e.g., PSO, GA) requiring over 100 iterations on average [7,16]. Second, current constraint systems fail to systematically integrate critical engineering boundaries such as operational safety thresholds and extreme peak-shaving requirements.
To solve these problems, this work is based on the practical engineering needs of gas storage operation. First, considering factors such as geological characteristics, compressor performance, and extreme peak-shaving capacity, a multi-factor collaborative optimization model is constructed with the maximum gas production rate as the objective function. Then, by introducing the Genetic Algorithm (GA) and numerical simulation techniques, the model’s solving efficiency and global optimization capability are enhanced. Finally, the model is applied to the T gas storage facility to obtain the optimal operating parameter combination, providing scientific guidance and technical support for the safe and efficient gas storage operation.
While ensuring reservoir stability, the optimization aims to maximize gas withdrawal capacity to fully leverage the storage facility’s peak-shaving capability.
where,
During the gas injection phase of underground gas storage, an excessively high injection rate can compromise geological integrity, disrupt the pressure field equilibrium in the reservoir, and affect caprock sealing. Additionally, it increases the operational costs of compressors and pipelines. Conversely, an excessively low injection rate results in low operational efficiency, preventing the gas storage facility from fully utilizing its peak-shaving capability. Therefore, without considering cushion gas, the injection rate must not only meet the storage capacity requirements, but also remain below the maximum injection capacity of a single well and the working gas volume of the compressor, as expressed by:
where,
The gas production rate also affects the operational safety and efficiency of underground gas storage. A high production rate can cause a sharp increase in reservoir pressure gradient, leading to excessive effective stress, which directly impacts subsequent gas injection capacity. Additionally, it may result in the failure of seasonal peak shaving. On the other hand, an excessively low production rate fails to meet daily peak shaving demands, leading to significant resource waste. Therefore, studies have shown that setting the single-well production rate within 40% to 60% of the absolute open flow under the original formation pressure is a more reasonable approach, as expressed by:
However, constraining the gas production rate solely based on absolute open flow results in a relatively broad range and does not guarantee that the gas storage will meet extreme peak shaving demands. This is often a key factor contributing to the slow convergence of the optimization model. Therefore, to address this issue, the binomial productivity equation and the material balance equation for a closed gas reservoir are introduced to further refine the constraints on gas production rate, ensuring alignment with the extreme peak shaving requirements:
where,
Eq. (5) can be derived as follows:
where,
The upper pressure limit of an underground gas storage determines its storage capacity. Theoretically, a higher upper pressure results in a larger storage capacity. However, in practical engineering applications, operational safety must always be the top priority. The operation safety of gas storage primarily depends on the reservoir’s geological conditions and wellbore integrity, including caprock sealing capacity, fault stability, and wellbore integrity. Therefore, in order to ensure the operation safe of gas storage, the maximum upper pressure must not exceed the ultimate pressure tolerance of the caprock, faults, and wellbore.
When the upper limit pressure is determined, the lower pressure limit becomes the key factor in determining the working gas volume of the gas storage. Theoretically, the lower the pressure limit, the greater the working gas volume the gas storage can provide. However, in practical operations, the lower pressure limit is primarily constrained by surface transmission pressure and must be set higher than the reservoir pressure corresponding to the minimum wellhead pressure.
2.2.5 Number of Operating Wells
During gas storage operation, the number of wells must be greater than the minimum required for gas storage capacity and less than the total number of operational wells.
Genetic Algorithm (GA) is an optimization algorithm based on natural selection and genetic mechanisms. It is one of the most commonly used optimization algorithms today. Compared to other optimization algorithms, GA employs a population-based search approach, enabling effective exploration of the entire search space and avoiding local optima, thus exhibiting strong global search capability [28–30]. The fundamental principle of GA is to optimize problem solutions by simulating natural selection, crossover (mating), and mutation in biological evolution [31]. Its core principles are as follows:
Population Initialization: Many potential solutions are randomly generated to form a population, where each potential solution is referred to as an individual.
Fitness Evaluation: Each individual is evaluated using a fitness function to measure its quality. This score reflects the individual’s ability to solve the problem, representing its “fitness”.
Selection: Based on the fitness function results, individuals with higher fitness are selected for reproduction. Individuals with better fitness have a greater chance of being chosen to participate in the next generation. Common selection methods include roulette wheel selection, rank selection, and elitist selection.
Crossover: Selected individuals undergo crossover operations, where they are paired and exchange part of their genetic information to produce new offspring (Fig. 1). This process mimics biological reproduction and helps combine advantageous traits from different individuals. Common crossover methods include single-point crossover, multi-point crossover, and uniform crossover.
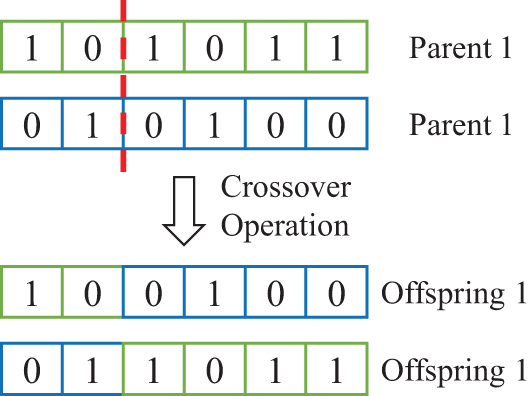
Figure 1: Cross operation
Mutation: With a small probability, certain genes of individuals are randomly altered (Fig. 2) to introduce new genetic diversity and prevent premature convergence to local optima. Mutation techniques mainly include basic mutation and adaptive mutation.
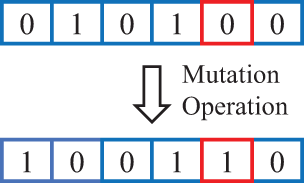
Figure 2: Mutation operation
When solving the gas storage operation parameter optimization model in this study, the objective function value cannot be directly obtained. Therefore, numerical simulation technology is introduced into the GA-based solution process. By setting the maximum gas withdrawal capacity as the objective, the optimal operating parameters that satisfy the constraints are gradually determined (Fig. 3).
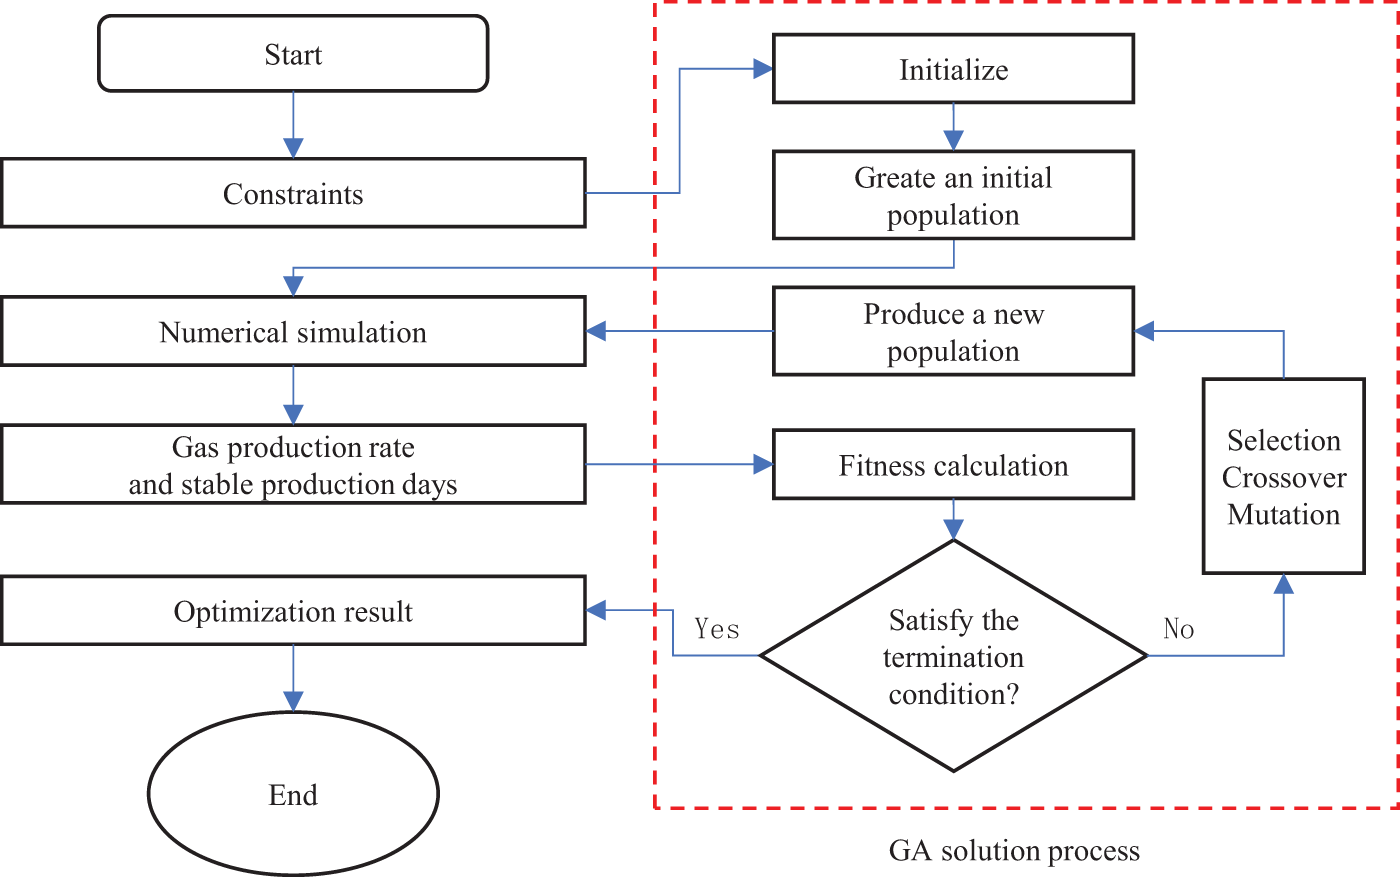
Figure 3: Calculation process of running parameter for gas storage
The specific steps are as follows:
(1) Parameter Initialization: Set GA-related parameters such as the maximum number of iterations, population size, mutation probability, and crossover probability.
(2) Population Initialization: Randomly generate a specified number of operational parameter combinations based on the constraint conditions.
(3) Numerical Simulation: Use numerical simulation techniques to evaluate the operational performance of each parameter set.
(4) Fitness Calculation: The total gas production of each parameter is calculated based on the numerical simulation results.
(5) Termination Condition Check: If the iteration count exceeds the set limit, the process terminates, and the optimal operational parameter combination is output. Otherwise, proceed to step 6.
(6) Population Update: Under the existing population and constraint conditions, a new population is generated through selection, crossover, and mutation operations. Then, return to step 3.
4.1 Basic Information of Gas Storage Reservoir
The T gas storage was converted from a depleted oil and gas reservoir. The formation lithology consists of dark gray and brownish-gray limestone, bioclastic limestone interbedded with argillaceous limestone, and siliceous layers. The drilled thickness ranges from 94 to 115 m, with minimal variation, making it relatively stable.
The primary caprock is marlstone, which is also stable in its lateral distribution. The reservoir space is mainly composed of fractures, followed by dissolution caves and vugs, with minimal other pore spaces, forming a typical cavern-fracture-type reservoir. The average permeability of the reservoir is 4.11 mD, and the average porosity is 2.7%. The planar distribution trend of the average porosity of the reservoir is shown in Fig. 4. Its sealing integrity is influenced by fault structures and the overlying caprock conditions, The direct caprock is mainly marl, which is distributed statically on the plane, with a total thickness of 100~200 m.
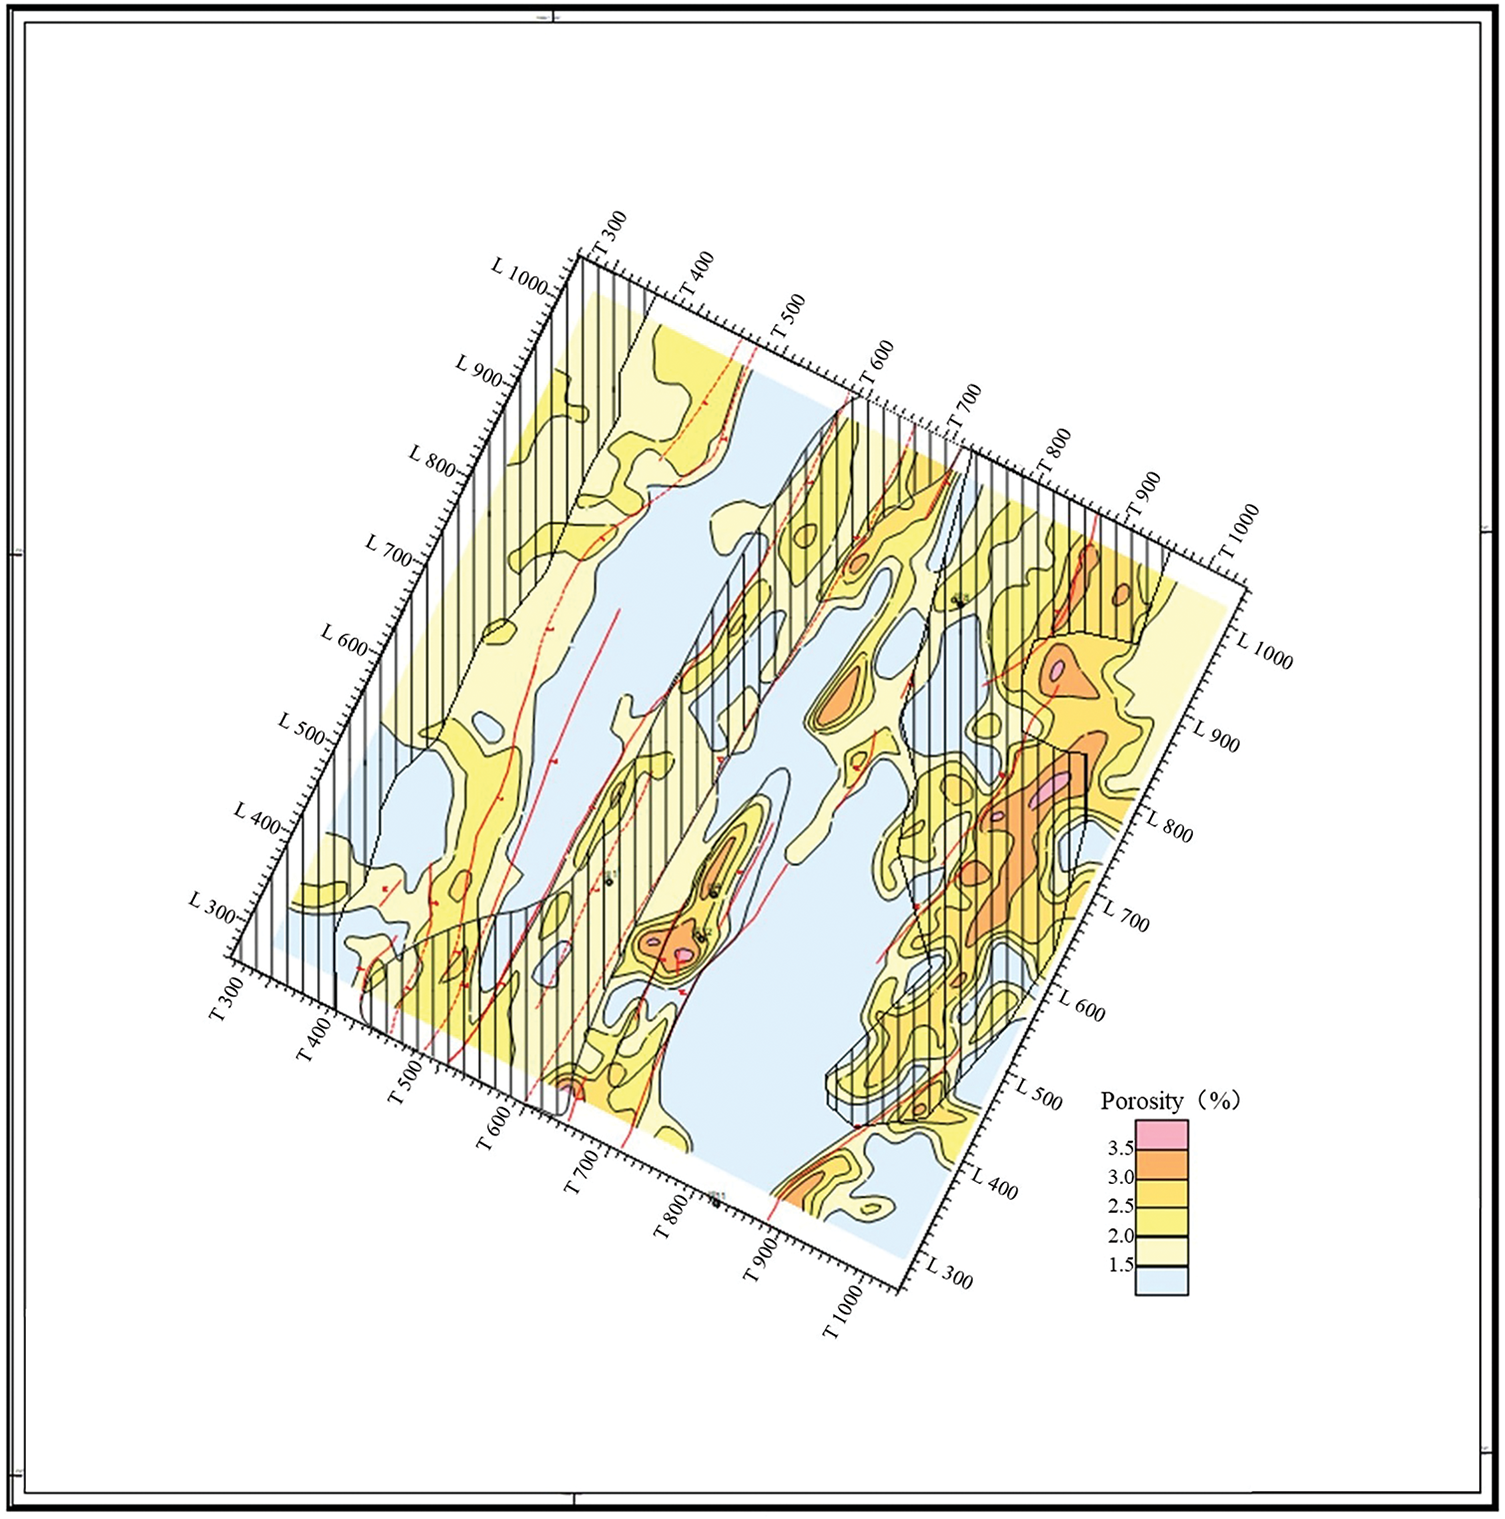
Figure 4: Prediction map of the mean porosity of reservoir
During gas injection, the T gas storage is designed to use compressors for pressure boosting, while gas withdrawal relies on the elastic energy of the formation pressure. The maximum injection capacity is required to be 1.3 times the average daily injection rate, while the maximum withdrawal capacity must reach 1.8 times the average daily withdrawal rate. The gas injection period lasts 200 days, the withdrawal period is 120 days, and the balancing period is 45 days. Additionally, the peak shaving capacity must ensure at least seven days of stable production.
Based on the planned working gas volume and injection days for T gas storage, the minimum injection rate is calculated to be 6.084 × 10⁶ m3/d. The facility is designed to operate with a maximum of three compressors, each with a working capacity of 5.0 × 10⁶ m3/d. Therefore, the maximum injection rate is determined to be 15.0 × 10⁶ m3/d, while the average daily injection rate is 11.54 × 10⁶ m3/d.
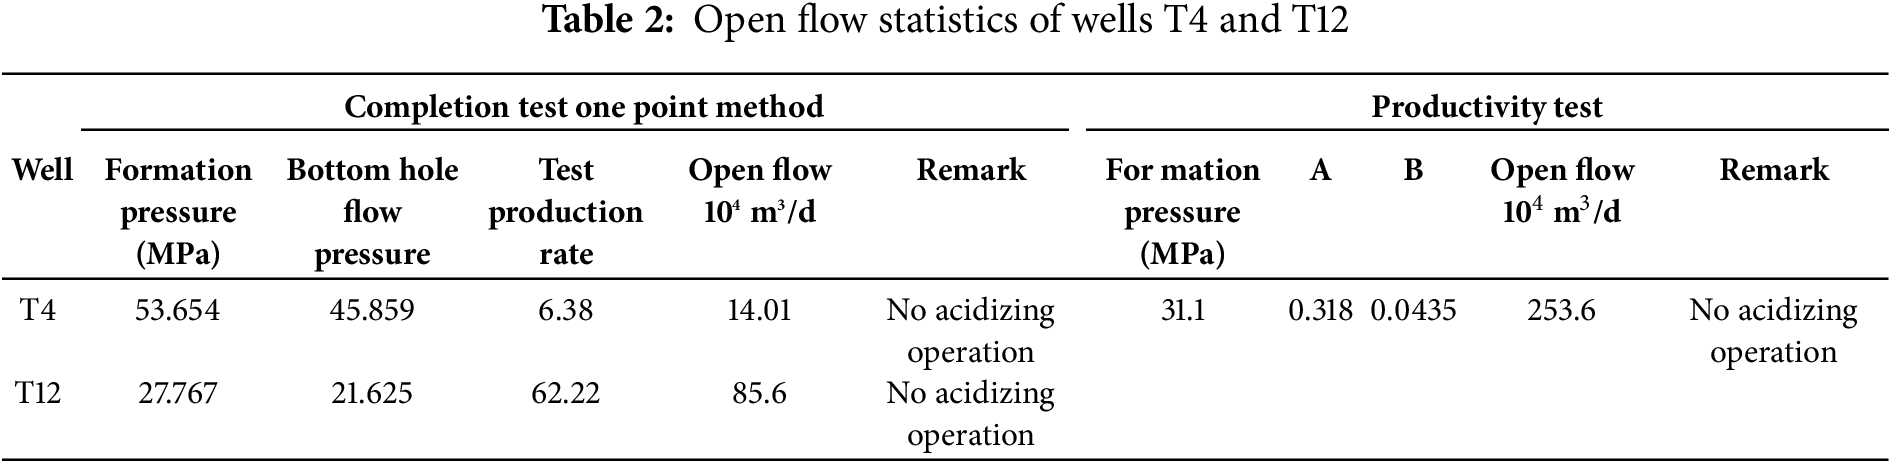
In the initial phase, productivity tests were conducted on wells T4 and T12 of the gas reservoir. The test results showed that the absolute open flow of T4 well was 14.01 × 10⁴ m3/d, while that of T12 well reached 85.9 × 10⁴ m3/d. However, due to the short test duration of T12 well, its results could not accurately reflect the productivity characteristics of the reservoir under actual conditions.
Later, to further evaluate the productivity of the gas storage, T4 well underwent an unblocking acidizing treatment, followed by another productivity test. The new test results showed an AOF of 145.5 × 10⁴ m3/d at a formation pressure of 31.097 MPa. Based on this data, calculations determined that the theoretical absolute open flow of T4 well under the original formation pressure was 253.6 × 10⁴ m3/d (Table 2). Therefore, using the absolute open flow of T4 well under original formation pressure as a reference, the single-well gas production rate for the T gas storage was set within the range of 101.44 × 10⁴ m3/d to 152.16 × 10⁴ m3/d.
Through in-situ stress testing, the fracture pressure of the T gas storage was determined to be 58 MPa, with a fracture initiation pressure of 42 MPa and a fracture closure pressure of 40.5 MPa. Additionally, scanning electron microscopy (SEM) was conducted on the direct caprock of the Fei-1 section, along with pore size experiments and thin-section observations. The microscopic analysis revealed that the rock is dense, with a relatively high clay mineral content in the upper layers. The Fei-1 section primarily exhibits micropores and microfractures, but the connectivity between different types of pores is poor. To prevent the reopening of pre-existing microfractures in the Fei-1 section during gas injection, the fracture initiation pressure of 42 MPa was chosen as the upper pressure limit of the gas storage facility.
Furthermore, to determine the minimum upper pressure limit, different well counts and pressure ranges were considered. For a given gas withdrawal cycle, the working pressure range required to reach the planned working gas volume (7.3 × 10⁸ m3) was calculated. The results indicated that, with 10 injection/withdrawal wells, an upper pressure of 32 MPa was sufficient to reach the planned working gas volume. With 6 injection/withdrawal wells, an operating range of 37 MPa was required to meet the planned gas volume. With 4 injection/withdrawal wells, an upper pressure exceeding 40 MPa was needed to approach the target gas volume (Fig. 5). Thus, 32 MPa was selected as the minimum design upper pressure limit.
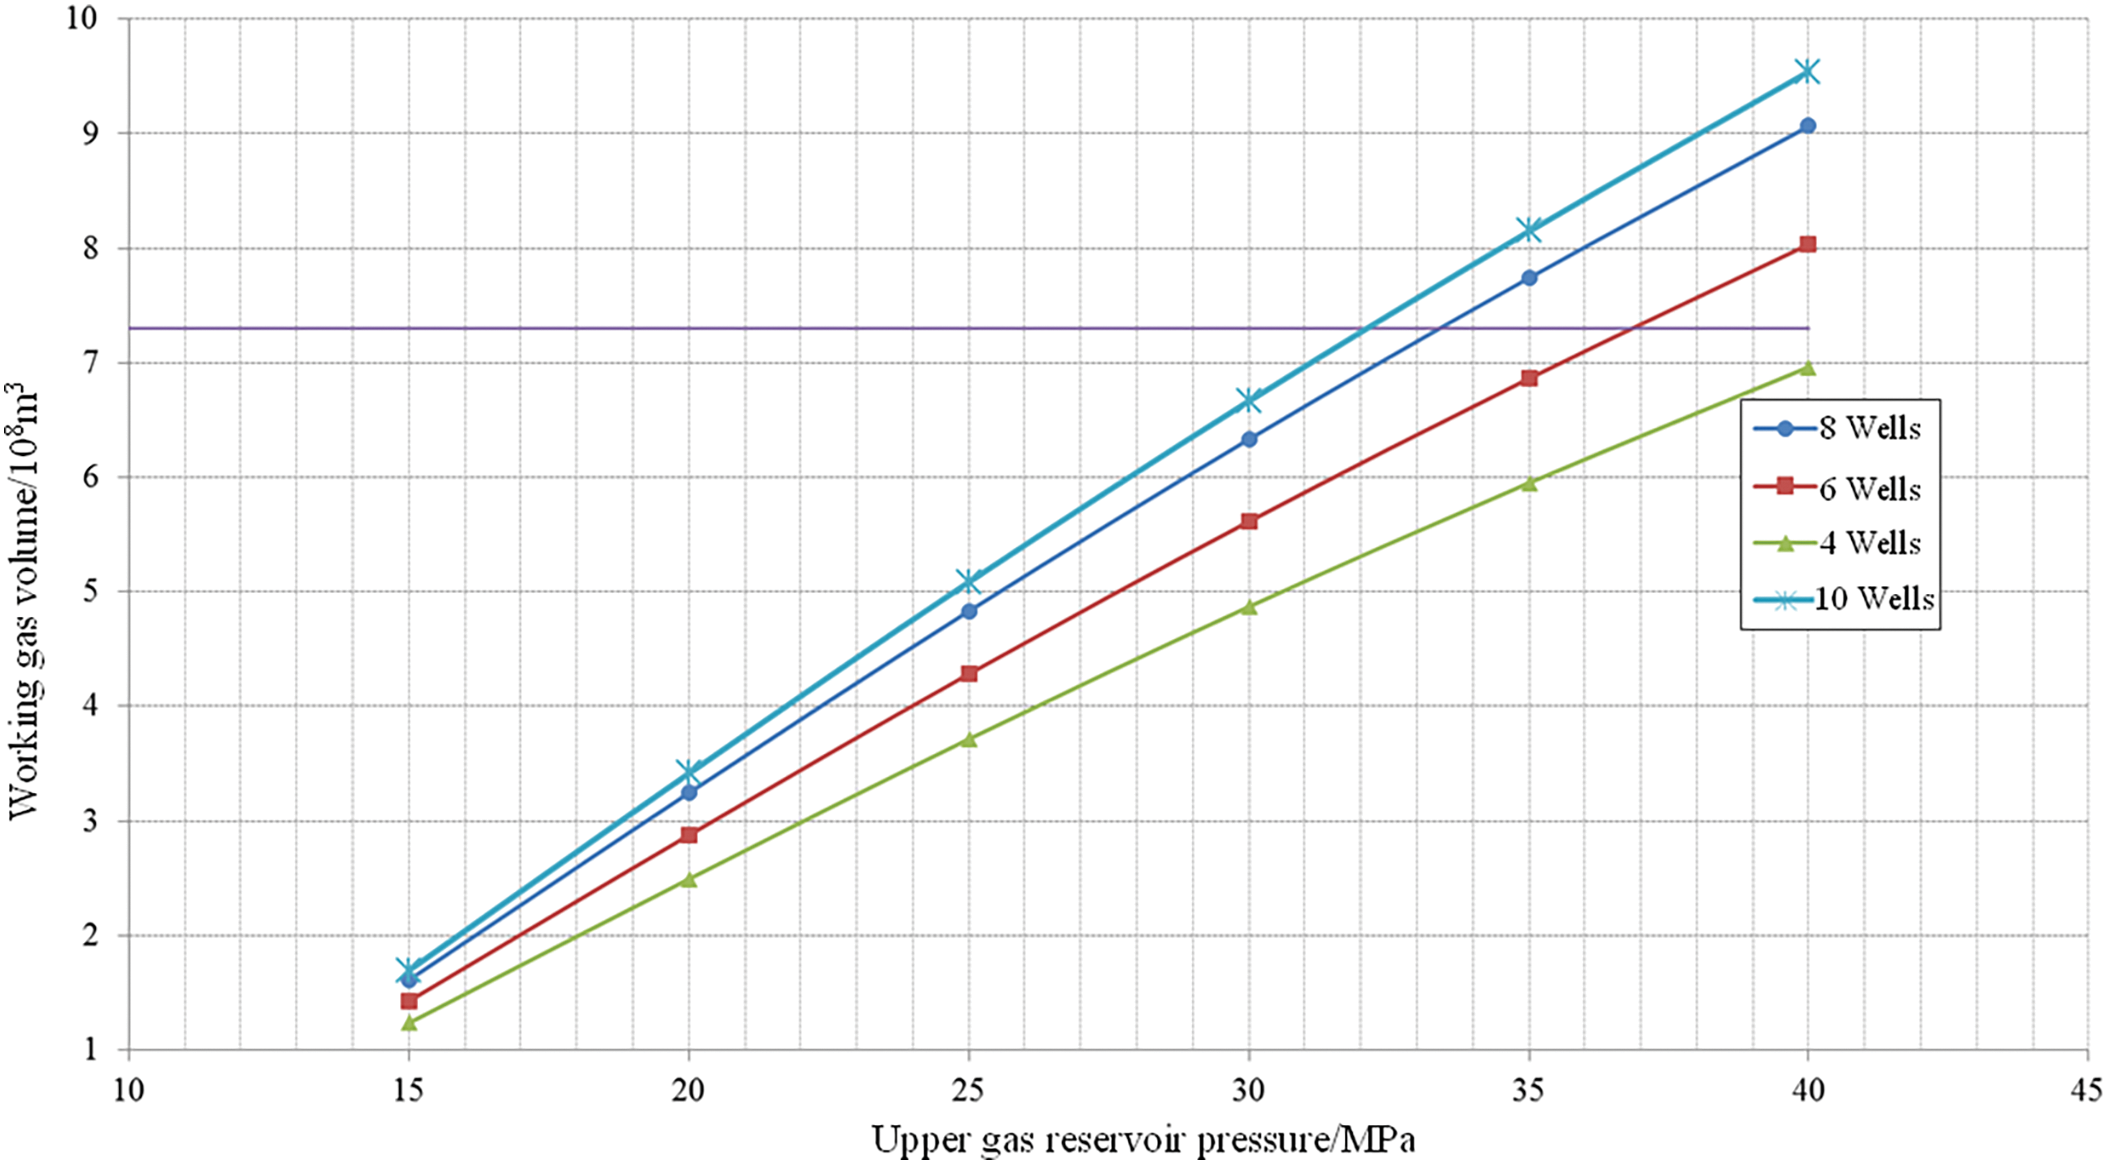
Figure 5: Statistical diagram of working gas volume in different pressure zones
According to the analysis of the peak shaving capacity of the pipeline network where the T gas reservoir is located, the minimum wellhead pressure must reach 7 MPa to meet the pipeline network’s peak shaving requirements. However, a 10 km connection pipeline needs to be constructed between the new injection/withdrawal gas source access point and the gas gathering station, which will result in a certain pressure loss. Therefore, the minimum wellhead pressure for the T gas storage injection/withdrawal wells is set at 7.5 MPa. By coupling wellbore gas flow and the productivity equation, calculations determined that the minimum reasonable gas withdrawal rate corresponds to a reservoir pressure of 10 MPa, which is then designated as the lower design pressure limit.
4.2.5 Number of Operating Wells
The T gas storage is designed to operate with a total of 6 to 10 wells.
The 3D geological modeling of the T gas storage facility is based on well log interpretation parameters, constrained by seismic interpretation data and geological trend maps. The modeling process follows a combination of deterministic and stochastic modeling principles to ultimately provide a 3D spatial distribution model of the structure, stratigraphy, fractures, and physical properties of the gas reservoir. The modeling follows a step-by-step approach from point to surface to volume, with the specific process outlined as follows:
Structural modeling: First, based on the latest 3D seismic interpretation results, the characteristics of fault elements were analyzed and verified using actual well data. A deterministic modeling approach was adopted to establish a reliable fault model, consisting of a total of 36 faults (Fig. 6).
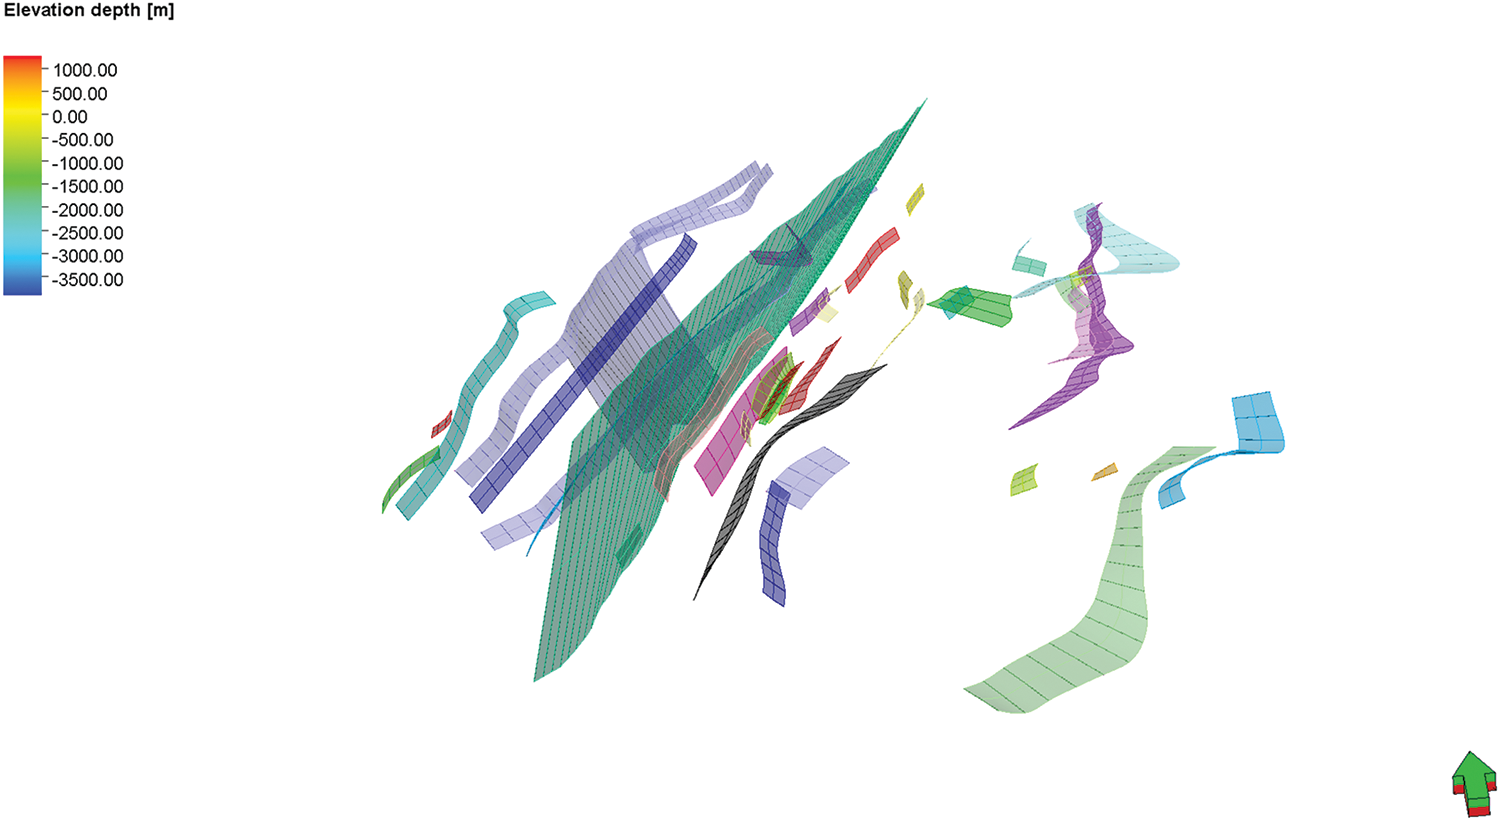
Figure 6: Fault model
Subsequently, the same deterministic modeling method was used to construct the structural framework model of the T gas storage facility, which is controlled by layer data, fault data, and well data. Based on interpreted layer data, quality control was conducted on structural lines, faults, and well stratification. The structural framework modeling was carried out with a grid resolution of 50 m × 50 m × 1 m for target layers and 50 m × 50 m × 10 m for non-target layers. Vertically, a total of five base surfaces were constructed (Fig. 7).
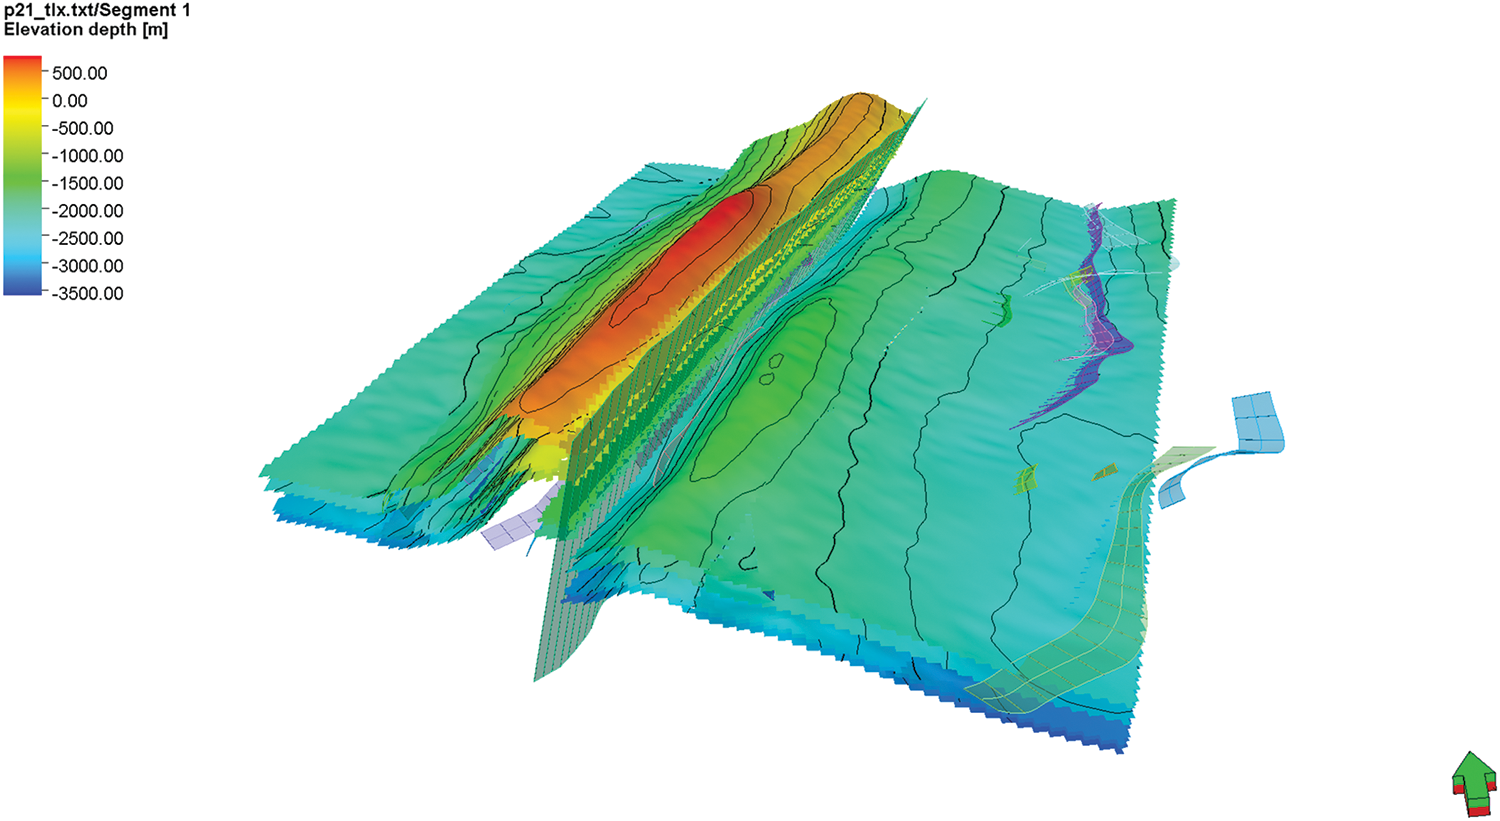
Figure 7: Three-dimensional geological model of the whole layer region
Fracture Model: The seismic interpretation ant body was processed for fracture extraction, and its aperture and permeability were calculated (Figs. 8 and 9). Finally, the fracture segment parameters were mapped onto the 3D model to obtain fracture permeability and porosity.
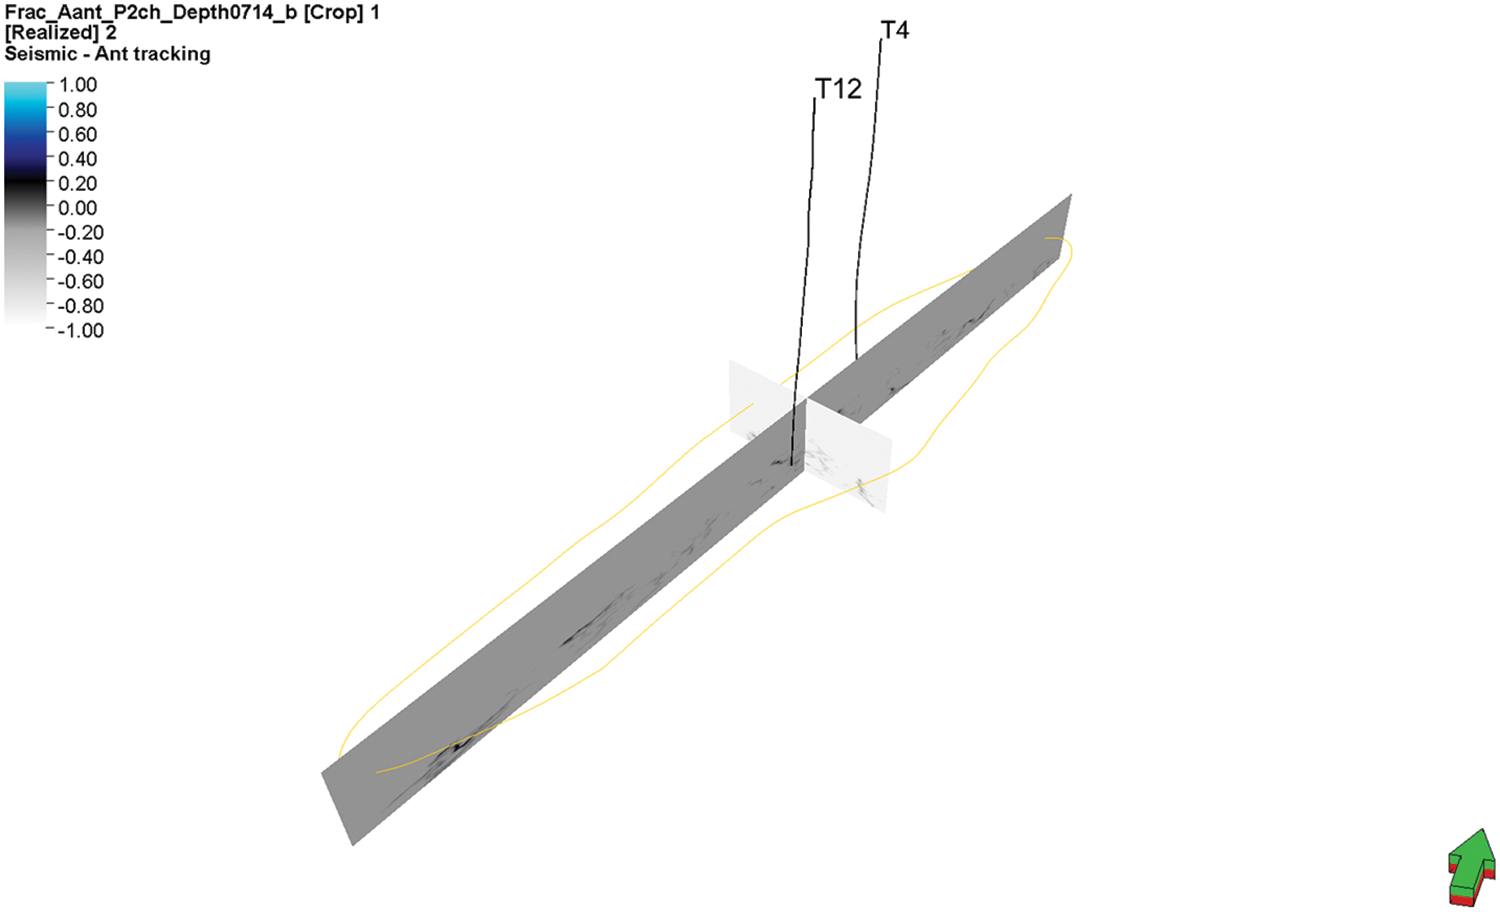
Figure 8: Seismic ant body interpretation
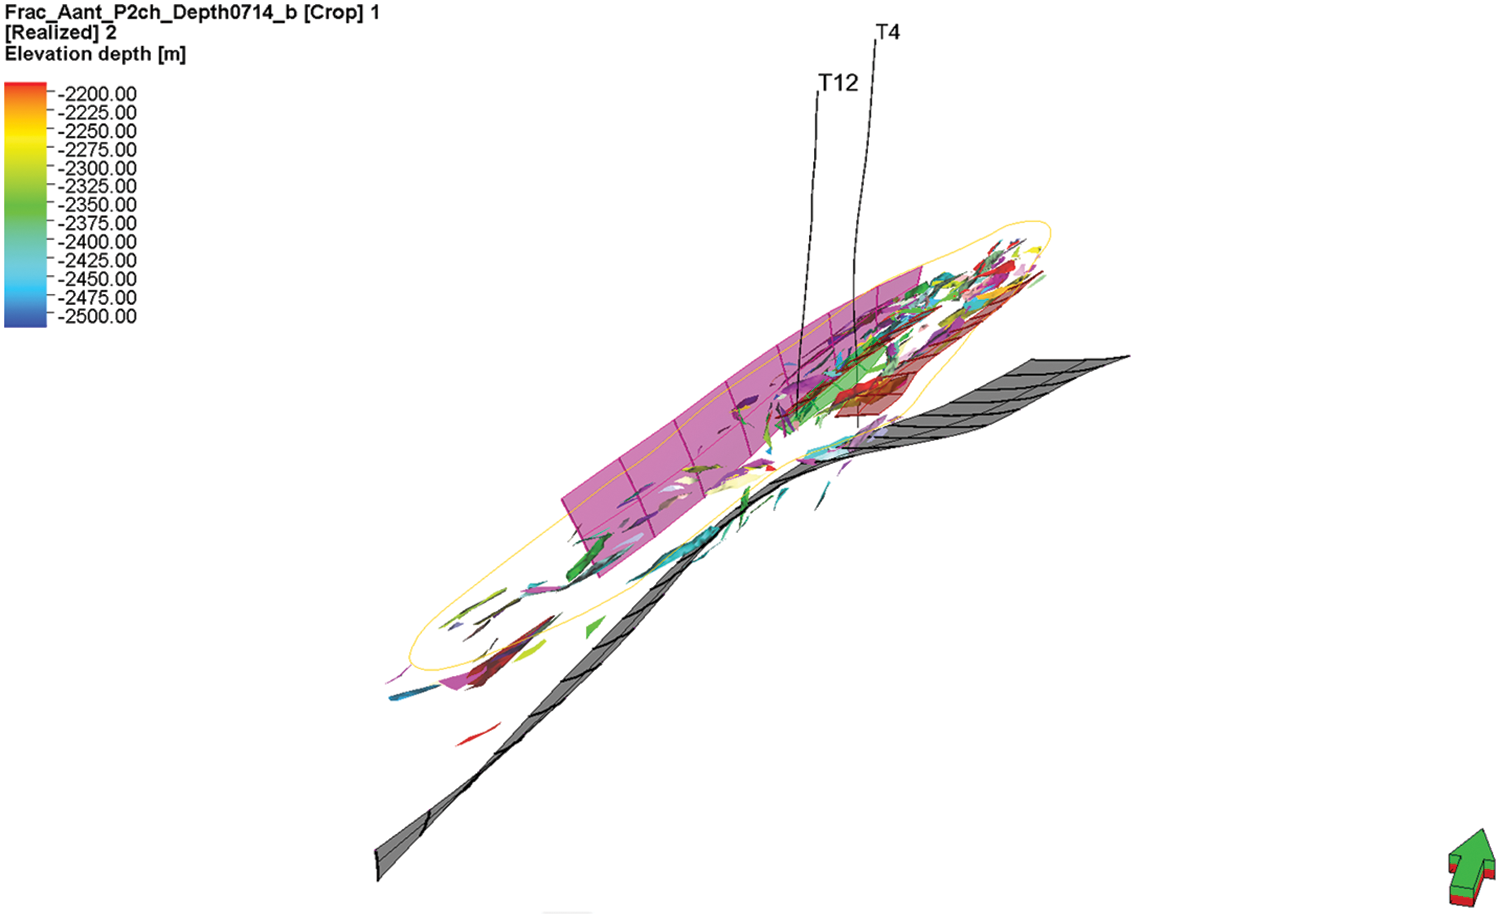
Figure 9: The extracted fracture segments
Property modeling: The porosity model is established based on porosity data from well logging interpretation, with seismic-predicted porosity as a trend constraint, using the sequential Gaussian simulation algorithm (Figs. 10 and 11). The permeability model is primarily based on permeability data from column-wise modeling and is constrained by well test data to construct the permeability model (Figs. 12 and 13).
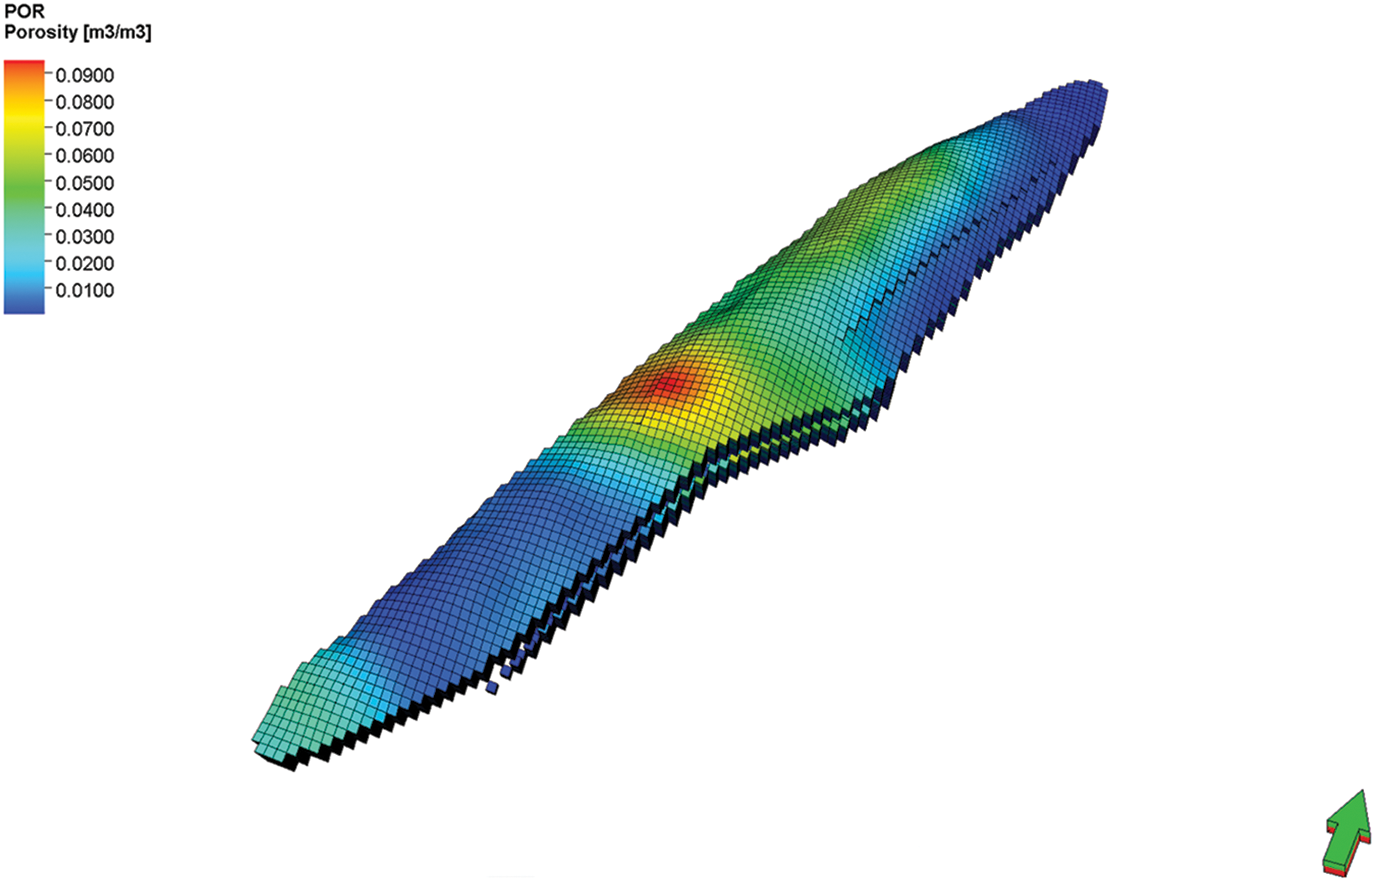
Figure 10: Porosity distribution
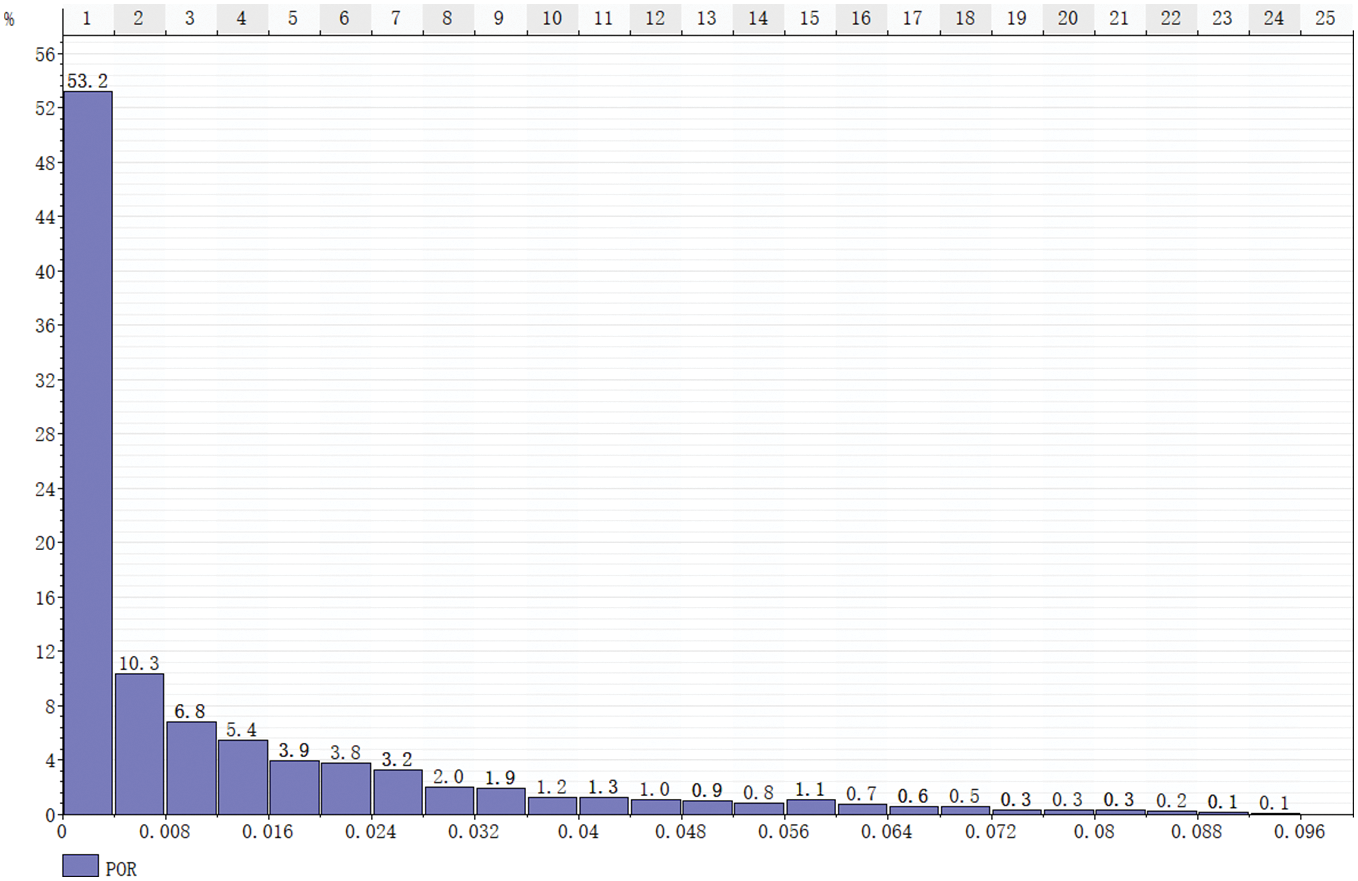
Figure 11: Porosity statistics
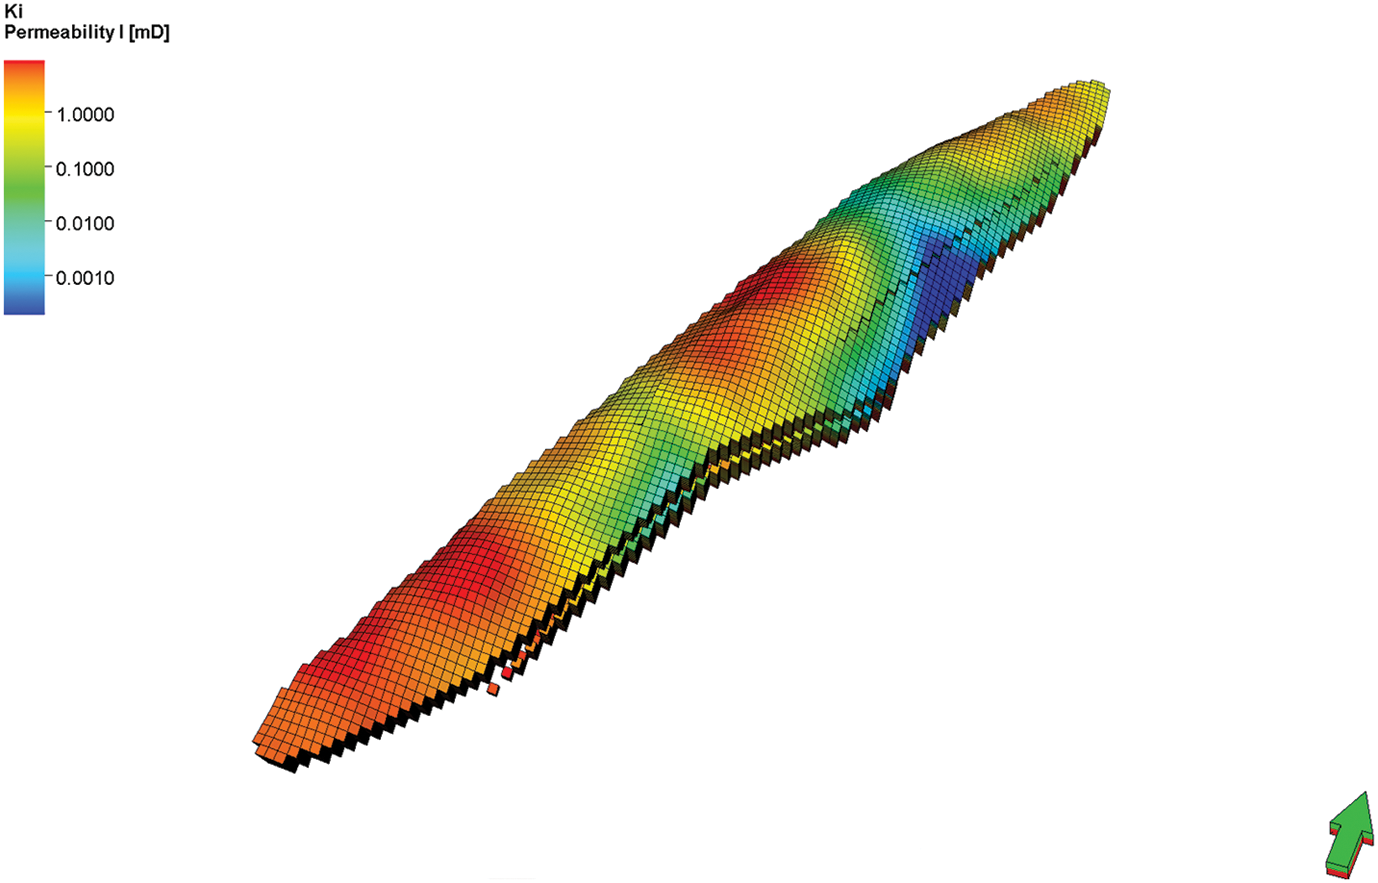
Figure 12: Permeability distribution
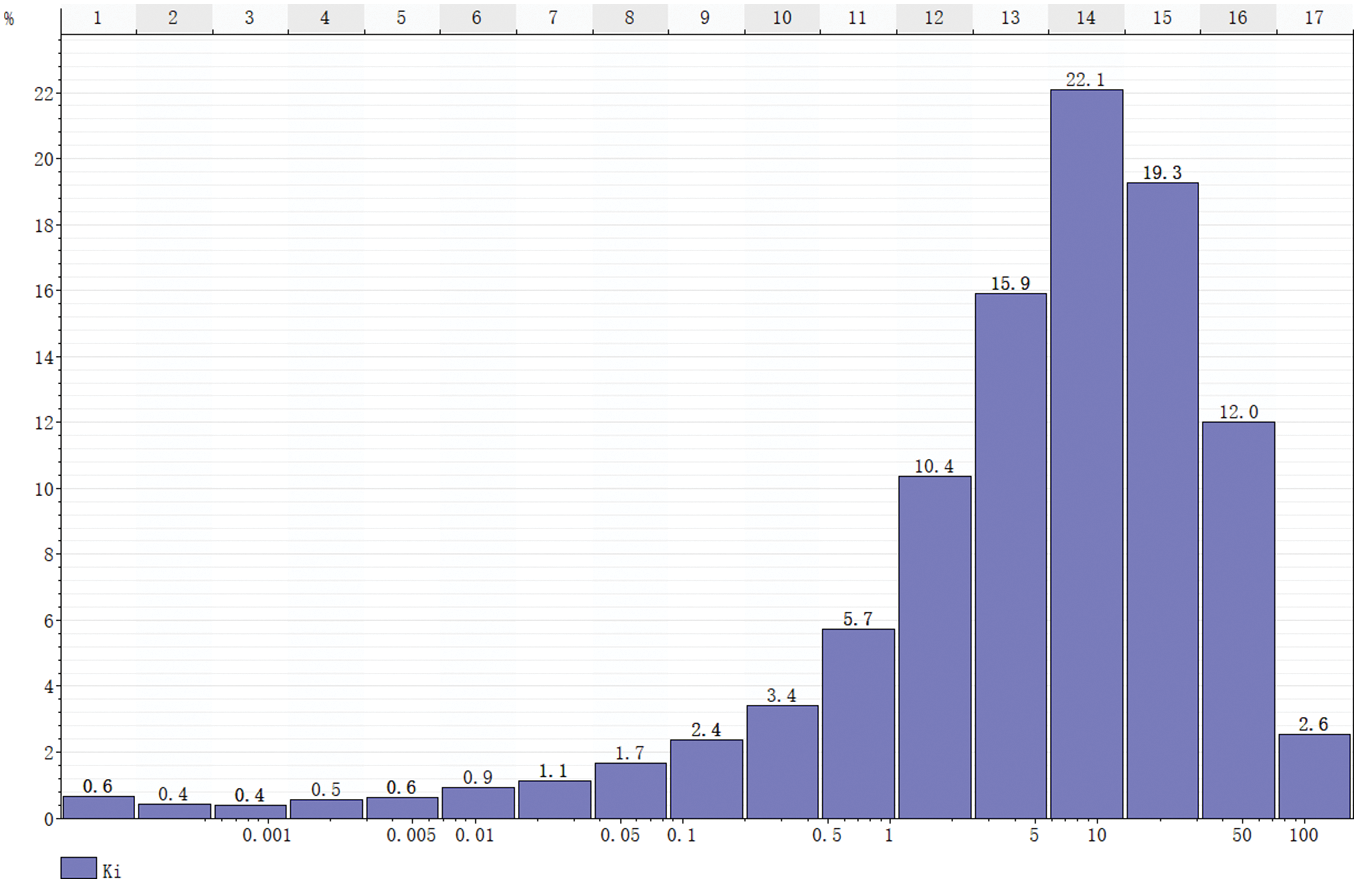
Figure 13: Permeability statistics
Reserve calculation: The model calculation result is 18.02 × 10⁸ m3, which is generally consistent with the latest reserve report of the T gas storage facility.
4.3.2 Numerical Simulation Model
On the basis of the 3D geological model, a numerical simulation model was established through steps such as grid coarsening.
Geological model coarsening: Since the 3D geological model contains 23.45 million grid cells, it was difficult to compute using the reservoir simulation software. Therefore, the geological model was coarsened, converting the coordinate system to a Cartesian system with a three-dimensional orthogonal corner-point grid structure. The average grid spacing was set to △x = 100 m, △y = 100 m, and the vertical division consisted of 15 layers, resulting in a total grid system of 71 × 127 × 49 = 441,833 cells.
Gas reservoir basic parameter setting: According to the development geological characteristics, fluid distribution patterns, and seepage mechanisms of the T gas storage facility, the simulation model was built using a three-dimensional single-phase (gas) black oil model, with high-pressure natural gas properties calculated using the system’s default parameters. The physical property scalar data of gas storage are shown in Table 3, and the phase permeability curve is shown in Fig. 14.
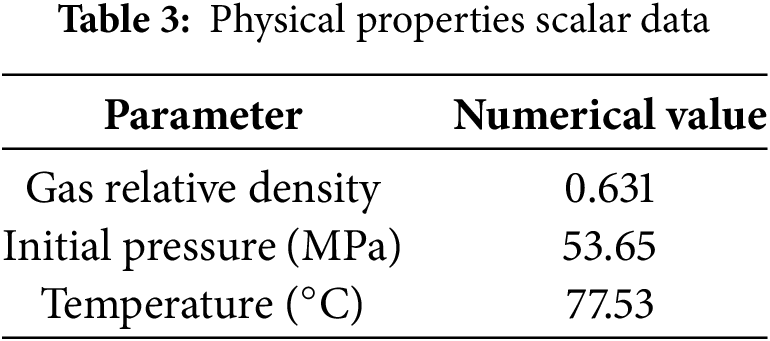
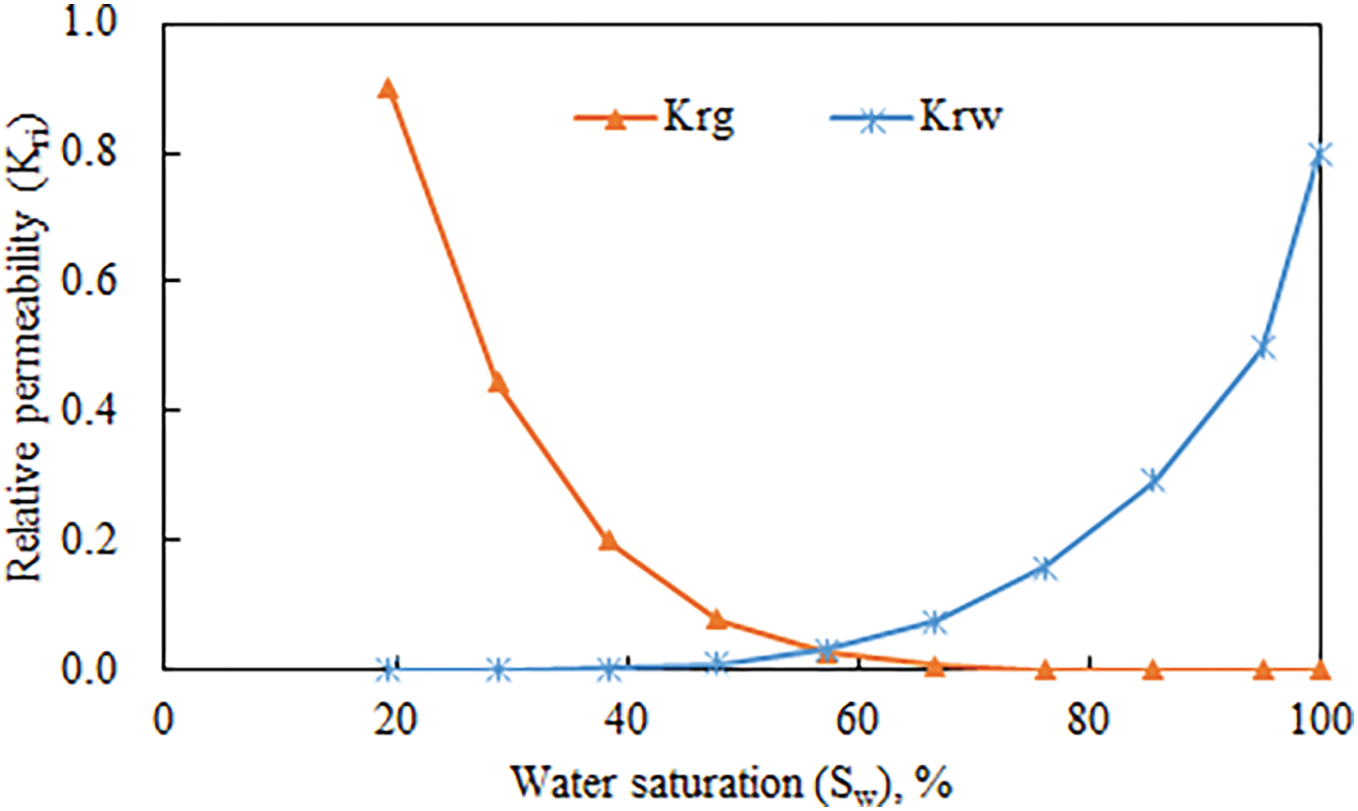
Figure 14: Phase permeability curve
Historical fitting: The T gas storage facility has only two production wells, namely T4 and T12. T4 was put into production on 8 May 1987, and by September 2018, before the injection test, it had a production casing pressure of 1.05 MPa and an oil pressure of 0.61 MPa. The daily gas production was 2.8 × 10⁴ m3, daily water production was 0.7 m3, with a cumulative gas production of 10.68 × 10⁸ m3 and a cumulative water production of 5402 m3. T12 was put into production on 8 November, 2004, and by September 2018, before the injection test, it had a production casing pressure of 0.65 MPa and an oil pressure of 1.32 MPa. The daily gas production was 0.8 × 10⁴ m3, with a cumulative gas production of 6.21 × 10⁸ m3 and a cumulative water production of 3033 m3. On 7 September 2018, T12 began its pilot injection test, which was stopped on 31 May 2021, with a cumulative gas injection volume of 1.2708 × 10⁸ m3. Therefore, based on the established fluid model, combined with the well structure data and productivity test data, the VFP table of 4-inch and a half tubing well and an injection well is established (Figs. 15 and 16).
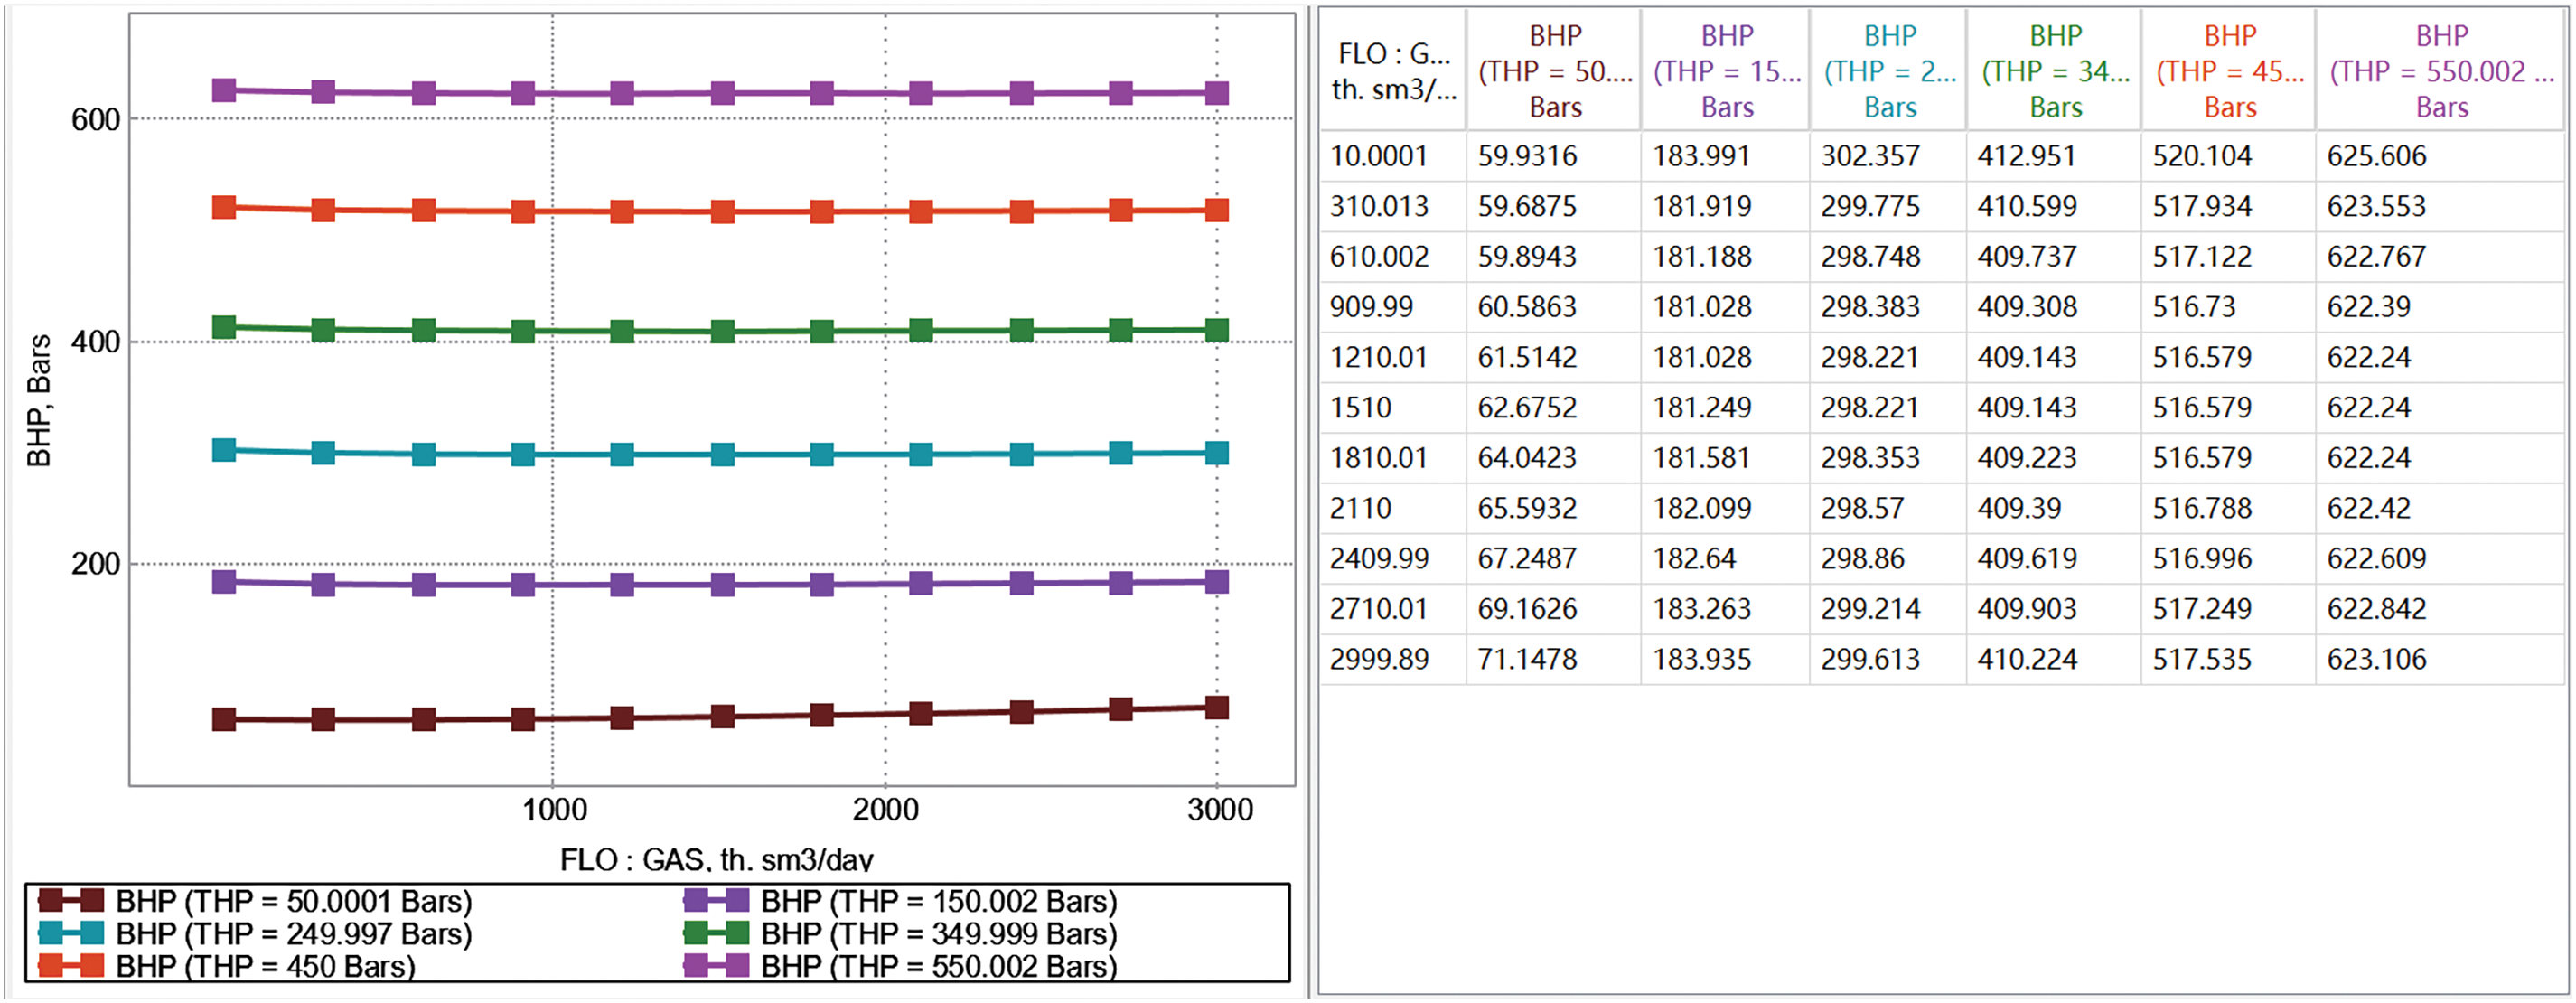
Figure 15: Gas production well VFP
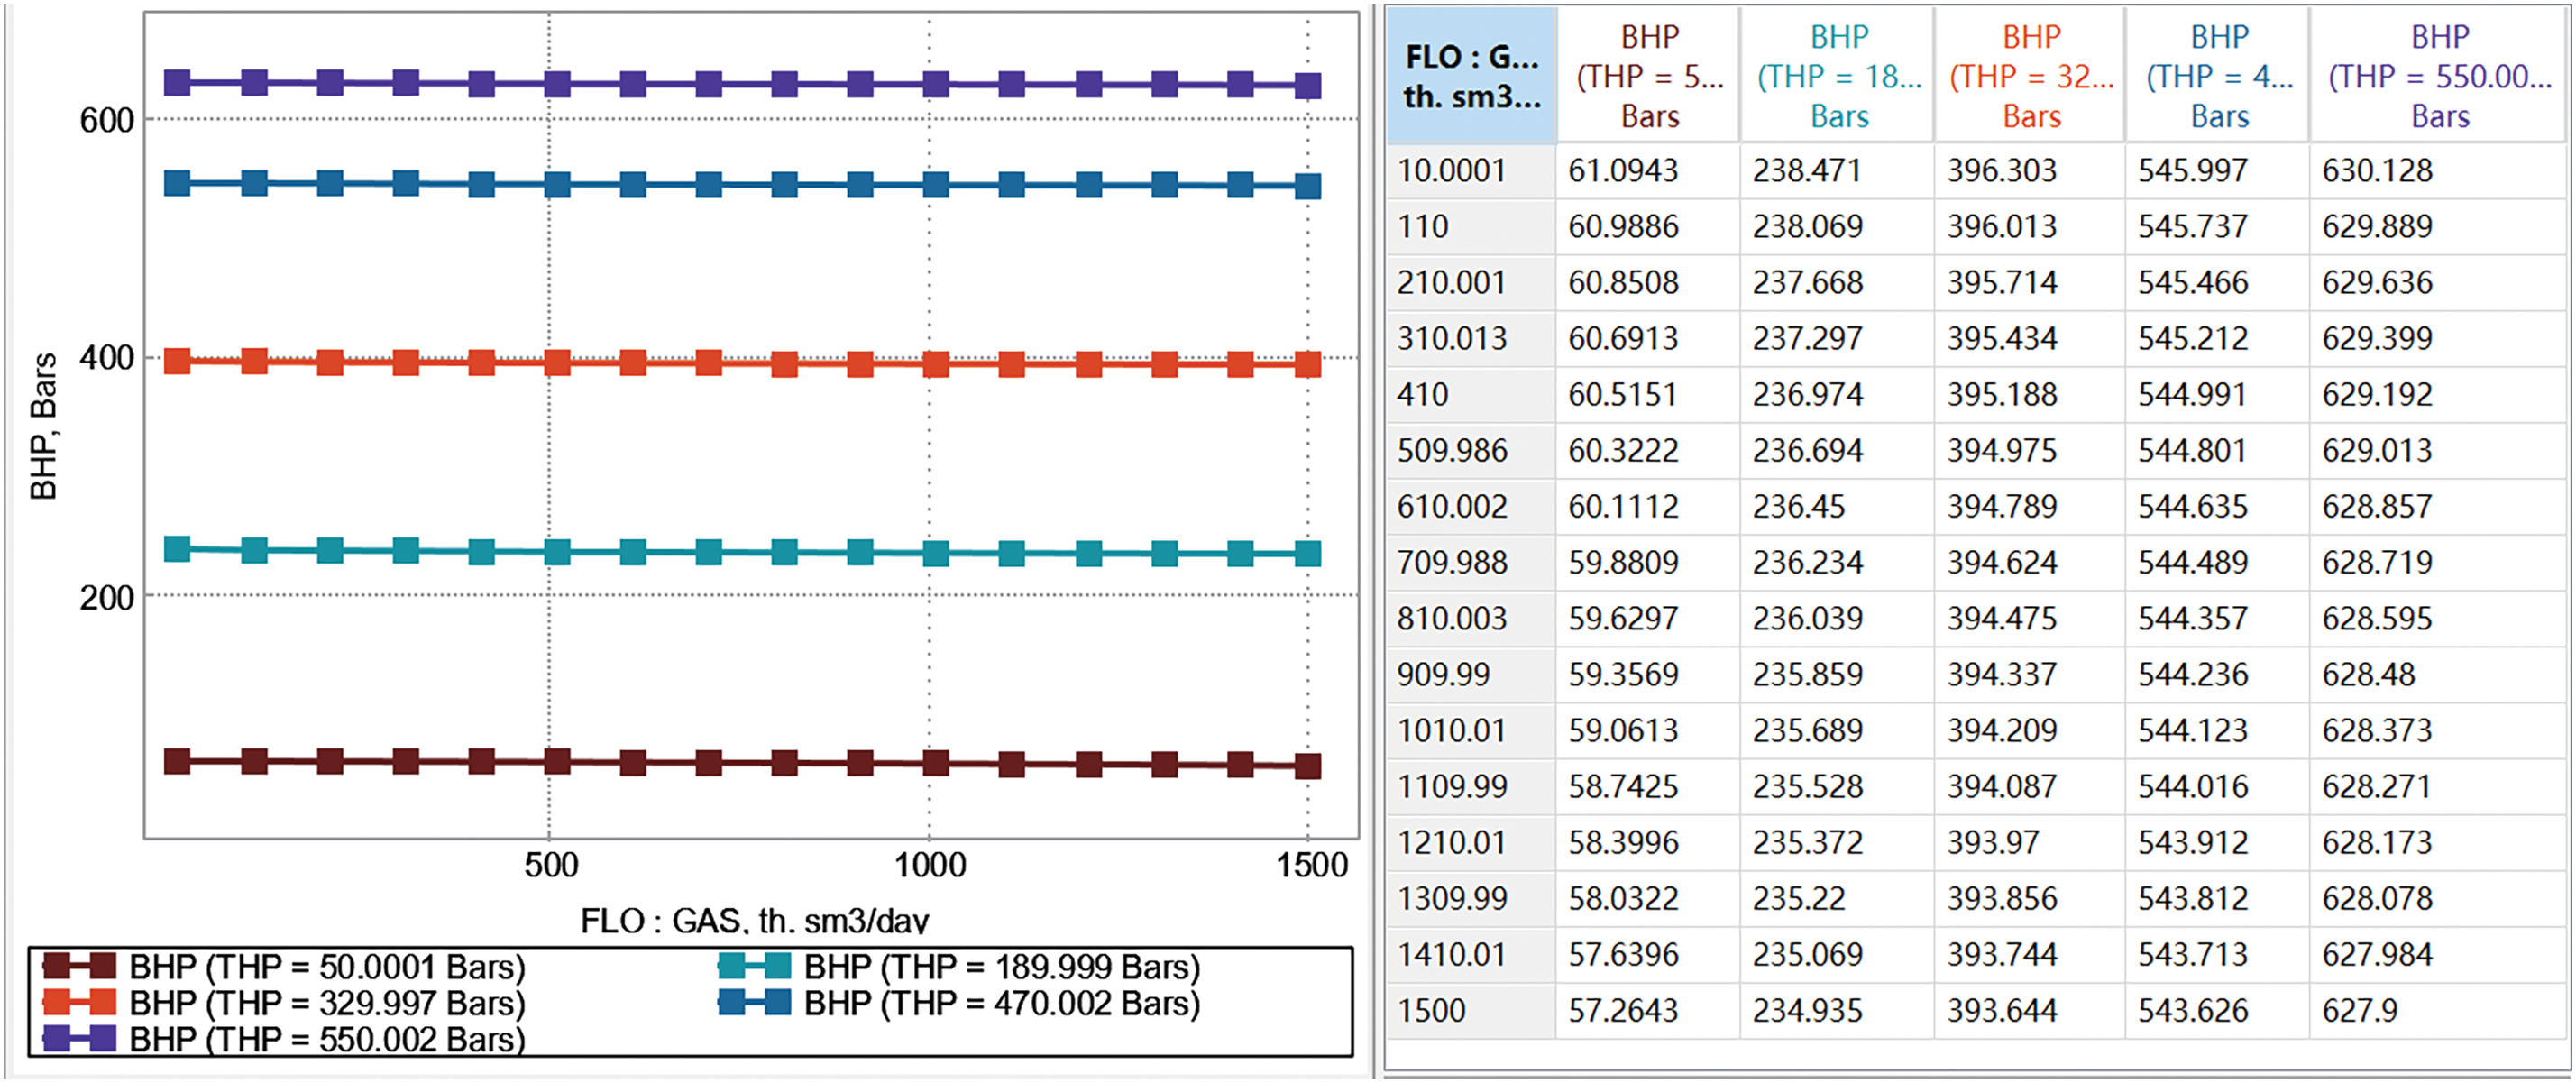
Figure 16: Gas injection well VFP
Then, the production and injection histories of Wells T4 and T12 are fitted by adjusting the model parameters (Figs. 17–22).
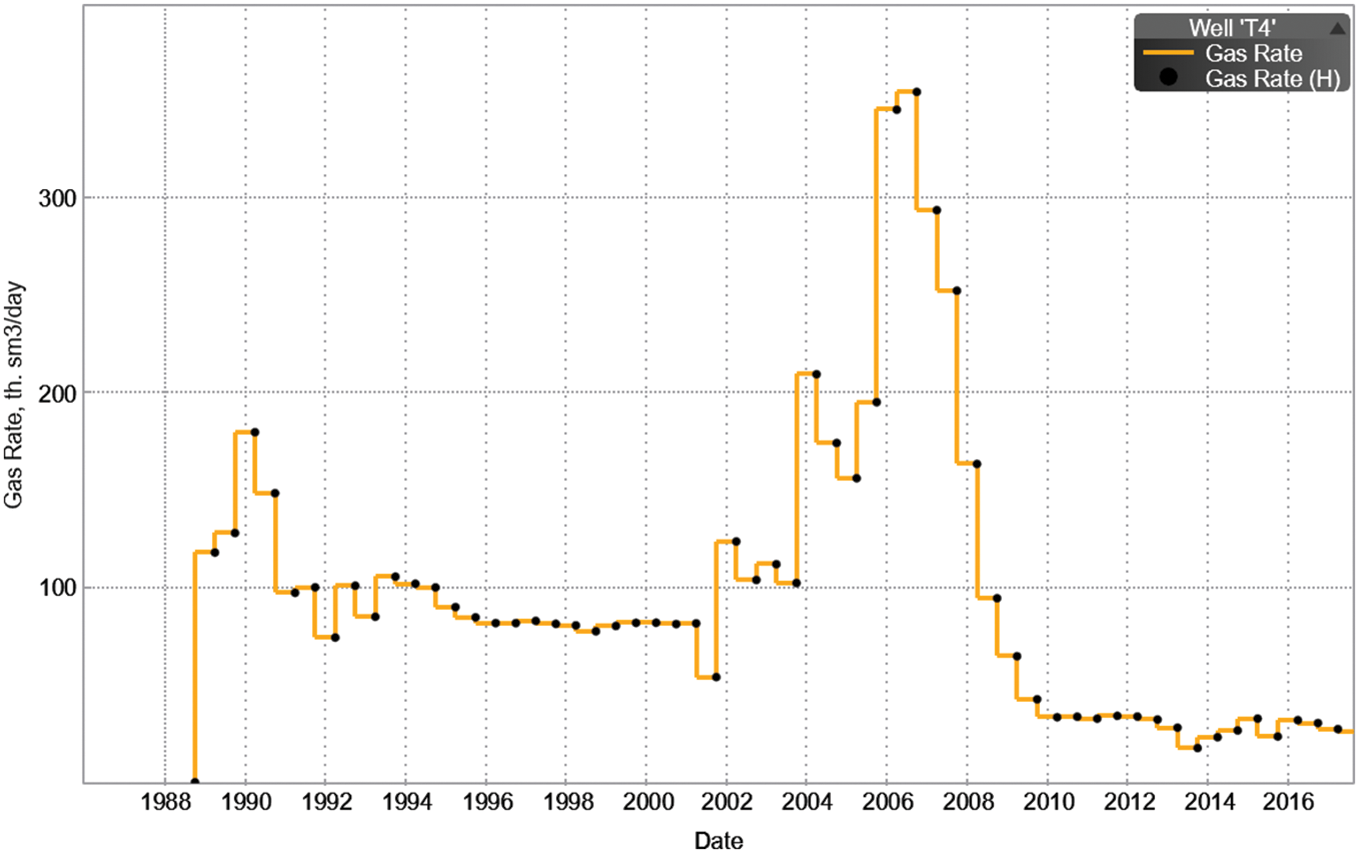
Figure 17: Production history fitting of well T4
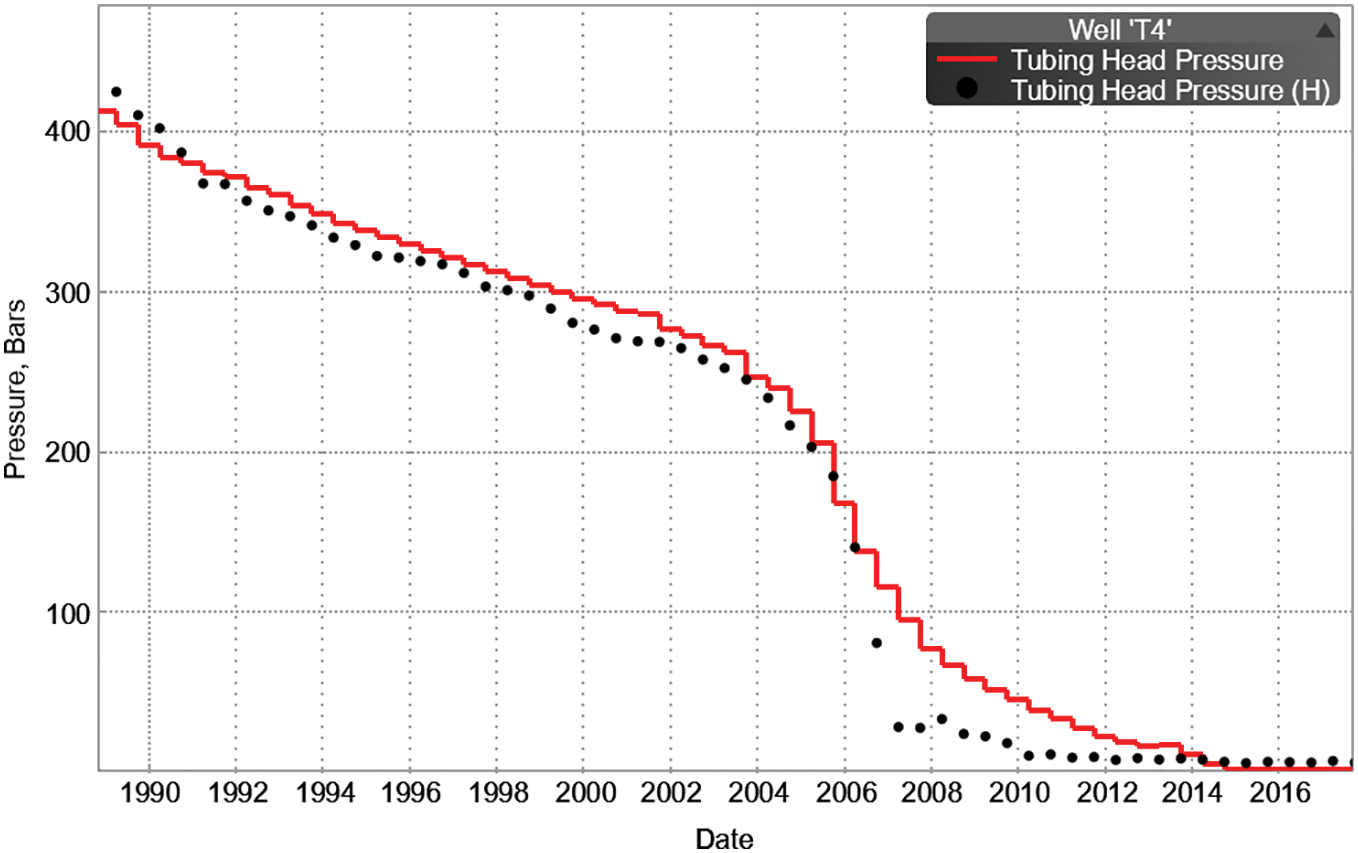
Figure 18: Wellhead pressure fitting diagram of well T4
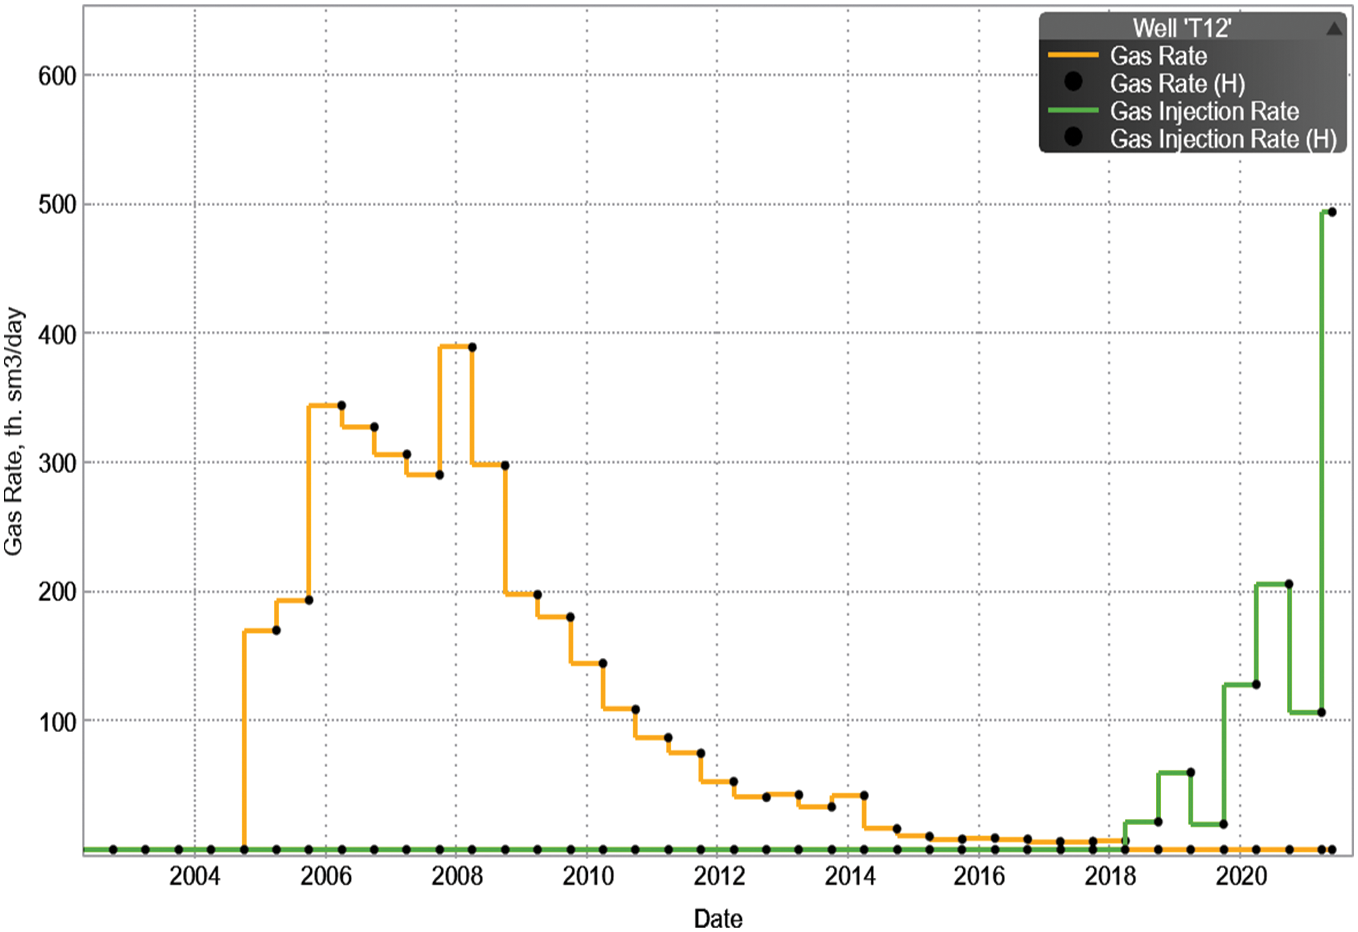
Figure 19: Production history fitting of well T12
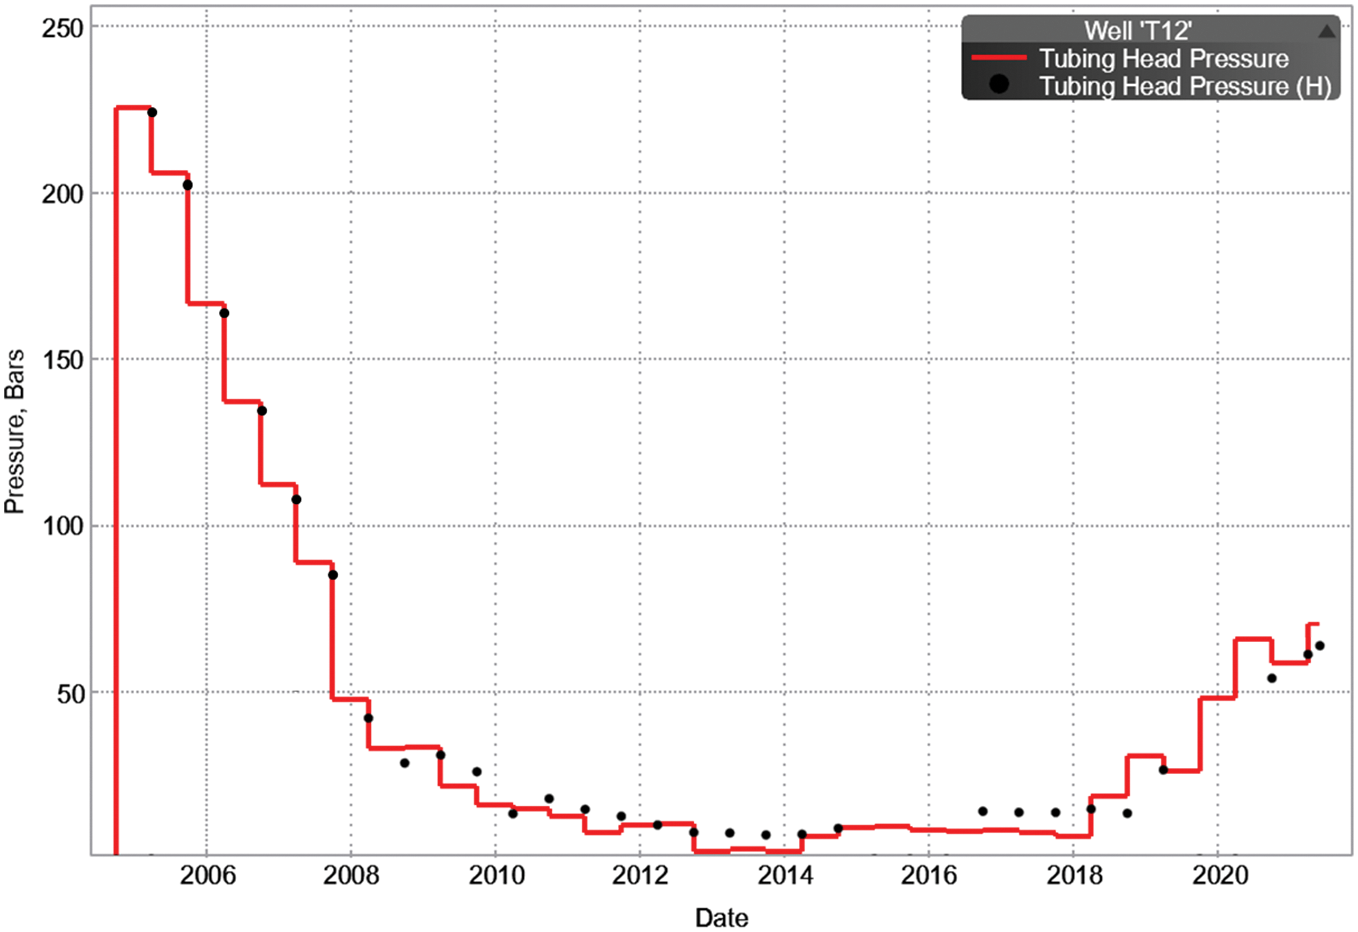
Figure 20: Wellhead pressure fitting diagram of well T12
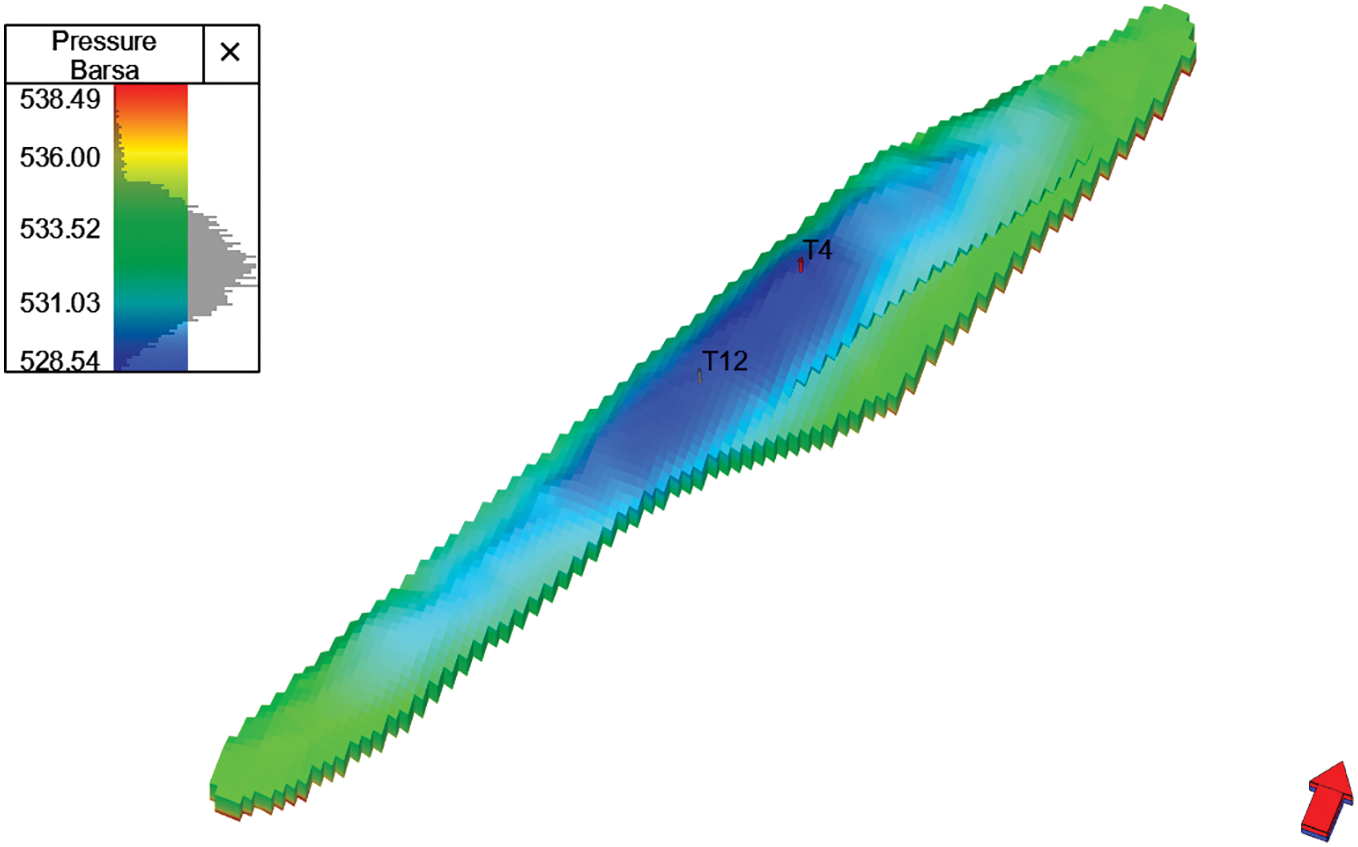
Figure 21: Initialize the pressure distribution field diagram
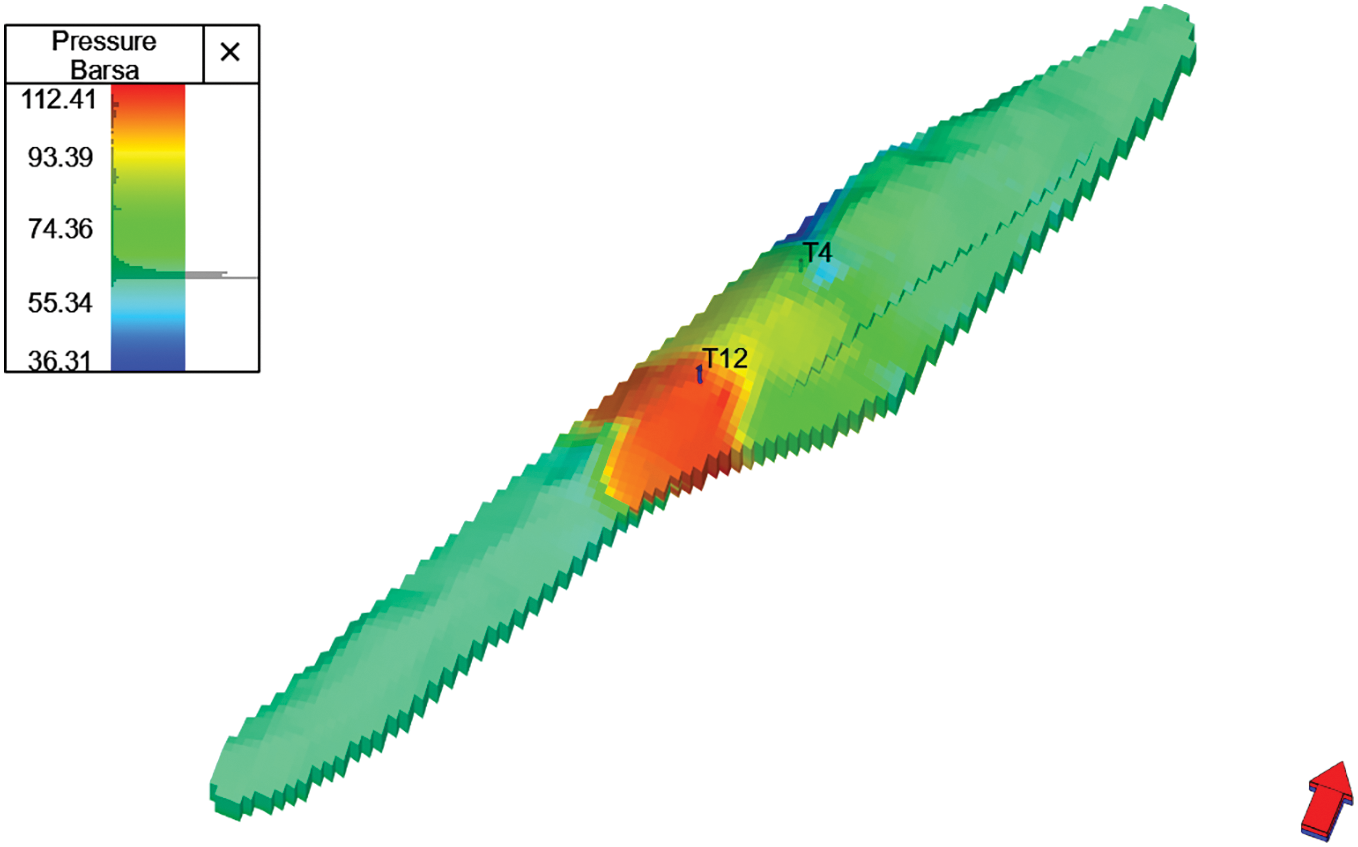
Figure 22: Historically fitted pressure distribution field diagram
Model calculation: After the historical fitting is completed, the model is initialized to complete the establishment of the numerical simulation model. The model parameters after initialization are shown in Fig. 23.
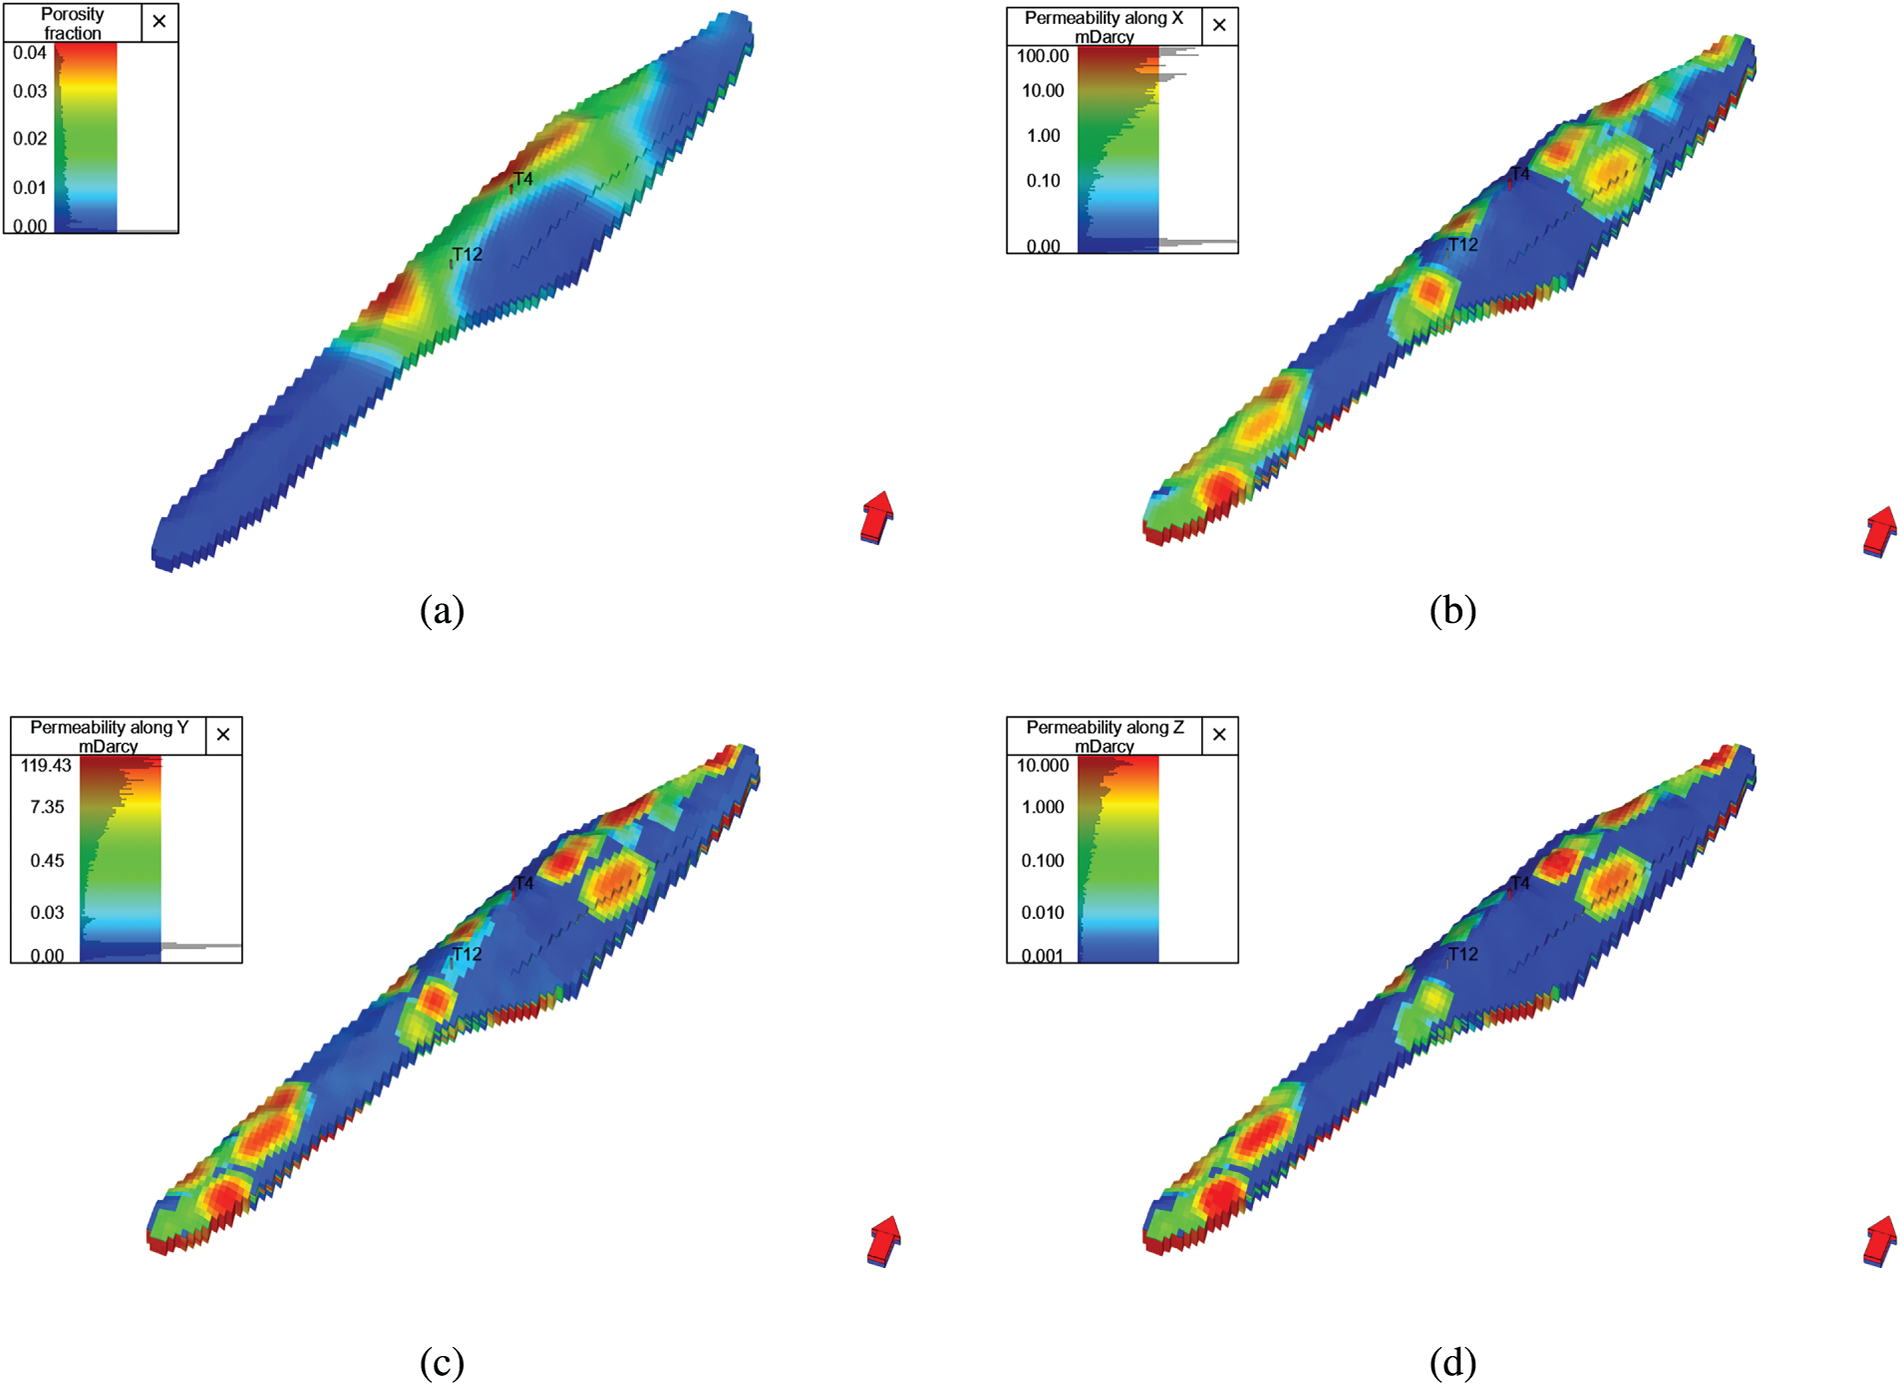
Figure 23: Model initialization results: (a) Porosity distribution; (b) Fracture permeability distribution in direction i; (c) Fracture permeability distribution in direction j; (d) Fracture permeability distribution in direction k
The genetic algorithm is implemented using Python, where the selection operation adopts the roulette wheel selection method, and the crossover operation employs the simulated binary crossover. The convergence criterion is that the variation amplitude of the objective function is less than 104 m3 or reaches the maximum number of iterations. The algorithm is configured with a population size of 20, a maximum of 50 iterations, a mutation probability of 0.01, and a crossover probability of 0.8. It’s worth noting that the parameters are determined by combining previous studies and trial-and-error methods. The extreme peak shaving time is set for the Chinese Spring Festival (mid-February).
Based on the determined injection and production rates, upper and lower pressure limits, and the range of operating well numbers for the T gas storage (Table 4), the operating parameters were simulated and optimized using a combination of a genetic algorithm and a numerical simulation model. After 30 iterations, the optimal operating parameters were successfully obtained (Table 4). The detailed optimization process and results are shown in Figs. 24 and 25.
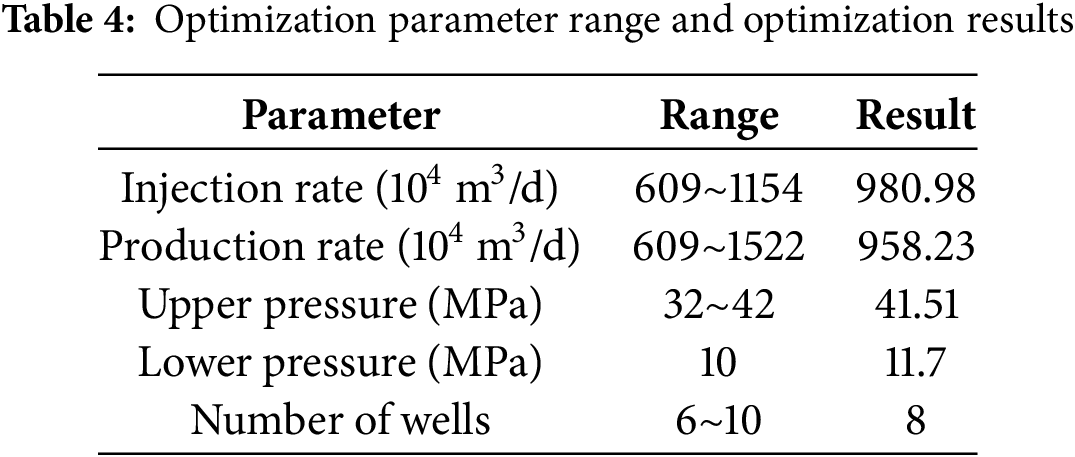
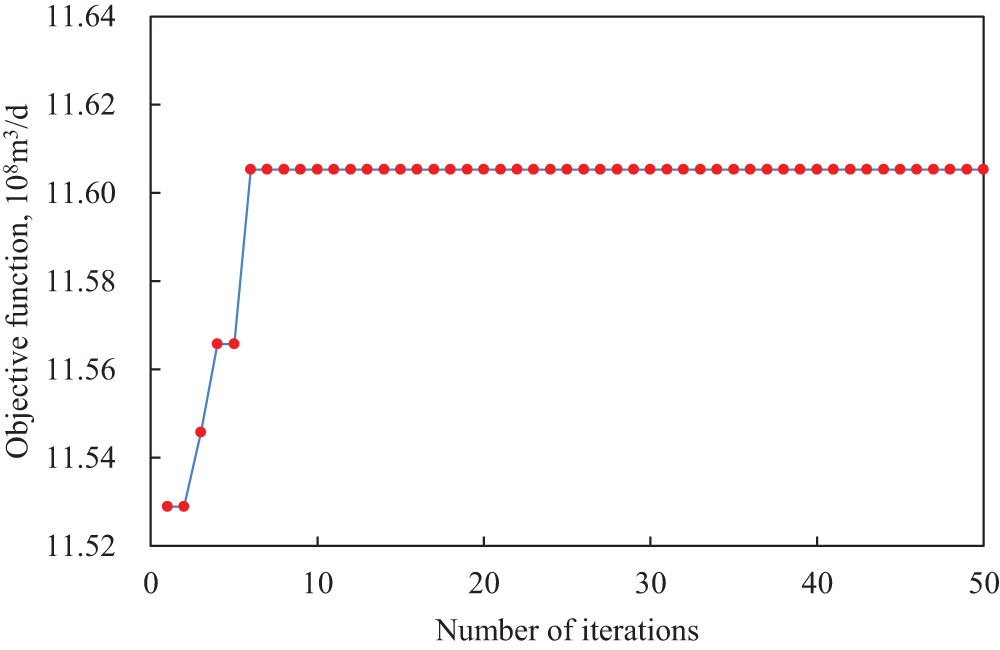
Figure 24: Operational parameter optimization process
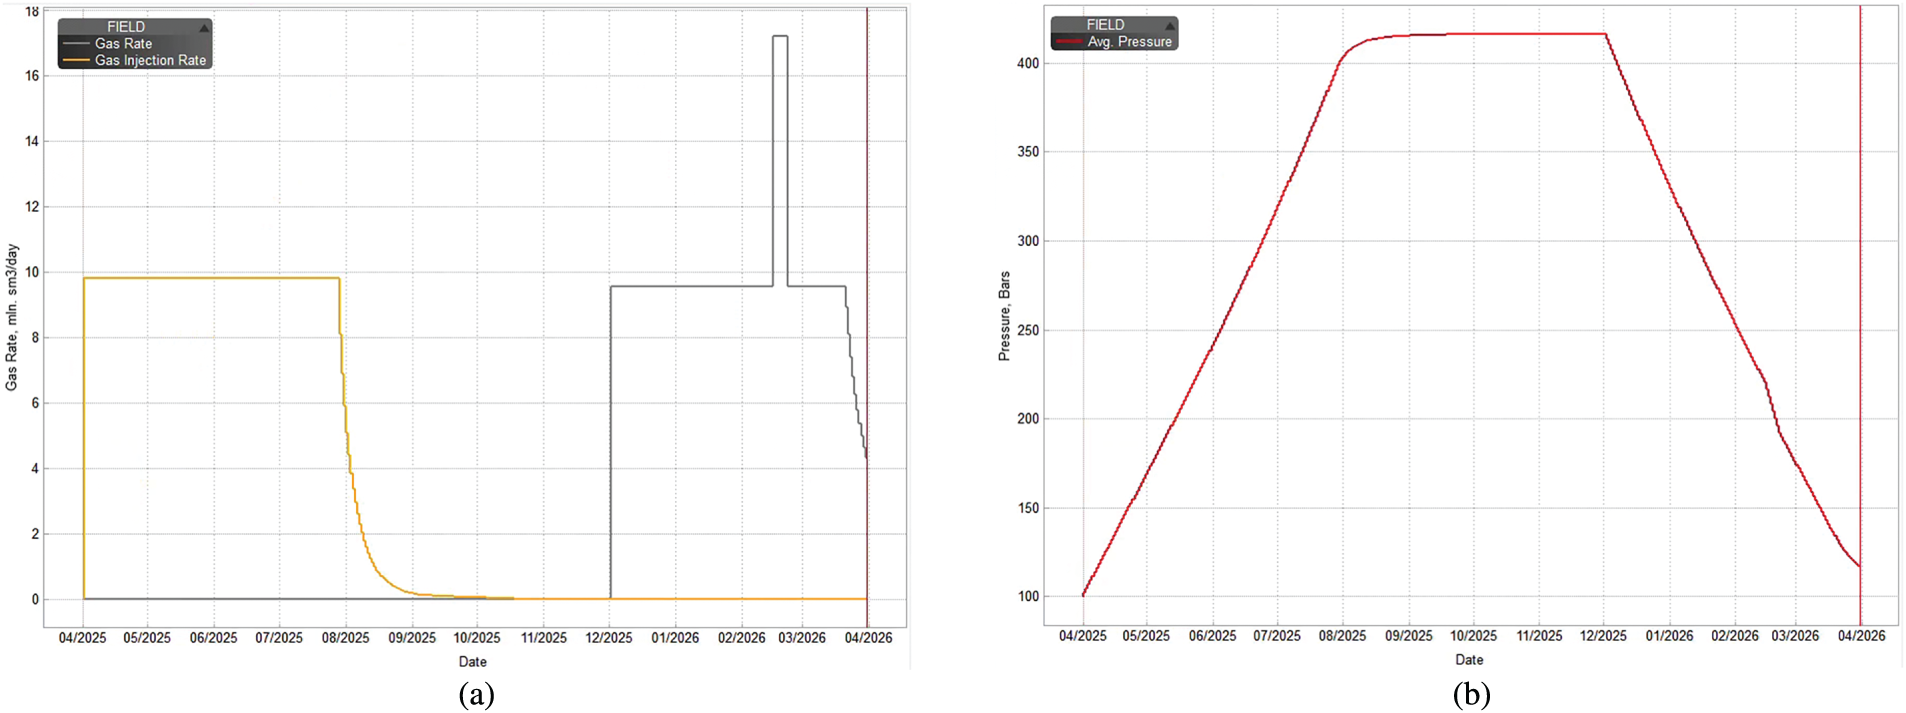
Figure 25: Numerical simulation results of optimal parameters: (a) Injection and production rate; (b) Formation pressure
The optimization results indicate that when the upper pressure limit is 41.51 MPa, the lower pressure limit is 11.7 MPa, the injection rate is 980.98 × 10⁴ m3/d, the gas production rate is 958.23 × 10⁴ m3/d, and the number of operating wells is 8, the working gas volume reaches a maximum of 11.605 × 10⁸ m3, approximately 94% of the theoretical peak value. As shown in Fig. 2, the model converged after only six iterations, significantly improving the solution speed. Moreover, this scheme ensures a prolonged stable production period during both the injection and withdrawal phases, enabling stable gas storage operation while meeting extreme peak-shaving requirements and aligning with the design standards of the T gas storage.
Meanwhile, to further verify the accuracy of the optimization results of the new method, the traditional single-factor stepwise optimization method was applied to optimize the T gas storage. Based on the actual site conditions and design requirements of the T gas storage, four different schemes were designed (Table 5). The results are presented in Fig. 26 and Table 6.
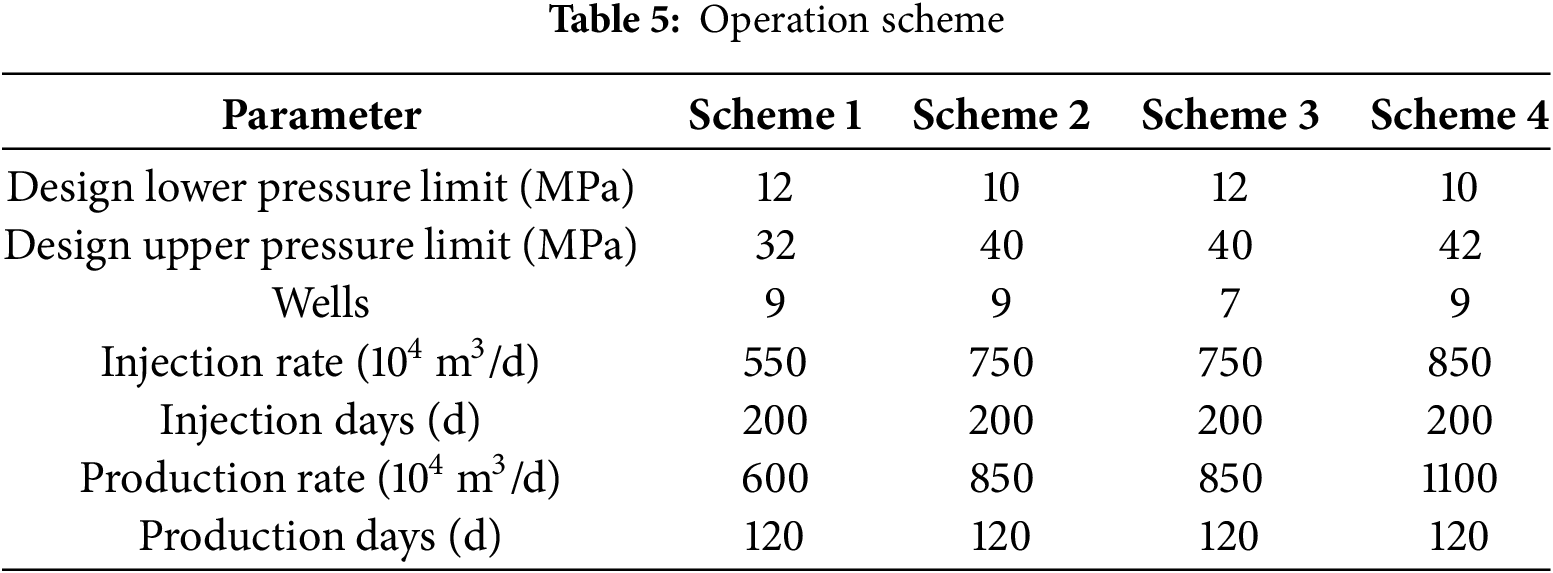

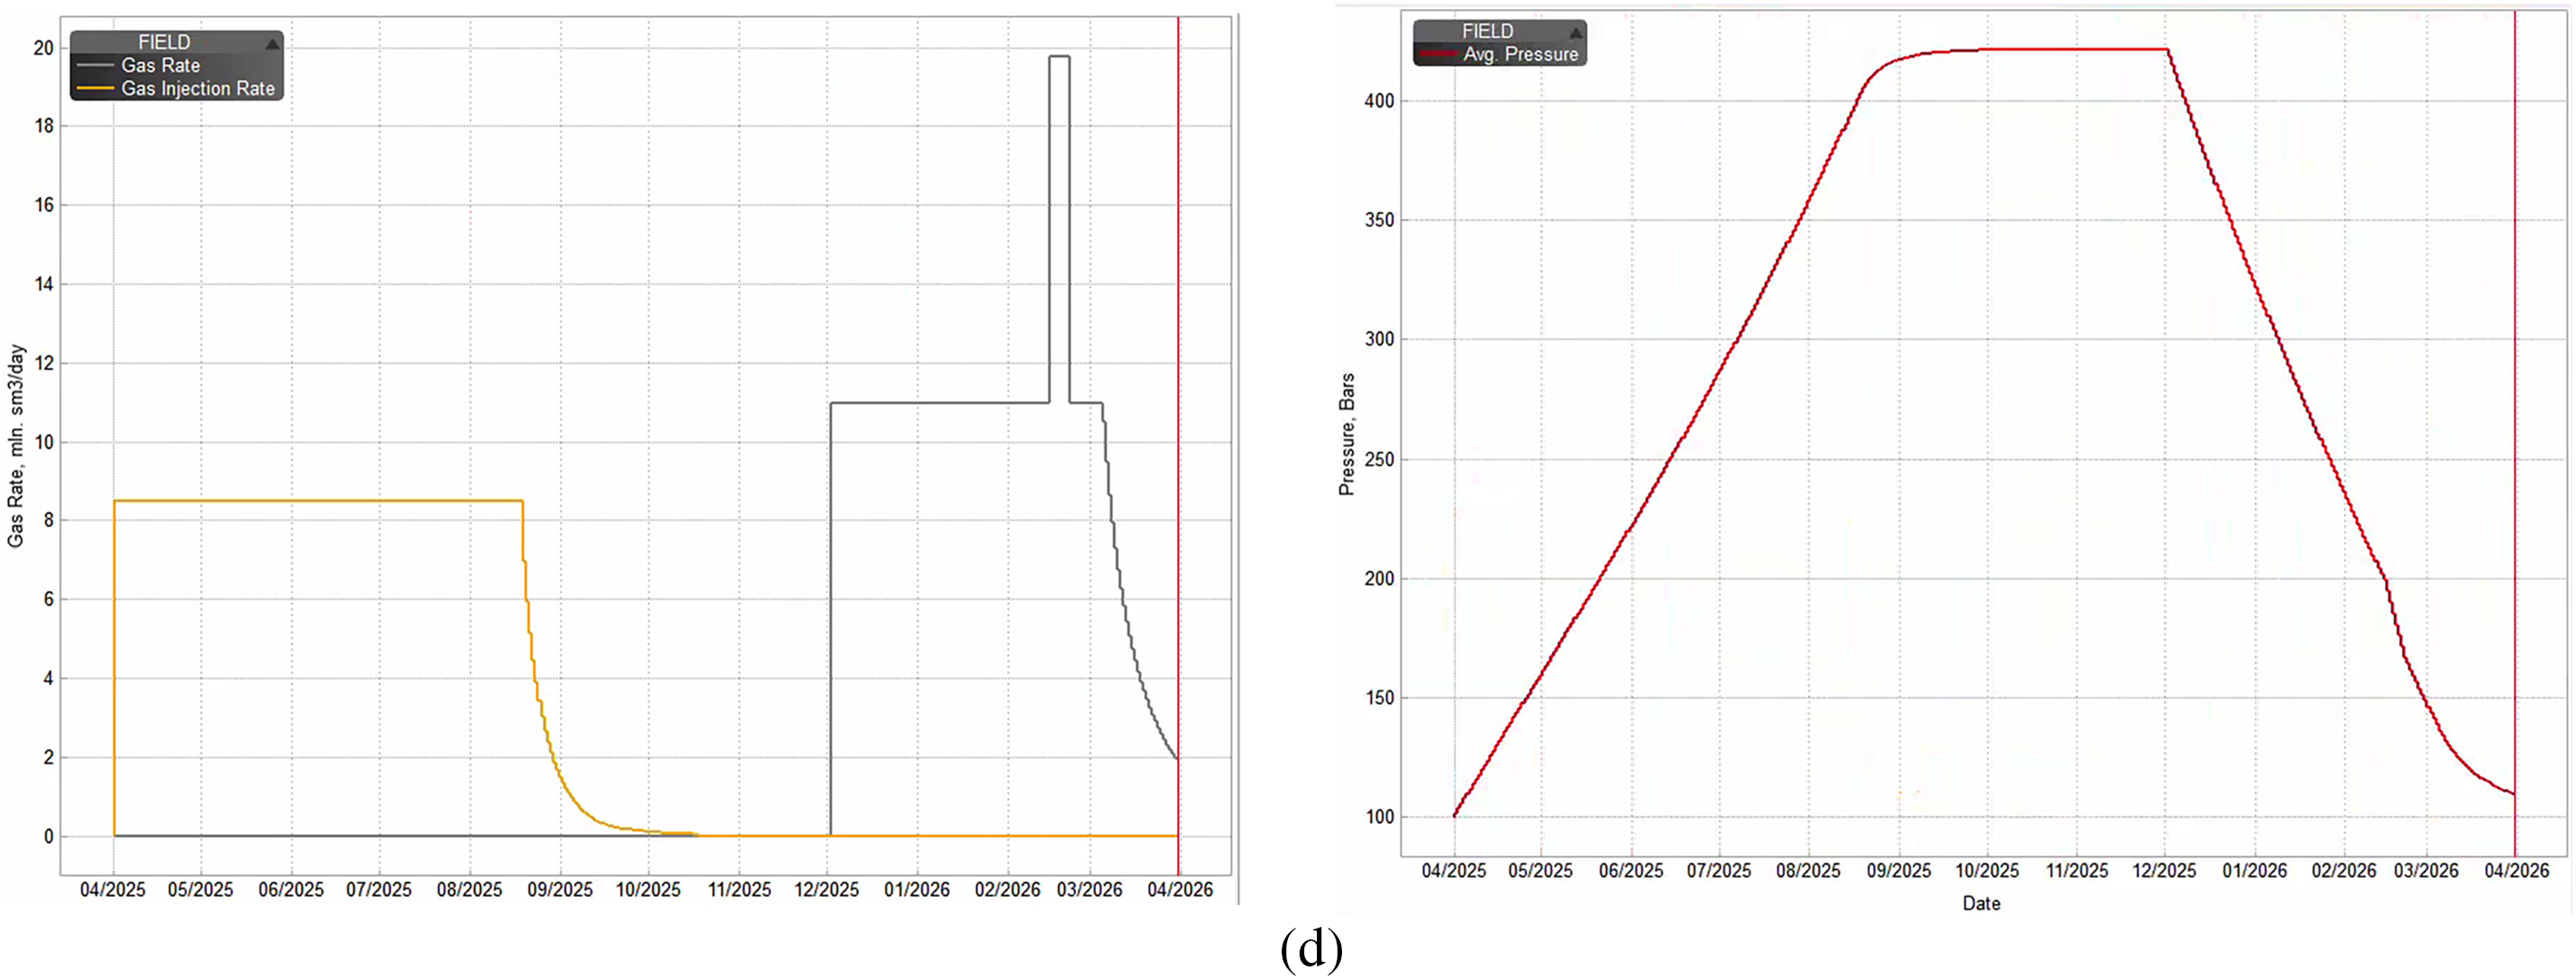
Figure 26: Simulation results of injection and production rate and formation pressure: (a) Scheme 1; (b) Scheme 2; (c) Scheme 3; (d) Scheme 4
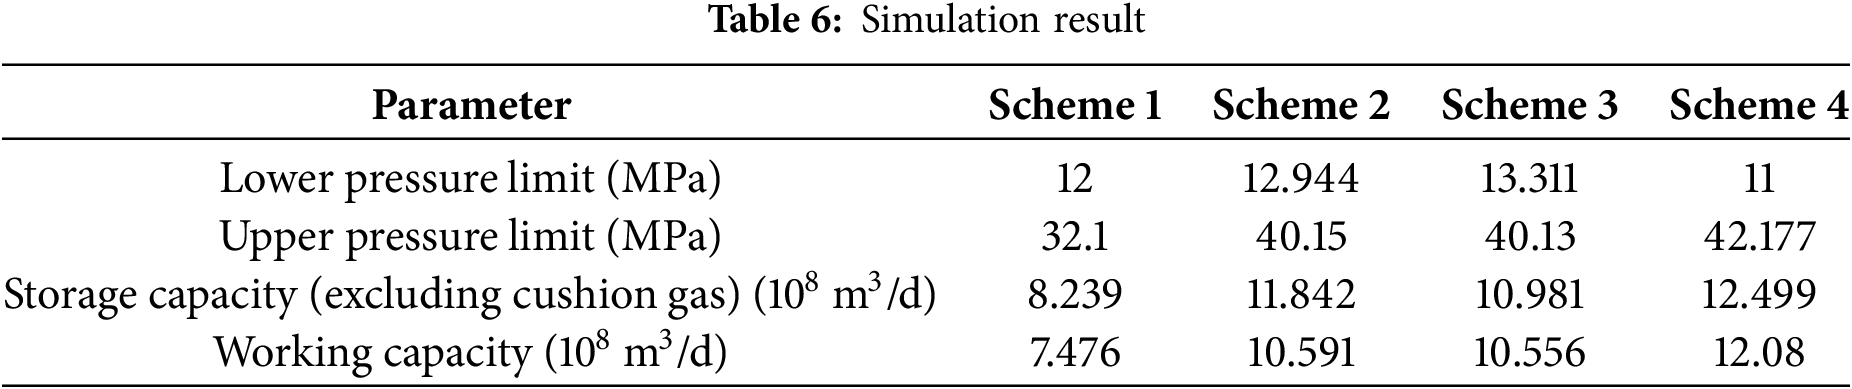
According to the simulation results, Scheme 4 has the largest working gas volume, followed by Schemes 2 and 3, while Scheme 1 has the smallest. Although Scheme 4 provides the highest working gas volume, its upper pressure limit exceeds the fracture pressure of the T gas storage facility, making it unsuitable for safe operation. Schemes 2 and 3 have similar working gas volumes, but Scheme 3 features a higher lower pressure limit and fewer operating wells, significantly reducing surface investment costs. Therefore, Scheme 3 is the optimal choice among the four. Compared to Scheme 3, the new method not only significantly increases the working gas volume of the T gas storage facility based on the simulation results, but also greatly improves peak-shaving capacity. It means that the optimization results are more reliable than that of the traditional.
Although the new method effectively accelerates model convergence and improves gas storage operational safety and peak-shaving performance, actual gas storage operations involve various uncertainties. Future research should further integrate real-world operational data and explore additional factors affecting gas production optimization in underground gas storage.
(1) To address the challenge of multi-parameter coupling optimization under extreme peak shaving conditions in gas storage, this work innovatively integrates the binomial productivity equation and the material balance equation for closed gas reservoirs, and establishes a multi-factor collaborative optimization model constrained by dynamic gas production rates to meet extreme peak shaving requirements.
(2) By introducing the Genetic Algorithm (GA), the study effectively resolves the stability issues associated with solving high-dimensional nonlinear constrained optimization models, and enhances the optimization process’s reliability.
(3) This method identifies a more precise range of constraints by considering geological characteristics, compressor performance, and extreme peak shaving capacity, accelerating the convergence speed of the optimization method.
(4) When the T gas storage facility operates under the optimized parameter combination (upper pressure limit of 41.51 MPa, lower pressure limit of 11.7 MPa, maximum injection rate of 980.98 × 10⁴ m3/d, maximum gas production rate of 958.23 × 10⁴ m3/d, and 8 active injection/production wells), the working gas volume reaches its maximum, achieving 94% of the theoretical peak value while fully satisfying extreme peak shaving requirements.
Acknowledgement: We acknowledge the financial support of Science and Technology Research Program of Chongqing Municipal Education Commission.
Funding Statement: This work is supported by the Science and Technology Research Program of Chongqing Municipal Education Commission (KJQN202401501, KJZD-M202401501).
Author Contributions: The authors confirm contribution to the paper as follows: study conception and design: Shilai Hu, Wei Zhang; data collection: Yaling Yang, Xiaoping Wang, Shichang Liu, Huiqing Qi; analysis and interpretation of results: Anqi Zhao, Ling Gou, Li Chen; draft manuscript preparation: Yuming Luo, Wei Zhang. All authors reviewed the results and approved the final version of the manuscript.
Availability of Data and Materials: The data that support the findings of this study are available from the corresponding author, upon reasonable request.
Ethics Approval: Not applicable.
Conflicts of Interest: The authors declare no conflicts of interest to report regarding the present study.
References
1. Bugaje AAB, Dioha MO, Abraham-Dukuma MC, Wakil M. Rethinking the position of natural gas in a low-carbon energy transition. Ener Res Socl Sci. 2022;90(11):102604. doi:10.1016/j.erss.2022.102604. [Google Scholar] [CrossRef]
2. Zhuang X, Wang W, Su Y, Shi M, Dai Z. Life-cycle prediction and optimization of sequestration performance in CO2 mixture huff-n-puff development for tight hydrocarbon reservoirs. Appl Energy. 2025;388(4):125618. doi:10.1016/j.apenergy.2025.125618. [Google Scholar] [CrossRef]
3. Zhang J, Tan Y, Zhang T, Yua K, Wang X, Zhao Q. Natural gas market and underground gas storage development in China. J Energy Storage. 2020;29:101338. doi:10.1016/j.est.2020.101338. [Google Scholar] [CrossRef]
4. Zheng D, Xu H, Wang J, Sun J, Zhao K, Li C, et al. Key evaluation techniques in the process of gas reservoir being converted into underground gas storage. Pet Explor Dev. 2017;44(5):840–9. doi:10.1016/S1876-3804(17)30095-2. [Google Scholar] [CrossRef]
5. Wei G, Zheng Y, Qiu X, Sun J, Shi L, Lai X. Geological theory and application of underground gas storage in China. Acta Pet Sin. 2019;40(12):1519. doi:10.7623/syxb201912011. [Google Scholar] [CrossRef]
6. Di Sante SG, Castelnuovo MD, Rubino A. Chapter 4—energy transportation: gas. In: Handbook of energy economics and policy: fundamentals and applications for engineers and energy planners. 1st ed. Cambridge, MA, USA: Academic Press; 2021. p. 153–91. doi:10.1016/B978-0-12-814712-2.00004-X. [Google Scholar] [CrossRef]
7. Zhu X. Multi-objective optimization prediction model of gas production of gas storage. Oil Gas Stor Transp. 2024;43(1):96–102. doi:10.6047/j.issn.1000-8241.2024.01.011. [Google Scholar] [CrossRef]
8. Zhou J, Peng J, Luo S, Sun J, Liang G, Peng C. Optimization of gas in-jection and production in gas storage based on large depleted gas reservoir with consideration of safe and stable operation. Spec Oil Gas Reserv. 2021;28(6):76–82. (In Chinese). doi:10.3969/j.issn.1006-6535.2021.06.010. [Google Scholar] [CrossRef]
9. Zhang Y, Oldenburg CM, Zhou Q, Pan L, Freifeld BM, Jeanne P, et al. Advanced monitoring and simulation for underground gas storage risk management. J Pet Sci Eng. 2022;208(1):109763. doi:10.1016/j.petrol.2021.109763. [Google Scholar] [CrossRef]
10. Zhou J, Zhou L, Liang G, Wang S, Fu T, Zhou X, et al. Optimal design of the gas storage surface pipeline system with injection and withdrawal conditions. Petroleum. 2021;7(1):102–16. doi:10.1016/j.petlm.2020.05.003. [Google Scholar] [CrossRef]
11. Reitenbach V, Ganzer L, Albrecht D, Hagemann B. Influence of added hydrogen on underground gas storage: a review of key issues. Env Earth Sci. 2015;73(11):6927–37. doi:10.1007/s12665-015-4176-2. [Google Scholar] [CrossRef]
12. Soroush M, Alizadeh N. Underground gas storage in a partially depleted gas reservoir. J Can Pet Technol. 2008;47(2):PETSOC-08-02-17-TN. doi:10.2118/08-02-17-tn. [Google Scholar] [CrossRef]
13. Rajabi Moshtaghi H, Toloie Eshlaghy A, Motadel MR. A comprehensive review on meta-heuristic algorithms and their classification with novel approach. J Appl Res Indust Eng. 2021;8(1):63–89. doi:10.22105/JARIE.2021.238926.1180. [Google Scholar] [CrossRef]
14. Liu J, Liu D, Qian B, Zhai Y, Feng M. Optimization of energy-saving operation in underground gas storage injection based on NSGA_II. Nat Gas Indus. 2017;37(1):160–6. (In Chinese). [Google Scholar]
15. Xu S, Zhang Q, Li X, Gai Z, Wen P, Wei Q. Optimization design of injection/production parameters of Jintan salt-cavern gas storage. Oil Drill Prod Technol. 2020;42(4):490–6. (In Chinese). doi:10.13639/j.odpt.2020.04.020. [Google Scholar] [CrossRef]
16. Du R, Jing Y, Meng L, Zhang H. Optimization of gas storage based on improved multi-objective particle swarm optimization algorithm. J Shandong Univ (Eng Sci). 2024;54(4):42–50. (In Chinese). doi:10.1109/icdsis61070.2024.10594274. [Google Scholar] [CrossRef]
17. Katoch S, Chauhan SS, Kumar V. A review on genetic algorithm: past, present, and future. Multimed Tools Appl. 2021;80(5):8091–126. doi:10.1007/s11042-020-10139-6. [Google Scholar] [PubMed] [CrossRef]
18. Guilmeau T, Chouzenoux E, Elvira V. Simulated annealing: a review and a new scheme. In: 2021 IEEE Statistical Signal Processing Workshop (SSP); 2021 Jul 11–14; Rio de Janeiro, Brazil. p. 101–5. [Google Scholar]
19. Shami TM, El-Saleh AA, Alswaitti M, Al-Tashi Q, Summakieh MA, Mirjalili S. Particle swarm optimization: a comprehensive survey. IEEE Access. 2022;2022(10):10031–61. doi:10.1109/access.2022.3142859. [Google Scholar] [CrossRef]
20. Dorigo M, Blum C. Ant colony optimization theory: a survey. Theor Comput Sci. 2005;344(2–3):243–78. doi:10.1016/j.tcs.2005.05.020. [Google Scholar] [CrossRef]
21. Ahmed ZH, Yousefikhoshbakht M. An improved tabu search algorithm for solving heterogeneous fixed fleet open vehicle routing problem with time windows. Alex Eng J. 2023;64(2):349–63. doi:10.1016/j.aej.2022.09.008. [Google Scholar] [CrossRef]
22. Kaya E, Gorkemli B, Akay B, Karaboga D. A review on the studies employing artificial bee colony algorithm to solve combinatorial optimization problems. Eng Appl Artif Intell. 2022;115(3):105311. doi:10.1016/j.engappai.2022.105311. [Google Scholar] [CrossRef]
23. Ahmad MF, Isa NAM, Lim WH, Ang KM. Differential evolution: a recent review based on state-of-the-art works. Alex Eng J. 2022;61(5):3831–72. doi:10.1016/j.aej.2021.09.013. [Google Scholar] [CrossRef]
24. Xia X, Gui L, Zhang Y, Xu X, Yu F, Wu H, et al. A fitness-based adaptive differential evolution algorithm. Inf Sci. 2021;549(5):116–41. doi:10.1016/j.aej.2021.09.013. [Google Scholar] [CrossRef]
25. Sharma V, Tripathi AK. A systematic review of meta-heuristic algorithms in IoT based application. Array. 2022;14(1):100164. doi:10.1016/j.array.2022.100164. [Google Scholar] [CrossRef]
26. Agarwal T, Kumar V. A systematic review on bat algorithm: theoretical foundation, variants, and applications. Arch Comput Methods Eng. 2022;29(5):2707–36. doi:10.1007/s11831-021-09673-9. [Google Scholar] [CrossRef]
27. Kumar V, Kumar D. A systematic review on firefly algorithm: past, present, and future. Arch Comput Methods Eng. 2021;28(4):3269–91. doi:10.1007/s11831-020-09498-y. [Google Scholar] [CrossRef]
28. Alhijawi B, Awajan A. Genetic algorithms: theory, genetic operators, solutions, and applications. Evol Intell. 2024;17(3):1245–56. doi:10.1007/s12065-023-00822-6. [Google Scholar] [CrossRef]
29. Papazoglou G, Biskas P. Review and comparison of genetic algorithm and particle swarm optimization in the optimal power flow problem. Energies. 2023;16(3):1152. doi:10.3390/en16031152. [Google Scholar] [CrossRef]
30. Cavallaro C, Cutello V, Pavone M, Zito F. Machine learning and genetic algorithms: a case study on image reconstruction. Knowl Based Syst. 2024;284(6):111194. doi:10.1016/j.knosys.2023.111194. [Google Scholar] [CrossRef]
31. Lu J, Zhang F, Guang W, Wu Y, Tao R, Li X, et al. Optimization of blade geometry of savonius hydrokinetic turbine based on genetic algorithm. Energy Eng. 2023;120(12):2819–37. doi:10.32604/ee.2023.042287. [Google Scholar] [CrossRef]
Cite This Article
 Copyright © 2025 The Author(s). Published by Tech Science Press.
This work is licensed under a Creative Commons Attribution 4.0 International License , which permits unrestricted use, distribution, and reproduction in any medium, provided the original work is properly cited.
 Downloads
 Citation Tools