
 Submit a Paper
 Propose a Special lssue
 Open Access
ARTICLE

Park Integrated Energy System Optimization Considering Carbon Excess Ratio and Electric Vehicle Coupling
School of Electrical Engineering, Shanghai Dianji University, Shanghai, 201306, China
* Corresponding Author: Ximin Cao. Email:
(This article belongs to the Special Issue: Advanced Analytics on Energy Systems)
Energy Engineering 2025, 122(8), 3377-3398. https://doi.org/10.32604/ee.2025.066577
Received 11 April 2025; Accepted 04 June 2025; Issue published 24 July 2025
 View Full Text
 Download PDF
Abstract
Under the “dual carbon” goals, this paper constructs an optimization model of the comprehensive energy system in the park. A stepwise carbon excess rate mechanism and an electric vehicle coupling strategy are proposed: A carbon quota trading system is established based on the baseline method, and the stepwise function is adopted to quantify the cost of excess carbon emissions; Introduce the price demand response and the two-way interaction mechanism of electric Vehicle vehicle-to-grid (V2G) to enhance the flexible regulation ability. Aiming at the uncertainty of wind and solar output, a typical scene set is generated by combining Latin hypercube sampling with the scene reduction method. The goal is to minimize the operating cost and maximize the consumption of renewable energy, and it is solved through the CPLEX solver in the MATLAB platform. Through simulation verification of the proposed models and methods in various scenarios, the simulation results show that under the coupling of the carbon excess rate trading mechanism, the demand response mechanism, and the vehicle-to-grid interaction of electric vehicles, the total daily operating cost of the system decreases by 25.3%, reduce the dual pressure of energy consumption costs and the economic environment, and achieve the coordinated optimization of economic and ecological benefits.Keywords
The multi-energy service sector faces strategic imperatives to reconcile service delivery mechanisms with the nationally articulated carbon mitigation trajectory: 2030 emission zenith followed by 2060 net-zero equilibrium [1]. As an efficient and clean energy supply model, the regional integrated energy system focuses on the planning, design, construction, operation, and service of electricity, heat, cooling, and gas systems, system architectural strata, including input reservoirs, are constructed through hierarchical organization, networks, loads, and storage. The integrated energy systems play an increasingly important role in reducing carbon emissions and energy costs [2]. Decarbonized operational optimization in multi-energy networks is principally concentrated on dual dimensions: Implementation of a carbon trading mechanism from the power side and the reduction of carbon emissions by guiding users’ electricity consumption behavior from the load side [3].
From the perspective of power supply, the carbon trading mechanism is one of the most effective emission reduction measures under the current low-carbon background. User’s enthusiasm for energy conservation and emission reduction is improved through the allocation of carbon emission rights. Based on the stepped carbon trading mechanism and the green certificate trading mechanism [4], a green certificate-carbon trading mechanism model is designed to effectively reduce carbon emissions. Literature [5] proposes a multi-tiered carbon pricing framework and constructs a stratified computational framework for emission-bound cost quantification. Literature [6] proposes an optimization framework integrating demand-side flexibility with progressive carbon pricing, developing a cross-sectoral demand management paradigm that synergistically combines dynamic time-of-use tariff structures with performance-based incentive mechanisms across multiple energy vectors. The tiered carbon market architecture [7] establishes an adaptive emission quantification framework, systematically guiding operational entities in developing multi-tiered accounting paradigms while synergistically coordinating emission trajectory optimization with Paris Agreement compliance pathways, promoting in effectiveness in low-carbon aspects. The above literatures have made corresponding measures to achieve synergistic decarbonization while optimizing lifecycle economic impacts through the integration of marginal abatement cost analysis and system dynamics modeling, ensuring compliance with the Paris Agreement’s carbon neutrality trajectory, the emission bracket segmentation in conventional tiered carbon markets is determined by quota transgression magnitudes, which cannot intuitively reflect the excess carbon emissions. The established carbon emissions model is relatively simple.
On the load side, carbon efficiency in energy networks is optimized by coordinating consumer-end flexible reserves through demand response mechanisms. At present, the electric vehicle industry is developing rapidly, and its synergy with electricity, renewable energy, energy storage is recognized as a critical enabler for system-level energy conservation and greenhouse gas mitigation within integrated energy systems. The probabilistic behavior of electric vehicles in grid-connected operation modes and bidirectional power flow dynamics [8] is mitigated through stochastic operational optimization frameworks, this study develops a stochastic-optimized dispatch framework leveraging mobility behavior analytics and transportation-energy nexus patterns, incorporating multi-agent reinforcement learning architecture to reconcile EV flexibility with power system stability and market equilibrium. Literature [9] demonstrates enhanced power transfer efficiency across integrated energy networks and electric vehicle charging stations through a two-tiered actor-critic algorithmic implementation. Literature [10] proposes a hierarchical co-optimization architecture for coupled energy infrastructures, revealing charging mode-specific perturbation effects on multi-energy nexus operational envelopes. The capacity configuration of the charging load and source-load uncertainty of electric vehicles [11], as well as the complementarity with the grid load, were considered. Literature [12] adjusts the abandoned air volume and equipment output in the two modes of grid connection and island were used to improve the utilization rate of renewable energy. The study [13] proposes a geospatial intelligence-driven optimization framework integrating multi-objective site suitability analysis and urban mobility pattern recognition, leveraging graph neural networks (GNNs) and spatial-temporal demand forecasting to enhance equitable EV charging infrastructure deployment across the Greater Glasgow region, with computational workflows aligned to the EU Alternative Fuels Infrastructure Directive (AFID) accessibility metrics. The above studies all analyzed the synergy between electric vehicles and integrated energy systems, but did not analyze the return journey, departure journey, and daily mileage of electric vehicles, which will reduce the rational use of energy to a certain extent.
In summary, this study proposes a comprehensive energy optimization strategy for parks considering the carbon excess rate and electric vehicles. Latin hypercube sampling was adopted to model the uncertainty analysis of the wind and solar power in a power system. Based on this basis, this research develops a dynamic carbon pricing architecture with multi-tiered emission intensity thresholds, incorporating adaptive penalty-reward mechanisms and real-time carbon flow tracing to establish marginal abatement cost-optimized pricing corridors, while ensuring alignment with EU ETS benchmarks and IPCC carbon budget compliance pathways. Integrate the vehicle-to-power grid collaborative dispatching mechanism and optimize the charging and discharging behaviors based on carbon intensity signals. Finally, through a numerical example simulation, it is verified that the model proposed in this paper can improve the economy and reliability of the system operation, facilitating robust advancement toward the industrial precinct’s dual objectives of energy efficiency enhancement and carbon mitigation commitments.
2 Construction of Integrated Energy System Model in the Park
2.1 Park Integrated Energy System Framework
The hybrid energy nexus architected in this study for the industrial precinct encompassed four distinct energy vectors: electricity, heat, cold, and gas. The main equipment includes wind turbines (WT), photovoltaic power (PV), combined cooling, heating, and power (CCHP), gas boiler (GB), electric heating boiler (EB), electric refrigerator (ER), fuel cell (FC), power-to-gas equipment (power to gas, P2G), electric energy storage equipment (ES), thermal energy storage equipment (HS), cold energy storage equipment (CS), and other units [14]. The structure of an integrated energy system is shown in Fig. 1.
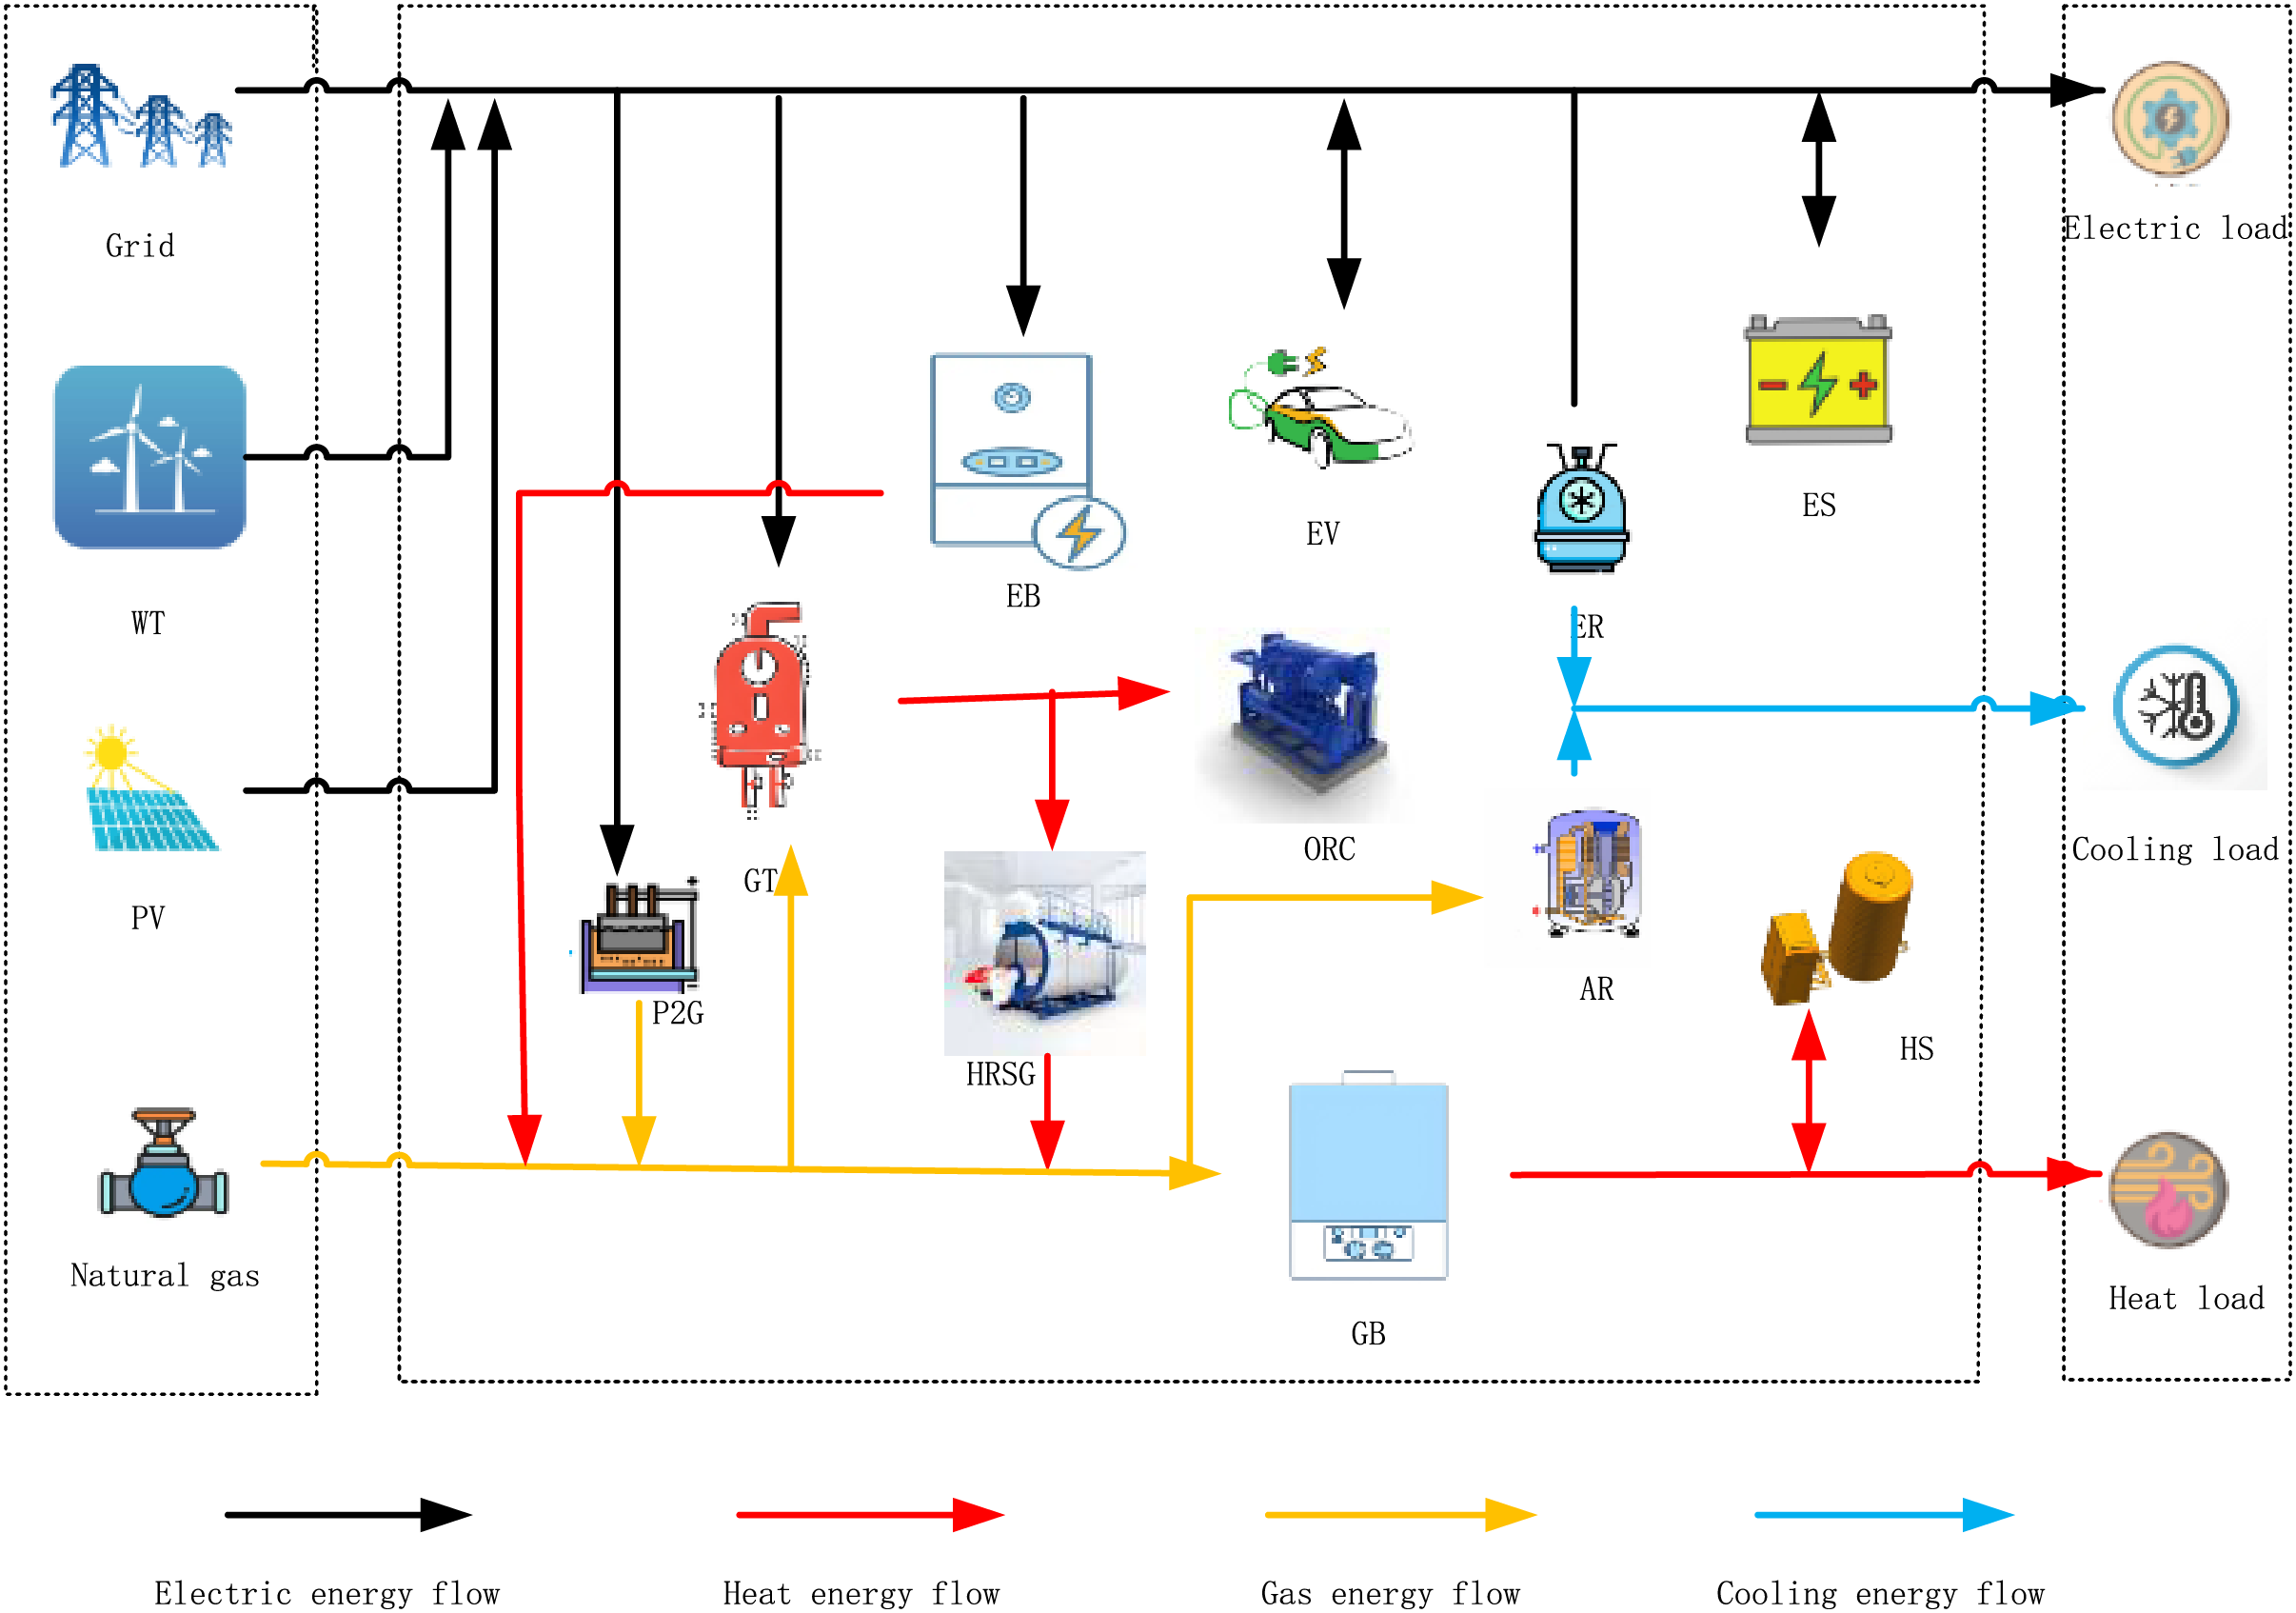
Figure 1: System flow chart
2.2.1 Photovoltaic Power Generation Model
In the formula,
2.2.2 Wind Power Generation Model
In the formula,
2.2.3 Cooling, Heating and Power System Model
The CCHP unit is the core energy-flow coupling device in the integrated energy network of the park. The primary thermodynamic conversion chain comprises a natural gas-fired turbine, a heat recovery steam generator, and a thermally-driven refrigeration unit. Natural gas as the principal energy carrier in the chemical-to-power conversion chain, undergoing cascade conversion through combined cooling, heating, and power systems to yield coordinated outputs of electricity, thermal energy, and thermal energy harvesting capacity for refrigeration, which enables multi-vector energy replacement across integrated systems [16].
In the formula,
In the formula,
2.2.5 Electric Refrigerator Model
In the formula,
2.2.6 Power-to-Gas (P2G) Device Model
P2G equipment has relatively low energy conversion efficiency and generates natural gas by consuming electricity.
In the formula,
2.3 Ladder Carbon Trading Model for Carbon Excess Ratio
In this study, implementation of the park-level integrated energy system enabled the determination of unallocated carbon quotas using standardized baseline comparative analysis. The park’s greenhouse gas emissions predominantly originated from grid-sourced electricity procurement, combined heat-power co-production systems integrated with natural gas combustion modules. The main consideration is that most of the purchased electricity comes from the conventional generator sets of coal-fired power plants. Mathematical formulations defining the park’s authorized emission limits vs. its realized discharge volumes are presented below [15]. Its carbon emission allowances
In the formula,
Actual carbon emission model
In the formula,
The interval demarcation in the tiered carbon pricing mechanism was determined by threshold exceedance levels relative to allocated quotas, resulting in limited visual representation of cumulative excess emissions. Most of these are reflected in the economy. For enterprises or parks of different sizes, there are shortcomings in their narrow application scope [18]. This study proposes a stepped carbon trading model that considers the excess carbon rate. The carbon excess rate refers to the ratio of actual carbon emissions to carbon allowances. Synthesizing tiered carbon pricing mechanisms with emission overshoot metrics, this study establishes an innovative carbon market framework incorporating dynamic excess rate modulation [19].
The calculation method for carbon surplus ratio is presented below:
The tiered computational framework for carbon trading cost determination is presented below:
The parametric interdependence of allowance pricing tiers and discharge surplus indices in the multi-threshold emission trading system is algorithmically mapped in Fig. 2 [15].
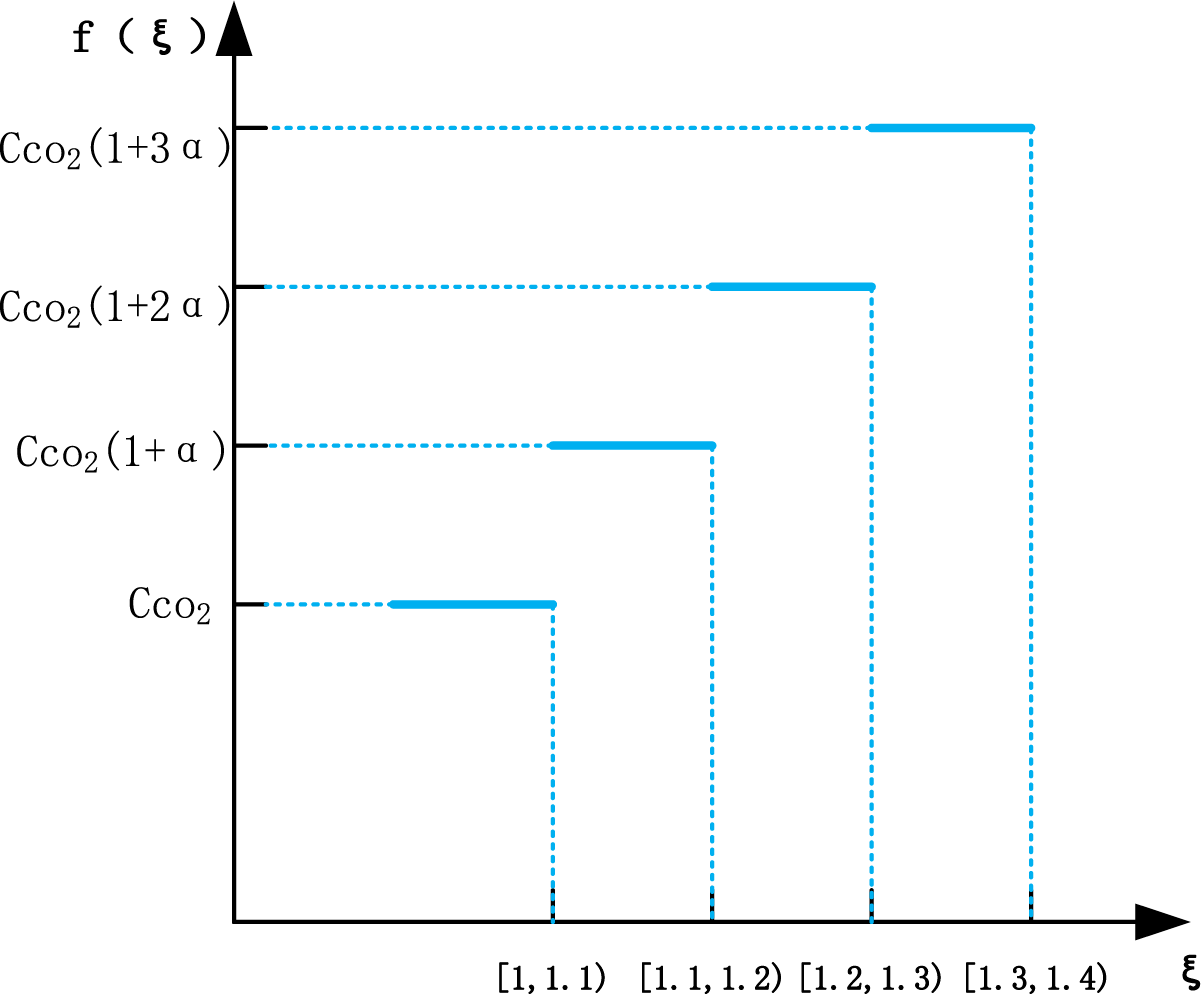
Figure 2: Relationship between carbon trading price and carbon excess rate
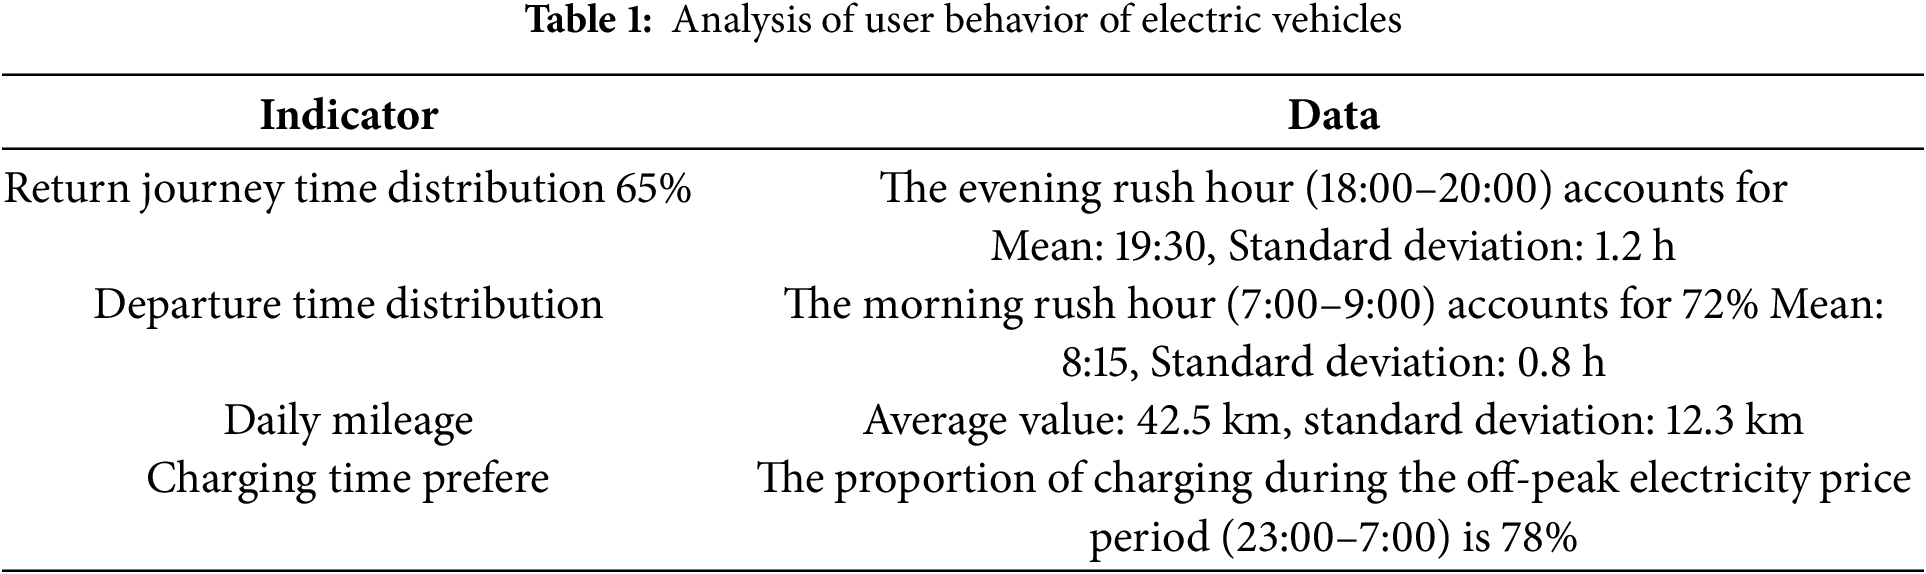
According to the statistics of the US Department of Transportation, EV usage time and travel are normally distributed. When modeling, the default is that the EV will be connected to the power grid when residents go home and leave when they travel the next day. It can be approximated that the return and departure times of EV in the park correspond to Eqs. (20) and (21).
In the formula,
The statistical analysis reveals that daily mileage adheres to a log-normal distribution framework, with its probability density function specifications provided thereafter.
In the formula,
Based on a dataset made public by the transportation committee of a certain area, covering the GPS trajectory data of 3000 EVs, their behaviors were analyzed. The technical specifications applied are itemized within the subsequent Table 1 below.
3 Park Comprehensive Energy Optimization Scheduling Model
This research establishes a mathematical formulation where system operation expenditures are minimized through daily operational cost quantification, as detailed in the subsequent framework.
In the formula,
In the formula, T is the dispatching period (h);
In the formula,
In the formula,
In the formula,
In the formula,
In the formula,
3.2.1 Wind PV Output Constraints
In the formula,
In the formula,
3.2.4 Energy Storage Equipment Constraints
Enhanced operational flexibility in integrated energy networks is achieved through the deployment of multi-energy storage systems, while a standardized modeling framework ensures parametric consistency across homogeneous storage architectures.
In the formula,
3.2.5 Waste Heat Recovery Boiler Constraints
In the formula,
3.2.6 Electric Power Balance Constraints
In the formula,
3.2.7 Thermal Power Balance Constraint
In the formula,
3.2.8 Natural Gas Balance Constraint
In the formula,
The optimization procedure for the park’s multi-energy system involves energy flow coordination across distributed resources, because the uncertain wind and solar output will affect the system configuration, this study used Latin Hypercube Sampling (LHS) to process the wind and solar prediction results and generate the initial scene. Enhanced sampling precision is achieved through Latin Hypercube Sampling when implementing methodology under constrained sample sizes. It is a stratified sampling technology. The wind and solar outputs are set to follow a normal distribution to realize large-scale generation of the scene [21]. Scene optimization employs the probability distance fast-reduction algorithm to achieve computational efficiency in high-dimensional modeling. After processing, the results shown in Fig. 3 below are obtained.
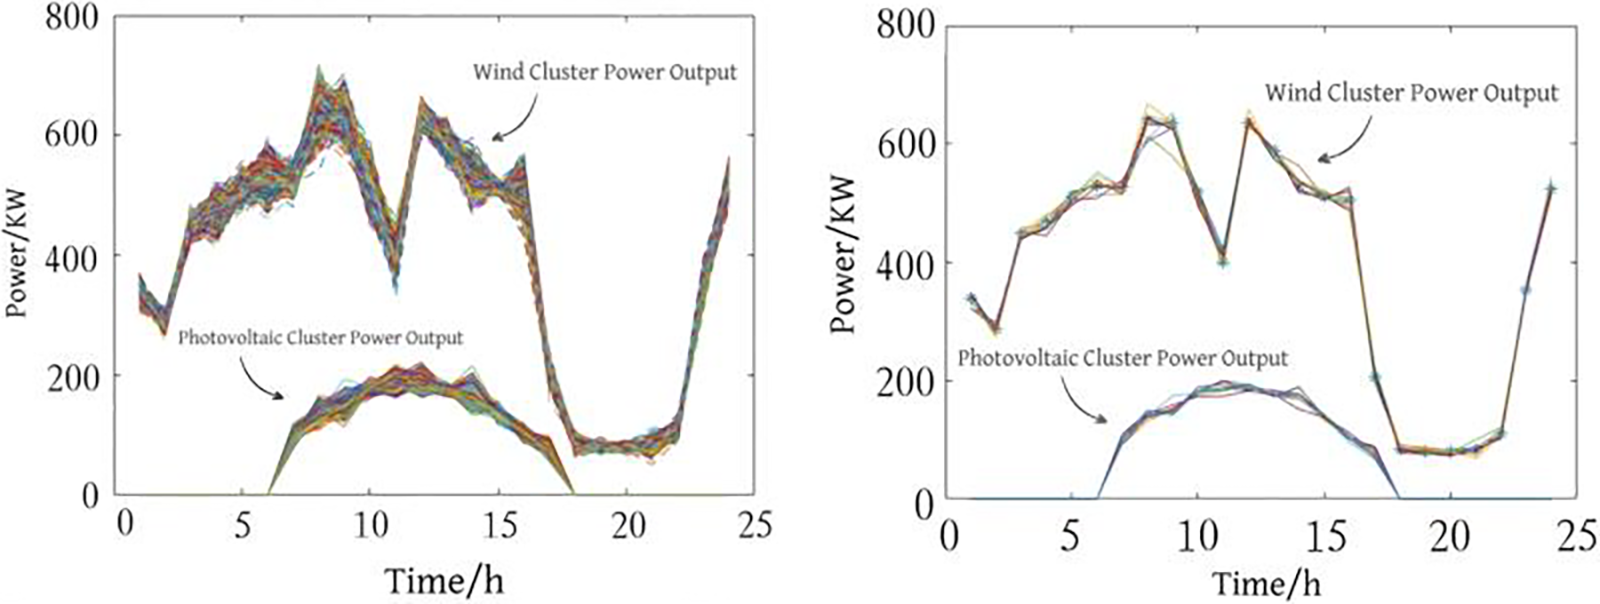
Figure 3: Source charge sampling processing
The integrated energy system of a park in a designated region is exemplified as the case study for analysis, the simulation optimization results were obtained by setting different system models and compared with the model applied in this study. Among them, natural gas pricing parameters are quantified at 2.18 ¥/m3, the electricity price in the normal period is 0.425 ¥/kWh, the diurnal pricing regime establishes 0.575 ¥/kWh for daytime demand intervals and 0.325 ¥/kWh during nighttime supply periods.
4.2 Comparative Analysis of Different Optimization Results
The simulation-based analysis investigates how carbon surplus ratios and bidirectional EV grid interactions modulate operational results across three configurational archetypes of integrated energy systems, detailed in Table 2.
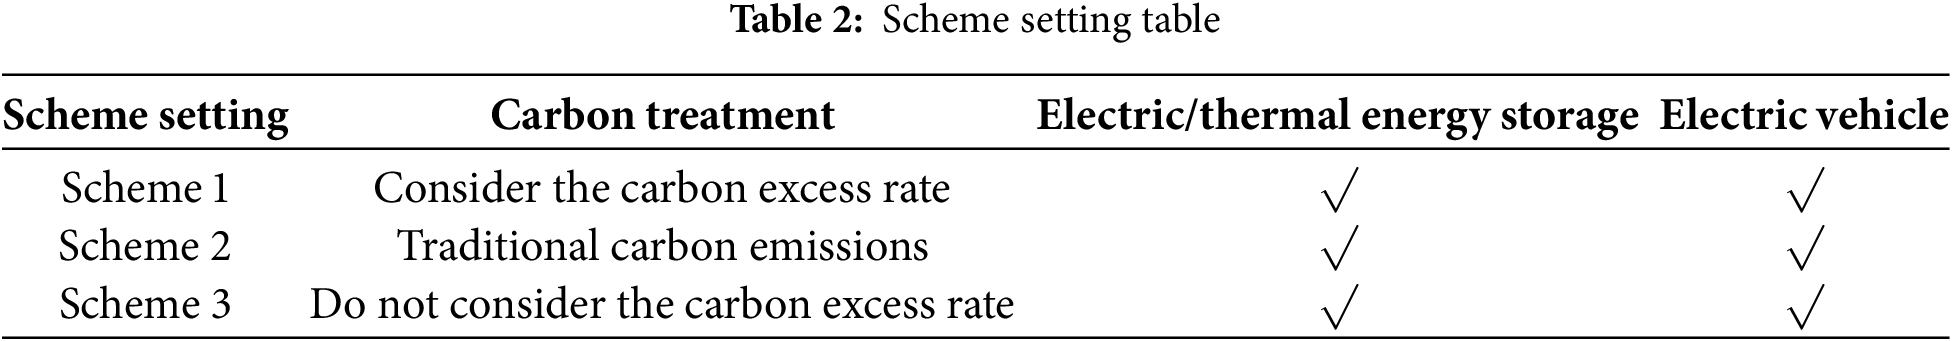
The primary strategy arises from elevated operational expenditure associated with low-carbon infrastructure investments in initial implementation phases, but in the long run, it is optimized for energy efficiency improvement and carbon cost avoidance. Renewable energy costs were lower. Regarding carbon emissions, by optimizing the carbon constraint back-forcing system, maximizing the use of renewable energy and energy storage, the lowest carbon emissions, in line with the path of carbon neutrality, and obtaining additional benefits through carbon trading. Systematized energy exchange mechanisms govern the bidirectional power flow dynamics between EVs and grid infrastructure, the carbon intensity-oriented, charging period synchronizes with the renewable energy output peak, which supports grid peak adjustment, significantly reduces charging carbon emissions, and improves grid flexibility.
The operational validation framework for secondary systems prioritizes functional integrity within baseline operational envelopes, the system’s maintenance costs are maintained at moderate levels, which balances the low cost of traditional energy and the initial emission reduction investment. Carbon emissions are moderate in terms of carbon emissions, but it is difficult to meet the deep decarbonization goal. The operational protocol for electric vehicle energy management prioritizes synchronized discharge cycles under predefined constraints, carbon emissions are slightly lower than in the “do not consider” scenario, but the optimization potential is limited.
Scheme 3 does not consider the carbon excess rate, and the system is not limited by carbon quotas. The system’s maintenance costs are maintained at moderate levels, short-term operation and maintenance costs are the lowest, but long-term changes in environmental policies or carbon tax traceability lead to increased hidden costs. Quantification of anthropogenic CO2 emissions requires lifecycle assessment frameworks for emission inventory development, carbon emissions were the highest and the negative impact on the environment was significant. Grid stability analysis demonstrates intensified demand-supply gaps under structured EV energy exchange management frameworks, the power grid regulation pressure is large, and the implied carbon footprint is high.
4.3 Analysis of Orderly Charging and Discharging of Electric Vehicles
Comparative analysis of EV bidirectional power flow regimes reveals scheme-specific performance characteristics through systematic visualization in Fig. 4.
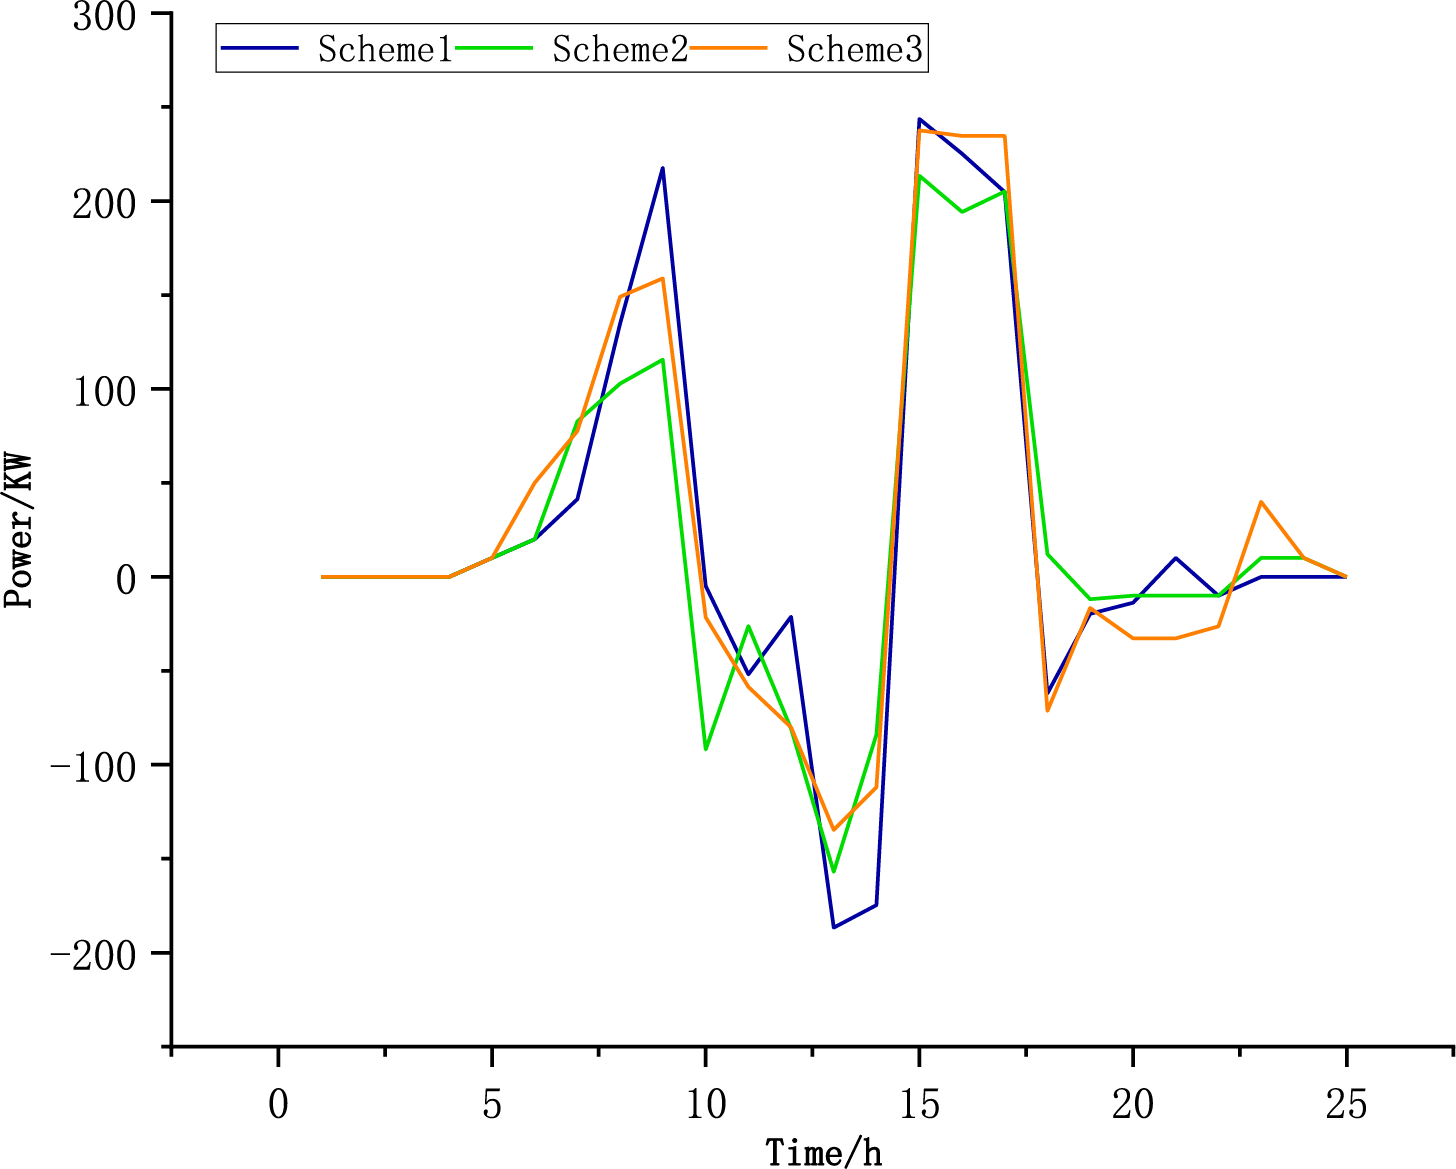
Figure 4: Orderly charging and discharging of electric vehicles
The figure shows higher charging power between 5:00–10:00 and 15:00–20:00. The peak value of the case reached 250 kW, which corresponds to the peak charging period. The reason is that the low electricity price during the night or noon photovoltaic excess period drives charging, matches the peak output of renewable energy, the process mitigates carbon emissions generated during power supply operations. The charging power decreases during the trough charging period in the range of 10:00–15:00, which is related to the increase in electricity prices or grid load. Significant discharge occurred from 20:00 to 1:00 the next day. The reason is the surge in electricity demand at night peak, electric vehicles support the grid, avoid relying on high-carbon power to meet peak loads, and reduce carbon emissions. Option 2 Users use low electricity prices at night to reduce the charging costs. During this period, the power grid relied on high-carbon baseload power supplies, resulting in higher hidden carbon emissions during charging. In this scenario, the price signal is the main one, ignoring carbon intensity. In the discharge stage, the discharge scale was small, the application of V2G technology in the reaction benchmark scenario was insufficient, and customer engagement was low. The change in charge and discharge power is gentle, and there is no significant positive or negative alternation, indicating that the scheduling strategy is mainly based on the price signal and lacks optimization of linkage with the output or carbon intensity of renewable energy. Option 3 did not consider the carbon excess rate scenario. A small increase in charging power of approximately 50–100 kW occurs from 15:00 to 20:00, which is related to the daytime replenishment demand of some users but is not coordinated with renewable energy output. The discharge power in our hour segment is close to zero, and only the abscissa 20:00–1:00 the next day has a slightly negative value, within −50 kW. Therefore, under the constraint of the carbon excess rate, the charging and discharging behavior of electric vehicles changes from “price-driven” to a typical model of “carbon-electricity co-optimization.” By actively matching renewable energy output and grid demand, not only are carbon emissions reduced, but the system economy is also improved.
4.4 Analysis of the Output Results of Each Equipment
The system electrical balances of Option 1, Option 2 and Option 3 are shown in Figs. 5–7, respectively.
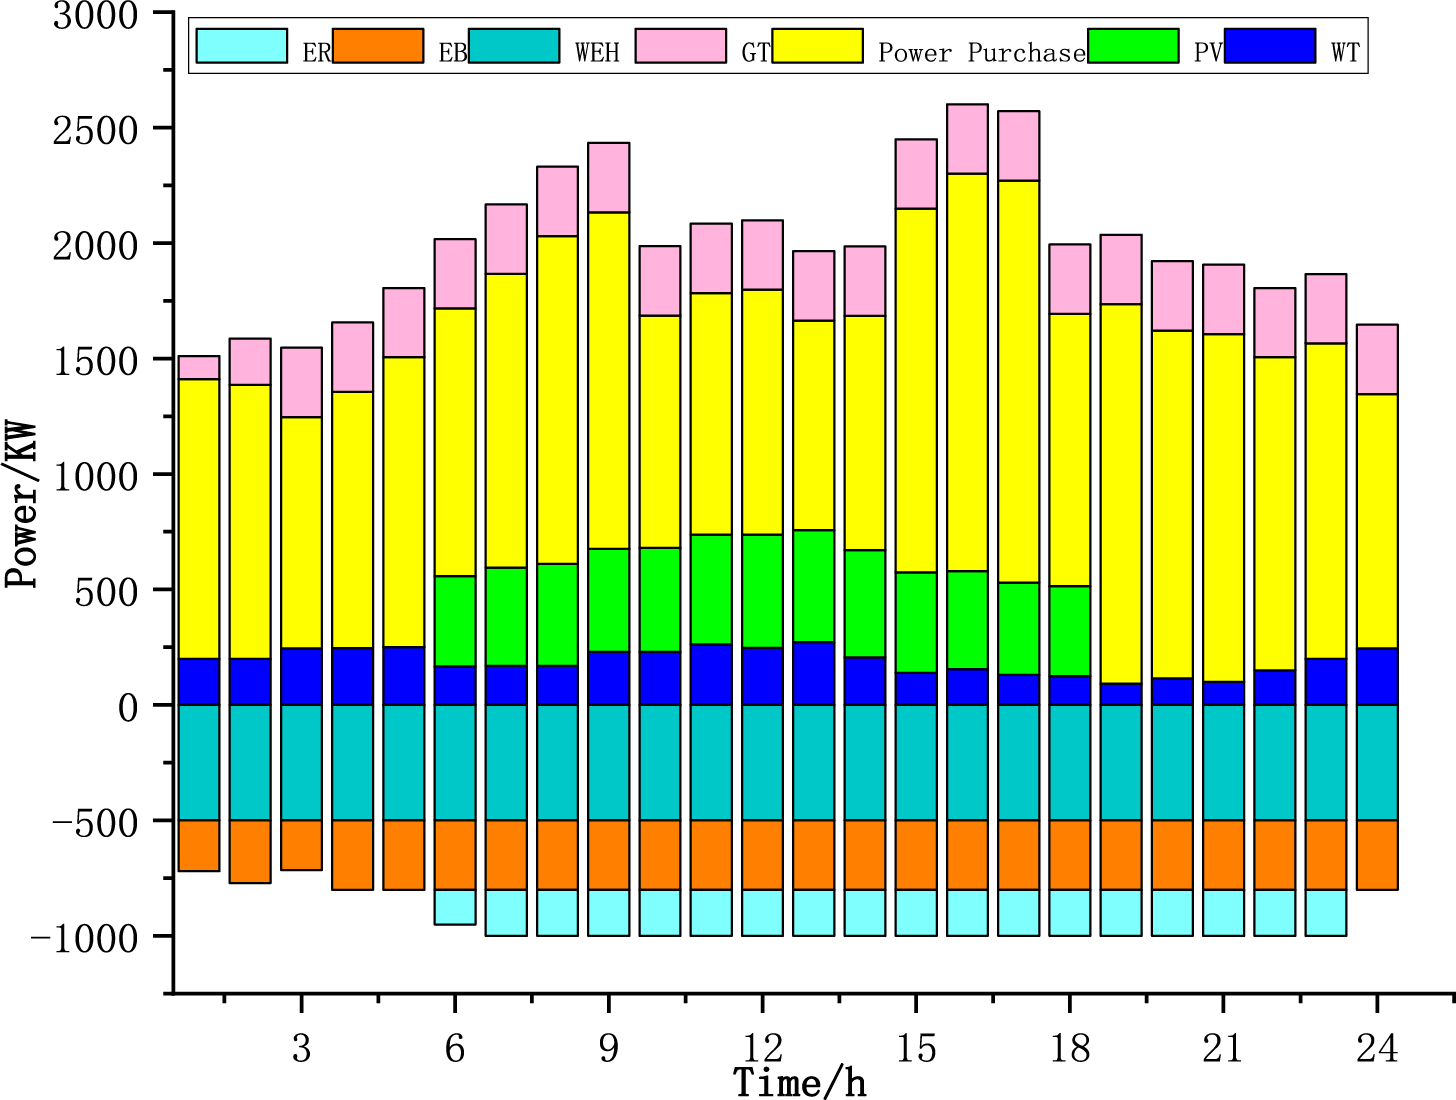
Figure 5: Scheme 1 power balance diagram
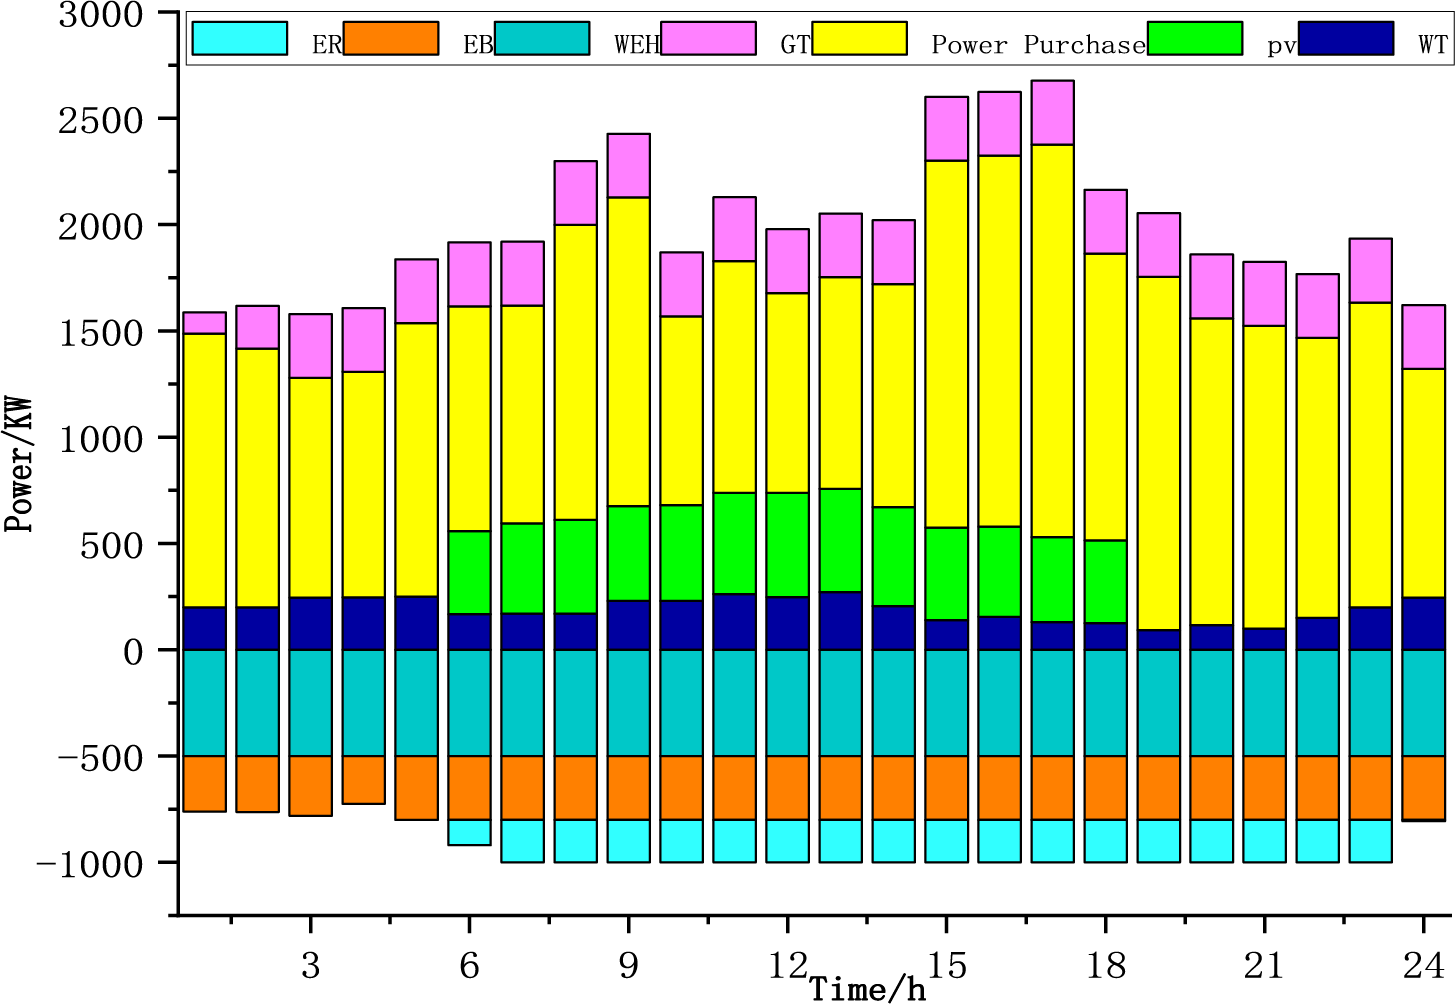
Figure 6: Scheme 2 power balance diagram
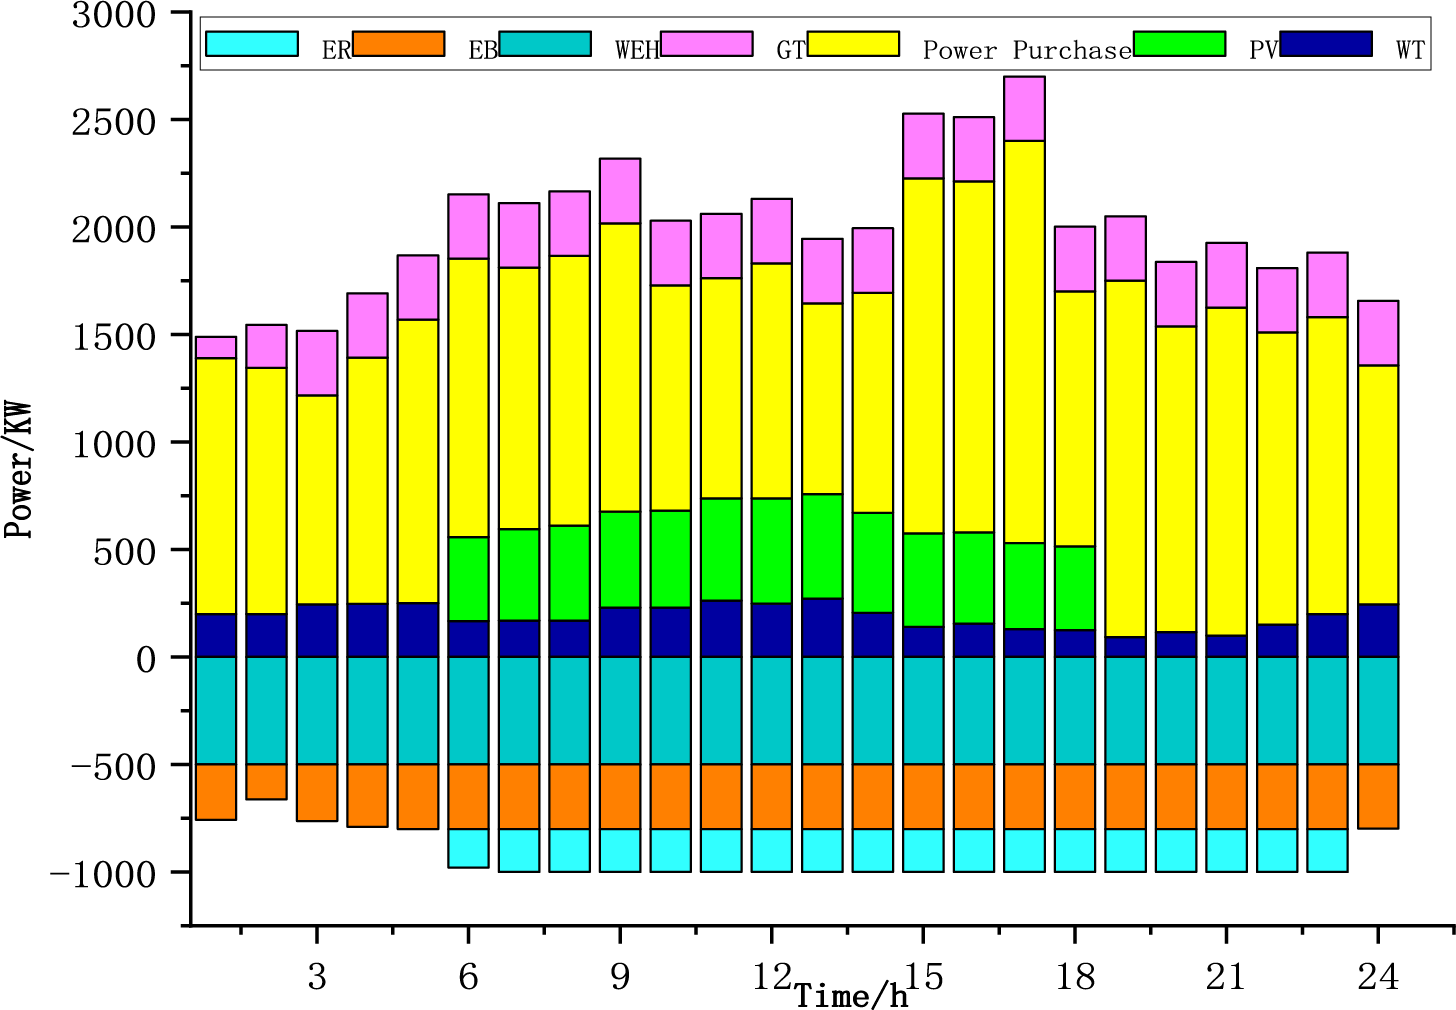
Figure 7: Scheme 3 power balance diagram
During the 00:00–05:00 period, system power supplyprimarily depends on electricity purchases and wind power. Energy storage systems charge during this period to utilize lower nighttime electricity prices, coinciding with low power consumption and the absence of solar generation. From 05:00 to 12:00, PV output increases, while wind power and electricity purchases continue to contribute. Energy storage systems begin discharging to meet the rising morning power demand. During the 12:00–14:00 peak period, PV output reaches its maximum, with wind power and grid purchases still supplying power. From 14:00 to 19:00, PV output gradually decreases, while wind power and electricity purchases persist. Afternoon power demand declines during this phase. After 19:00, PV output ceases, and the system relies mainly on wind power and electricity purchases to meet decreasing evening demand. The amount of energy storage charging in Fig. 5 is slightly more than in the latter two scenarios in some periods, while the energy storage discharge is more prominent in the middle of Fig. 6, this exerts influence on the charge-discharge operational plans formulated for energy storage systems. Electricity sales in individual periods are relatively obvious, so considering the excess carbon rate is conducive to reducing costs (Fig. 5).
The system thermal balances of options 1, 2, and 3 are shown in Figs. 8–10, respectively.
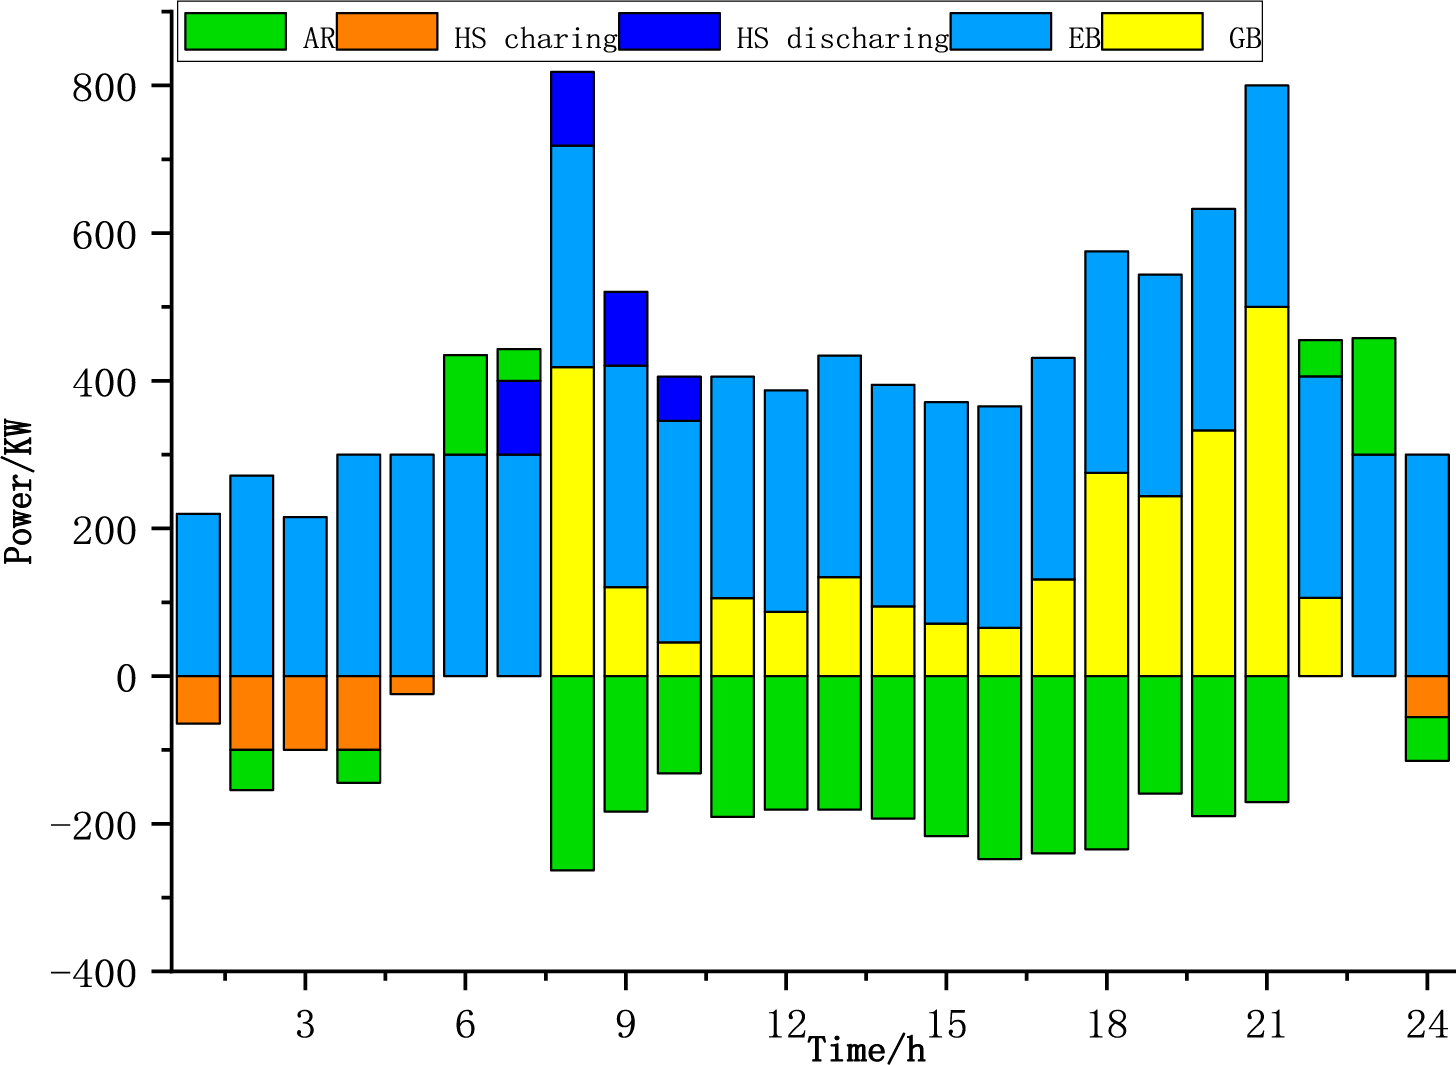
Figure 8: Thermal energy balance diagram of scheme 1
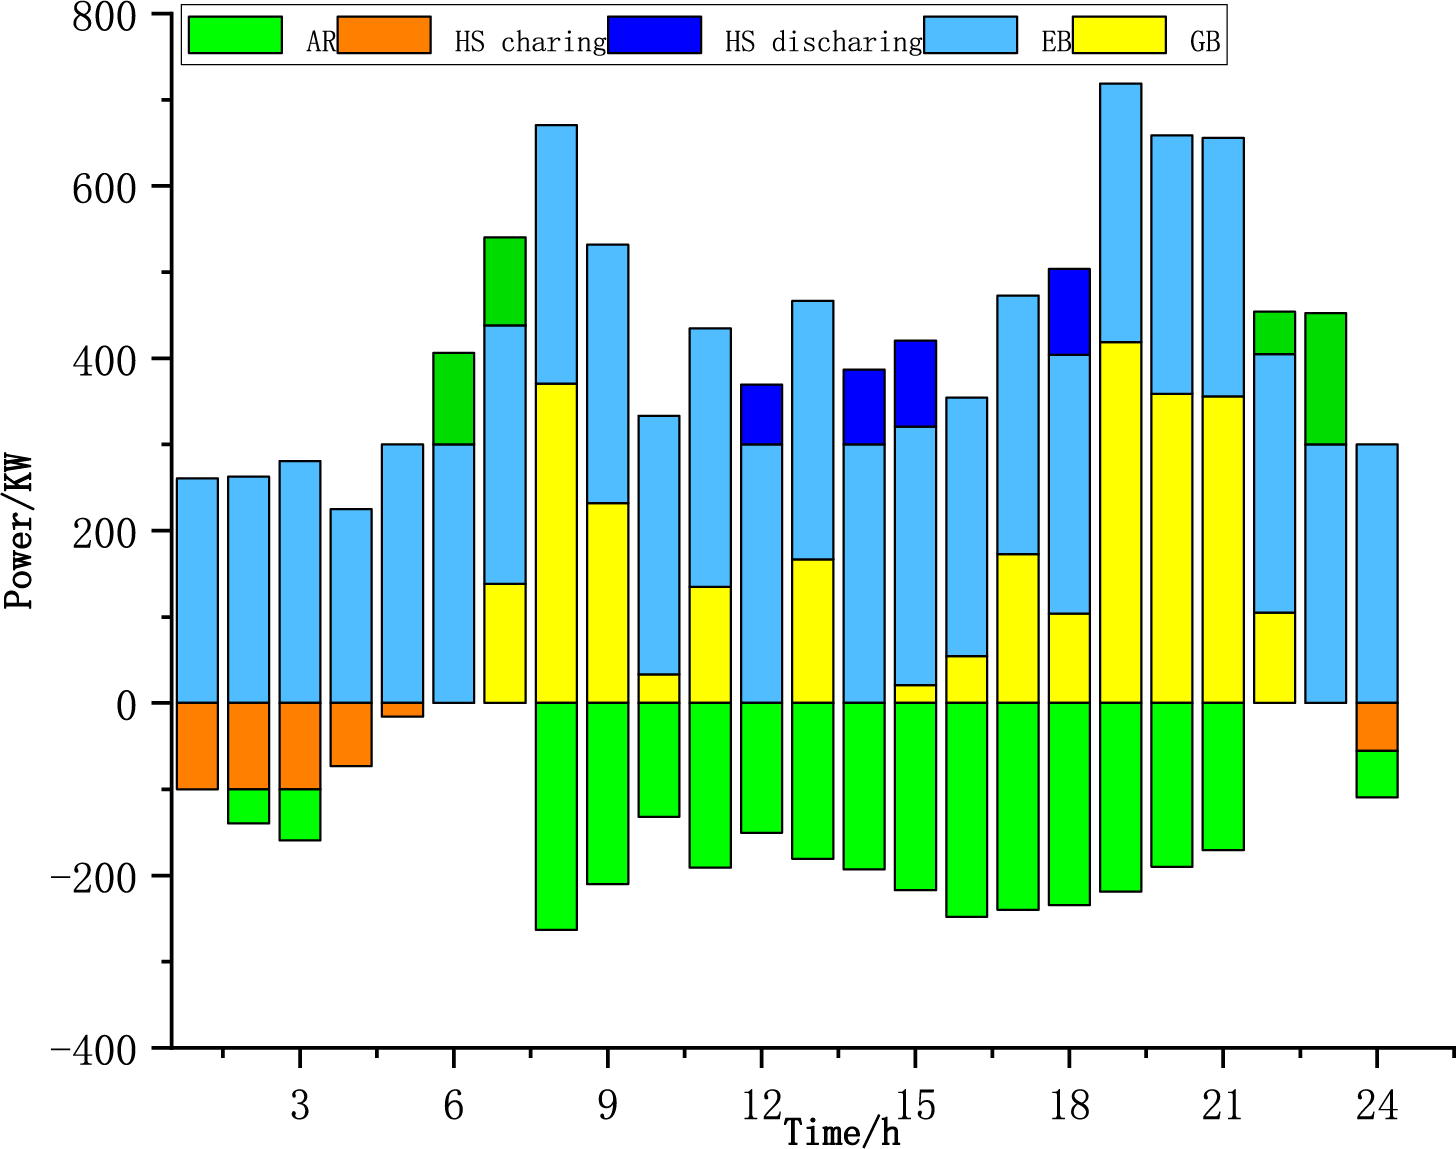
Figure 9: Thermal energy balance diagram of scheme 2
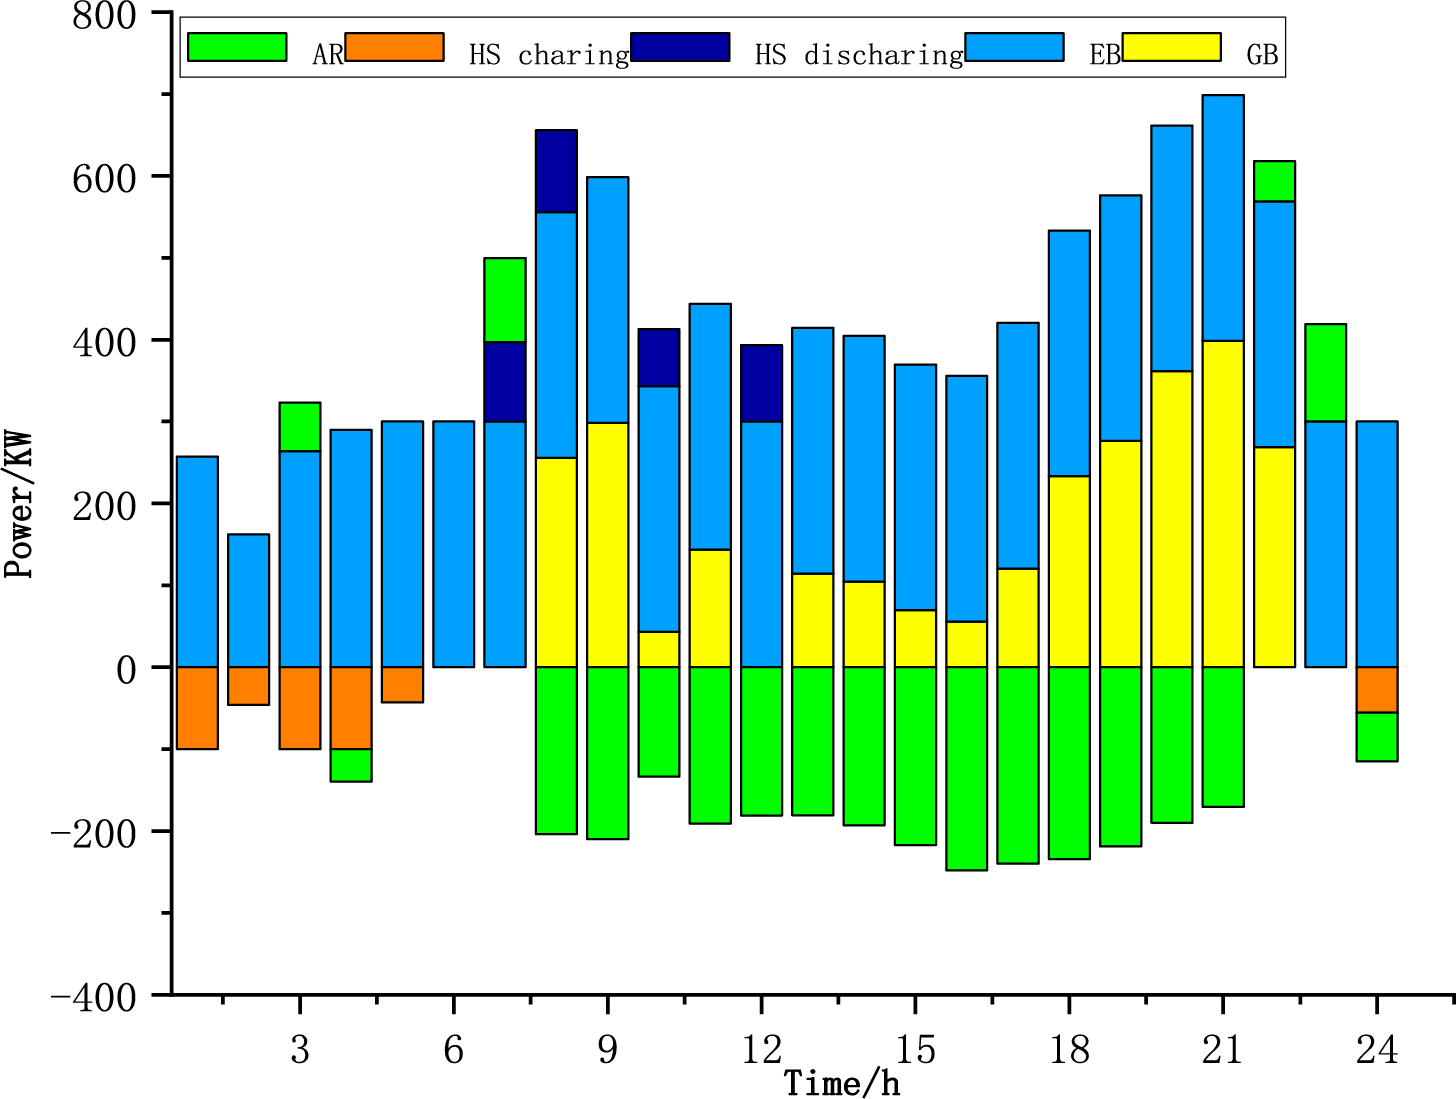
Figure 10: Thermal energy balance diagram of scheme 3
Under carbon surplus ratio conditions, the substitution of gas boilers with an “electric boiler + heat storage tank” configuration decreases fossil fuel reliance while achieving 40%–60% carbon emission reductions relative to baseline scenarios. The heat storage tank’s charge-discharge strategy transitions from passive peak shaving to active coordination to optimize renewable energy utilization efficiency. From an economic perspective, the initial investment in the carbon constraint scenario is high, but cost recovery is realized through carbon trading and income from grid auxiliary services. Empirical evidence demonstrates divergent thermal response characteristics in integrated energy systems under carbon regulation, with conventional steady-state equilibrium shifting toward dynamic carbon flux adaptability.
The system thermal balances of options 1, 2, and 3 are shown in Figs. 11–13, respectively.
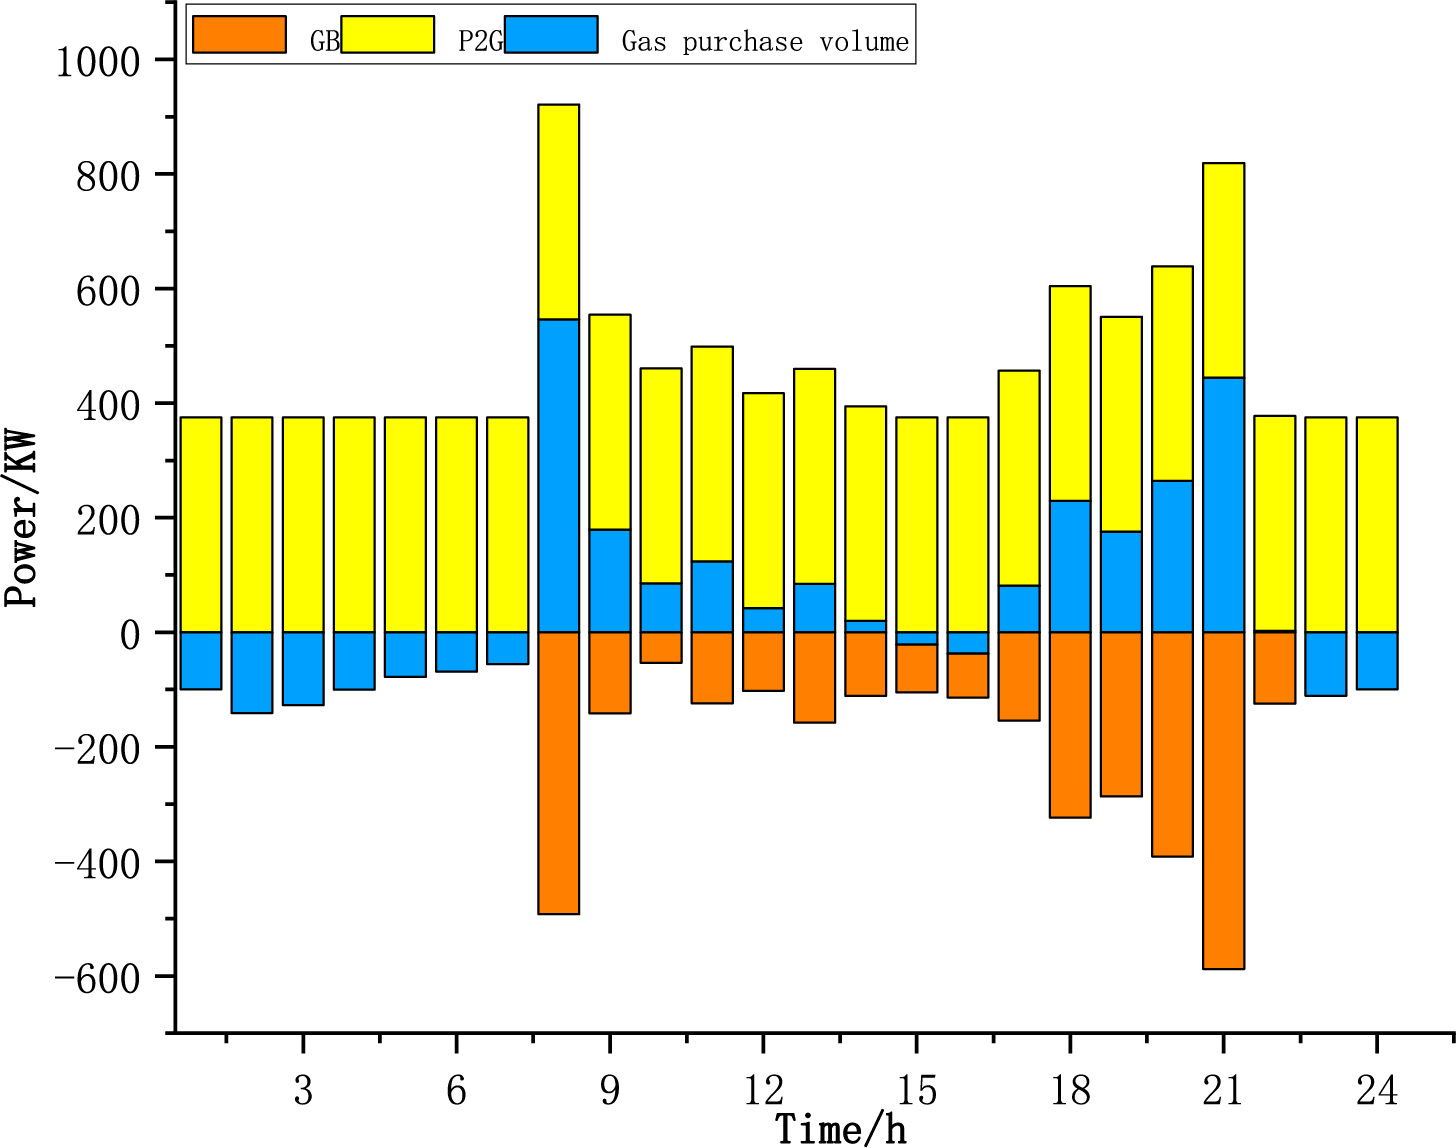
Figure 11: A gas energy balance diagram of the scheme 1
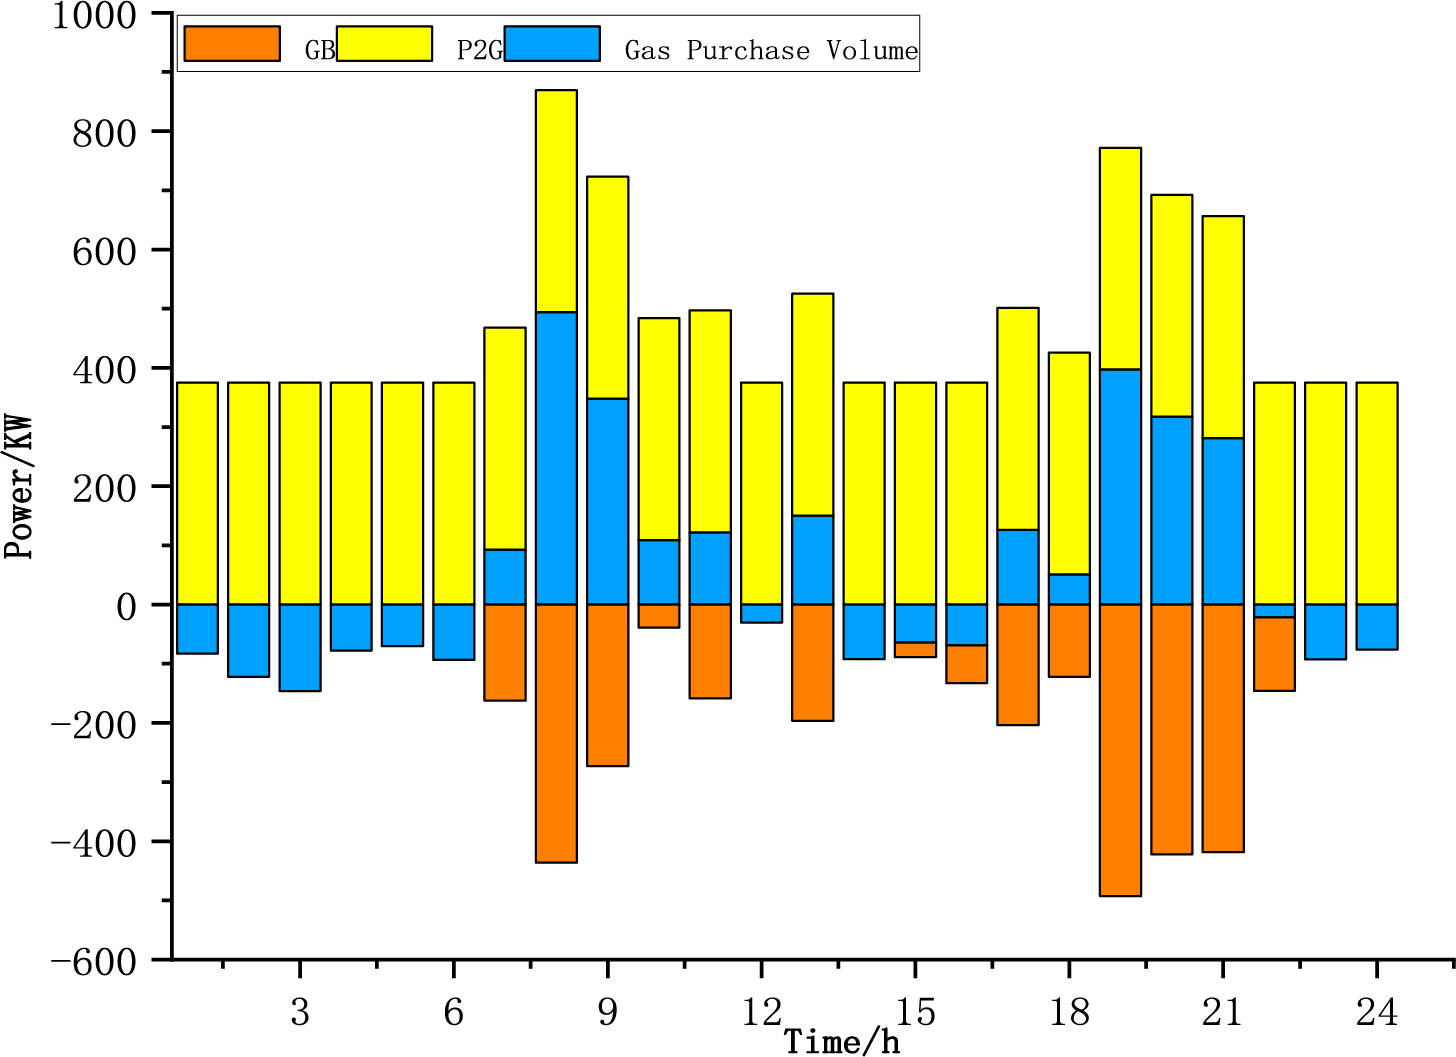
Figure 12: Gas energy balance diagram of the scheme 2
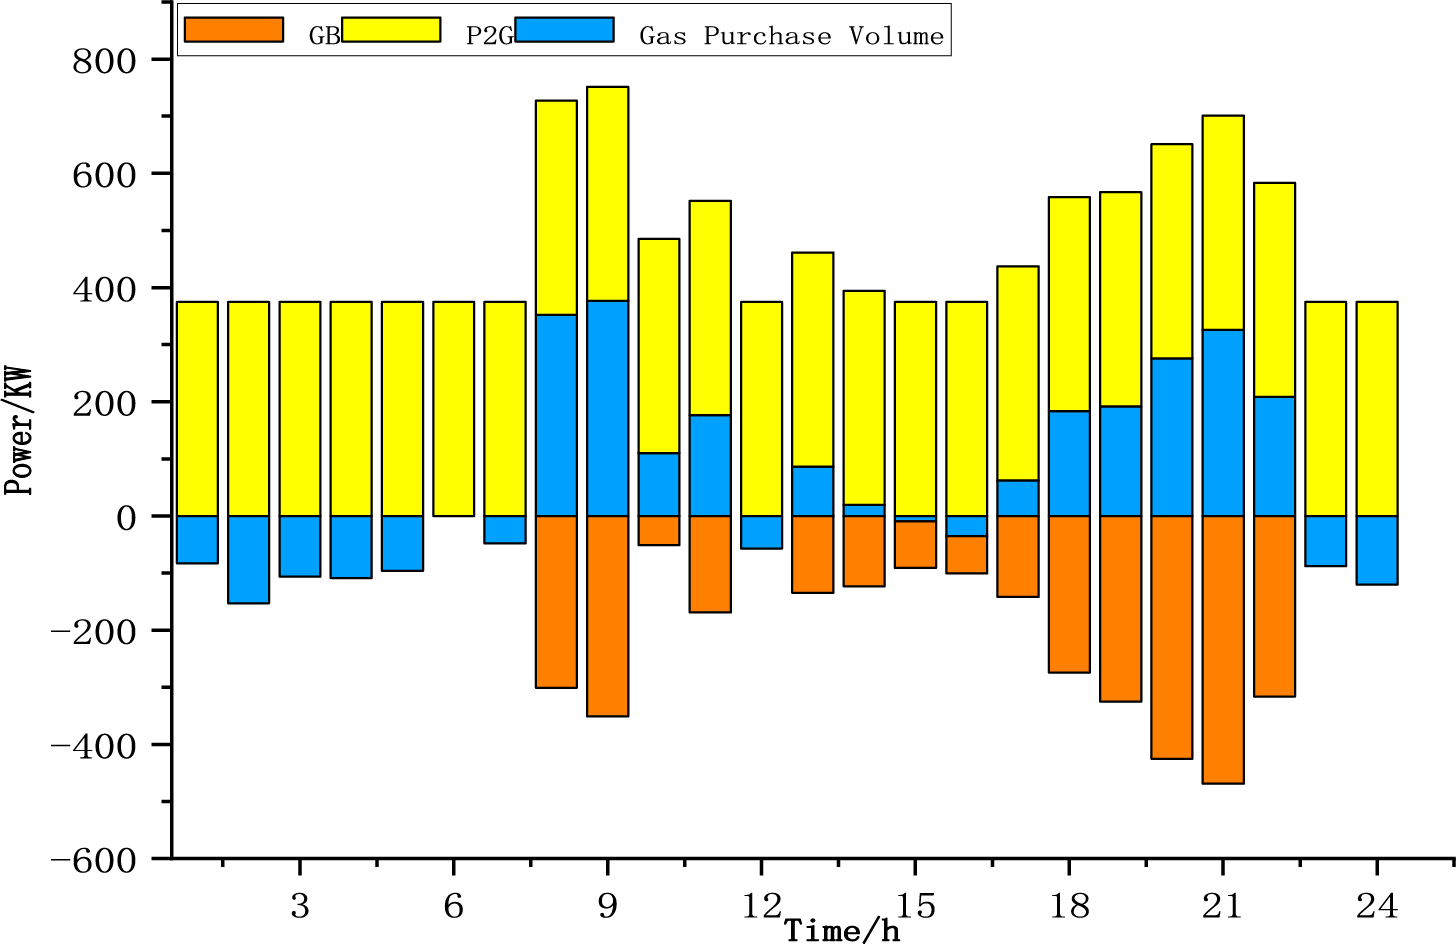
Figure 13: Gas energy balance diagram of the scheme 3
It can be observed from the figure that the excess carbon rate constraint has a significant impact. When the carbon excess rate is considered, the system achieves a low-carbon goal by improving the power-to-gas technology and purchasing gas volume; however it needs to withstand greater load fluctuations and regulation pressure. Simultaneously, considering the carbon excess rate, the value of electricity to gas was the largest. If the carbon excess rate is not considered, although the demand for gas purchase is reduced, the negative load gap is enlarged, leading to the risk of insufficient energy supply or dependence on traditional high-carbon energy sources.
4.5 Comparison of Electrical, Thermal and Gas Loads before and after Response to Different Scenarios
The energy loads of Option 1, Option 2 and Option 3 are shown in Fig. 14 below.
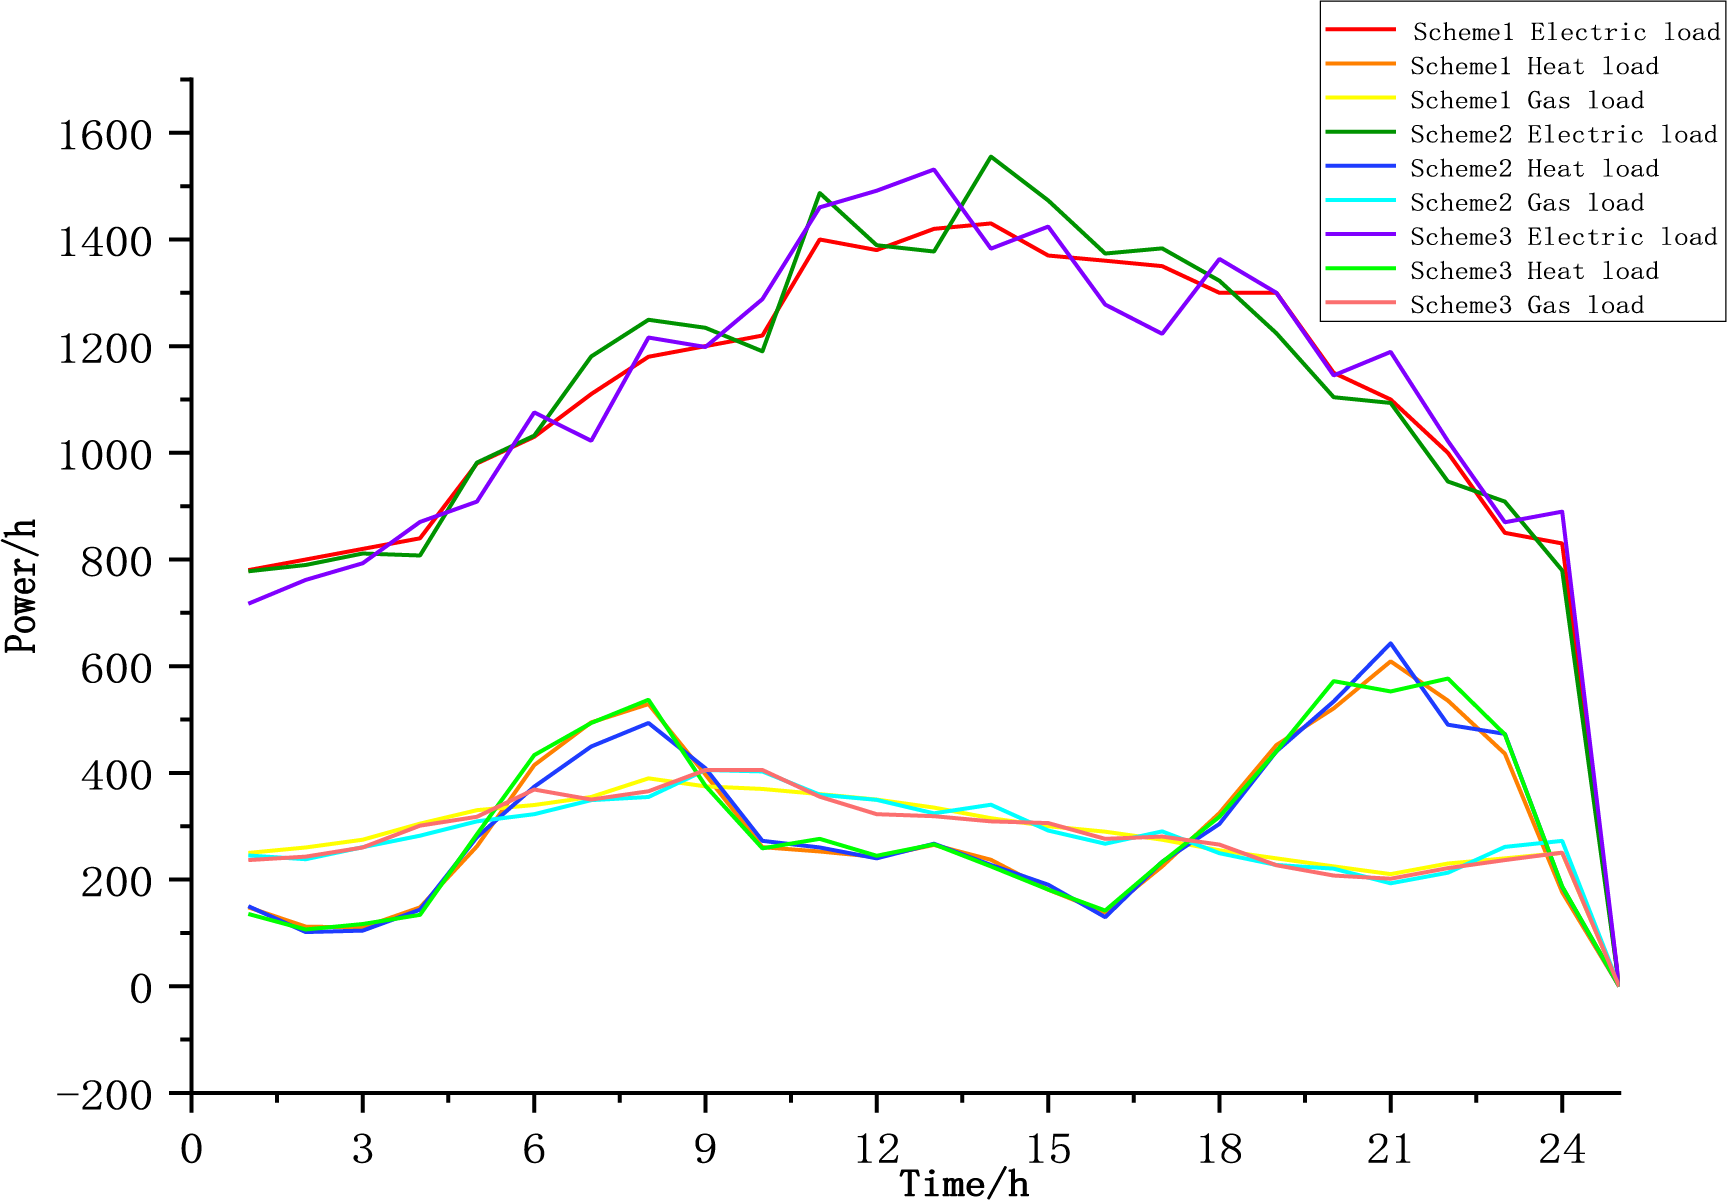
Figure 14: Graph of energy load
Under the three schemes in the figure, standardized load path evaluation reveals stratified stability regimes across operational regimes, with Scheme 1 demonstrating 23% lower demand-response variability than comparative models, operational scheduling achieves further reduction in system peak demand, indicating that the integrated energy system has a stronger ability to regulate the power load in this scenario and realizes more efficient load management. The emergent stability in distributed energy networks is predominantly mediated by the adaptive charge/discharge logic inherent in vehicle-to-grid systems, which shifts the charging demand to a low-carbon period and uses the on-board battery to discharge during peak hours to support the power grid. It can be observed from the heat load curve that the fluctuation of the first scheme is relatively stable. In this scenario, the multi-energy complementary regulation effect is significant, and heating stability is improved through the co-optimization of electricity and heat. Municipal gas networks exhibit steady-state operational regimes demonstrated by stability metrics, showing minimal demand volatility under normal climatic conditions and restricted amplitude variations. It is convenient for the gas supply side to accurately predict gas consumption, optimize gas source allocation and transmission and distribution plans, reduce gas supply pressure fluctuations caused by sudden load changes, and ensure the reliability and economy of the natural gas supply.
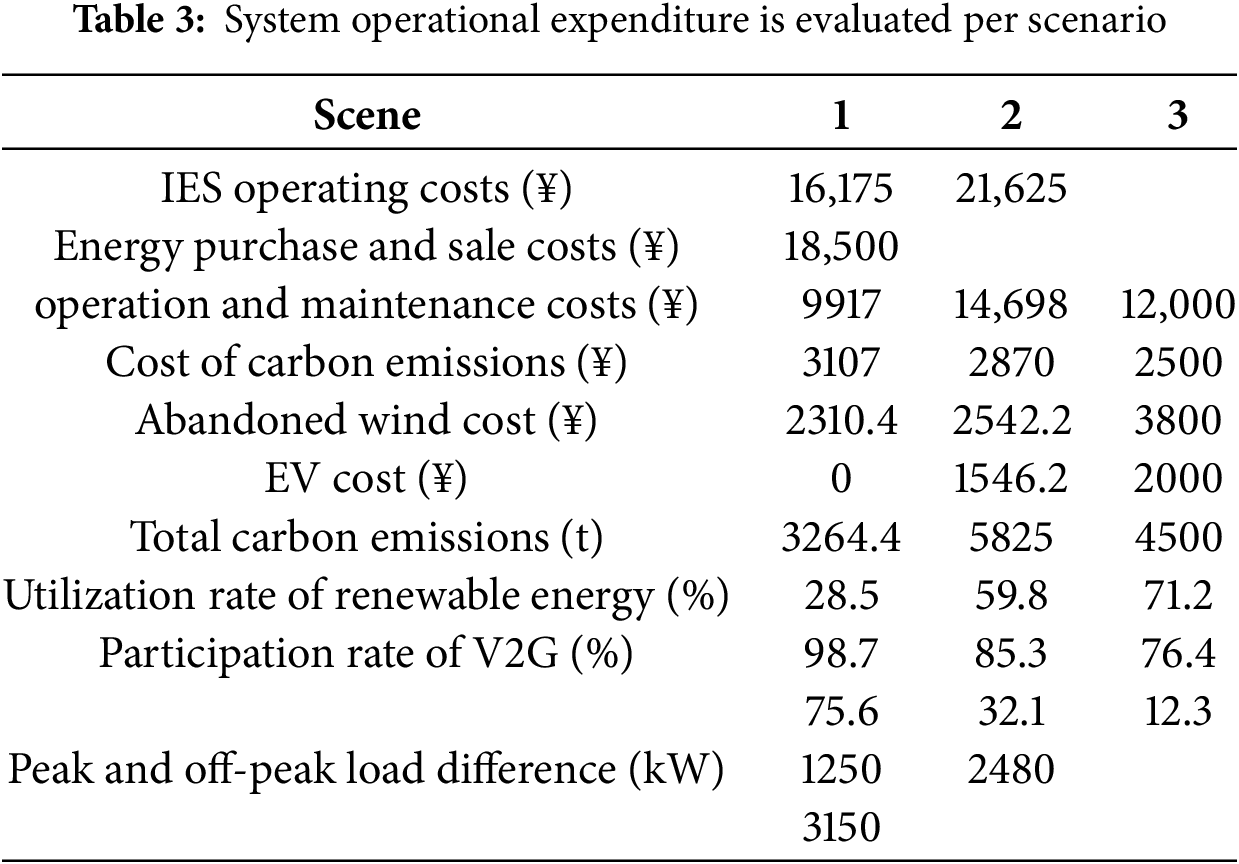
Systematic examination of operational costs in energy systems is executed.
Cost allocation metrics for the energy hub’s operational framework are quantified within Table 3, with granularity down to subsystem-level expenditures. The comparative analysis of energy transaction costs in Scenario 1 reveals 32.5% and 17.4% lower purchasing and selling expenses compared to Scenarios 2 and 3, as documented in the comparative cost matrix. Owing to the consideration of carbon emissions, the operation and maintenance costs will be slightly higher. The cost of carbon emissions decreased by 9.2% and 39%, respectively, system-level analysis confirms the annihilation of curtailment-related expenditures for wind and solar resources under optimized grid integration protocols, increasing the consumption of renewable energy. The entire integrated energy system is considered, the IES operating costs are reduced by 25.3% and 12.6%, respectively, when scenario 1 considers the carbon excess rate coupled with electric vehicles.
By comparing the differences between the model in this paper and some related literatures in aspects such as carbon trading mechanisms, collaborative optimization of electric vehicles, renewable energy processing, and key results. As shown in Table 4 below.
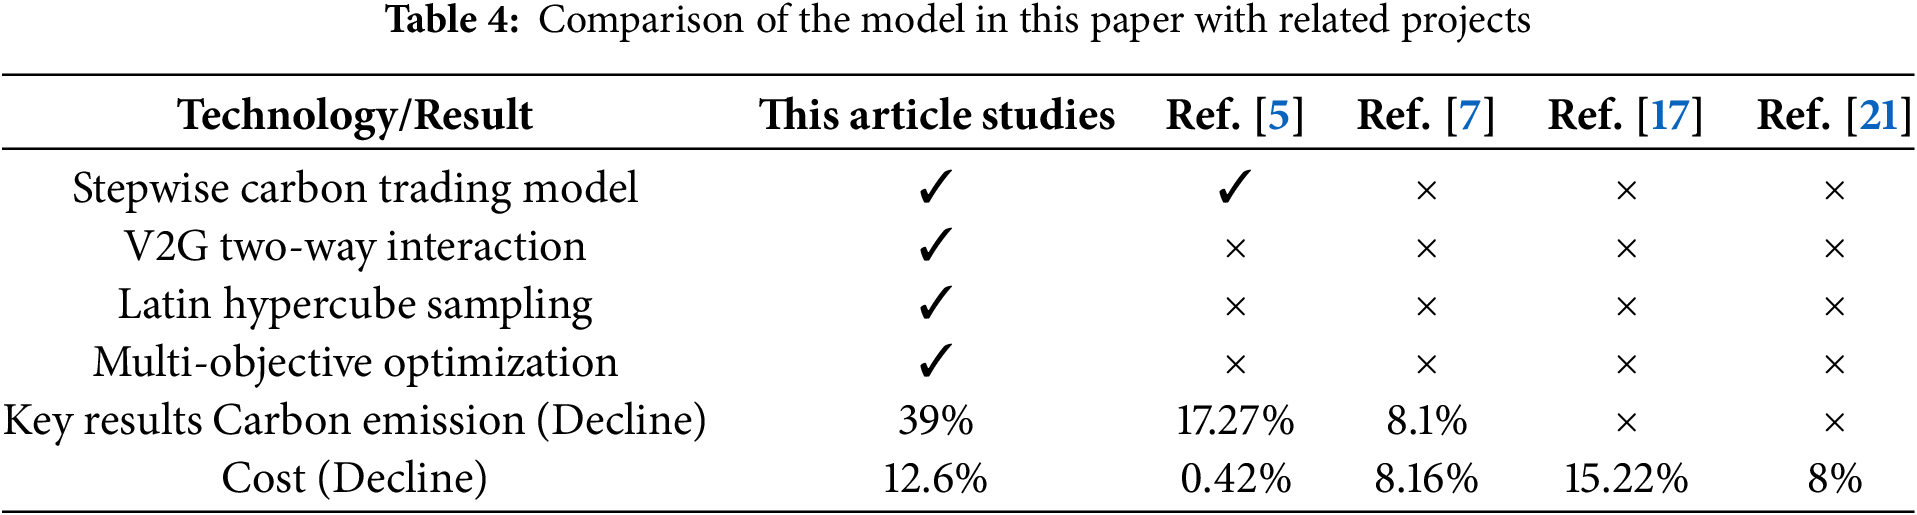
The above table visually demonstrates the comprehensive advantages of this paper in terms of low carbon and economy, verifying the effectiveness of the carbon excess rate and the synergy mechanism of electric vehicles.
The quasi-Monte Carlo based optimization methods enable the co-evolution of carbon emission constraints and EV adoption behaviors within a multi-tiered control structure developed by this investigation, this research develops a quasi-Monte Carlo based resource allocation schema that resolves the park’s energy Trilemma through Pareto-optimal operational coordination, introduces the carbon excess rate and electric vehicles, establishes the constraint conditions of the supply and demand balance of energy equipment and the park’s integrated energy system with the lowest operating economic cost as the objective function, and obtains the operation strategies of different energy equipment. The conclusions are as follows:
• Through the carbon excess rate constraint, the system actively reduced the load during high-carbon periods, and carbon emissions were significantly reduced. The quasi-Monte Carlo based resource allocation schema demonstrates emission reduction improvements when coupled with carbon cap-and-trade regimes in district energy systems, the carbon cost was significantly reduced. The scheme considering the coupling of the carbon excess rate and electric vehicles has the best performance in load optimization, carbon emission reduction, and economic benefits, the decarbonization pathway is anchored in strategic enablers that reconfigure conventional energy matrices into adaptive low-carbon ecosystems via cross-sectoral optimization.
• Grid support functionality is enabled through electric vehicle bidirectional power flow management, with charging synchronized to off-peak periods and discharging aligned to on-peak demand. This “vehicle-network interaction” model further reduces the overall carbon emission intensity.
• Under the carbon excess rate mechanism, parks achieve carbon surplus quotas through emission reduction measures and participation in carbon trading mechanisms, thereby realizing financial benefits. The EV intelligent charging and discharging strategy can take advantage of the electricity price difference to reduce the electricity costs. Compared with Plan Two and Plan Three, the carbon cost decreased by 9.2% and 39%, respectively, and the total daily operating cost decreased by 25.3% and 12.6%, respectively.
Future research will combine Geographic Information System (GIS) to analyze the differences in regional resource distribution and construct a spatial adaptive model. Quantify the dynamic impact of policies on the participation rate of V2G; Propose a hierarchical promotion strategy to meet the demands of multi-scale parks. The research provides an optimized path that takes into account both technical feasibility and policy incentives for the construction of low-carbon parks. To make up for the limitations of power grid topology constraints and user response delays in practical applications.
Acknowledgement: This paper was completed with the hard help of every author.
Funding Statement: This study was sponsored by National Natural Science Foundation of China (52077137).
Author Contributions: Yanjie Liu proposed the concept, method, principle and first draft of the manuscript. Ximin Cao provided supervision and approval of the work. Yanchi Zhang contributed through review, modification, and final approval of the manuscript. All authors reviewed the results and approved the final version of the manuscript.
Availability of Data and Materials: The authors confirm that the data supporting the findings of this study are available within the article.
Ethics Approval: Not applicable.
Conflicts of Interest: The authors declare no conflicts of interest to report regarding the present study.
Nomenclature
| WT | Wind turbines |
| PV | Photovoltaic power |
| CCHP | Combined cooling, heating and power |
| GB | Gas boiler |
| EB | Electric heating boiler |
| ER | Electric refrigerator |
| FC | Fuel cell |
| P2G | Power-to-gas |
| ES | Electric energy storage equipment |
| HS | Thermal energy storage equipment |
| CS | Cold energy storage equipment |
| Actual power generation of PV at time t | |
| Photovoltaic power generation power (kW) under standard conditions | |
| Reference light intensity | |
| Standard temperature | |
| Power generation efficiency of the photovoltaic | |
| Output power (kW) of wind power generation at time t | |
| Rated power (kW) of the fan | |
| Minimum cut-in wind speed (m/s) of the fan rotation | |
| Minimum wind speed (m/s) of the fan to reach the rated power | |
| Cut-out wind speed of the fan | |
| Power generation of the CCHP unit at time t | |
| Cooling power of the CCHP unit at time t | |
| Thermal power of the CCHP unit at time t | |
| Thermal power output of the waste heat boiler in the CCHP system | |
| Cooling power of the electric refrigerator | |
| Power consumption of the electric refrigerator | |
| Gas production power of the P2G equipment | |
| Carbon emission quota of the integrated system | |
| Carbon emission quota of the electricity network purchase | |
| Actual carbon emissions of the park | |
| Actual carbon emissions of the purchased electricity | |
| Actual carbon emissions of CHP | |
| Recovery efficiency of HAB | |
| Upper limit of the output thermal power of HAB | |
| Lower limit of the output thermal power of HAB | |
| Upper climb limit of the output thermal power of HAB | |
| Lower climb limit of the output thermal power of HAB | |
| Unit price of electricity purchase from EV during t period | |
| Unit price of electricity sold to EV during t period | |
| Discharge power of the k EV in time period t | |
| Discharge power of the k EV in the t period |
References
1. Wang P, Zhong Y, Yao Z. Modeling and estimation of CO2 emissions in China based on artificial intelligence. Comput Intell Neurosci. 2022;2022:6822467. doi:10.1155/2022/6822467. [Google Scholar] [PubMed] [CrossRef]
2. Jia J, Li H, Wu D, Guo J, Jiang L, Fan Z. Multi-objective optimization study of regional integrated energy systems coupled with renewable energy, energy storage, and inter-station energy sharing. Renew Energy. 2024;225:120328. doi:10.1016/j.renene.2024.120328. [Google Scholar] [CrossRef]
3. Liu L, Wang X, Wang Z. Recent progress and emerging strategies for carbon peak and carbon neutrality in China. Greenhouse Gases. 2023;13(5):732–59. doi:10.1002/ghg.2235. [Google Scholar] [CrossRef]
4. Ji X, Li M, Li M, Han H. Low-carbon optimal operation of the integrated energy system considering integrated demand response. Front Energy Res. 2023;11:1283429. doi:10.3389/fenrg.2023.1283429. [Google Scholar] [CrossRef]
5. Guo R, Ye H, Zhao Y. Low carbon dispatch of electricity-gas-thermal-storage integrated energy system based on stepped carbon trading. Energy Rep. 2022;8(2):449–55. doi:10.1016/j.egyr.2022.09.198. [Google Scholar] [CrossRef]
6. Yang P, Jiang H, Liu C, Kang L, Wang C. Coordinated optimization scheduling operation of integrated energy system considering demand response and carbon trading mechanism. Int J Electr Power Energy Syst. 2023;147(6):108902. doi:10.1016/j.ijepes.2022.108902. [Google Scholar] [CrossRef]
7. Wang L, Ren X, Ma Y, Liu Z, Dong W, Ni L. Optimal low-carbon scheduling of integrated energy systems considering stepped carbon trading and source-load side resources. Energy Rep. 2024;12(3):3145–54. doi:10.1016/j.egyr.2024.09.002. [Google Scholar] [CrossRef]
8. Wu G, Yi C, Xiao H, Wu Q, Zeng L, Yan Q, et al. Multi-objective optimization of integrated energy systems considering renewable energy uncertainty and electric vehicles. IEEE Trans Smart Grid. 2023;14(6):4322–32. doi:10.1109/tsg.2023.3250722. [Google Scholar] [CrossRef]
9. Chen L, He H, Jing R, Xie M, Ye K. Energy management in integrated energy system with electric vehicles as mobile energy storage: an approach using bi-level deep reinforcement learning. Energy. 2024;307:132757. doi:10.1016/j.energy.2024.132757. [Google Scholar] [CrossRef]
10. Prebeg P, Gasparovic G, Krajacic G, Duic N. Long-term energy planning of Croatian power system using multi-objective optimization with focus on renewable energy and integration of electric vehicles. Appl Energy. 2016;184(4):1493–507. doi:10.1016/j.apenergy.2016.03.086. [Google Scholar] [CrossRef]
11. Wang J, Cui Y, Liu Z, Zeng L, Yue C, Agbodjan YS. Multi-energy complementary integrated energy system optimization with electric vehicle participation considering uncertainties. Energy. 2024;309(7):133109. doi:10.1016/j.energy.2024.133109. [Google Scholar] [CrossRef]
12. Hou H, Wang Z, Hou T, Fang R, Tang J, Xie C. Optimal schedule of 100% renewable energy microgrid considering demand response of EVs. Energy Rep. 2023;9(12):1743–50. doi:10.1016/j.egyr.2023.04.223. [Google Scholar] [CrossRef]
13. Mousaei A. Analyzing locational inequalities in the placement of electric vehicle charging stations using machine learning: a case study in Glasgow. Next Res. 2025;2(1):100123. doi:10.1016/j.nexres.2024.100123. [Google Scholar] [CrossRef]
14. Zhang J, Chen J, Ji X, Sun H, Liu J. Low-carbon economic dispatch of integrated energy system based on liquid carbon dioxide energy storage. Front Energy Res. 2023;10:1051630. doi:10.3389/fenrg.2022.1051630. [Google Scholar] [CrossRef]
15. Jiang LB, Shen JH, Pang W, Sun H, Qu C. Optimization operation method for integrated energy systems in parks considering carbon excess rate and electricity-to-gas conversion. South Energy Constr. 2025;12(3):102–14. doi:10.16516/j.ceec.2024-218. [Google Scholar] [CrossRef]
16. Cui Q, Ma ZT, Zhu JZ, Shu J, Wang H. Research on optimal operation strategy of combined cooling, heating and power microgrid. Modern Electr Power. 2024. doi:10.19725/j.cnki.1007-2322.2023.0181. [Google Scholar] [CrossRef]
17. Yu XT, Qin ZJ, Liang ZJ. Research on optimization operation mode of park integrated energy system for demand response. J Guangxi Univ Nat Sci Ed. 2024;49(4):788–98. (In Chinese). doi:10.13624/j.cnki.issn.1001-7445.2024.0788. [Google Scholar] [CrossRef]
18. Sun W, Harrison GP, Dodds PE. A multi-model method to assess the value of power-to-gas using excess renewable. Int J Hydrog Energy. 2022;47(15):9103–14. doi:10.1016/j.ijhydene.2021.12.248. [Google Scholar] [CrossRef]
19. Ma Y, Wang H, Hong F, Yang J, Chen Z, Cui H, et al. Modeling and optimization of combined heat and power with power-to-gas and carbon capture system in integrated energy system. Energy. 2021;236(5):121392. doi:10.1016/j.energy.2021.121392. [Google Scholar] [CrossRef]
20. Ning G, Popov BN. Cycle life modeling of lithium-ion batteries. J Electrochem Soc. 2004;151(10):A1584. doi:10.1149/1.1787631. [Google Scholar] [CrossRef]
21. Wang JW, Ren Y, Guo Z, Zhang Y. Optimal dispatch of integrated energy systems based on integrated demand response and reward-penalty ladder-type carbon trading. Energy Stor Sci Technol. 2022;11(7):2177–87. doi:10.19799/j.cnki.2095-4239.2021.0692. [Google Scholar] [CrossRef]
Cite This Article
 Copyright © 2025 The Author(s). Published by Tech Science Press.
This work is licensed under a Creative Commons Attribution 4.0 International License , which permits unrestricted use, distribution, and reproduction in any medium, provided the original work is properly cited.
 Downloads
 Citation Tools