
 Submit a Paper
 Propose a Special lssue
 Open Access
ARTICLE

Impact of Building Materials for the Facade on Energy Consumption and Carbon Emissions (Case Study of Residential Buildings in Tehran)
Department of Engineering and Construction Management, Science and Research, Islamic Azad University, Tehran, 1477893855, Iran
* Corresponding Author: Amir Sina Darabi. Email:
(This article belongs to the Special Issue: Innovative Strategies for Energy-Efficient Buildings in a Sustainable Future)
Energy Engineering 2025, 122(9), 3753-3792. https://doi.org/10.32604/ee.2025.065241
Received 07 March 2025; Accepted 14 July 2025; Issue published 26 August 2025
 View Full Text
 Download PDF
Abstract
Although currently, a large part of the existing buildings is considered inefficient in terms of energy, the ability to save energy consumption up to 80% has been proven in residential and commercial buildings. Also, carbon dioxide is one of the most important greenhouse gases contributing to climate change and is responsible for 60% of global warming. The facade of the building, as the main intermediary between the interior and exterior spaces, plays a significant role in adjusting the weather conditions and providing thermal comfort to the residents. In this research, 715 different scenarios were defined with the combination of various types of construction materials, and the effect of each of these scenarios on the process of energy loss from the surface of the external walls of the building during the operation period was determined. In the end, these scenarios were compared during a one-year operation period, and the amount of energy consumption in each of these scenarios was calculated. Also, by measuring the amount of carbon emissions in buildings during the operation period and before that, let’s look at practical methods to reduce the effects of the construction industry on the environment. By comparing the research findings, it can be seen that the ranking of each scenario in terms of total energy consumption is not necessarily the same as the ranking of energy consumption for gas consumption or electricity consumption for the same scenario. That is, choosing the optimal scenario depends on the type of energy consumed in the building. Finally, we determined the scenarios with the lowest and highest amounts of embodied and operational carbon. In the end, we obtained the latent carbon compensation period for each scenario. This article can help designers and construction engineers optimize the energy consumption of buildings by deciding on the right materials.Keywords
In the late 20th century, the environmental consequences of human intervention received more attention than ever before. Concepts of economic growth and development were questioned, and the notion of development became synonymous with environmental protection. Today, the global challenge of climate change affects everyone equally. Environmental issues have caused deep concerns both at the national and global levels. Currently, the reduction of greenhouse gas emissions is the ultimate goal of global energy and environmental policies. One critical issue related to air pollution is global warming caused by the greenhouse effect.
The Worldwide Fund for Nature has also warned in a report that the survival of aquatic animals and fish is threatened and destroyed due to warming caused by greenhouse gases and changes in the water in rivers and seas. The reduction of oxygen in the water surface causes aquatic animals to move to deeper and colder areas, and this issue endangers the lives of other species of animals, including birds, in terms of access to food sources.
In recent years, one of the most critical issues affecting greenhouse gas emissions and, consequently, the environment has been the construction industry. Due to its extensive and long-term activities, the construction industry significantly impacts environmental sustainability. The construction industry, along with the transportation and industrial sectors, is recognized for its energy consumption and environmental consequences.
In the coming decades, energy costs for heating, cooling, lighting, and mechanical processes in industrial production, organizations, homes, and more will increase significantly. In the global competition for optimal consumption and increased energy production, successful countries will be those that research and find ways to prevent energy waste. One of the solutions to this problem is to reduce energy consumption.
The building envelope, as the primary interface between indoor and outdoor spaces, plays a crucial role in moderating climatic conditions and providing thermal comfort for occupants, thereby reducing heating and cooling loads. Designing and implementing building envelopes that efficiently provide the highest level of thermal comfort inside with minimal reliance on mechanical equipment can significantly contribute to energy savings.
By reviewing the literature and examining the background of the research done so far, none of the researchers carried out specifically comprehensive studies on the effect of the materials used to make the outer shell of the building, to define several layers for the wall (the main and middle layer of the wall, the inner layer of the wall, the layer exterior and exterior of the wall), consider different construction materials for each of these layers, and also put different insolations among these layers, and finally calculate the amount of carbon emissions resulting from the production to exploitation stage. The main gap and deficiency observed in the previous research is neglecting the total carbon stored and emitted during the exploitation period.
Therefore, in this research, efforts have been made to measure carbon emissions in buildings during both the operational phase and before that. Practical methods have been employed to reduce the environmental impact of construction. Initially, the carbon emissions resulting from the production phase of various building materials were measured and determined. Subsequently, the impact of these materials on emissions throughout the operational period was assessed. Finally, the cumulative effect of these two aspects was investigated.
2 Theoretical Foundations of the Research
Heat transfer occurs through conduction, convection, air exchange, and radiation. Proper insulation is essential to reduce heat transfer. Adding insulation decreases the heat transfer value or increases thermal resistance. Proper placement of insulation also plays a crucial role.
A composite material or system that effectively reduces heat transfer from one environment to another. In some cases, in addition to reducing heat transfer, heat insulation can also have other abilities such as load bearing, soundproofing, etc. Under special weather conditions, it can also be considered heat insulation. Thermal insulation that can be used in the building refers to insulation that has a thermal conductivity coefficient less than or equal to 0.065 W per meter degree Kelvin and a thermal resistance equal to or greater than 0.5 W per meter degree Kelvin. The mentioned values are related to measurements in standard thermal conditions. Thermal insulation is done by a special material or materials or by a system with several functions. For example, a load-bearing wall can provide the role of thermal insulation at the same time. But in most cases, it is necessary to add a special layer to the wall as heat insulation.
The best practices for insulation include the following:
• Applying insulation to all exterior building components (roof, external walls, and floor).
• Installing firm and secure insulation layers on walls.
• Ensuring complete waterproofing of all cavities.
2.3 Equations Governing Building Envelopes
• To assess thermal comfort in a space, we first need to calculate the indoor air temperature and surface temperatures. We write the energy balance equation for each surface. Let’s denote the properties related to each surface with a subscript (i):
○ The radiative and convective heat transfer equation is as follows:
∎ The first term on the left represents heat transfer by convection between the inner wall surface and room air.
∎ The second term represents the received heat transfer through radiation from other surfaces.
○ The equation for heat transfer from the surface is given by:
∎ (Qi) represents the heat generated within the system (e.g., in a building).
∎ (Qc(i)) represents heat generated by internal sources (e.g., heating, cooling).
∎ (Qr-in(i)) represents heat transferred from the system to the external environment (e.g., through windows or other surfaces).
∎ (Qr-out(i)) represents heat transferred from the system to other building components (e.g., walls or roof).
Qr−in(i) includes two terms of direct sunlight (Qr−direct(i)) and scattered sunlight (Qr−diffuse(i)), where Aw is the area of the window and As(i) is the area of the sun shining on the surface i AST is the total area of the sun irradiated on the inner surface, FW−I is the shape factor of the window to surface I. Q”direct is the radiant heat entering from the window caused by direct sunlight per unit area and Q”diffuse is the radiant heat entering from the window caused by scattered sunlight per unit area. The sum of Q”direct and Q”diffuse represents the total radiant energy of the sun per unit area of the window and is displayed below.
○ The total solar radiation entering through the window is given by:
○ The equation for calculating the external surfaces of the building is:
In addition to the internal surfaces, an equation must be written for the air as well.
○ The calculation equation for the internal levels of the building:
where minf and Tinf are the mass flow rate and the temperature of the air entering the building, respectively.
○ Convection and transfer heat equation:
(Q) heat transfer rate (watts);
(h) heat convection coefficient (watts per meter degrees Kelvin or Celsius);
(A) Cross-sectional area (square meters);
(ΔT) temperature change (Kelvin or Celsius).
○ The equation of conduction mechanisms:
(k) coefficient of thermal conductivity (watts per meter per degree Kelvin);
(A) Cross-sectional area (square meters);
(ΔT) temperature change (Kelvin or Celsius);
(d) Thickness of the object (meters).
The next step, after calculating the air temperature and the temperature of the interior surfaces of the room, is to calculate the average thermal sensation of the room’s occupants. For this purpose, the Finger model has been used. In the Finger model, there are seven important and effective parameters for thermal comfort, which are:
1. Metabolic rate
2. Number of clothes
3. The amount of activity
4. Dry temperature
5. Average radiation temperature
6. Airflow speed
7. Relative humidity
The first three parameters are related to human factors, and the other four parameters are environmental factors. Finger has presented a relation that expresses the mentioned seven parameters in the form of one parameter.
○ Metabolic rate equation:
which is the average radiation temperature in the Finger relationship Tmrt and is calculated as follows:
and
The terms FP−1 to FP−N are the visibility coefficients of the human body with each side surface. These values can be calculated according to the situation of the people in the house and also their situation, whether they are sitting or standing. The value of PMV is between −3 and +3, and according to ASHRAE installation instructions, any integer between these two values somehow expresses the thermal feeling of the building occupants from the environmental conditions.
2.4 Energy Consumption Status in Iran and the World
Energy consumption worldwide, although fluctuating in some years, has generally followed an upward trend and reached 167,788 trillion watt-hours in 2022. In Iran, this trend has consistently been upward, reaching 3377 trillion watt-hours in 2022. This trend is illustrated in Fig. 1. When we divide this energy consumption by the population, Iran’s severe situation becomes clearer.
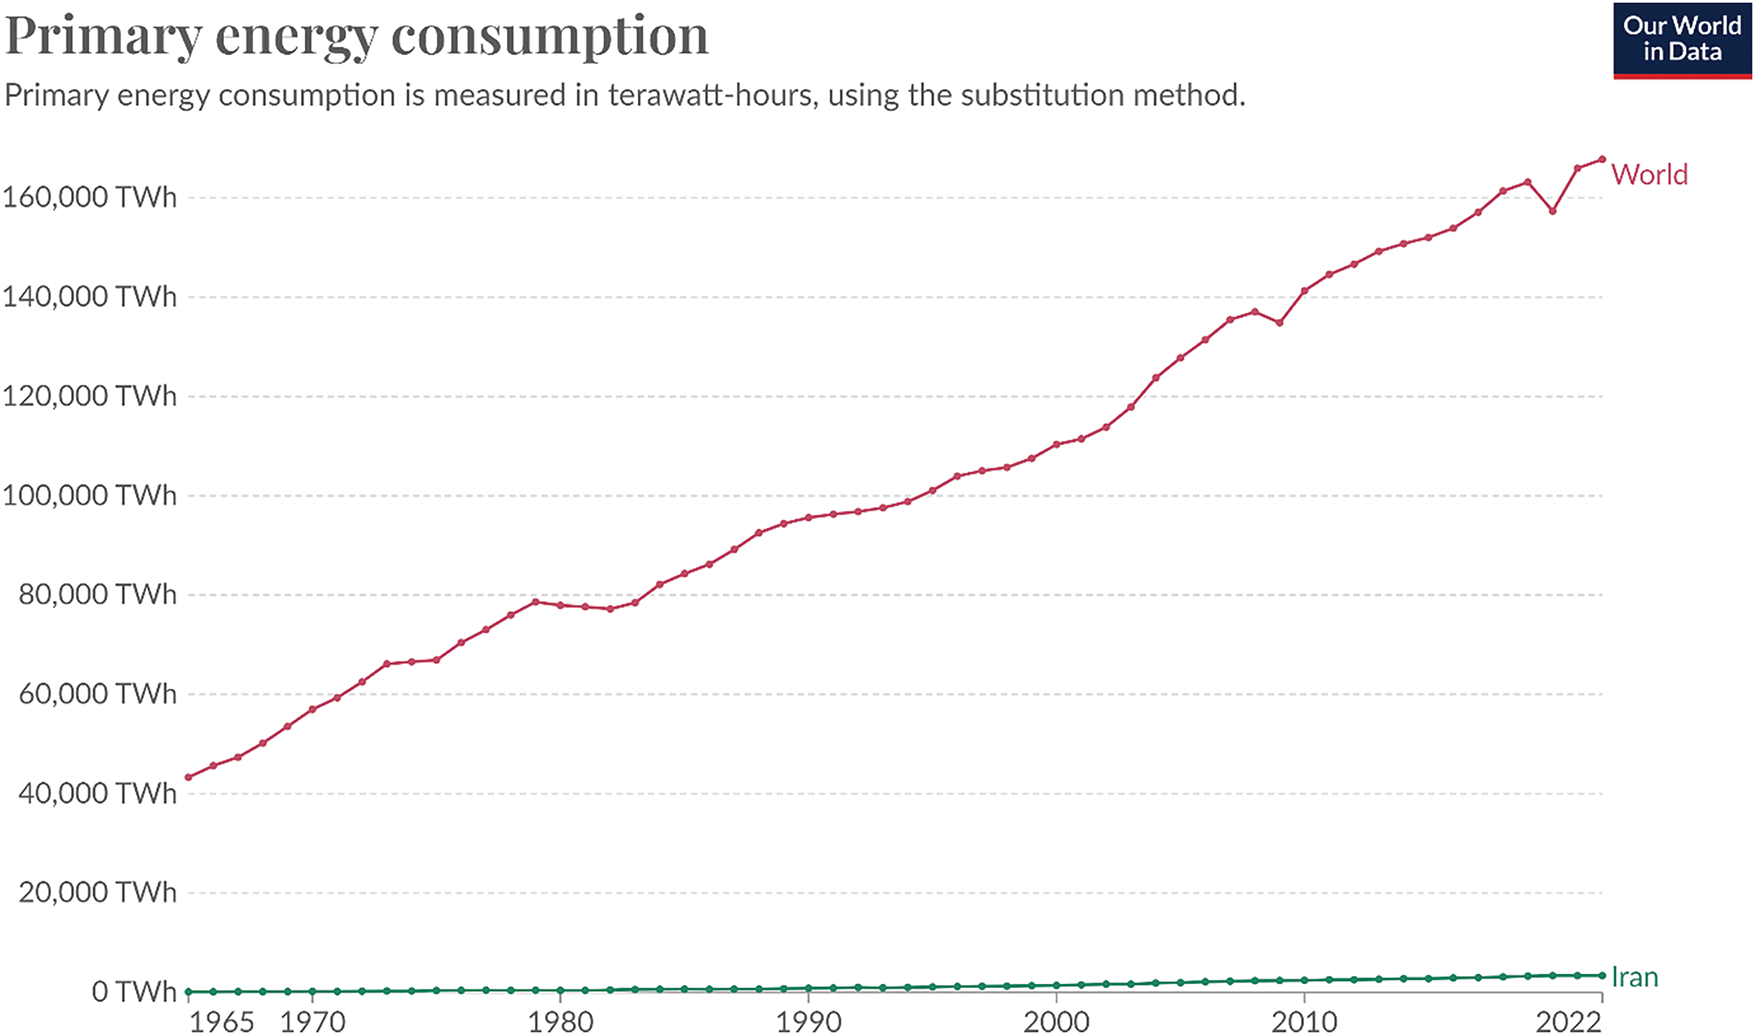
Figure 1: The energy consumption trends in Iran and the world
The average energy consumption per person globally is 21,039 kW-hours, while in Asia, it decreases to 19,140 kW-hours. However, the average energy consumption per person in Iran is 38,133 kW-hours. Fig. 2 depicts this trend.
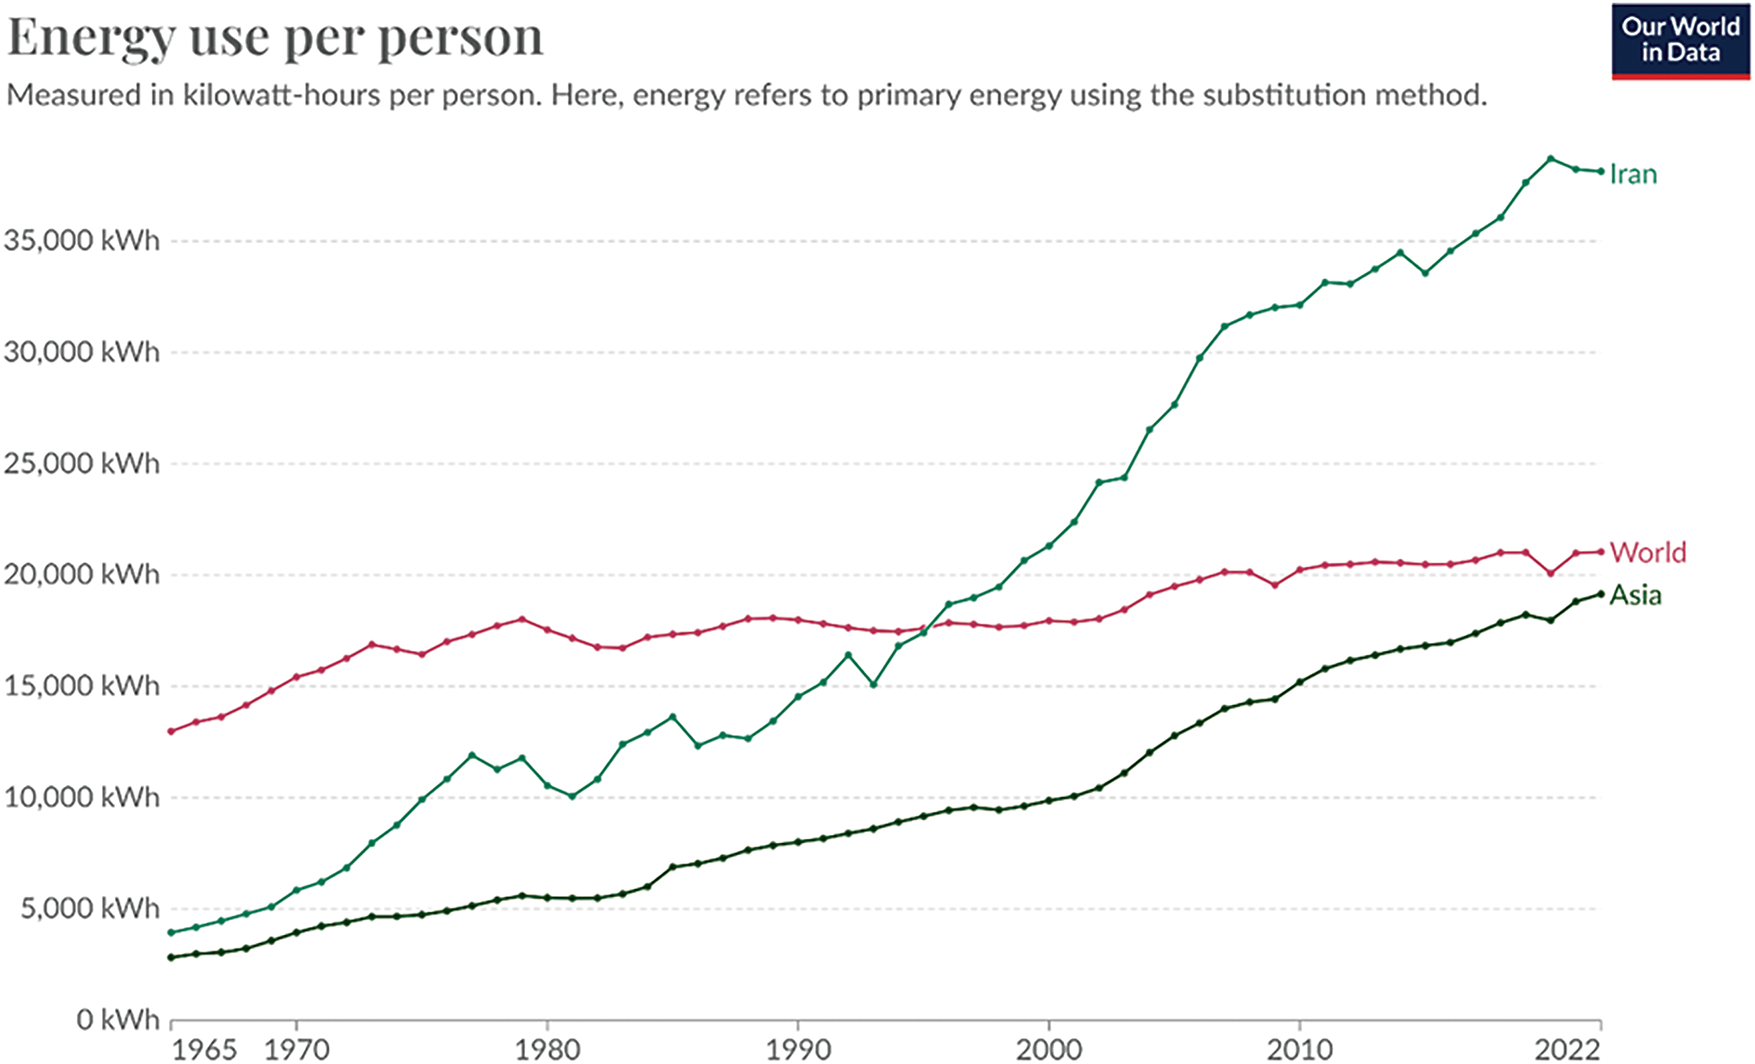
Figure 2: The energy consumption per capita in Iran, Asia, and the world
Energy intensity, measured in kilowatt-hours per dollar of gross domestic product (GDP), accounts for inflation and cost-of-living differences between countries. In 2018, the global average energy intensity was 42.1 kW-hours, while in Iran, it was 21.2 kW-hours. Fig. 3 provides further insight into this pattern.
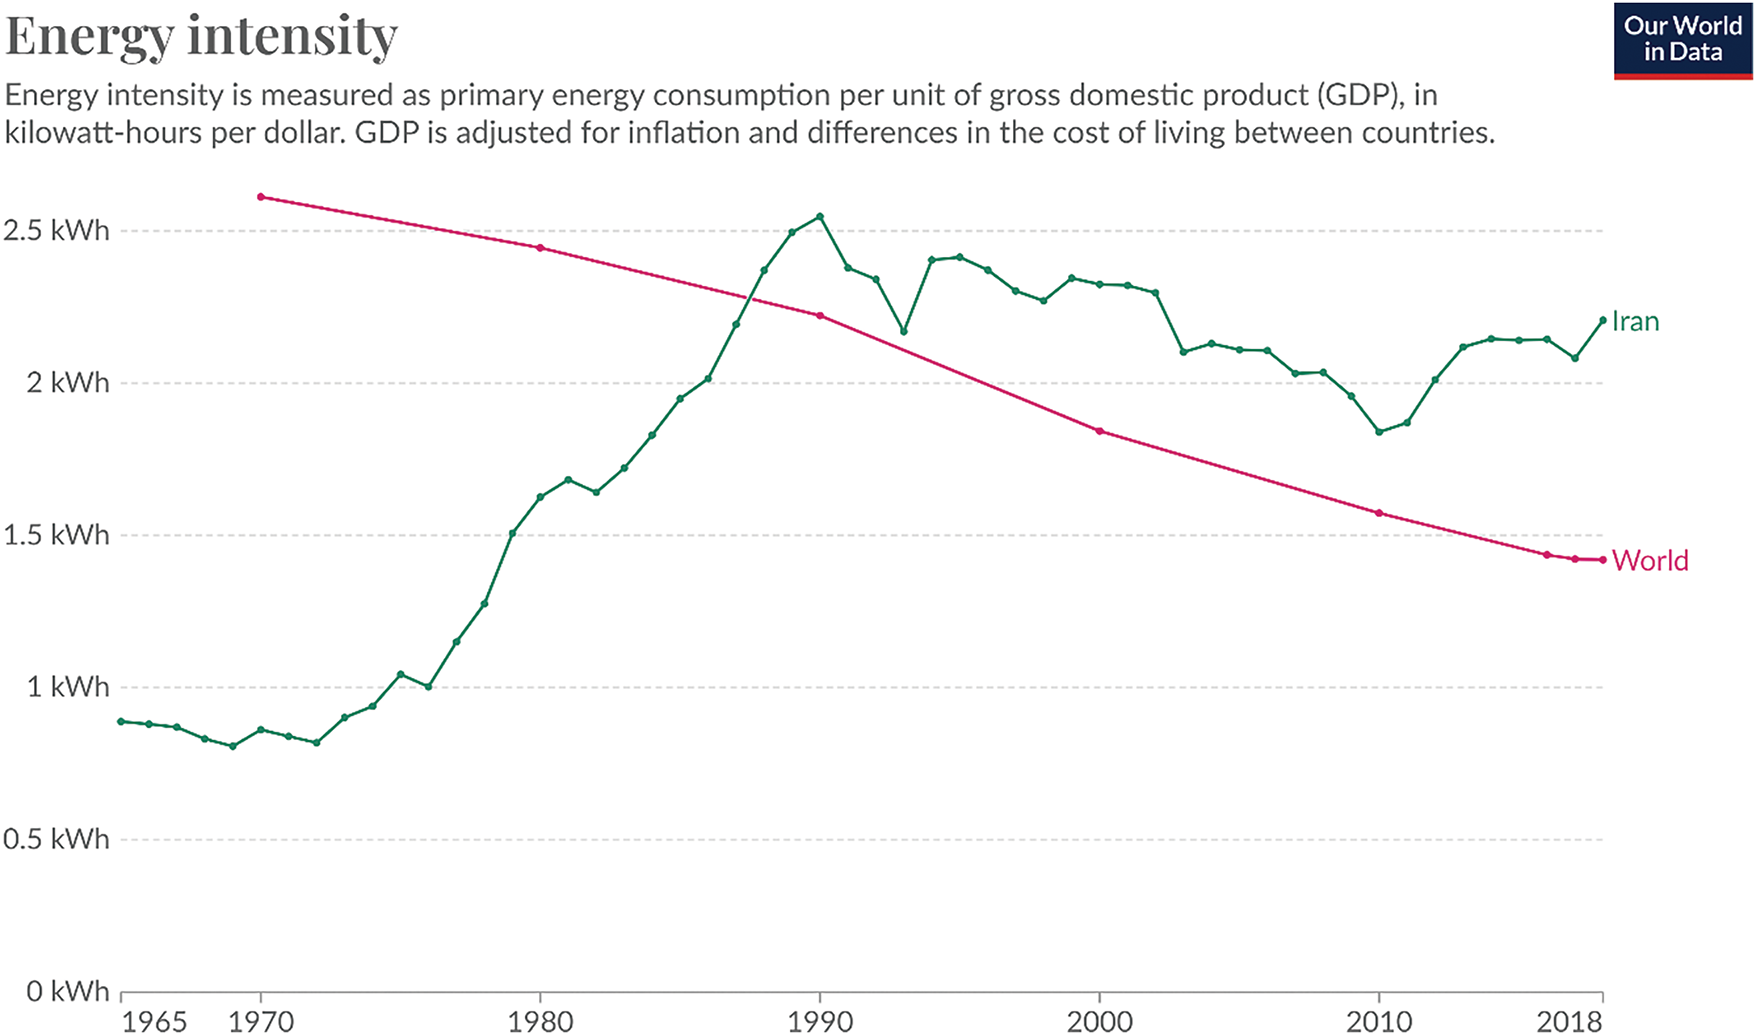
Figure 3: The energy intensity in Iran and the world
2.5 The Situation of Carbon Emissions in Iran and the World
The trend of greenhouse gas production worldwide has generally been upward, with occasional declines. In 2022, global production reached 53.85 billion tons. In Iran, the trend has consistently risen, reaching 935.35 million tons in the same year, according to Fig. 4. As shown in Fig. 5, Iran’s share of greenhouse gas emissions was 1.74% of the world total. The increasing trend of Iran’s share is depicted in Fig. 6.
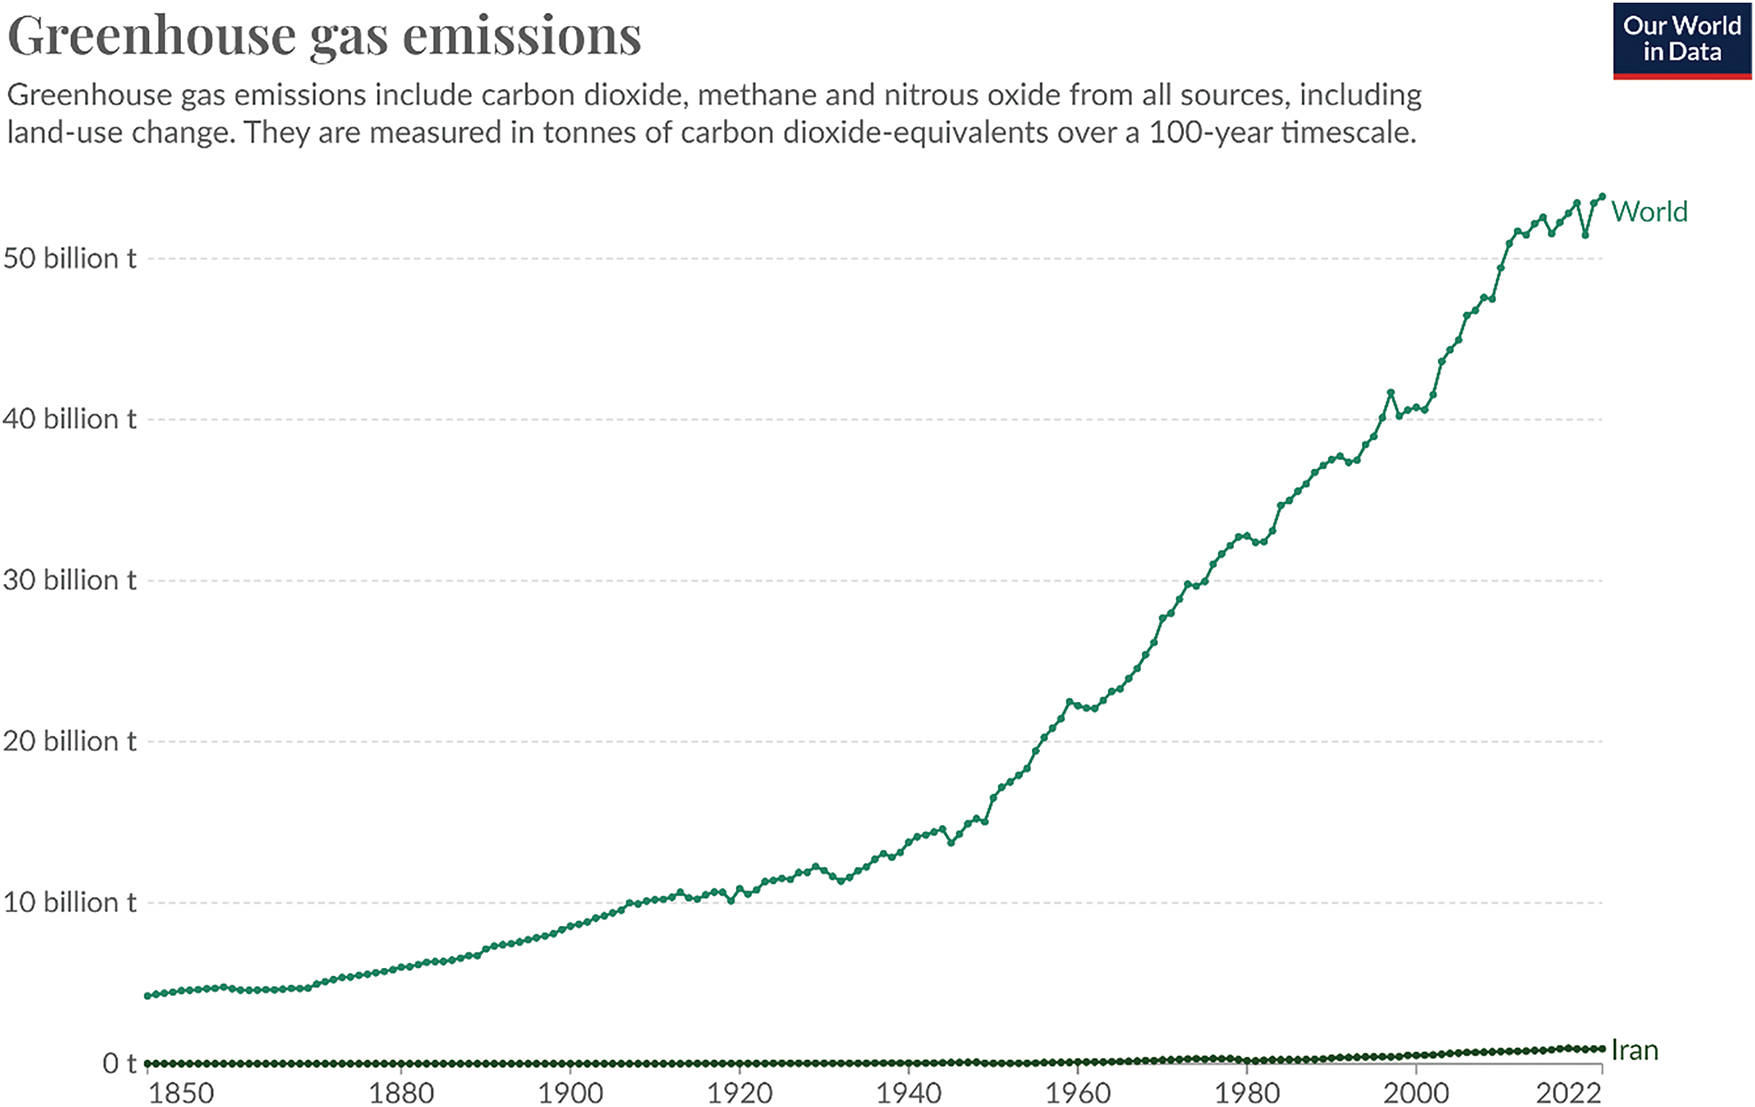
Figure 4: Greenhouse gas emissions in Iran and the world
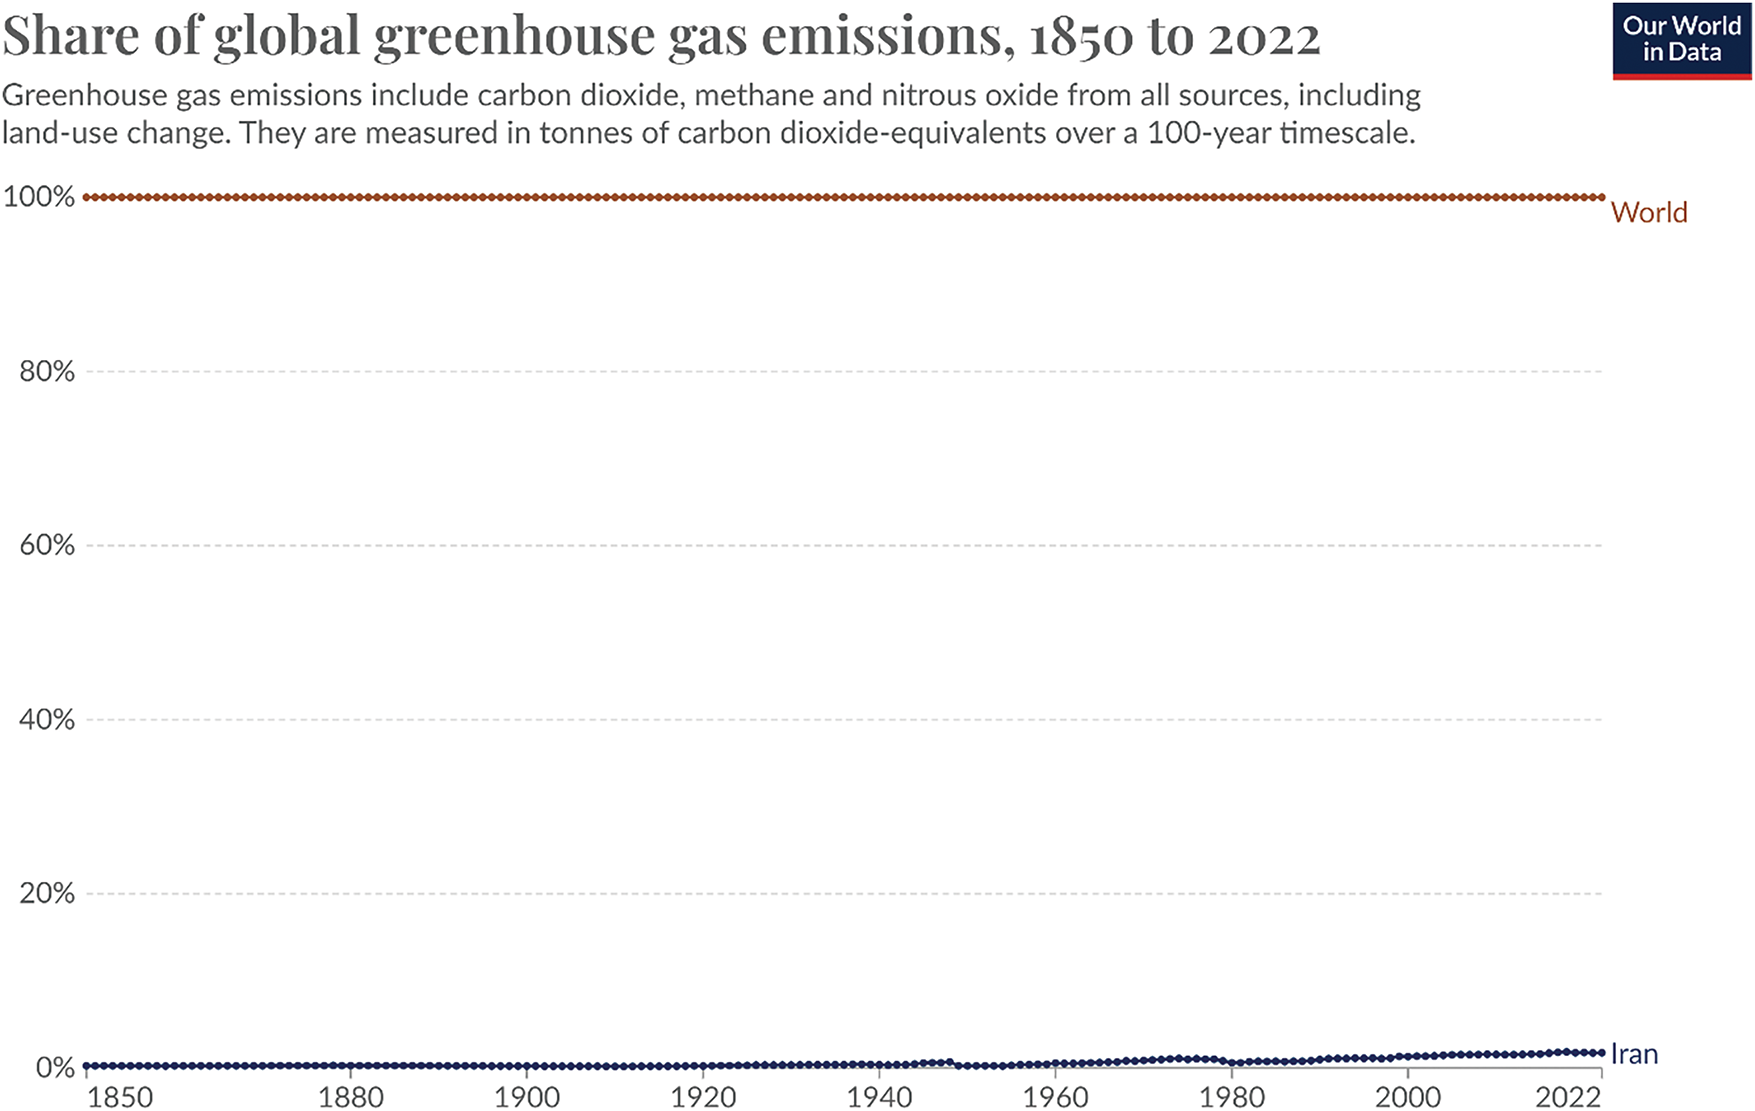
Figure 5: Iran’s share of greenhouse gas emissions in the world
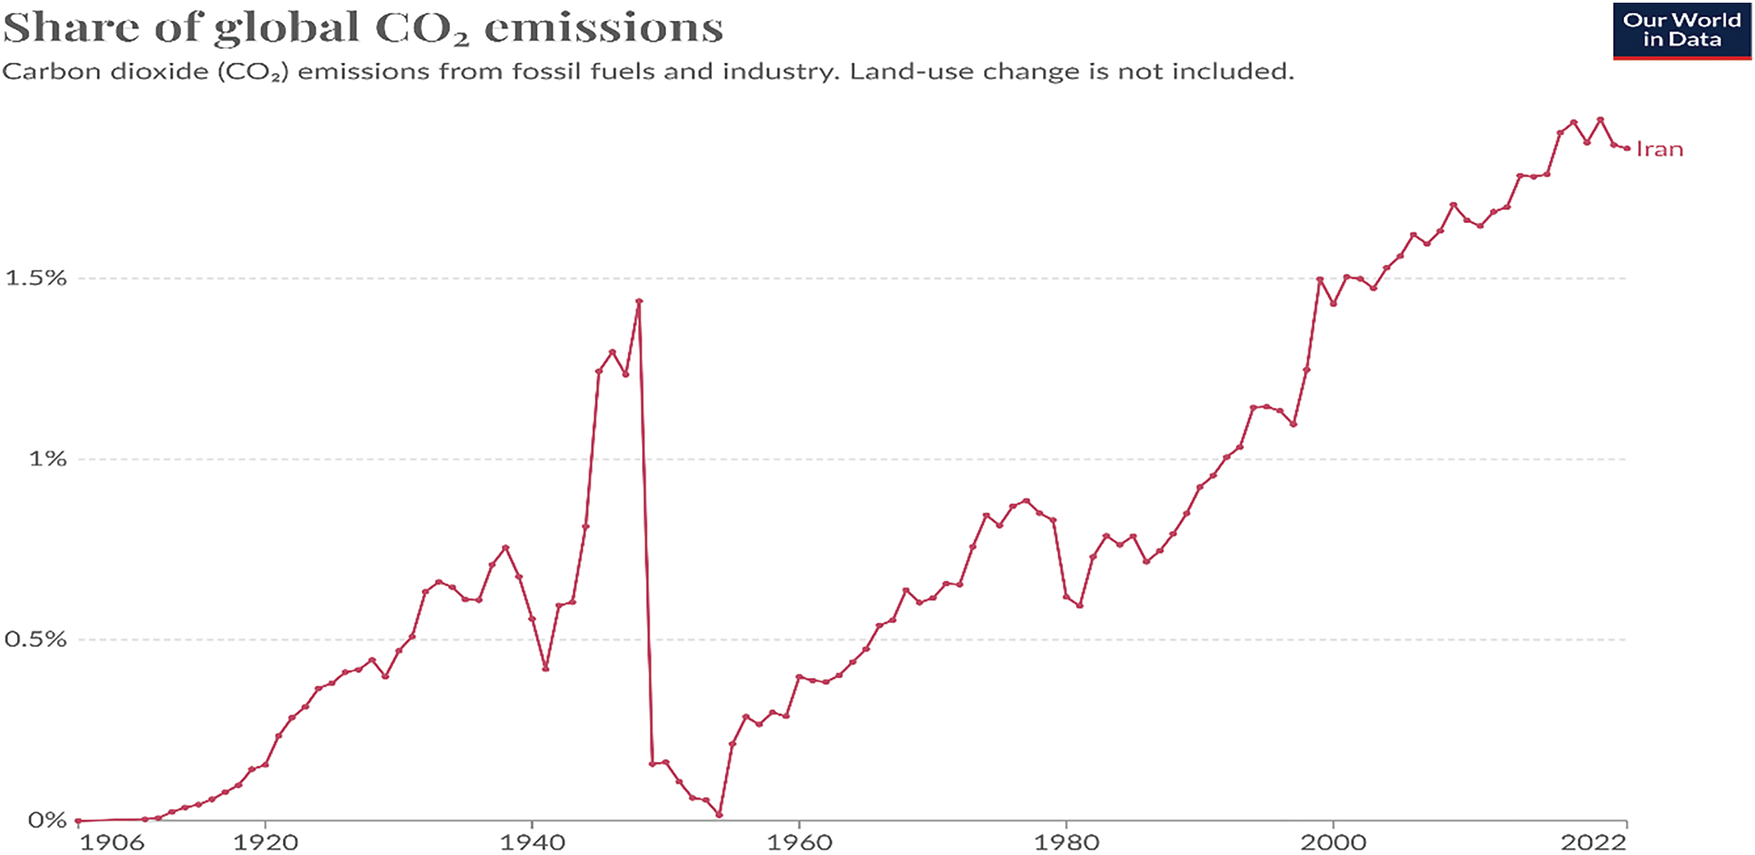
Figure 6: The trend of Iran’s participation in the emission of greenhouse gases in the world
The rise in greenhouse gas and carbon dioxide emissions can be attributed to population growth. To investigate this, we can examine per capita emissions, which directly reflect the production per person.
Analyzing per capita greenhouse gas emissions in Iran reveals a consistent upward trend, except during specific periods (such as war and revolution). Meanwhile, global per capita emissions are decreasing. Unfortunately, Iran’s trend has not only remained stable but has also increased. Refer to Fig. 7.
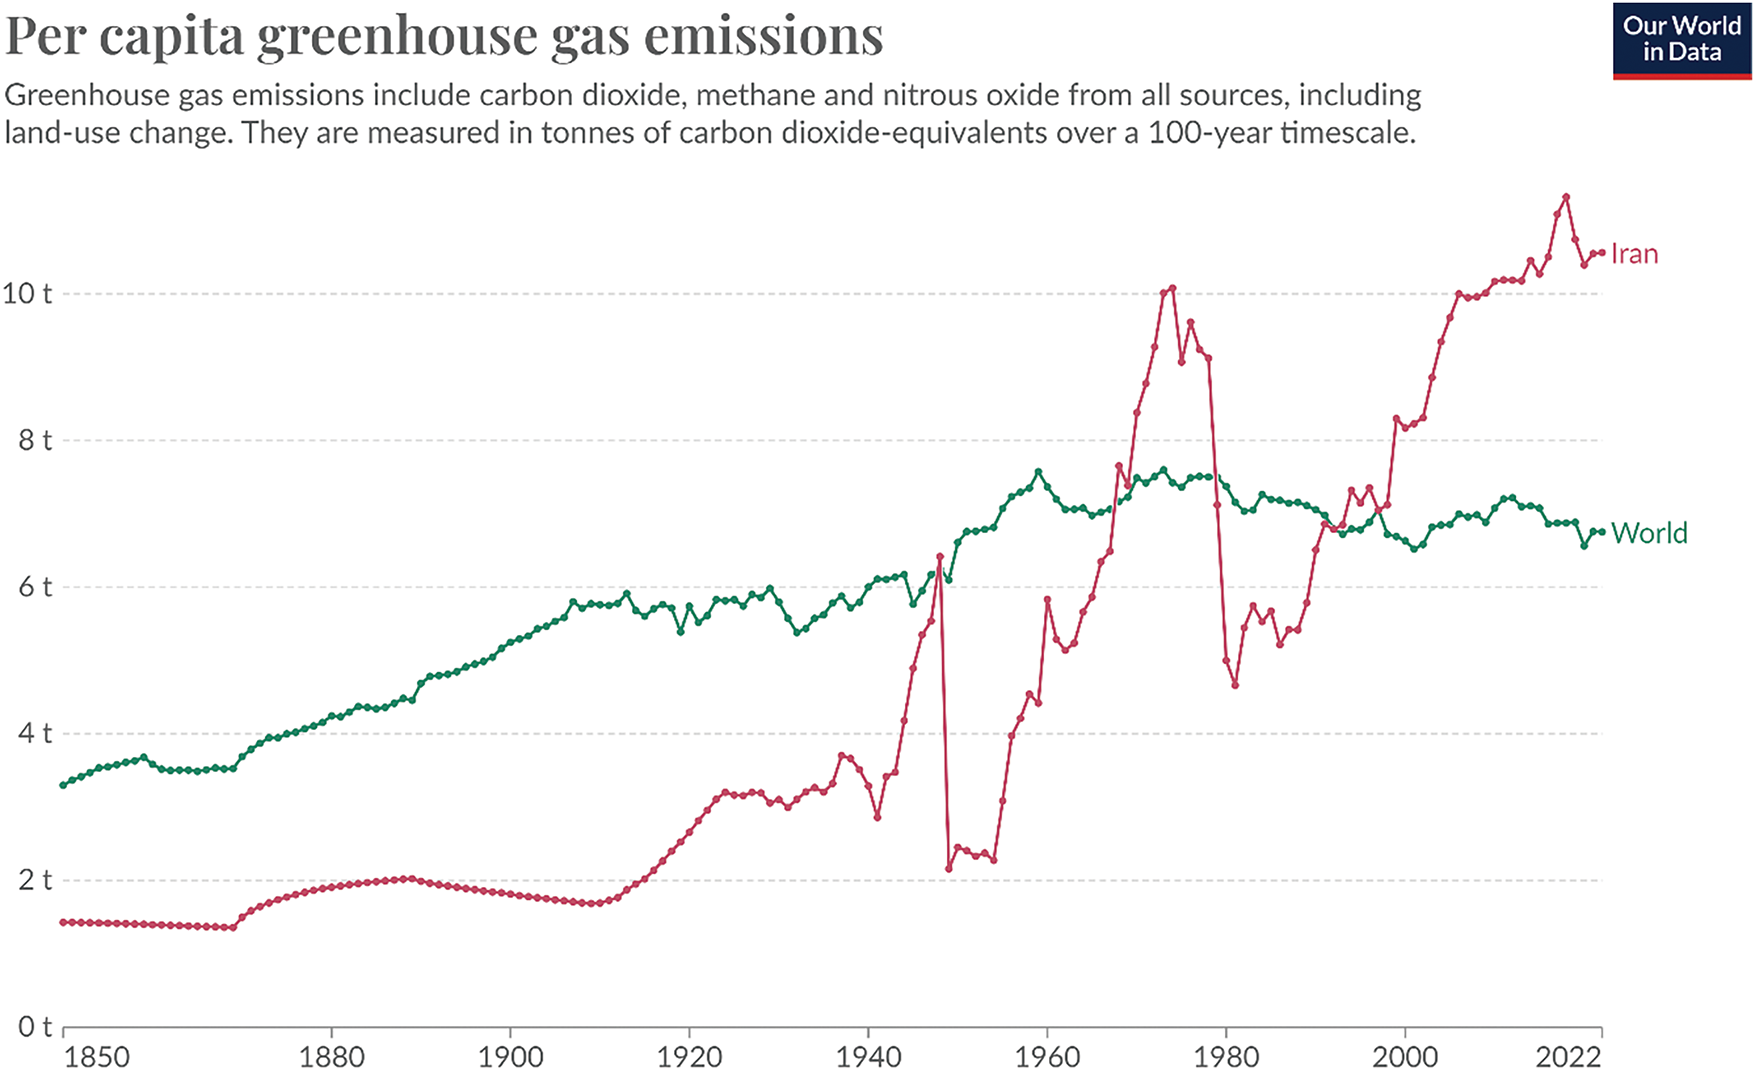
Figure 7: Per capita production of greenhouse gases in Iran and the world
Another perspective is comparing gross domestic product (GDP) with carbon dioxide emissions. Specifically, how much of the increase in CO2 emissions contributes to GDP growth? Globally, from 1990 to 2021, CO2 emissions increased by 61.81%, while GDP growth during the same period was 161.19%. In Iran, during the same timeframe, CO2 emissions increased by 227.74%, and GDP growth was 150.42%. This relationship is illustrated in Fig. 8.
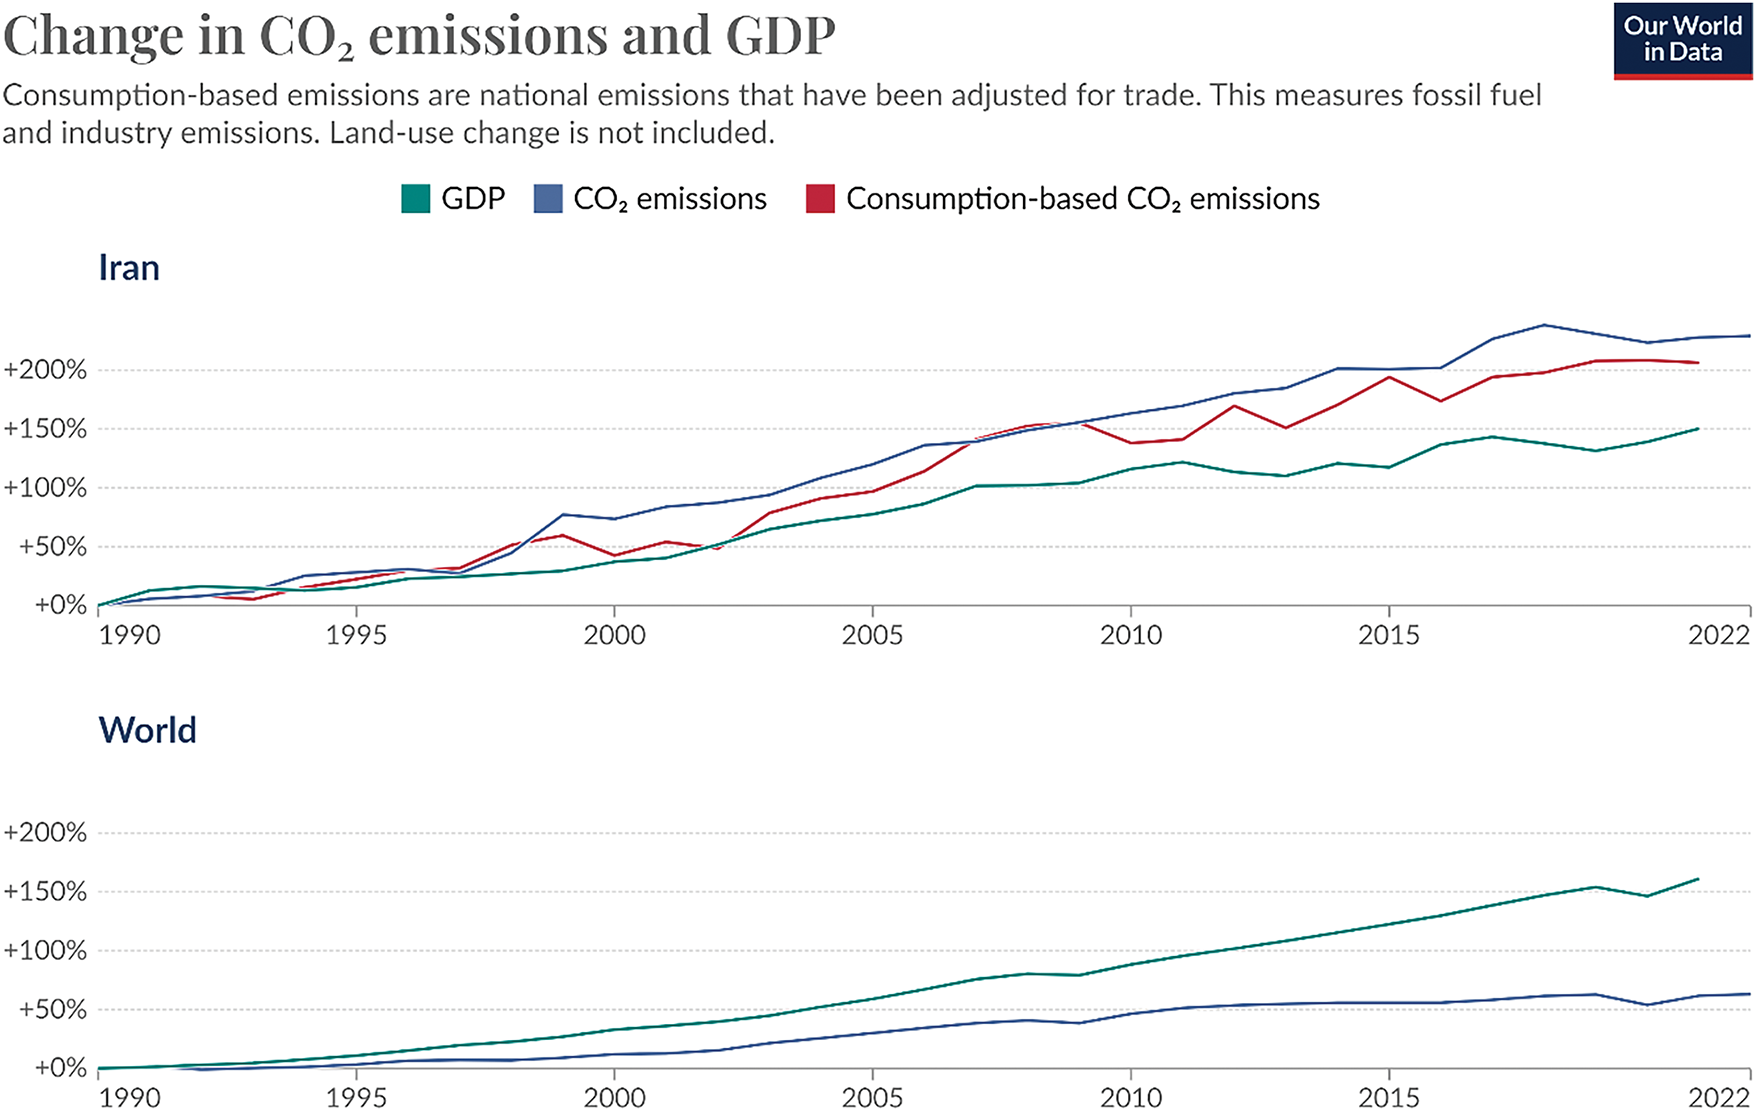
Figure 8: Comparison of carbon emissions and GDP in Iran and the world
The greenhouse gas emissions are being examined and categorized into various industrial, agricultural, transport, and other sectors. As you can see in Fig. 9, 31.3% of the world’s greenhouse gas emissions are attributed to heating and electricity production. Additionally, 15% is generated in the transportation sector. The construction sector ranks third with a share of 12.8%. Energy consumption in the building sector contributes 6.2% of global greenhouse gas emissions, placing it seventh.
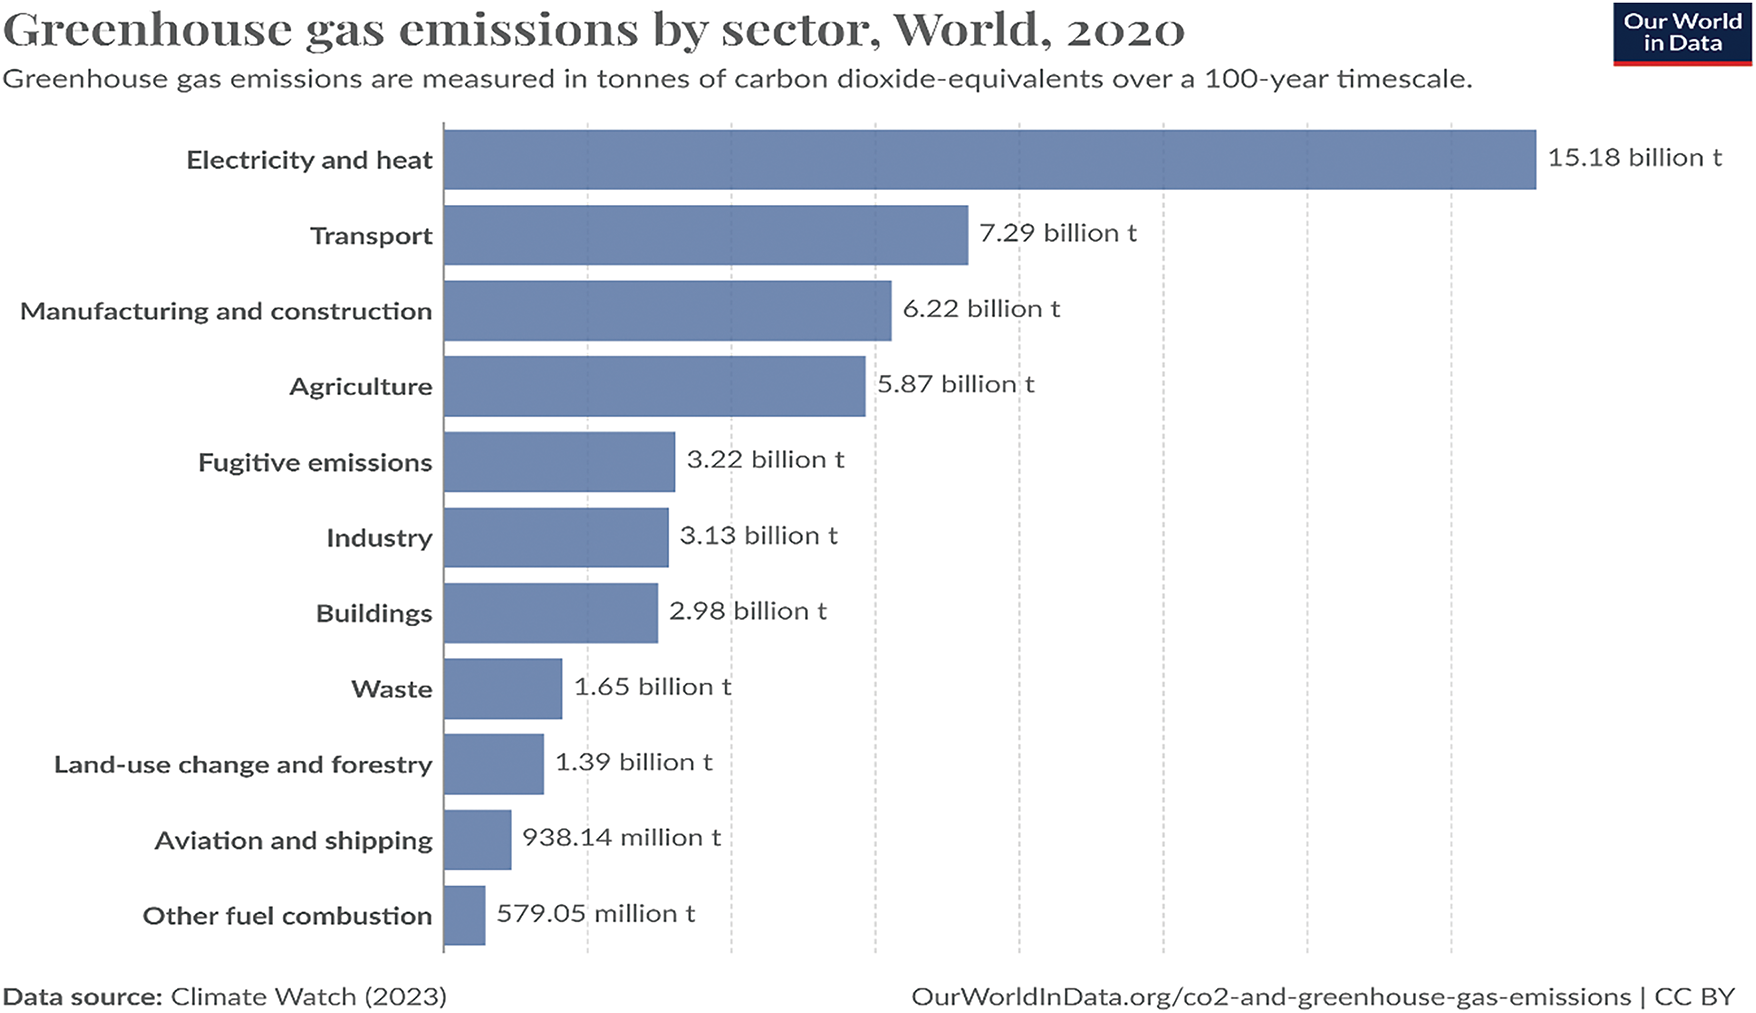
Figure 9: Separation of the source of greenhouse gas emissions in the world into different sectors
This breakdown and categorization in Iran are shown in Fig. 10. As you can see, electricity production and heating contribute to 23.9% of Iran’s total greenhouse gas emissions. Energy consumption in buildings ranks fourth with a share of 14.8%, while the construction sector ranks fifth with a share of 11.7%.
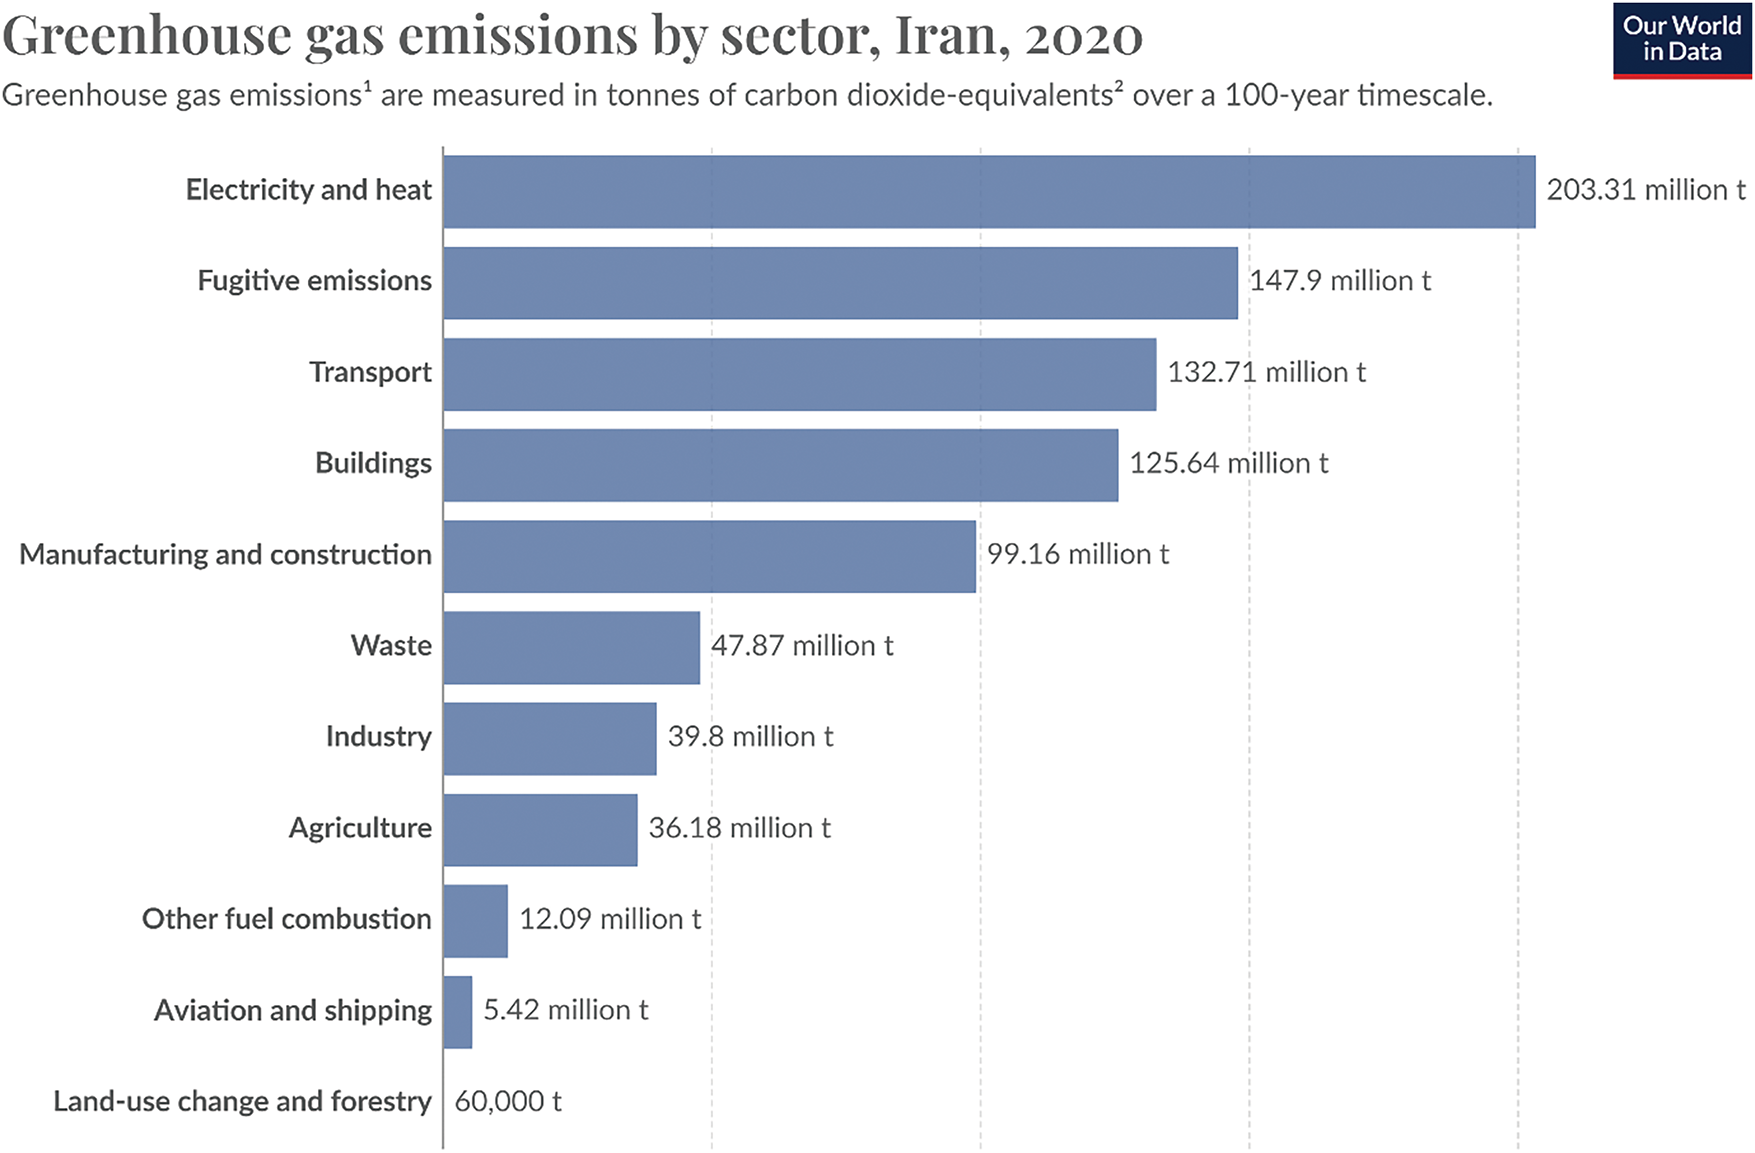
Figure 10: Separation of the source of greenhouse gas emissions in Iran into different sectors
The critical status of greenhouse gas emissions throughout the lifecycle of buildings in Iran becomes more evident when we consider the combined impact of the construction sector and energy consumption within buildings. Globally, this share amounts to 19%, but in Iran, this share reaches 26.5%. This highlights the importance of focusing on energy reduction and carbon mitigation in the construction industry. Notably, the share of greenhouse gas emissions from energy consumption in buildings even surpasses that of the construction sector. This underscores the significance of energy efficiency during the operational phase of buildings, leading to reduced greenhouse gas emissions over time.
In a study conducted by Gan and colleagues in 2024, titled “Measurement of Carbon Emissions from the Building Envelope of an Educational University Building in the City of Hefei,” key findings emphasize that the type and thickness of external wall materials significantly impact the embedded carbon during the production phase. Conversely, the choice of window materials is crucial for reducing greenhouse gas emissions during the operational phase of construction. The study examined various insulation materials for external walls, including expanded polystyrene (EPS), extruded polystyrene (XPS), graphite-enhanced polystyrene (GEPS), vacuum insulation panels, polyurethane boards, and mineral wool. Heat transfer coefficients for the external wall were tested with different insulation materials at various thicknesses (ranging from 10 to 100 mm). The cost-benefit analysis in this study explores the optimal balance between retrofit costs and carbon emissions, proposing various optimization scenarios based on different budget levels. The renovation cost for the target building is divided into three categories: less than 1 million yuan, 1 to 2 million yuan, and more than 2 million yuan. Considering carbon emissions during the building’s operational phase and emissions during the production of construction materials, an appropriate transformation plan can be selected for the specific building. Overall, seven retrofit designs were chosen, resulting in an annual reduction of 2.96–3.62 t of carbon emissions during the operational phase compared to the studied building and a reduction of 30.36 to 165.97 t of carbon emissions during the production of construction materials. When retrofit costs are less than 1 million yuan, it is recommended to use 50-mm extruded polystyrene for external walls, 70-mm GEPS for ceilings, and medium-transmittance glass for external windows. For retrofit costs between 1 and 2 million yuan, external walls made of expanded polystyrene (50 mm), ceilings made of graphite-enhanced polystyrene (70 mm), and low-emissivity glass windows are advantageous. When retrofit costs exceed 2 million yuan, it is preferable to use 25-mm vacuum insulation panels for external walls, 60-mm polyurethane boards for ceilings, and insulated glass for external windows. This study highlights the critical role of improving thermal insulation performance in building envelopes to reduce overall carbon emissions. External walls significantly impact carbon emissions and control retrofit costs during the production of construction materials, emphasizing the importance of adjusting insulation type and thickness for external walls. External windows also have a notable impact on carbon emissions during the operational phase. Therefore, optimizing the material choice for external windows is highly significant in reducing carbon emissions during building operations [1].
Seyyed Ali Mousavi Navaei and colleagues conducted research in 2024 on the impact of air gaps in walls on reducing energy consumption in a residential building located in Ahvaz. They investigated three different air gap thicknesses (1, 2.5, and 5 cm) to assess their effect on overall energy consumption, heating, and cooling loads during different months of the year. Monthly cooling loads decreased by 10.3%, 12.8%, and 14% in the warmest month, and monthly heating loads decreased by 32.8%, 42.3%, and 48.2% in the coldest month, respectively. Annual heating energy consumption decreased by 25.7%, 30.9%, and 33.6%, while annual cooling energy consumption decreased by 8.3%, 10%, and 9.1%, respectively. Considering the high annual cooling energy consumption, these reductions are significant [2].
Allahyari and colleagues conducted a study in 2022 titled “Energy Optimization in the Construction Sector Using Neural Networks and Particle Swarm Optimization Algorithm: A Case Study in Bandar Abbas County”. In this research, they explored various variables related to building materials, such as wall and ceiling materials, window area and type, and insulation thickness. Using the Design Builder software, they analyzed different scenarios. Ultimately, they developed a model that minimizes energy consumption and carbon dioxide production. The optimal model includes a brick wall with a 5 cm insulation thickness, a reinforced concrete ceiling with a 5 cm insulation layer, triple-glazed windows, and specific window-to-wall ratios. For instance, the north- and east-facing windows should cover 70% of the wall area, while the south-facing window-to-wall ratio should be between 41% and 43%. The west-facing window-to-wall ratio should range from 65% to 67% [3].
Seyed Mehdi Ghodousifar and Mahsa Faramarzi Asli conducted research in 2022 on the analysis of a movable double-skin façade system’s efficiency in energy consumption for sustainable residential buildings in Tabriz. Their results demonstrated that in cold seasons, blocking the upper and lower parts of the double-skin façade trapped air and acted as insulation, reducing energy loss. In warm seasons, allowing airflow between the two skins increases heat transfer from the building, resulting in reduced indoor temperatures [4].
Fatemeh Mozafari Ghadikolaei and colleagues conducted research in 2022 titled “Principles of Residential Building Façade Design in Warm and Humid Climates for Indoor Temperature Reduction Based on Vernacular Architecture”. The study investigated the thermal performance and solar radiation absorption and transfer to the interior space by the façade of an apartment building in the warm and humid climate of Bushehr. The impact of vernacular architectural façade design strategies on reducing indoor temperatures was then assessed. Optimal façade performance included vertical roller blinds, latticed windows, and white cement façades, resulting in a cooling load reduction of up to 38% and an overall building load reduction of 33% [5].
Additionally, in a study by Ustaoglu and colleagues in 2021, titled “Investigation of Environmentally Compatible Building Materials with Enhanced Energy Performance in Different Climatic Regions: Cost-Effective, Low-Energy, and Low-Carbon Emissions,” they explored the use of various additives such as lightweight aggregates, expanded vermiculite, fly ash, and sludge ash for producing fired clay bricks and lightweight concrete foams. For instance, instead of using conventional insulation materials available on the market, they employed lightweight concrete containing expanded vermiculite. They also replaced ordinary bricks with a new type of fired clay brick. Ultimately, annual energy savings and cost savings for different brick and lightweight concrete thicknesses were calculated, along with greenhouse gas emissions from various fuels (coal, electricity, furnace oil, liquefied gas, and natural gas). The results demonstrate that using these new building materials leads to energy savings of 11 kWh/m2 in an insulated building and 31.2 kWh/m2 in an uninsulated building. The annual energy savings rate reached 21.7%. The most significant energy savings occurred in buildings using electricity for heating. The highest carbon emissions were associated with coal. Natural gas was the cleanest heating option. Electricity contributed the highest carbon emissions after coal in the studied region. Additionally, carbon reduction for coal reached 18.7 kg/year. By utilizing these new materials, maximum carbon reduction reached 22% [6].
Aghakhani and colleagues conducted a study in 2021 titled “Environmental Effects of Using Concrete, Brick, and Wood in Construction on Energy Consumption and Carbon Emissions: A Case Study in Northwestern Iran”. In this research, they investigated three types of building materials: brick, concrete, and wood. For each material, they examined three production factories and collected data related to electricity consumption, gas usage, human labor in the production line, and diesel fuel consumption for transportation (both rail and road). Using software tools like Revit for modeling and Energy Plus for energy analysis, they calculated average energy consumption and embodied energy (embodied energy) for each material. Additionally, they determined the amount of carbon dioxide emissions associated with each material. Their findings revealed that wooden beams are the most environmentally friendly, while concrete is the most polluting among these materials [7].
Fathalian and Kargar, in their research conducted in 2021 titled “Investigating the Impact of Various Energy Optimization Strategies on Building Energy Classification Using Design Builder Software: A Case Study of an Office Building”. Explored the effects of different energy optimization strategies on building energy classification. They focused on an office building located in Semnan, Iran. The study involved simulating the total energy consumption of the building using Design Builder software and validating the results against actual energy consumption data from utility bills in 2016–2017. Subsequently, they compared various optimization approaches based on the building’s energy consumption criteria. The findings revealed that replacing external sunshades with internal ones, along with upgrading standard windows to double-glazed windows, resulted in the least energy savings and had no significant impact on energy classification. However, a combination of double-glazed windows and thermal insulation in the external walls proved to be the most effective proposed solution for energy optimization [8].
Soler and colleagues conducted a study in 2020 titled “Using Integer Linear Programming to Minimize the Embodied Carbon Dioxide Emissions in the Opaque Facade of a Building”. In this research, they considered embodied carbon emissions in the building materials of the external shell and incorporated other shell construction parameters, such as maximum allowable heat transfer, wall thickness, and materials for different wall layers. By using linear programming, they aimed to minimize the amount of emitted carbon dioxide. They selected seven different layers for the walls and defined 70 different scenarios. Ultimately, they found that choosing appropriate materials could reduce embodied carbon emissions by up to 78.5% [9].
Dabaieh and colleagues conducted a comparative study in 2020 titled ‘Comparative Study of Carbon Emissions and Embodied Energy Between Sun-Dried Bricks and Fired Bricks’. This study compared the life cycle carbon emissions and calculated the embodied energy between two types of bricks: sun-dried clay bricks and kiln-fired bricks. It served as a tool for evaluating energy and assessing the impact of weather conditions on both brick types and economic production factors. The focus was on the difference in the production chain between sun-dried clay bricks, which represent traditional norms, and kiln-fired bricks, which are the most commonly used wall materials in ordinary buildings. The results of this study indicate that using sun-dried bricks instead of fired bricks can lead to a reduction of up to 5907 kg of emitted carbon dioxide and 5305 megajoules of embodied energy per 1000 bricks produced. The article concludes by presenting alternative scenarios for brick production and suggesting improvements for sun-dried brick manufacturing. The method used in this study contributes to the development of a comparative research approach for evaluating material choices in construction. This research highlights the importance of sustainable practices in the construction industry, emphasizing the need to reduce carbon emissions and promote environmental balance while maintaining economic viability [10].
“Optimization of Two-Level Approach for Sustainable Development and Carbon Emission Reduction in the Building Materials Industry: A Case Study in China”: In their 2020 research, Xu and colleagues explored an optimal two-level approach for sustainable development and carbon reduction in the building materials industry. They used a balanced Stackelberg equilibrium method to balance economic interests and carbon reduction. The main focus of their study was on material production quantities and transportation methods. The proposed model was applied to a case study in China, demonstrating its effectiveness in reducing carbon emissions associated with material transportation. It encourages building material suppliers to adopt environmentally friendly initiatives. By increasing the production and sale of sustainable products, significant strides can be made toward carbon reduction goals. The study also provides practical approaches based on the results to assist regional authorities in controlling carbon emissions in the construction industry [11].
Karami and Anbarzadeh 2020 conducted a study 2020 titled “Optimization of Building Insulation Thickness under Different Climatic Conditions with an Environmental Approach”. The objective of this study was to investigate the impact of optimizing insulation thickness on carbon dioxide (CO2) emissions under various weather conditions. Initially, they modeled a sample building in different climatic regions of Iran using Design Builder software. Next, they employed a genetic algorithm (implemented in MATLAB) for optimization. Finally, based on the obtained results, they analyzed the environmental implications and compared the optimal insulation thickness for buildings over ten years in various Iranian cities. The findings revealed that the overall CO2 emissions over the ten years were lowest in cold and dry climates (e.g., Tabriz) and highest in warm and humid climates (e.g., Bandar Abbas), with values of 350 and 770, respectively [12].
Mohaghar and colleagues in 2020 conducted research titled “Examining Policies for Reducing Carbon Dioxide Emissions from the Construction Industry Using a Dynamic Model”. In this article, they developed a dynamic model that simulates CO2 emissions from the building supply chain. Simulation results using the Vensim software demonstrated that implementing incentive policies, formulating restrictive laws and regulations, and promoting green supply chain practices can reduce the growth of carbon dioxide emissions from the construction industry [13].
In another study, Saaebi Safa and colleagues conducted research in 2020 titled Auditing the amount of energy loss through the external walls of the building and the effect of thermal insulation by simulation in Design Builder software. They examined parameters such as reducing indoor design temperature from 24°C to 22°C, replacing triple-glazed windows with double-glazed ones, and adding 5 cm of rock wool insulation to the external walls. Their simulation results demonstrated the clear and substantial impact of thermal insulation on energy efficiency [14].
Marco Pedroso and colleagues conducted research in 2020 titled “Characterization of a multilayer external wall thermal insulation system. Application in a Mediterranean climate”. This study compared the performance of a multilayer thermal insulation system with a super-insulating layer under Mediterranean climate conditions. Mechanical, physical, and microstructural tests were performed on the insulating layers. The protective layers in a multilayer system demonstrated improved mechanical performance and water resistance. When compared with other existing multilayer products on the market, this new solution provided competitive results, indicating improved performance under real operational conditions [15].
In 2019, Ildarabadi and colleagues conducted research titled “Optimization of Construction Materials Consumption Using Innovative Building Technologies and Its Impacts on Sustainable Development with a Focus on Reducing Carbon Dioxide Emissions”. This article examines the role of the appropriate design of roof structural systems in concrete buildings for sustainable development, emphasizing the reduction of carbon dioxide emissions. To achieve this goal, they redesigned the structure of Elizeh Building No. 1 in Mashhad, using a double-sided waffle slab roof system. The amount of concrete consumed due to the use of double-sided waffle slab and double-sided waffle deck systems was estimated, and ultimately, the carbon dioxide emissions resulting from the implementation of these two roof structural systems were calculated. The results indicate that changing the roof structural system leads to approximately 800,000 kg of concrete savings and prevents the emission of around 800 t of carbon dioxide [16].
Furthermore, Yaghoub Gholipour and Fatemeh Yousefi conducted a study in 2018 titled “Life Cycle Assessment of a real residential building in Tehran”. Their study focused on a typical concrete-framed building with a common floor plan. They estimated the energy consumption throughout the building’s life cycle. Notably, the initial embodied energy accounted for approximately 13% of the total energy over the building’s lifespan, falling within the global range. Additionally, 85% of the building’s energy consumption occurred during the operational phase, which is relatively high compared to global standards, considering the relatively short lifespan of buildings in Iran [17].
As noted, numerous studies have been conducted internationally and nationally on reducing the production and emission of carbon dioxide and greenhouse gases in the construction industry. Generally, these studies can be divided into three categories: Studies that address the pre-construction phase and focus on embodied carbon. Studies that address the construction phase and examine carbon emissions resulting from energy consumption for construction. The third category includes studies that target the post-construction phase and the operational period and examine carbon emissions resulting from energy consumption for heating, cooling, lighting, and so on.
The main gap and deficiency observed in previous research is the disregard for the total embodied and emitted carbon during the operational period. Few studies have addressed all three phases or even two of the above phases. Also overlooked is the importance of comprehensive studies regarding the impact of facade materials to define the various layers for the wall (core and intermediate layers, inner layer), the external shell (outer layer and exterior front), considering different construction materials for each of these layers, as well as placing different insulation materials between these layers.
Therefore, this research endeavors to reduce the impact of the construction industry on the environment by measuring carbon emissions in buildings during the operational and pre-operational phases and examining various scenarios of external wall building materials using practical methods.
Given the nature of the data, this research falls into the quantitative category. Since it measures the energy loss variables by varying the types of building envelope materials and thermal insulations used, it employs a correlational approach.
Considering that the goal of this study is to improve behaviors, methods, materials, and insulation used in construction, leading to the development of practical knowledge in the construction industry, it qualifies as applied research.
For this research, Design Builder software version 6.1.0.006 was utilized.
Design Builder Software:
Design Builder software facilitates building modeling from various aspects, including building physics (construction materials), architectural design, heating and cooling systems, lighting systems, and more. Apart from modeling heating and cooling loads, it dynamically simulates various energy usages in buildings, such as heating, cooling, lighting, appliances, and domestic hot water. Additionally, it can model daylighting and even CFD (Computational Fluid Dynamics). Other capabilities include natural and mechanical ventilation modeling, thermal comfort assessment in indoor spaces, and energy gains/losses from different building components. The results of these simulations can be extracted for the entire year, specific months, daily, and even hourly. Furthermore, the results can be obtained for the entire building, different floors, and individual spaces. A special feature of this software is the ability to present modeling results in the form of diagrams or tables, which can be useful for subsequent analyses.
Some common applications of this software are:
1. Calculating the energy consumption of the building.
2. Calculating the amount of embodied carbon, separated by the materials used and structural elements.
3. Calculating the amount of carbon emissions during operation.
4. Evaluating different facade types in heating.
5. Simulating the heating of buildings with natural ventilation.
6. Reporting the amount of electricity consumed due to the use of natural light.
7. Predicting the distribution of natural daylight through radiation simulation.
8. Calculating the size of heating and cooling equipment.
9. Performance characteristics of the air conditioning system and natural ventilation system, which include the impact of the required air distribution on the temperature and distribution speed in each room using CFD.
10. Separating energy consumption by fuel type.
11. Calculating the cost of construction.
The simulation engine of the Design Builder software is EnergyPlus.
EnergyPlus is a building energy simulation program that engineers, architects, and researchers use to model energy consumption for heating, cooling, ventilation, lighting, process loads, and water consumption in buildings.
Some of the notable features and capabilities of this software include:
1. Provides advanced and dynamic thermal simulation in sub-hourly time steps.
2. Provides accurate environmental performance data, such as energy consumption, carbon emissions, and room comfort, at annual, monthly, daily, hourly, and sub-hourly intervals.
3. Reports solar gains on surfaces, surface temperatures, and radiative exchanges.
4. Access to a wide range of results for buildings and systems.
5. Evaluate passive performance, thermal mass, and temperature distribution.
6. Calculate the size of heating and cooling systems.
7. Evaluate operating costs and total building life cycle costs using industry-standard calculation methods.
8. Exports surface temperatures and airflow rates as boundary conditions for detailed CFD analysis.
Flexibility and Simulation Documentation of Design Builder Software:
Most other tools and software use a “black box” approach to simulation, meaning you do not have access to the inputs, raw simulation outputs, and the code used to run the simulations, and therefore, you can never really be sure what is happening behind the screen. Design Builder simulation is different. With EnergyPlus, you have full access to the source code and documentation that thousands of experts and academics have extensively tested, and when you need to model facade, systems, or operating modes that are not offered out-of-the-box, you can customize your simulations to match the real-world situation through a range of methods. Modify simulation input files manually or automatically in a script. Customize the simulation using runtime programming. Modify the EnergyPlus source code. No other mainstream simulation tools offer as much flexibility in an easy-to-use package as EnergyPlus.
Design Builder Software Technical Specifications:
1. Calculates heating and cooling loads using the ASHRAE standard-approved method implemented in EnergyPlus.
2. Design weather data is included within the software, and loads can be reported at the zone, system, and project levels. You can run simulations of your model using actual hourly weather data to examine how the building performs in real-world operating conditions.
3. Daylighting—modeling of lighting control systems using photoelectric sensors in each zone, and calculation of electrical lighting savings. You can choose between stepped or continuous dimming.
4. You can examine the effects of design alternatives on key design parameters such as annual energy consumption, hours of overheating, or carbon dioxide emissions.
5. You can break down energy consumption by fuel and end-use.
6. Indoor air, average temperature, and radiant and operative coolness are calculated.
7. Ability to calculate heat transfer through building elements, including walls, ceilings, infiltration, ventilation, etc.
8. Ability to calculate heating and cooling loads and the amount of carbon dioxide produced.
9. Environmental performance data is displayed without the need to run external modules or import data. Any simulation required to generate the data starts automatically.
10. Natural ventilation can be modeled with an option to open windows based on control schemes, including mixed mode.
11. Glazing systems, including frames, dividers, and reveals, are modeled in great detail using the most accurate simulation algorithms available. Innovative facade systems, such as electrochromic glazing, can be simulated.
12. Shading by louvers, overhangs, and side fins, as well as internal and intermediate curtains and blinds.
13. Architectural features such as columns, canopies, and complex shading devices, as well as the effects of shading and reflection, can be specified.
14. Parametric analysis capability allows you to examine the impact of changes in design parameters on a range of performance metrics.
The case study in this research involves a five-story residential building located in Tehran. The ground floor serves as a parking area, while the other four floors are residential units. Each floor contains one apartment unit with an approximate area of 100 square meters. Each apartment includes two bedrooms, an open kitchen, a living room, a bathroom, a toilet, and a balcony. The floor plan zoning is depicted in Fig. 11, with the building oriented to the south, where the living room and kitchen are on the north side and the bedrooms are on the south side. The land area is 250 square meters, with an occupancy area of 150 square meters. Exterior views of the building are shown in Fig. 12A,B.
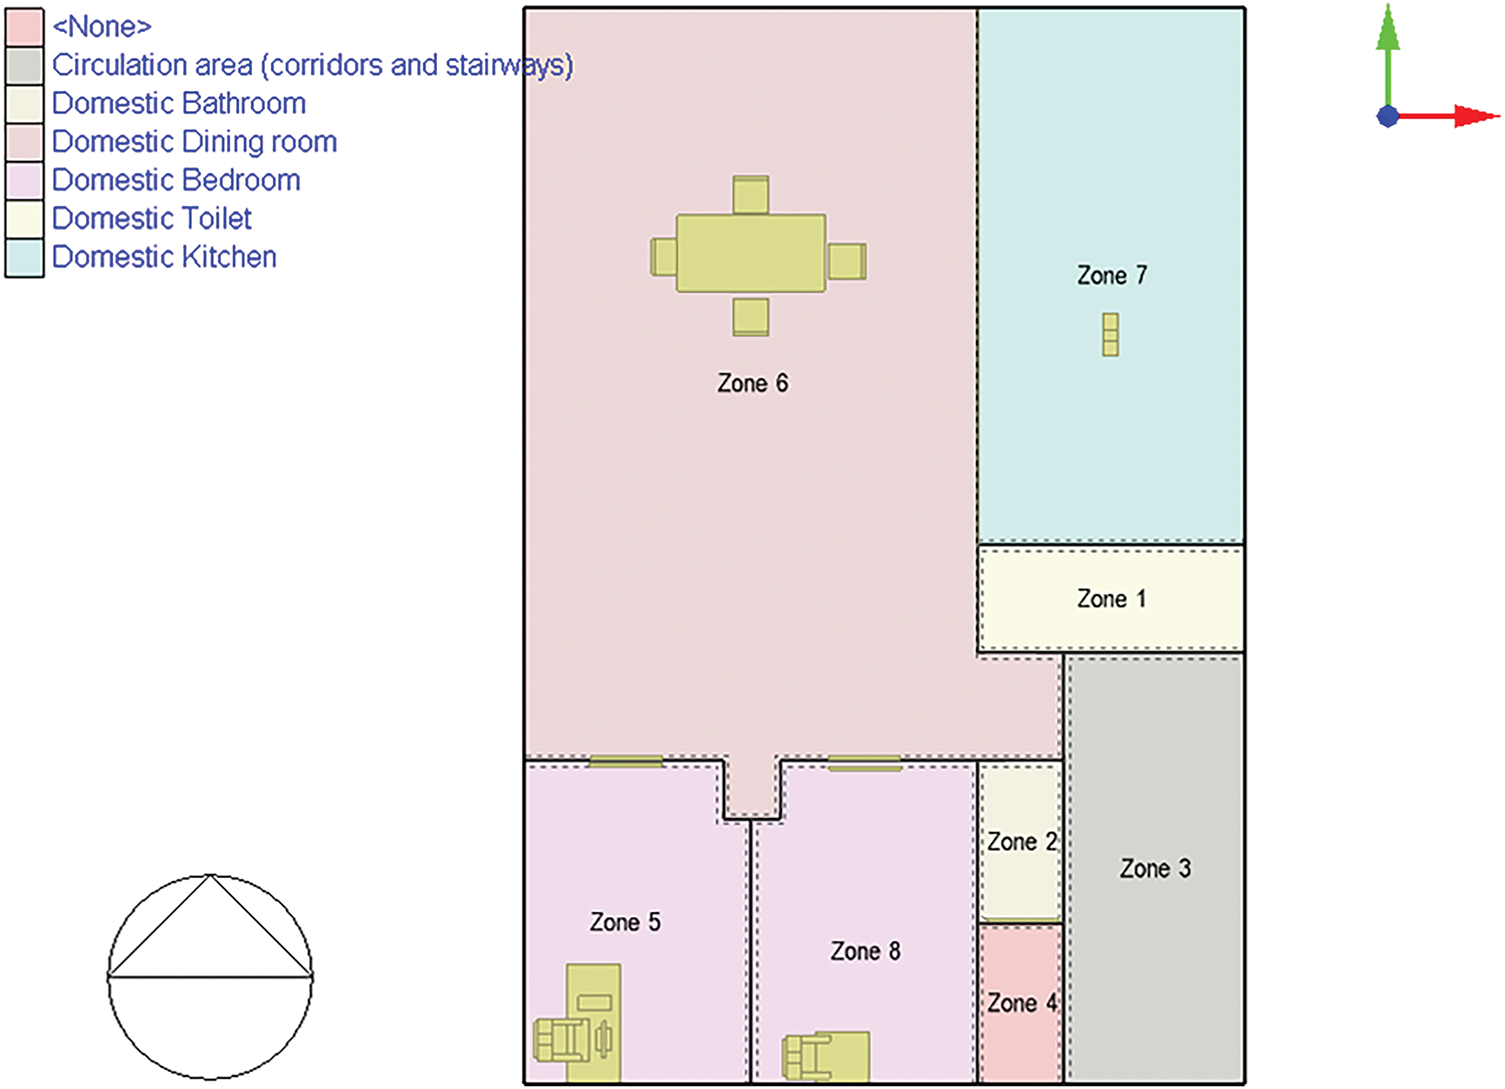
Figure 11: Building plan and zoning
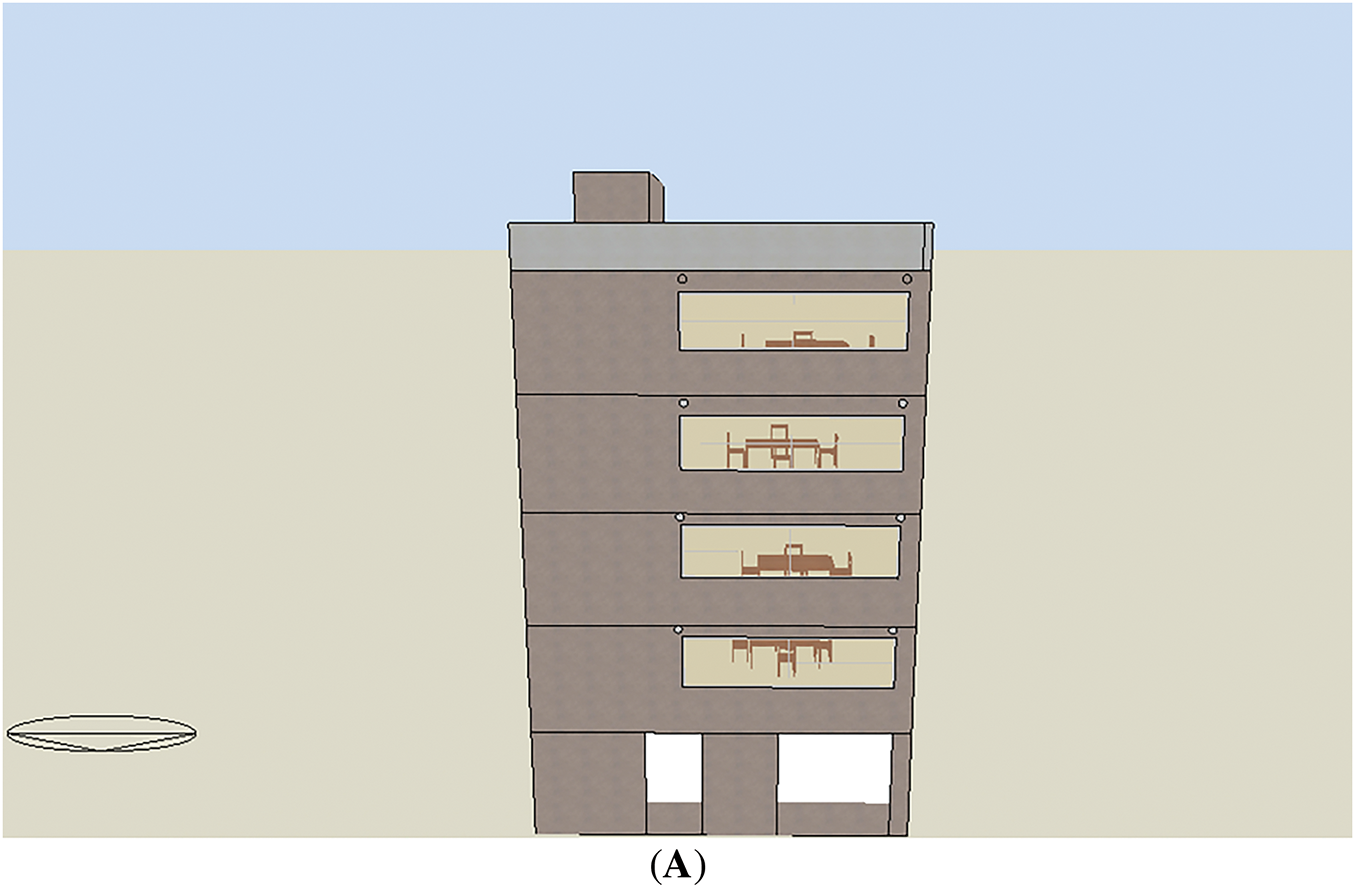
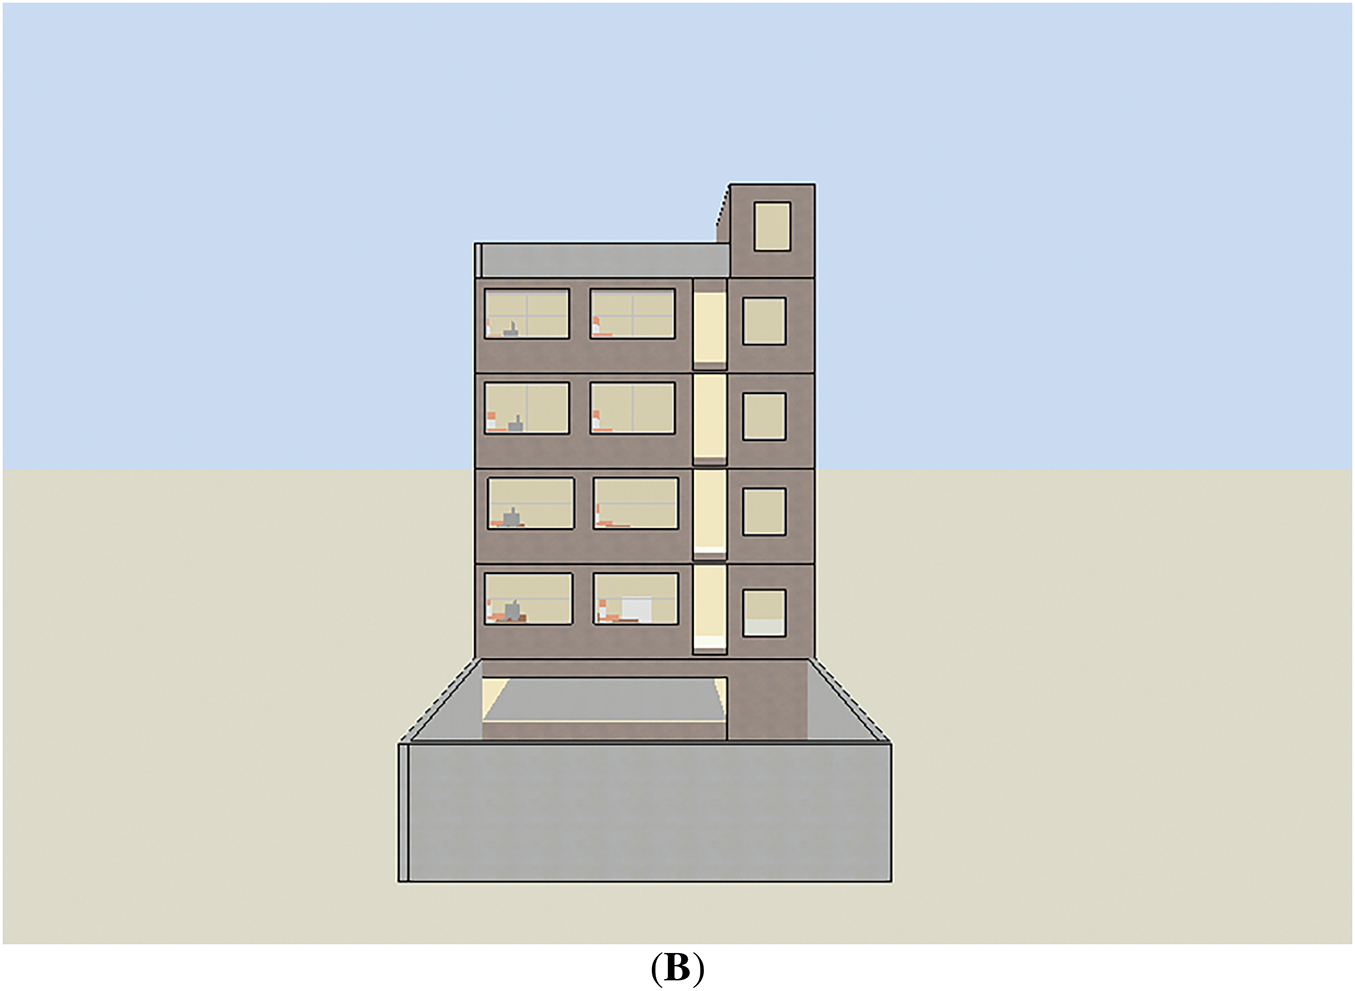
Figure 12: (A) Northern façade; (B) Southern facade
Building Components:
• Roof (Top Layer) Defined with 5 layers:
1. First layer: Bituminous waterproofing (a protective polymer layer based on bitumen and synthetic fibers) with a thickness of 3 mm.
2. Second layer: Cement plaster with a thickness of 2 cm.
3. Third layer: Concrete foam with a thickness of 20 cm.
4. Fourth layer: Reinforced concrete with a thickness of 20 cm.
5. Fifth layer: Gypsum and clay with a thickness of 2 cm.
• Interior Walls (3 layers):
1. First layer: Gypsum and clay with a thickness of 2 cm.
2. Second layer: Lightweight aerated concrete blocks with a thickness of 10 cm.
3. Third layer: Gypsum and clay with a thickness of 2 cm.
• Floor (Parking Level, 4 layers):
1. First layer: Granite stone with a thickness of 3 cm.
2. Second layer: Cement plaster with a thickness of 2 cm.
3. Third layer: Hand-compacted soil with a thickness of 20 cm.
4. Fourth layer: Reinforced concrete with a thickness of 1 m.
• Intermediate Floors and Ceilings (5 layers):
1. First layer: Ceramic tiles with a thickness of 1 cm.
2. Second layer: Cement plaster with a thickness of 2 cm.
3. Third layer: Concrete foam with a thickness of 10 cm.
4. Fourth layer: Reinforced concrete with a thickness of 20 cm.
5. Fifth layer: Gypsum and clay with a thickness of 2 cm.
• Exterior Walls (5 layers):
1. First layer: Façade materials (variable).
2. Second layer: Insulation layer (variable).
3. Third layer: Lightweight aerated concrete blocks with a thickness of 15 cm.
4. Fourth layer: Another insulation layer (variable).
5. Fifth layer: Gypsum and clay with a thickness of 2 cm.
• Windows (30% of wall area):
○ Double-glazed windows (2 layers of 3 mm clear glass with a 6 mm air gap).
○ UPVC frames without external shading, but with internal roller blinds made of aluminum.
• Natural Ventilation:
○ Each unit has two non-mechanical ventilation openings with roller blinds, circular in shape, and a diameter of 10 cm.
• Lighting:
○ All lighting is LED, and external façade lights have sensors, operating for 12 h.
• Heating and Domestic Hot Water:
○ Gas-based heating and domestic hot water system (one unit per zone).
○ Cooling system: Water-cooled air conditioning with electricity consumption.
• Unit Zoning:
Each unit is divided into the following zones:
1. Living room
2. Open kitchen
3. Two bedrooms
4. One toilet
5. One bathroom
6. One balcony connected to one of the bedrooms.
• Occupancy:
○ Each unit accommodates 4 people.
• Weather Data:
○ Weather data for the region was provided to the software via a file.
The building floor plan and zoning are shown in Fig. 11, and the building façade is shown in Fig. 12A,B.
The geographical location of this building is at 68.35° latitude and 32.51° longitude. The building’s elevation above sea level is 1191 m. The prevailing wind direction is from west to east, with an average speed of 11.9 m per second. Weather simulation data from Tehran’s Mehrabad Airport has been used for the analysis.
The heating system in each unit consists of wall-mounted gas heaters and radiators. Each unit has five radiators installed. The hot water supply for each unit also comes from the same system, while the cooling system relies on electricity.
Regarding the structural elements, they are categorized based on their controlled or uncontrolled exposure and various types, as shown in Fig. 13A,B.
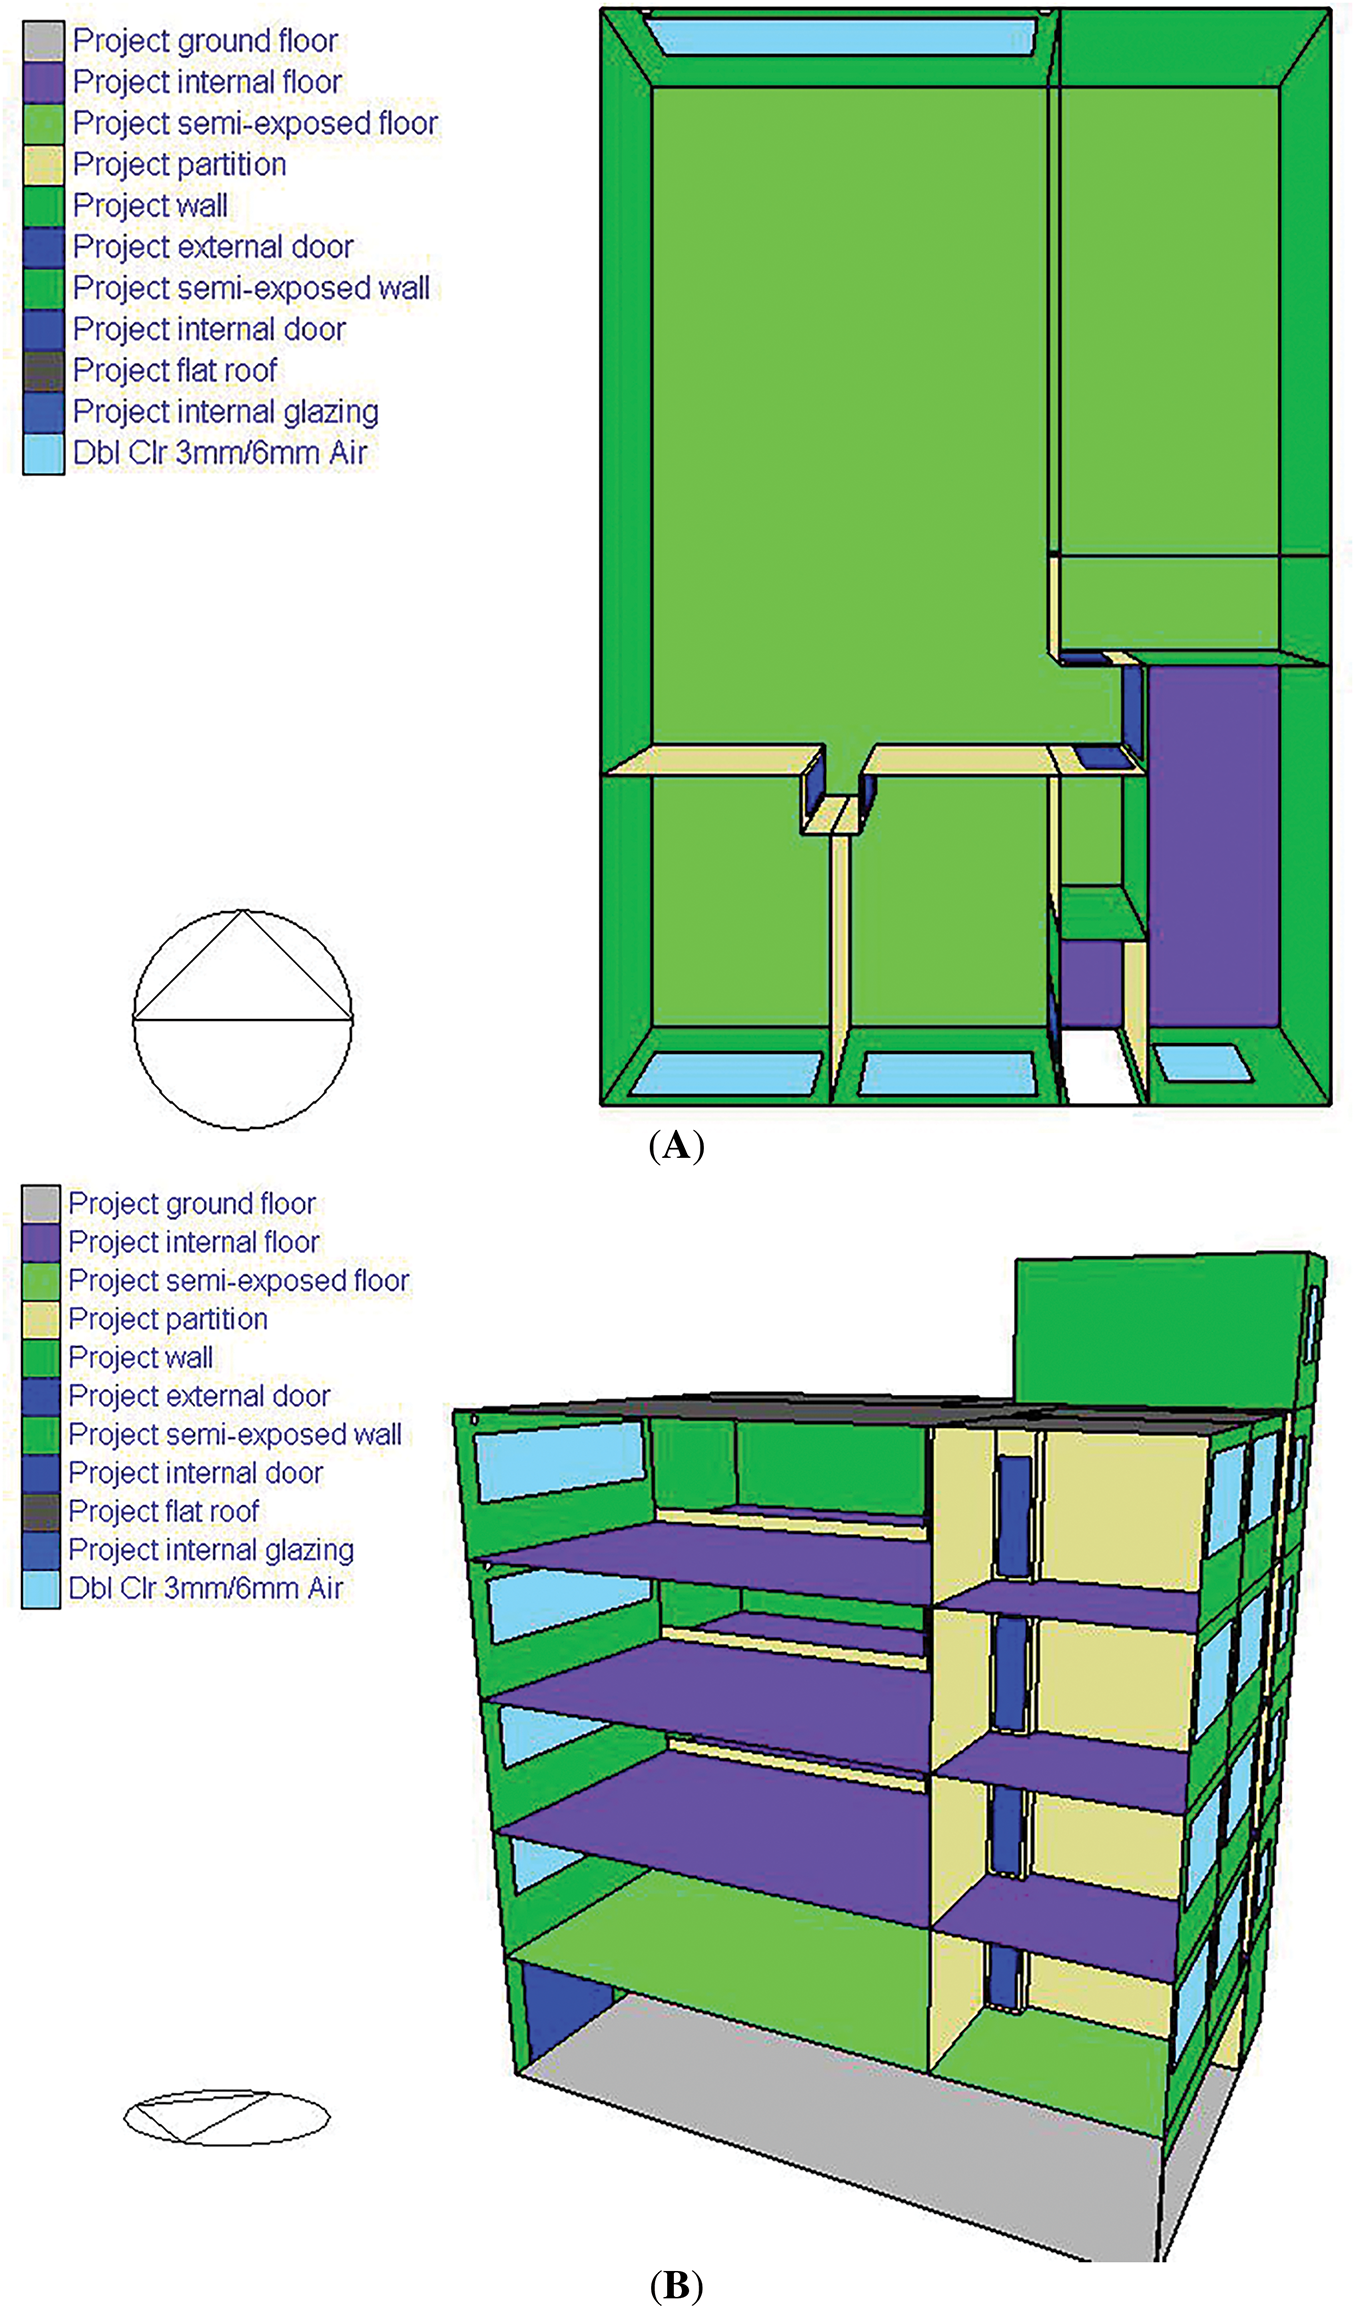
Figure 13: (A) Building surfaces and openings; (B) Building surfaces and openings
1. Data Collection:
○ Gather architectural, structural, electrical, and mechanical plans for the studied building.
2. Weather Data Preparation:
○ Compile relevant weather information.
3. Building Use Definition:
○ Specify the intended use of the building.
4. Building Model Creation:
○ Develop a model of the building.
○ Define zones within each unit.
5. Zone Definition:
○ Assign specific uses to each zone.
6. Material Definitions and Structural Elements:
○ Define building materials and structural components.
7. Opening Definitions:
○ Specify openings (doors, windows, etc.).
8. Lighting Definitions:
○ Define lighting systems and their intensity.
9. Heating and Cooling System Definition:
○ Describe the heating and cooling systems used in the units.
10. Model Simulation:
○ Simulate the building model.
11. Output Compilation:
○ Collect simulation results in a table.
Fathalian and Kargar Sharifabad (2019) in research titled Investigating the effect of different energy optimization strategies in building energy classification using design builder software, and Zomorodian and Tehsil Doost (2019) in research titled Validation of energy simulation software in buildings: with an experimental and comparative approach. Validation of two energy simulation software programs, Eco Tech and Design Builder. Witt et al. (2001), Heninger et al. (2003), and Gatti (2003) have each investigated the validity of Energy Plus software in separate research. In all the above research, the validity and correctness of the results of these software programs have been confirmed. Also, by studying the results of the following tests, which are based on different standards, you can be sure of the accuracy of the results and outputs of the Design Builder and Energy Plus software.
– EnergyPlus Testing with ANSI/ASHRAE Standard 140-2001;
– EnergyPlus Testing with HVAC BESTEST Part 1—Tests E100 to E200;
– DesignBuilder v6 Compliance With ANSI/ASHRAE/ACCA Standard 183-2007;
– ANSI/ASHRAE Standard 140-2017 Building Thermal Envelope and Fabric Load Tests DesignBuilder v6.1 with EnergyPlus v8.9 27 January 2021;
– ANSI/ASHRAE Standard 140-2017 Space-Cooling Equipment Performance Analytical Verification Tests AE101 to AE445 DesignBuilder v6.1 with EnergyPlus v8.9 27 January 2021;
– ANSI/ASHRAE Standard 140-2017;
– Space-Cooling Equipment Performance Analytical Verification Tests CE100 to CE200 DesignBuilder v6.1 with EnergyPlus v8.9 27 January 2021;
– ANSI/ASHRAE Standard 140-2017 Space-Heating Equipment Performance Tests;
– HE100 to HE230 DesignBuilder v6.1 with EnergyPlus v8.9 27 January 2021.
In each scenario, external walls are generally composed of three layers: the wall base, the interior shell, and the exterior shell. An insulation layer may have been applied before installing the shell on each side. Therefore, external walls can consist of a minimum of 3 layers and a maximum of 5 layers.
By combining these different layers, a total of 715 different configurations has been defined. These various states are specified with specific codes. The definitions of these codes are provided in Table 1.
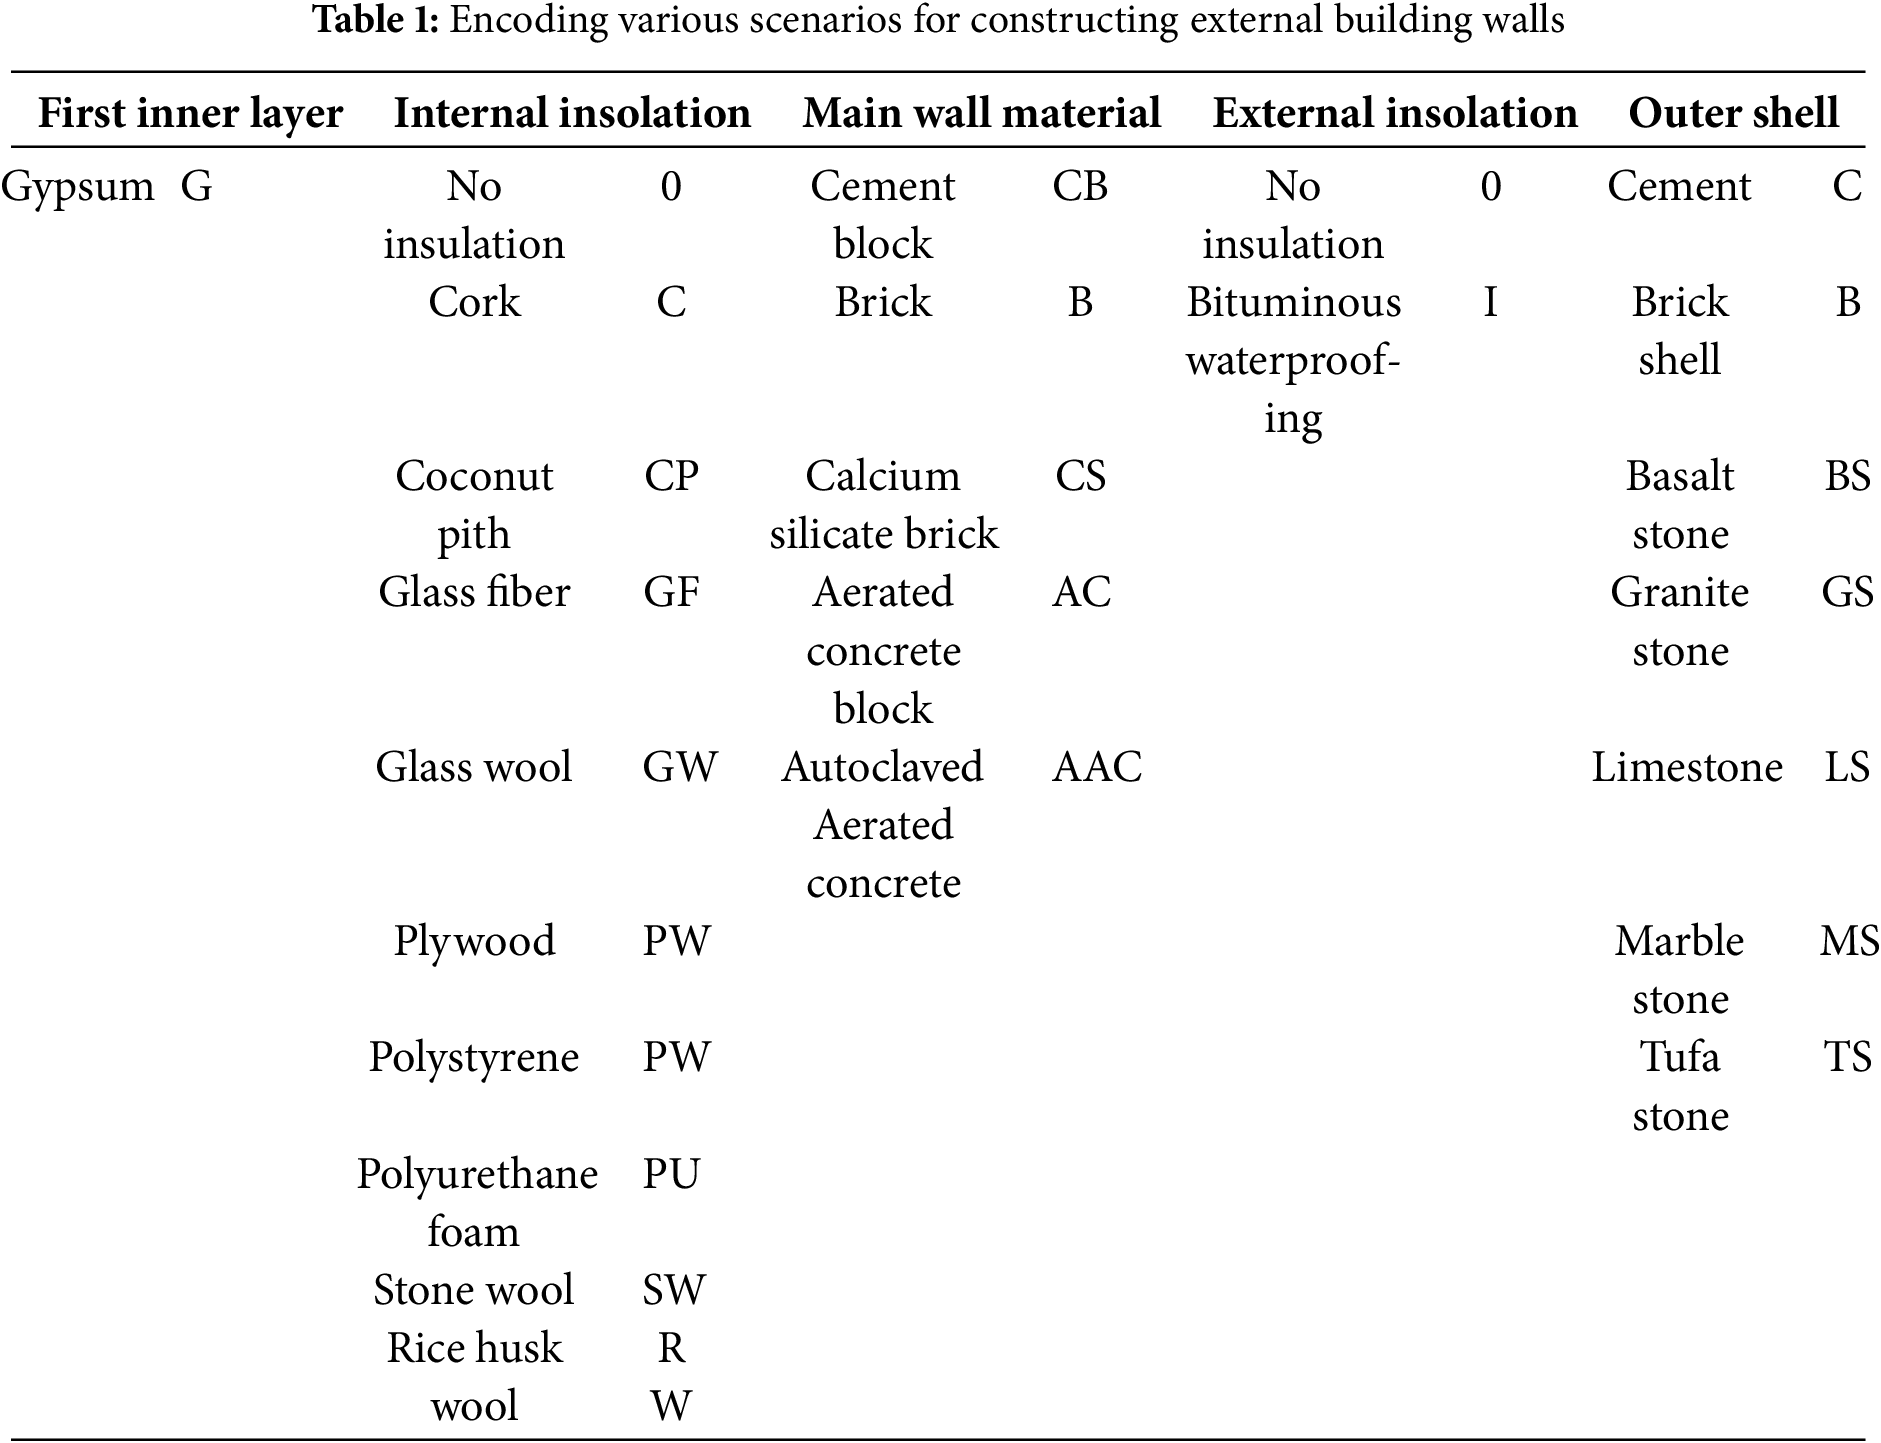
In all cases, the interior wall finish is defined as a 2-cm-thick plaster layer. The thickness of all internal insulations is uniform and equal to 1 cm. A Bituminous waterproofing insulation layer with a thickness of 3 mm is considered. The cement shell has a thickness of 2 cm, the brick shell is 25 mm thick, and all stone shells have a thickness of 2 cm. The construction materials used for external walls have a thickness of 15 cm. For the execution of the brick shell and all stone shells, a 2-cm-thick mortar of cement and sand is applied. Before installing the Bituminous waterproofing insulation, a 2-cm-thick cement and sand mortar layer is also applied. Two examples of external wall layering are shown in Fig. 14A,B. By combining the specified materials and insulations in Table 1, we arrive at 715 different scenarios for constructing the external building envelope.
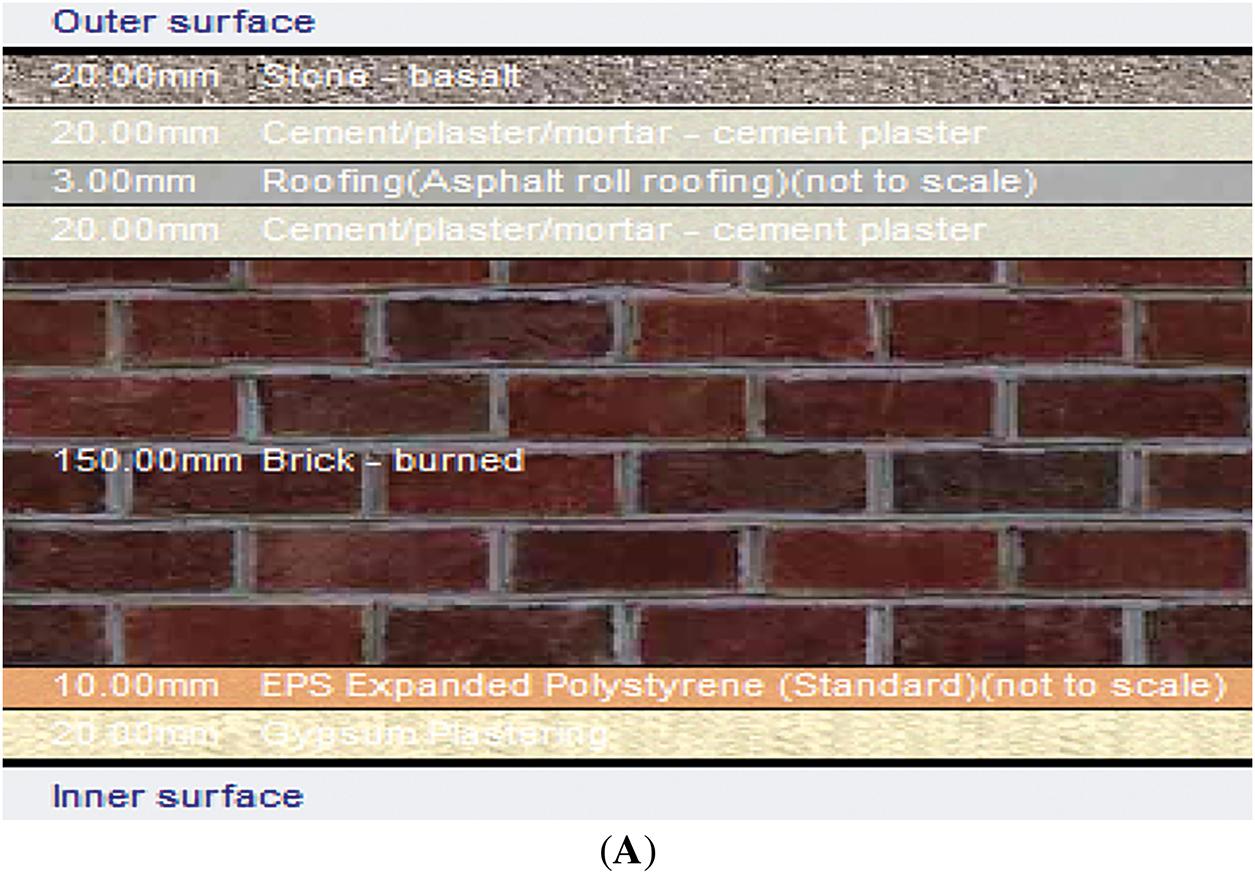
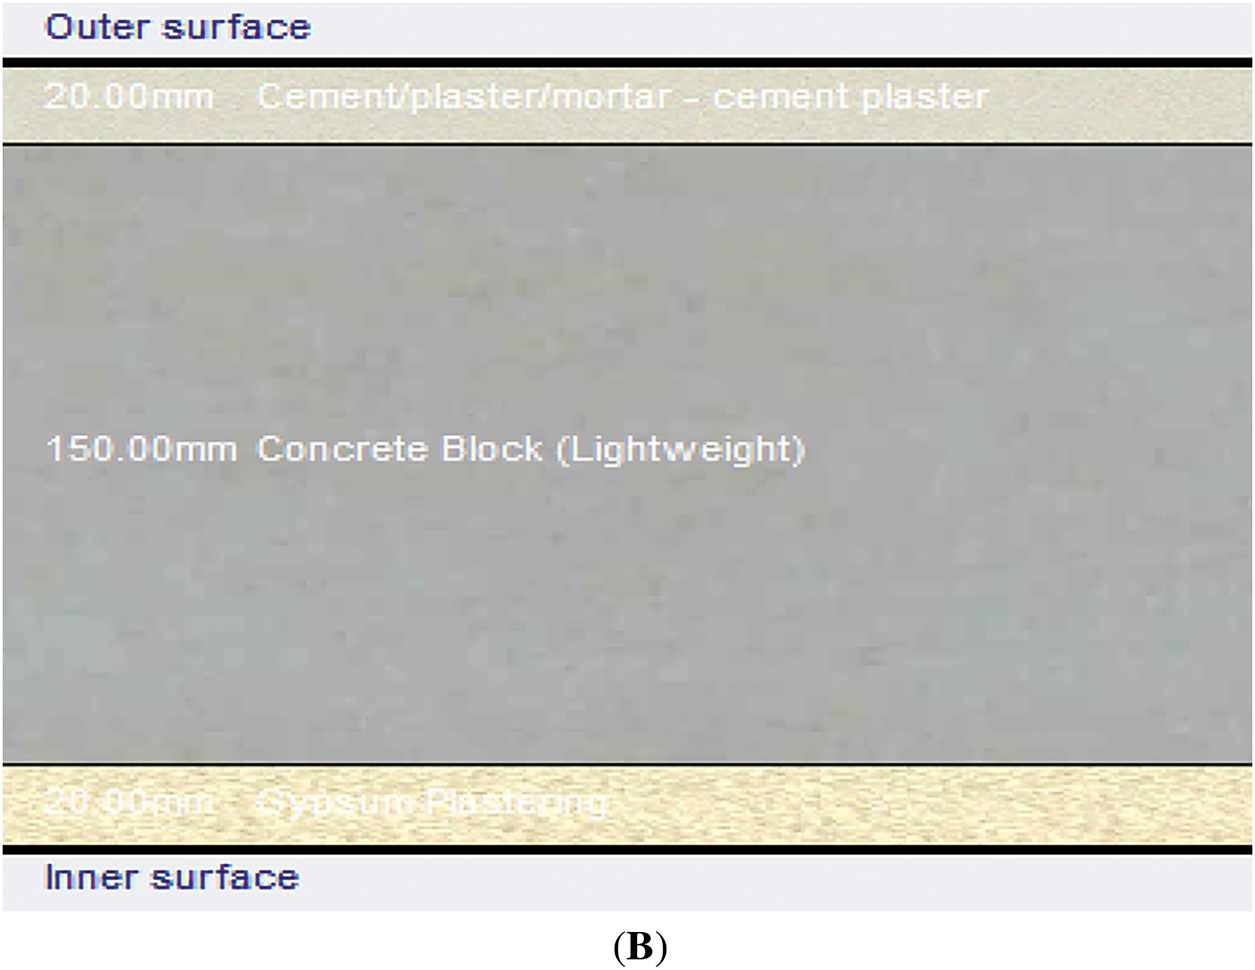
Figure 14: (A) G-PS-B-I-BS scenario;(B) Scenario G-0-CB-0-C
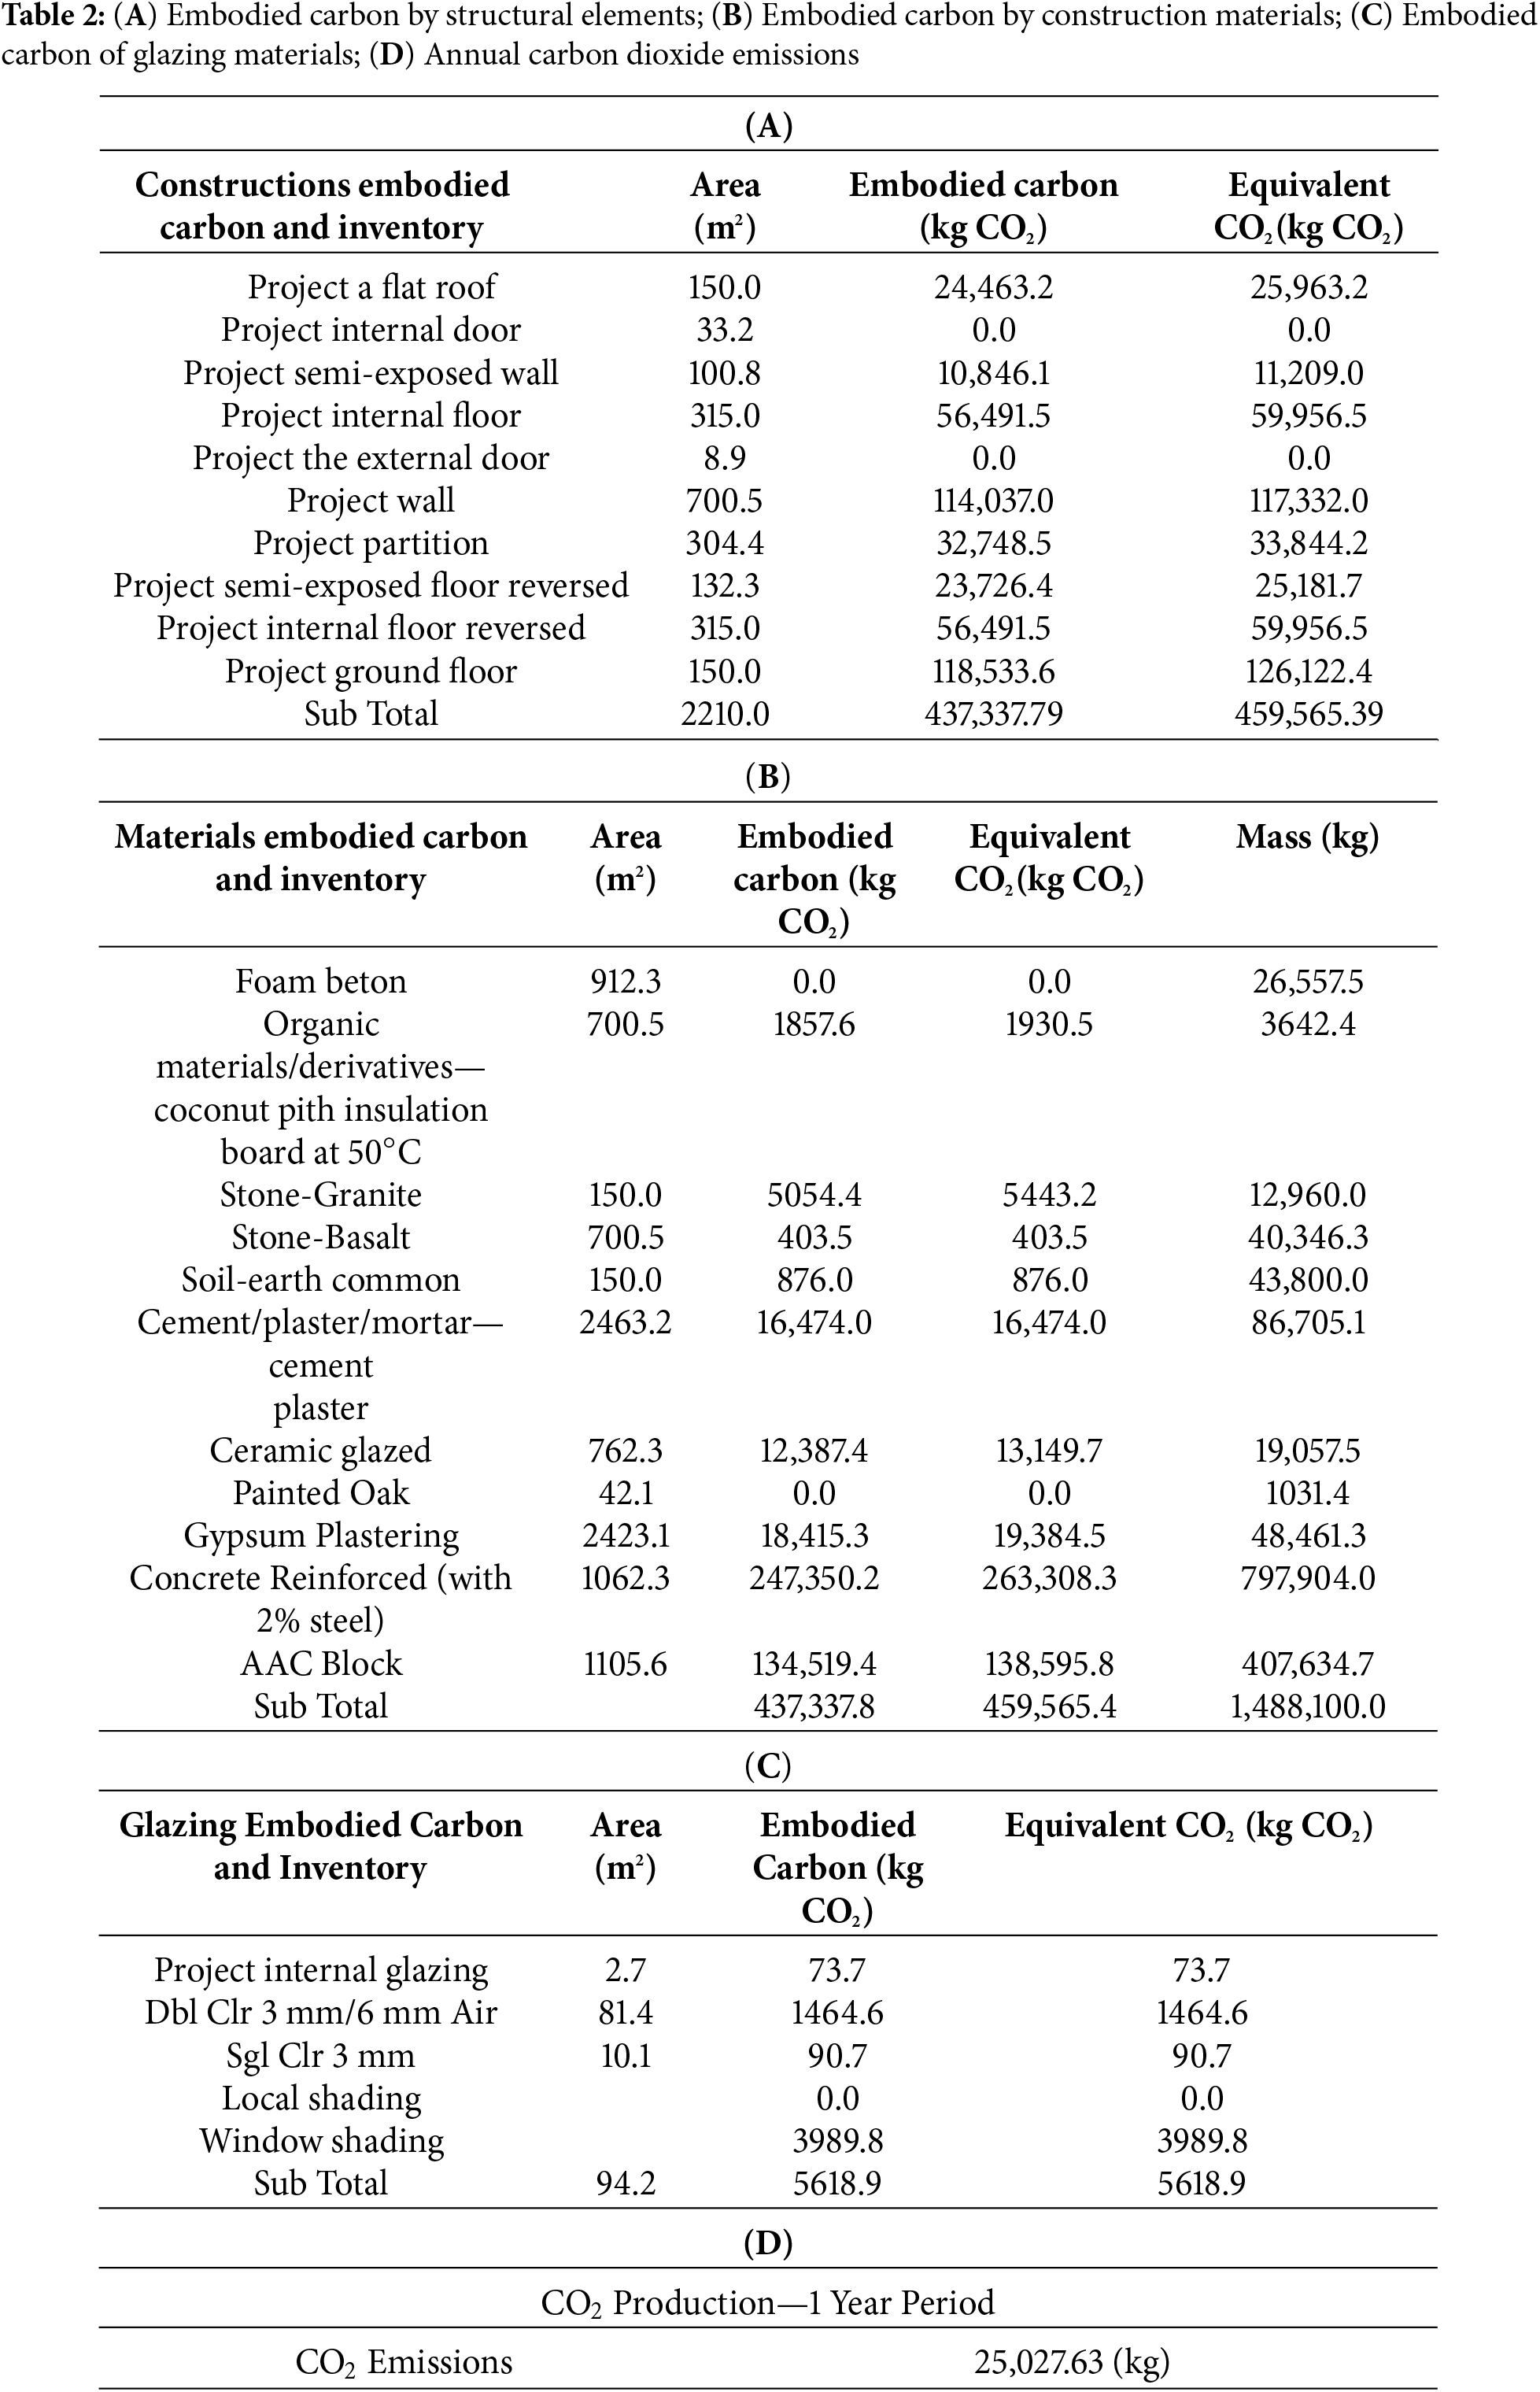
The outputs of the software used in this research are as follows:
Embodied carbon is due to external walls per kilogram of carbon dioxide.
The equivalent embodied carbon is caused by external walls per kilogram of carbon dioxide in kilograms.
Carbon emitted in kilograms for one year.
You mentioned that examples of these software outputs are shown in Table 2.
After receiving the software outputs, we collect the necessary data in a table. With this table, the data can be sorted according to any desired parameters. Due to the large volume of information, only the first 15 scenarios and the last 15 scenarios are displayed.
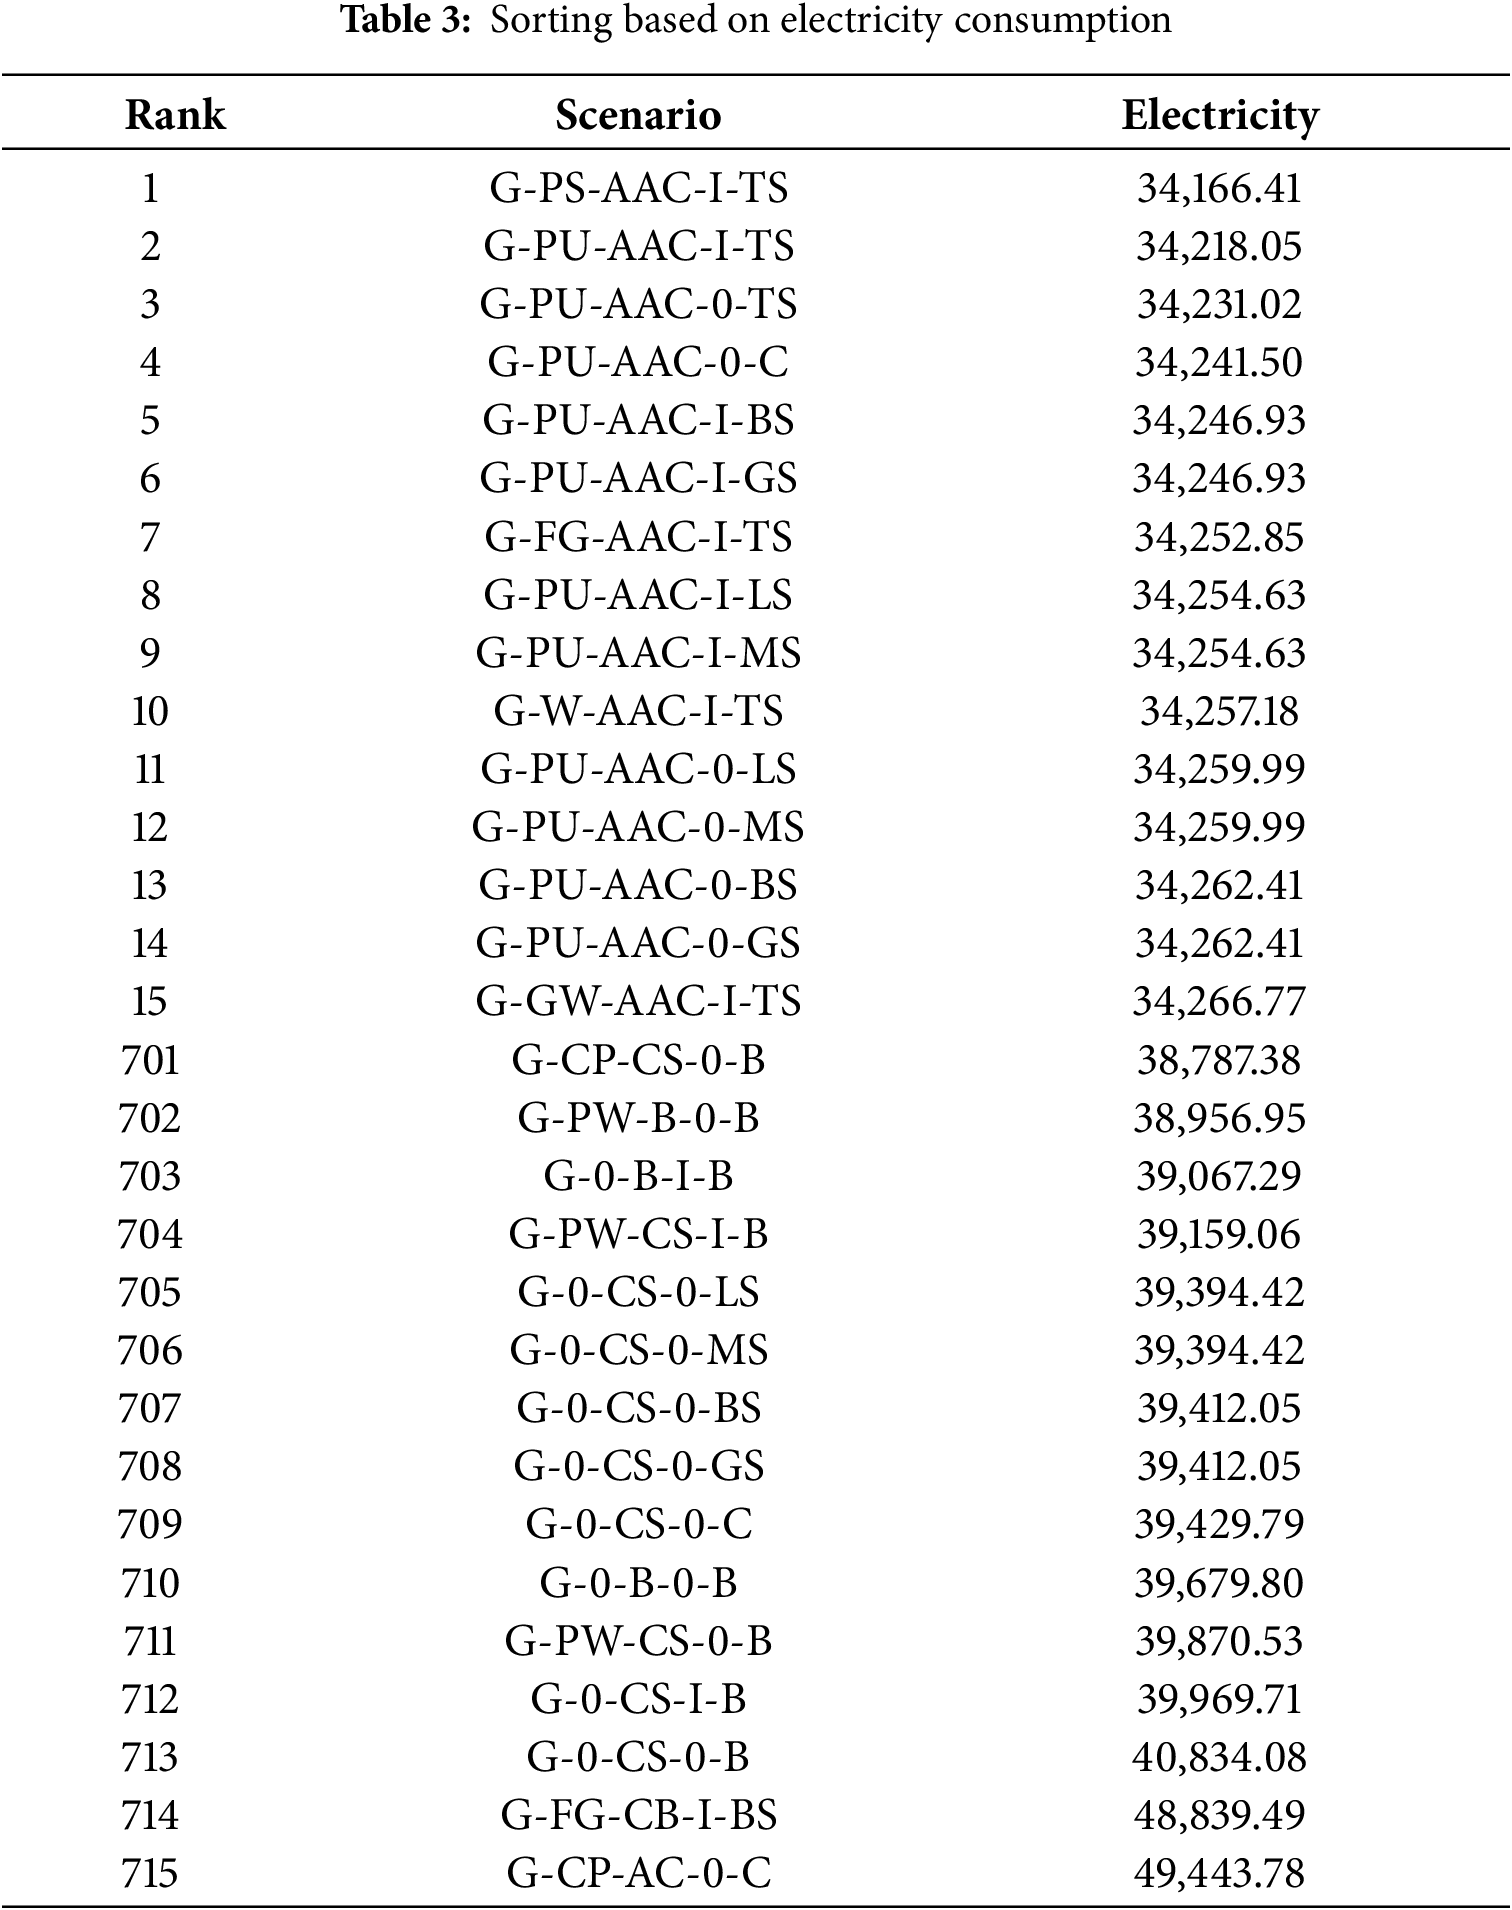
• Sorting by electricity consumption:
Scenarios with the lowest and highest electricity consumption over a one-year period for building operations are identified. Due to the large volume of information, only the first 15 scenarios and the last 15 scenarios are displayed in Table 3.
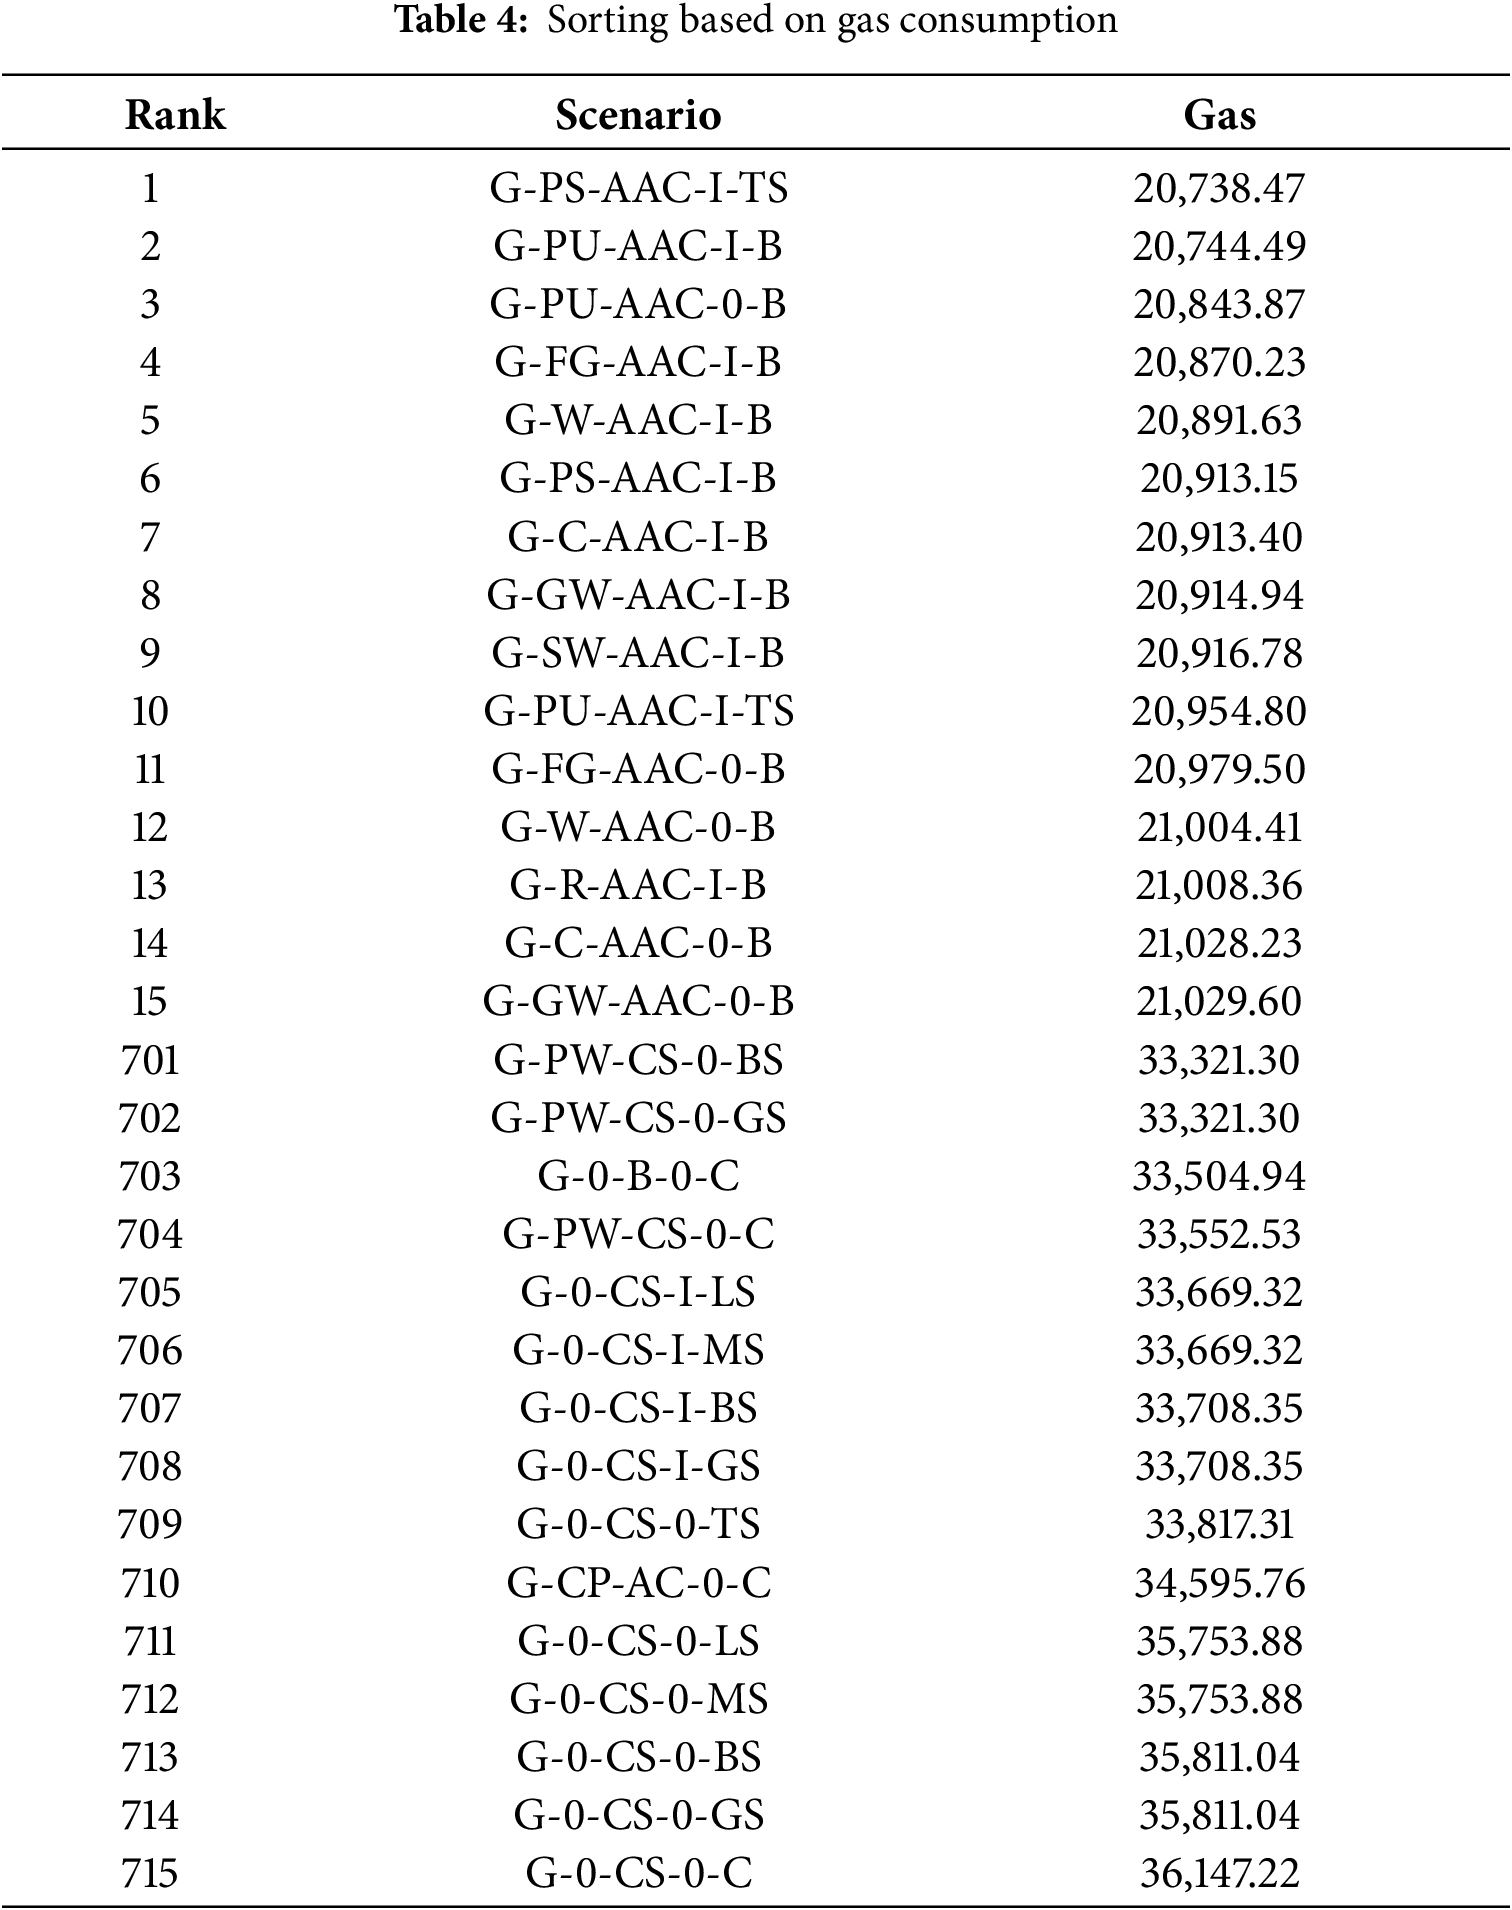
• Sorting by gas consumption:
Scenarios with the lowest and highest gas consumption over a one-year period for building operations are determined. The first 15 scenarios and the last 15 scenarios are shown in Table 4.
• Sorting by total energy consumption:
Scenarios with the lowest and highest total energy consumption over a one-year period for building operations are revealed. Table 5 displays the first 15 scenarios and the last 15 scenarios.
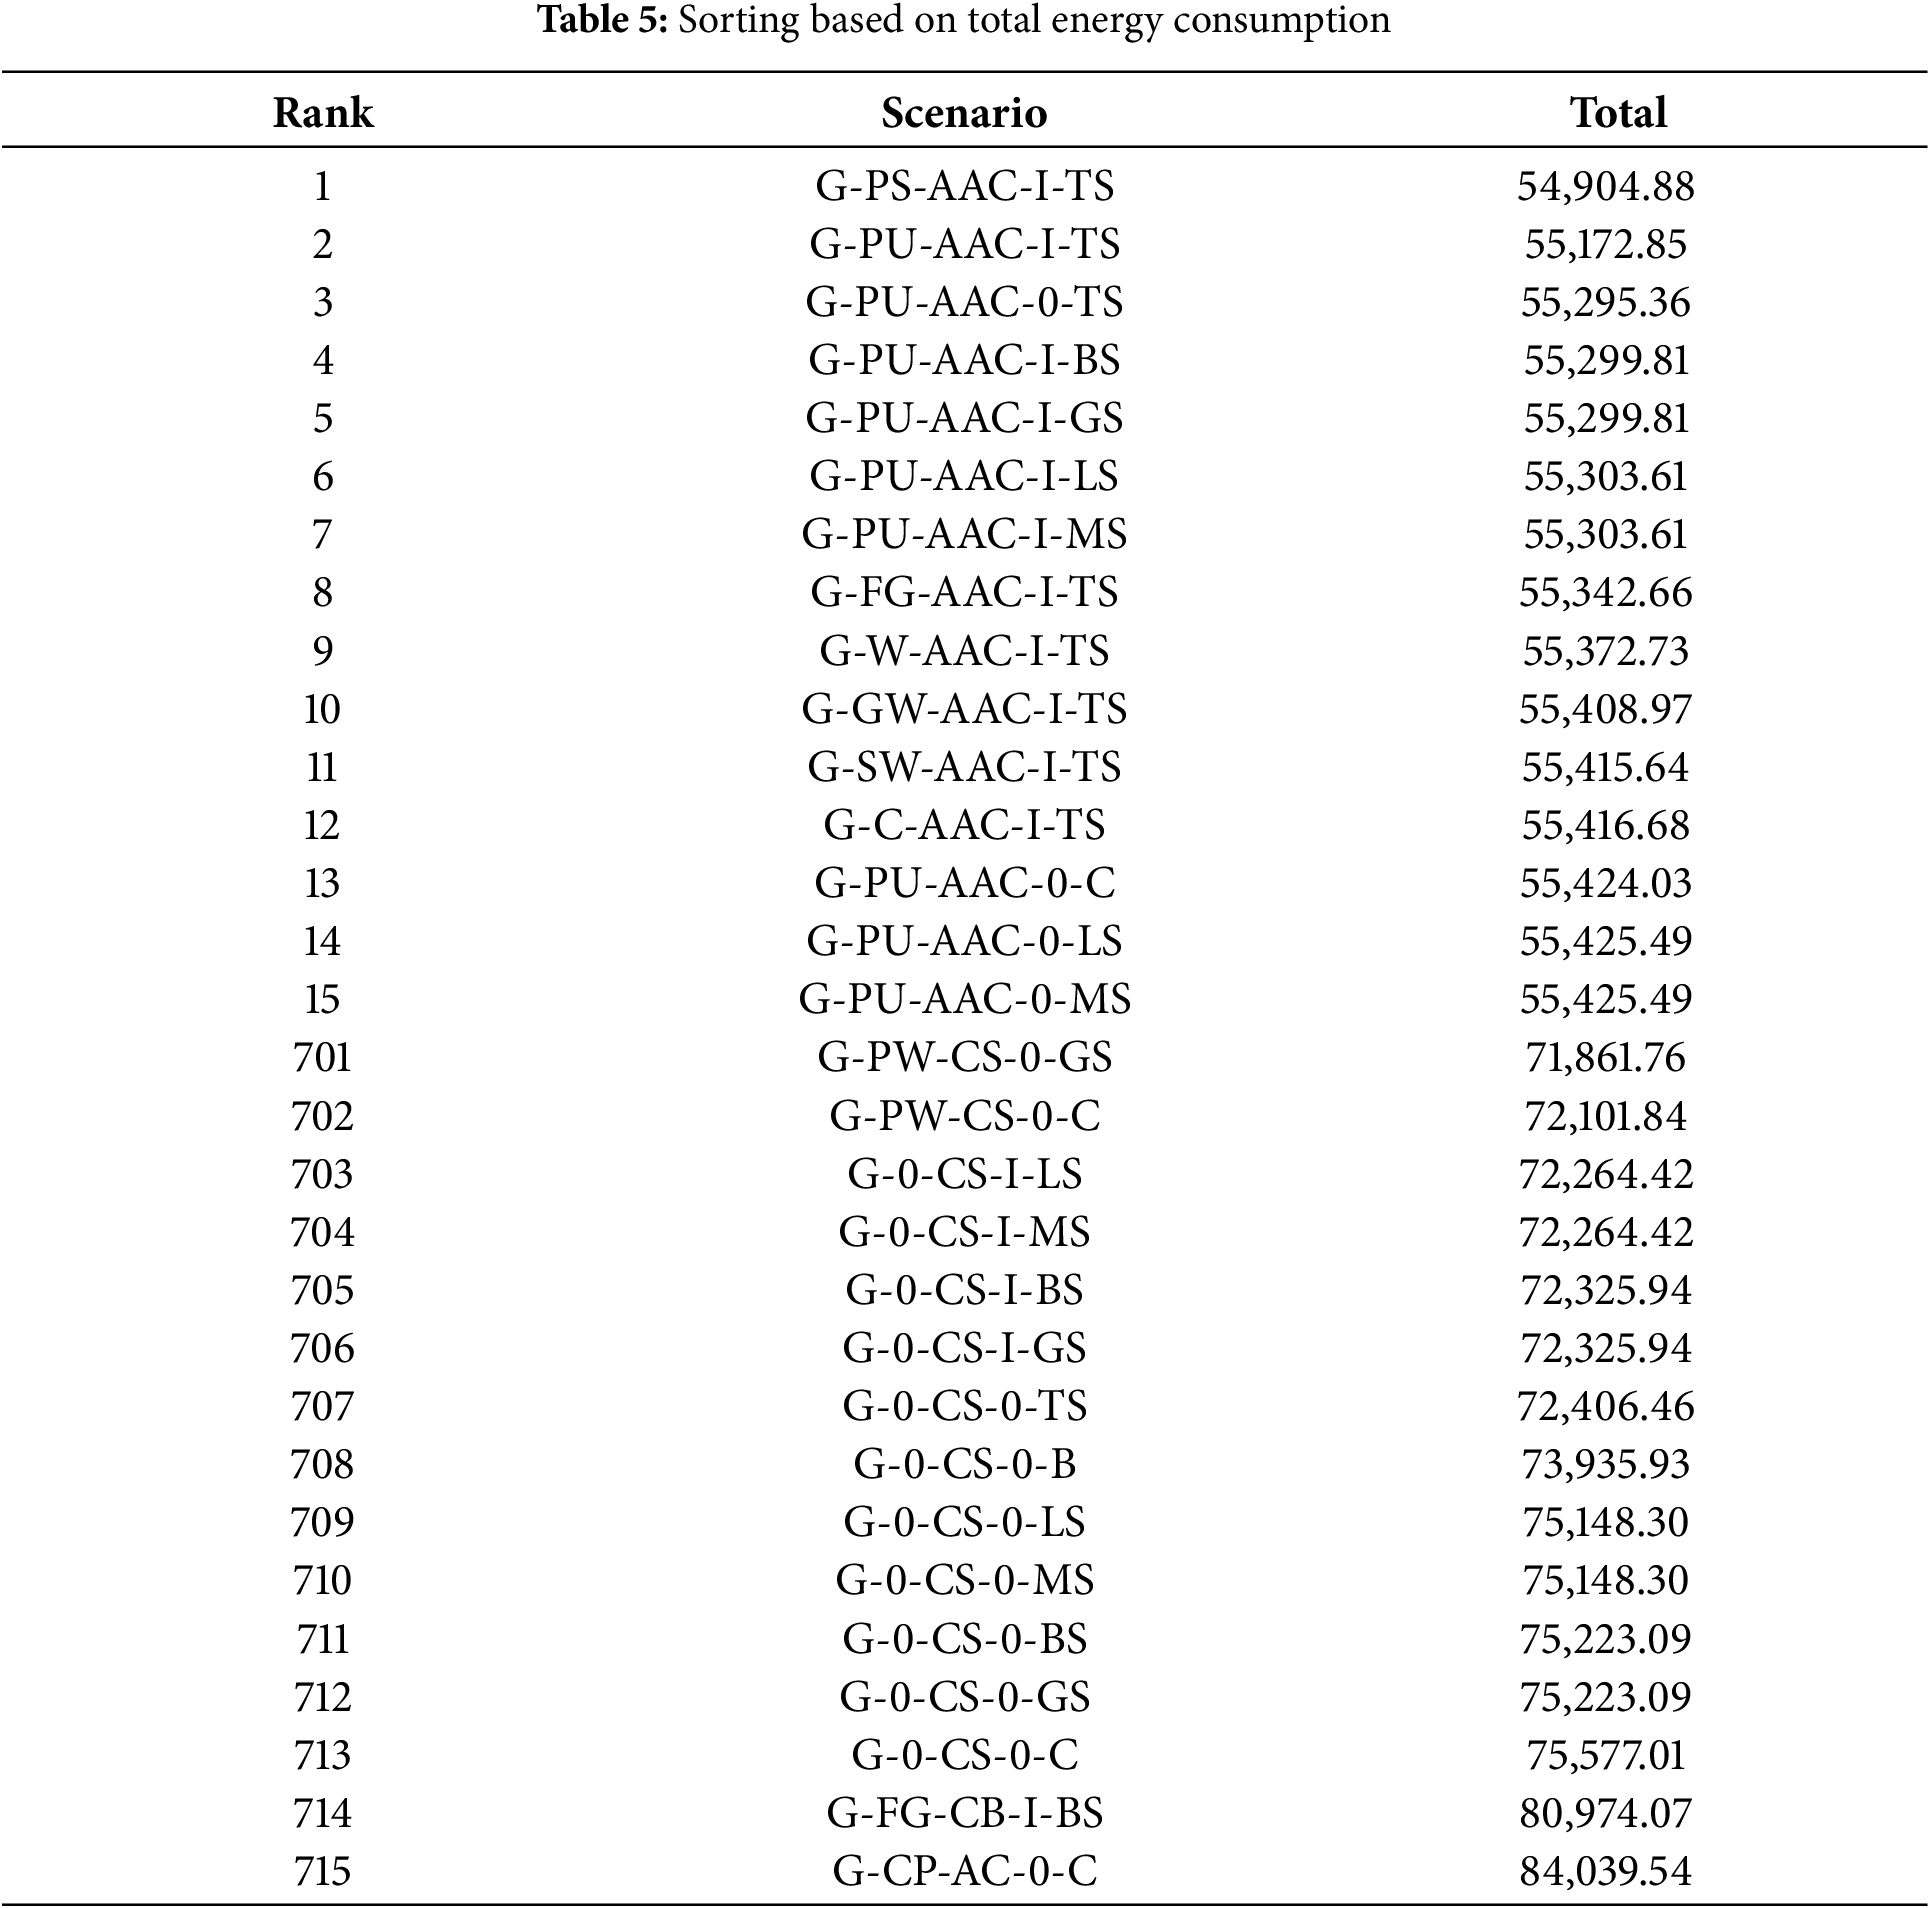
To facilitate viewing and comparison, the data from Tables 3–5 are presented in Figs. 15–17, respectively.
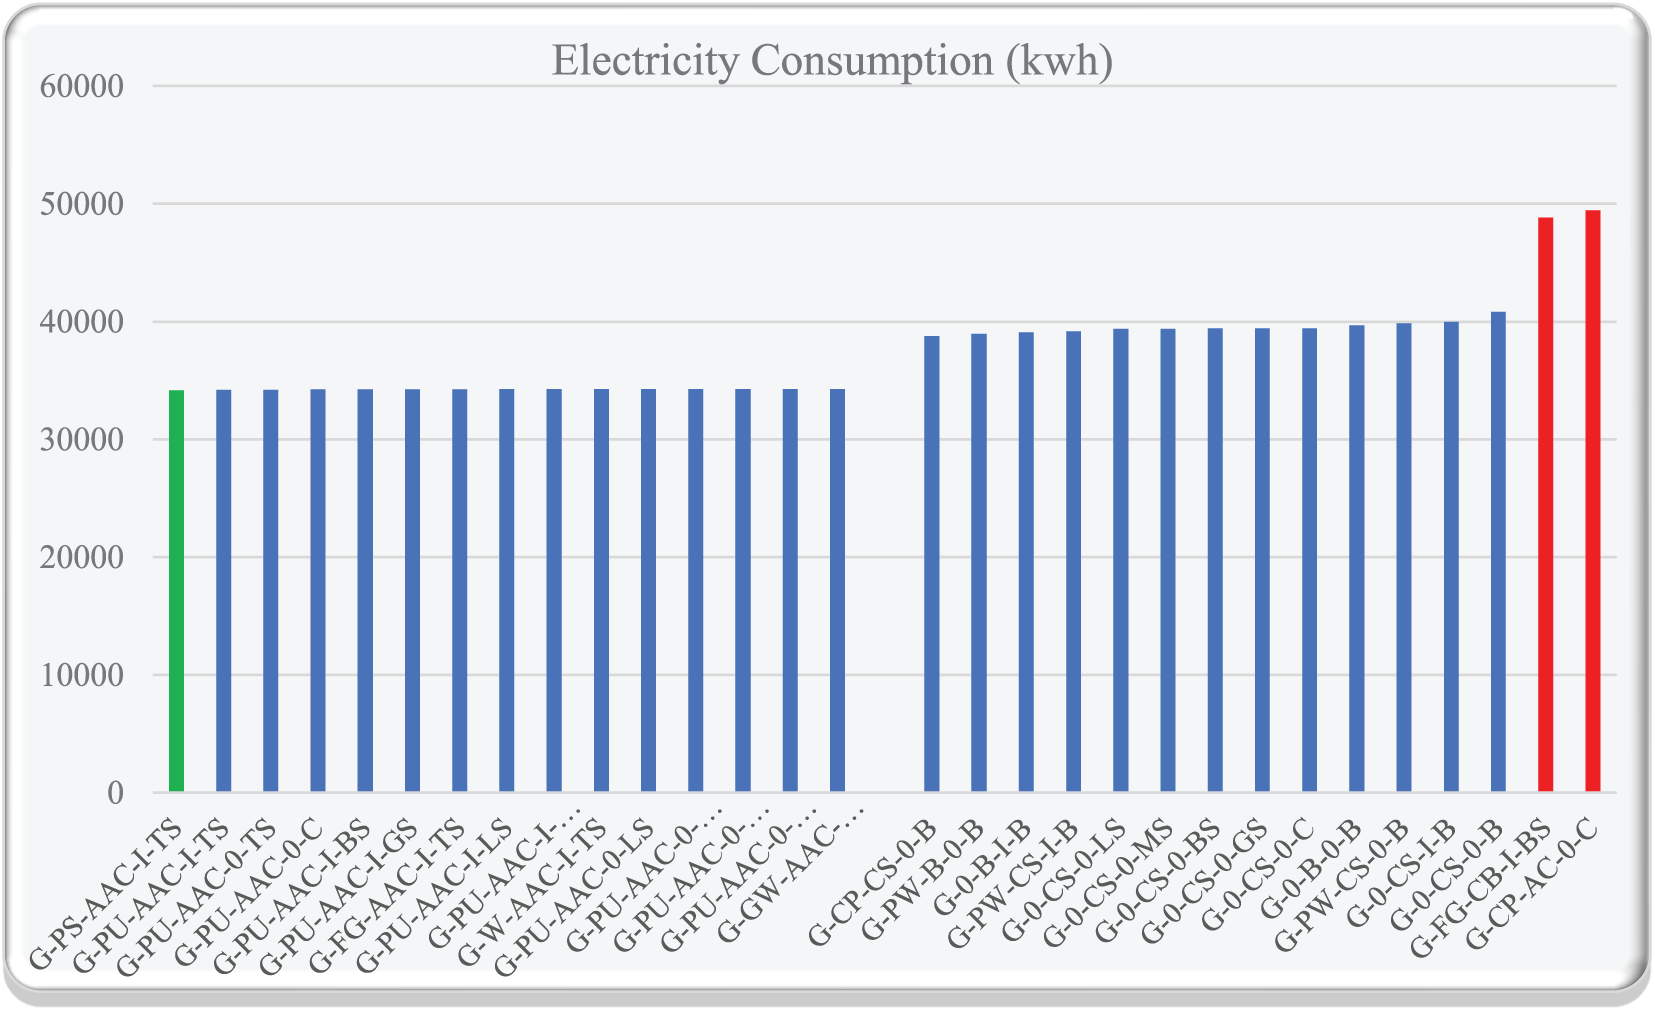
Figure 15: Electricity energy consumption of different scenarios
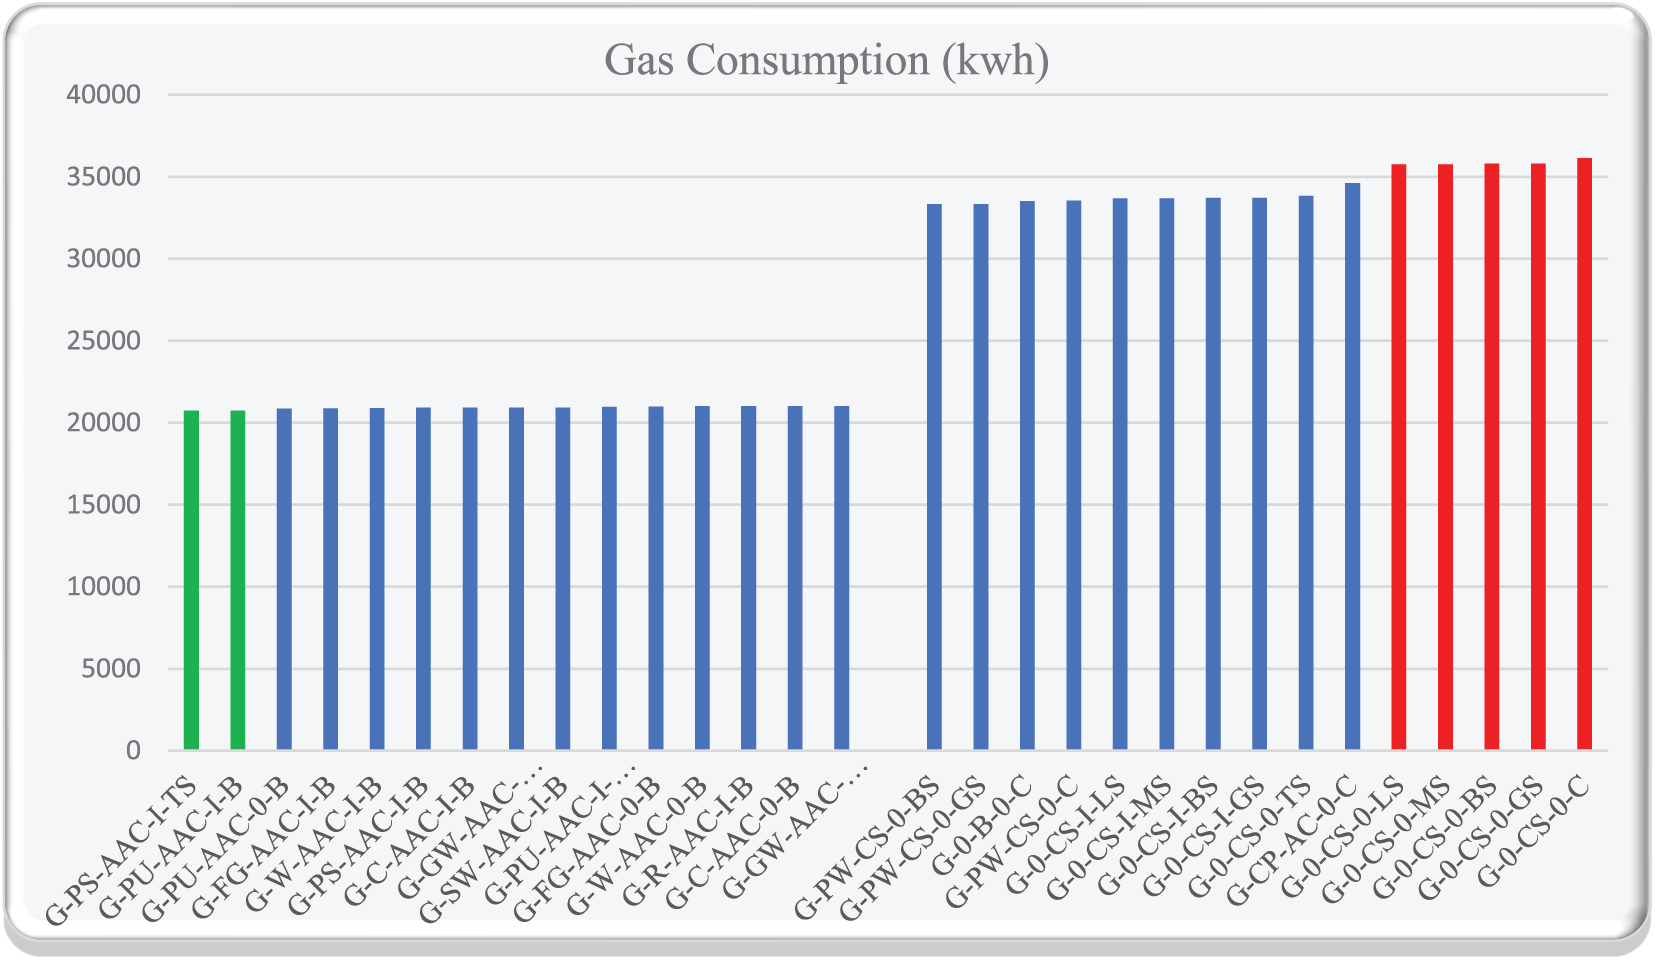
Figure 16: Gas energy consumption of different scenarios
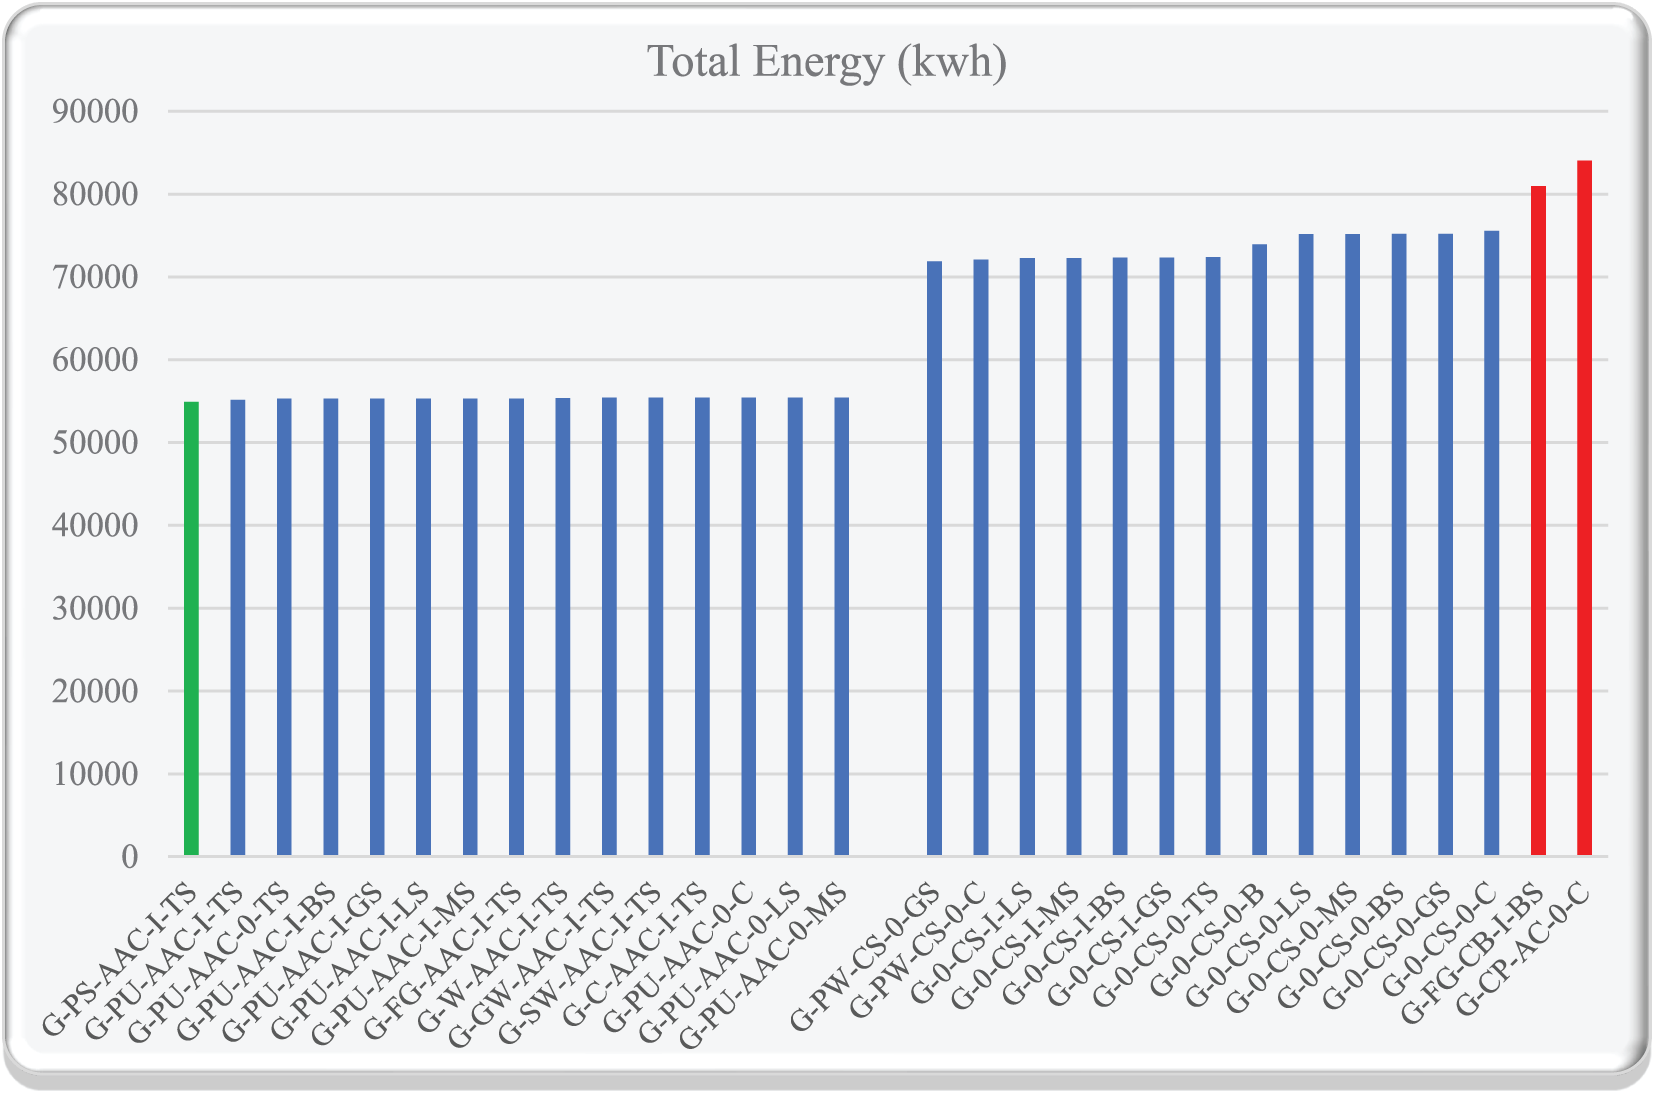
Figure 17: Total energy consumption of different scenarios
Depending on the project context and requirements:
If electricity consumption is the focus, refer to Table 3. If gas consumption is of interest, consult Table 4. For total energy consumption, Table 5 provides relevant data.
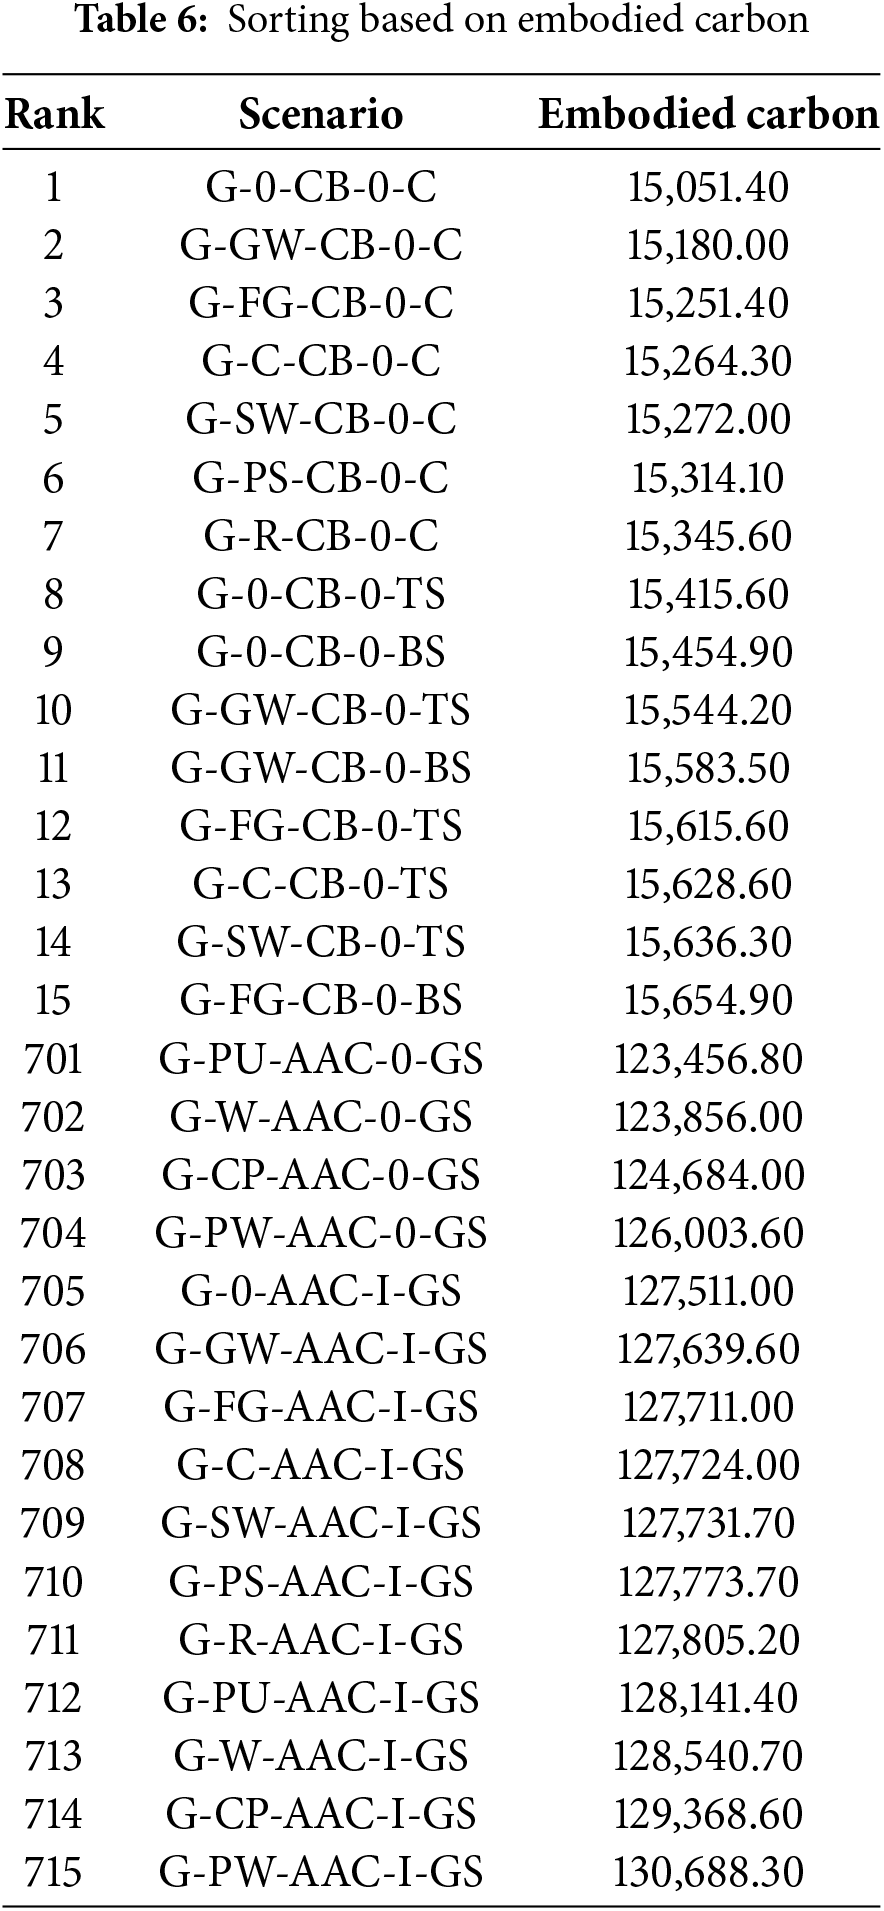
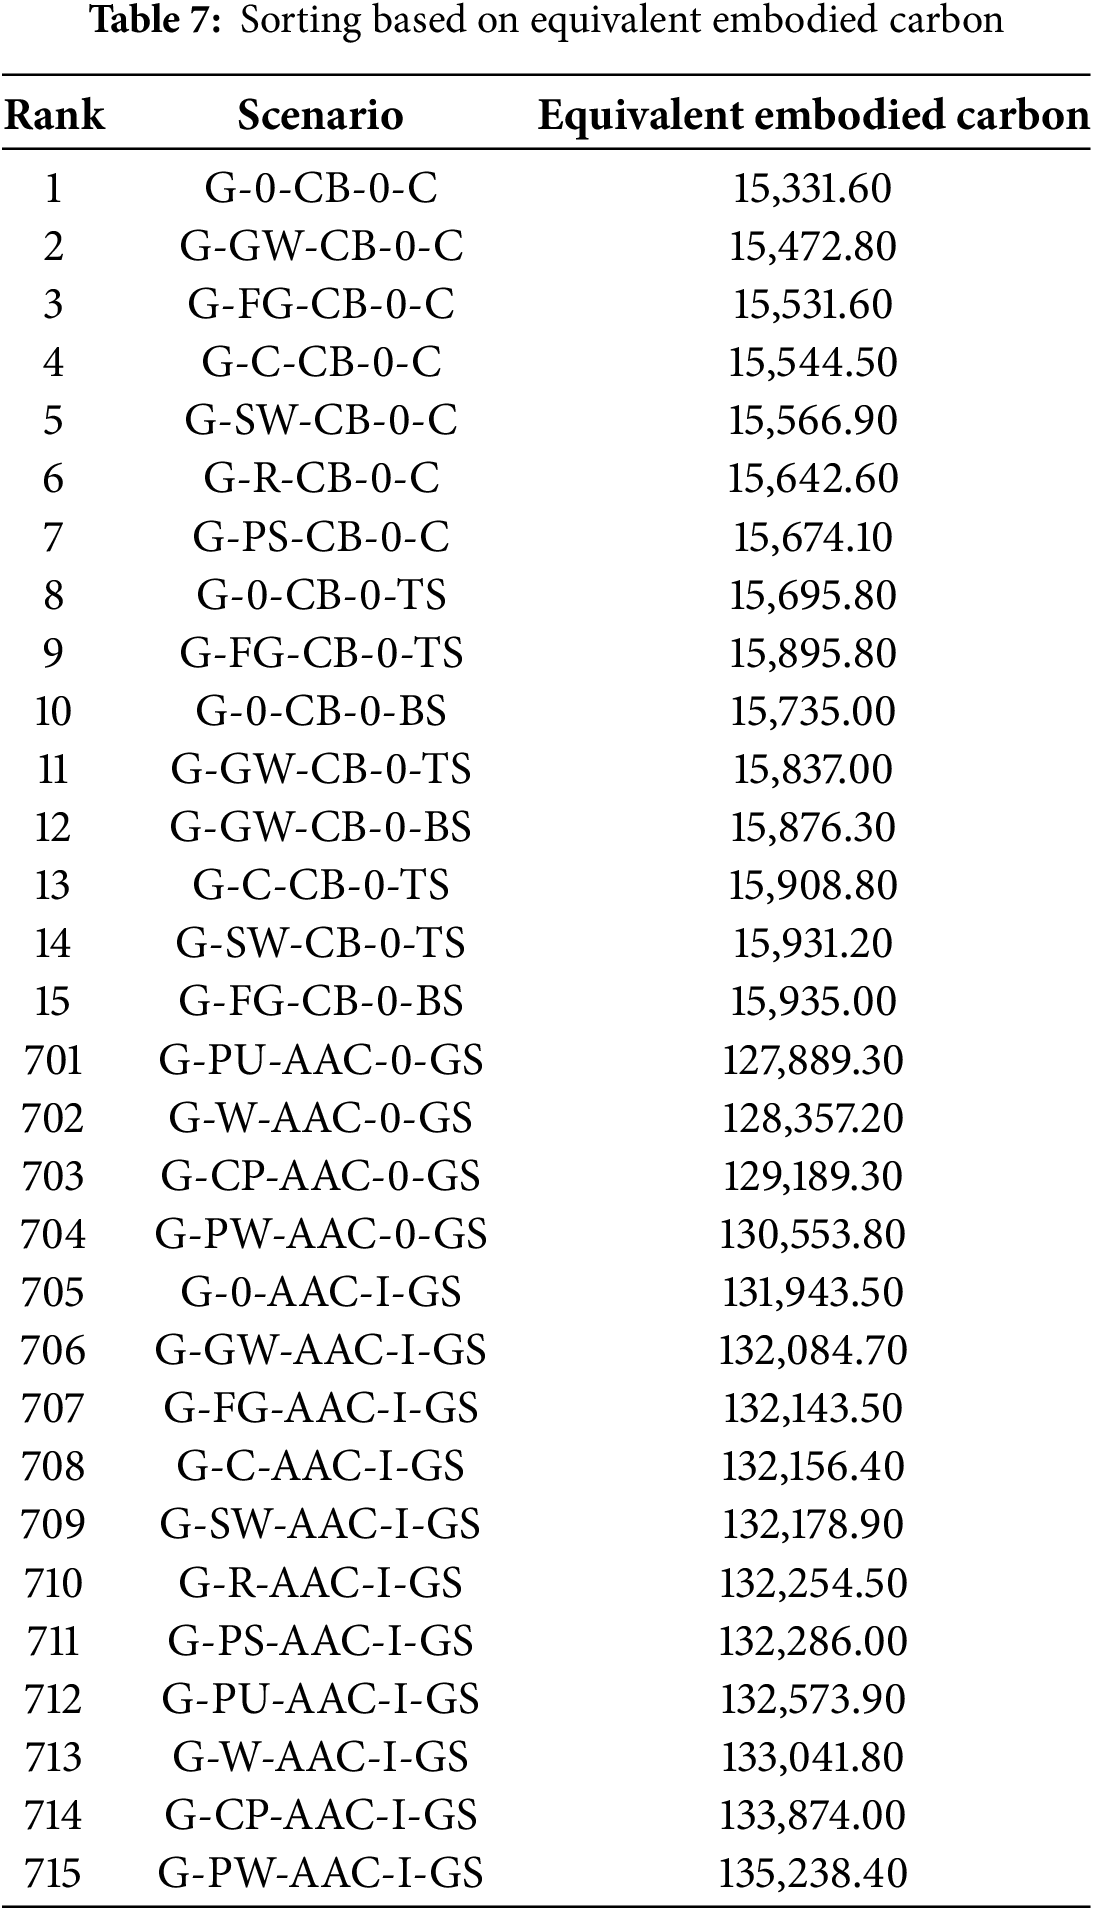
By sorting based on the amount of embedded carbon (measured in terms of carbon dioxide), scenarios for all exterior walls are determined. The 15 scenarios with the lowest and highest embedded carbon are shown in Table 6. Similarly, by sorting based on equivalent embedded carbon for all exterior walls, the 15 scenarios with the lowest and highest equivalent embedded carbon are displayed in Table 7.
To facilitate viewing and comparison, the data from Tables 5 and 6 are presented in Figs. 18 and 19, respectively.
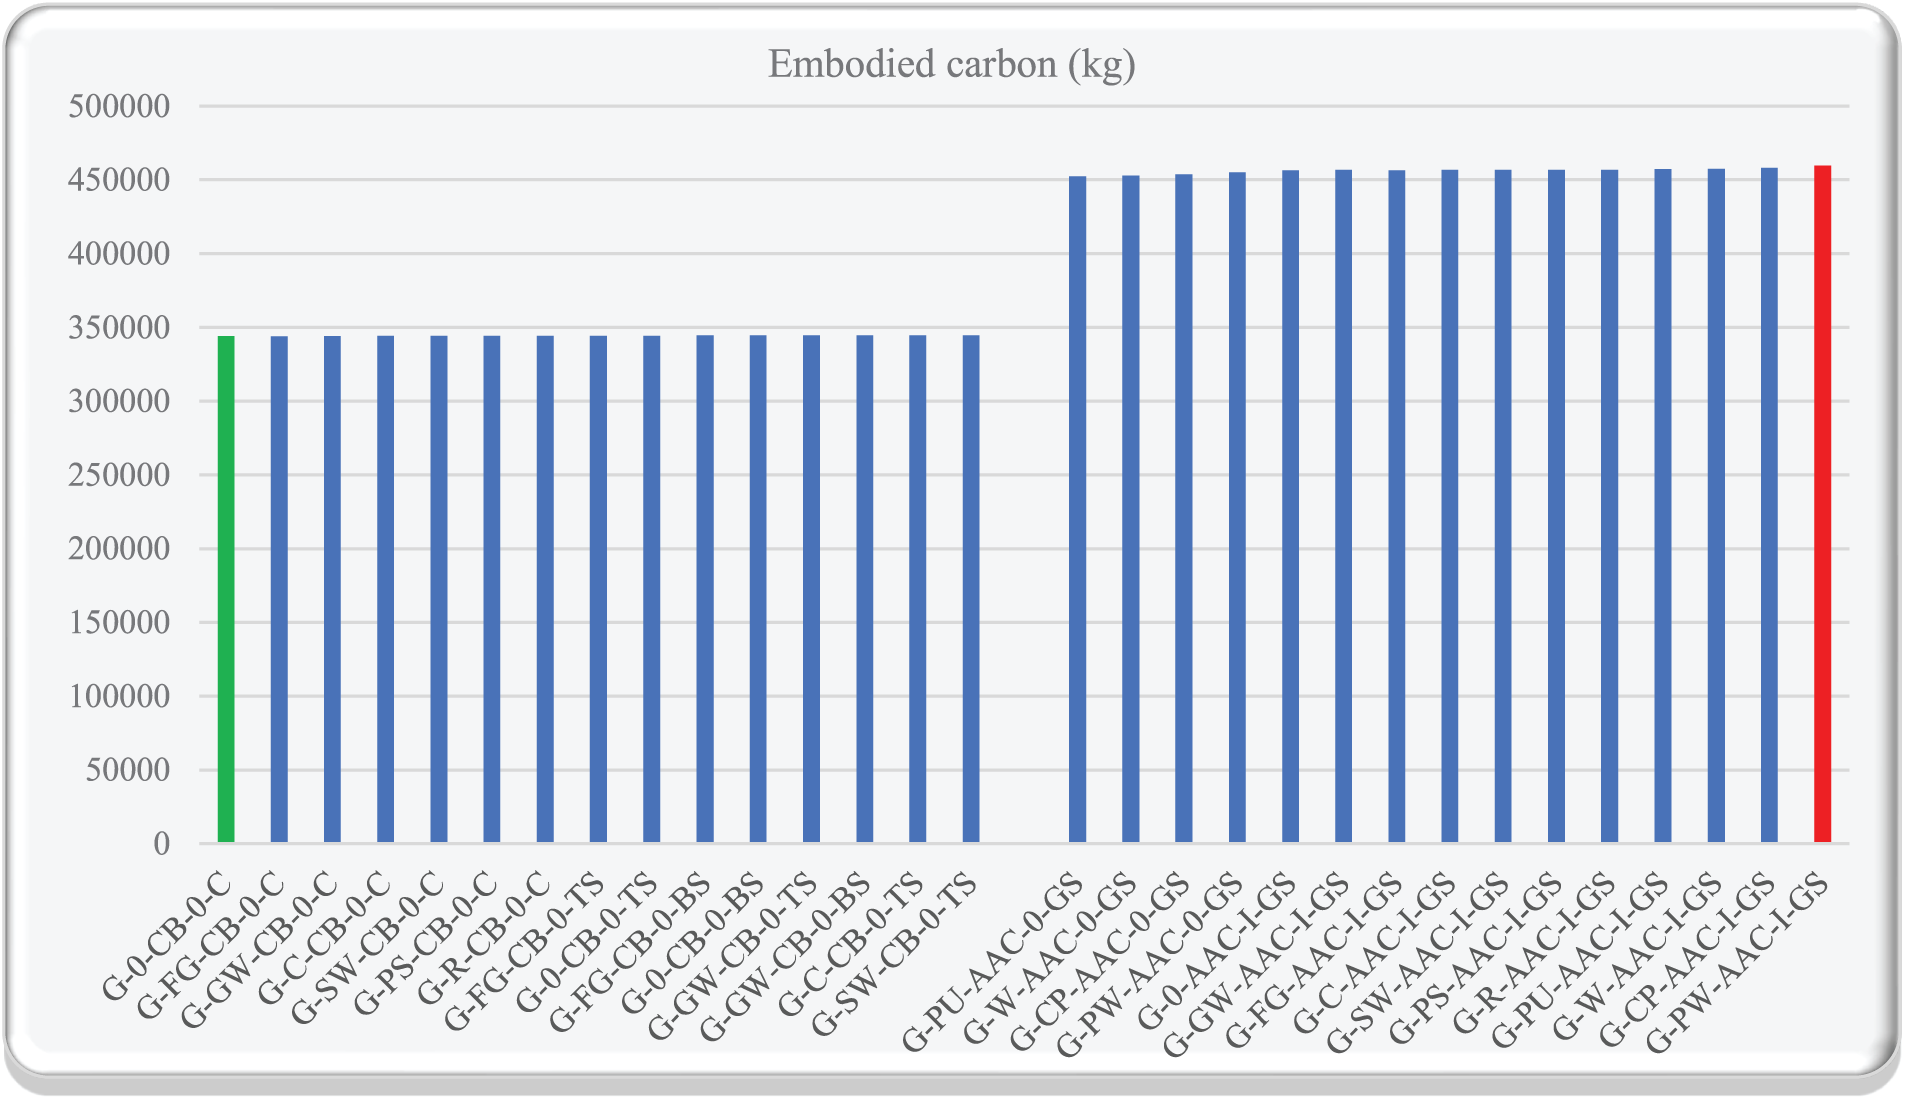
Figure 18: Embodied carbon levels in different scenarios
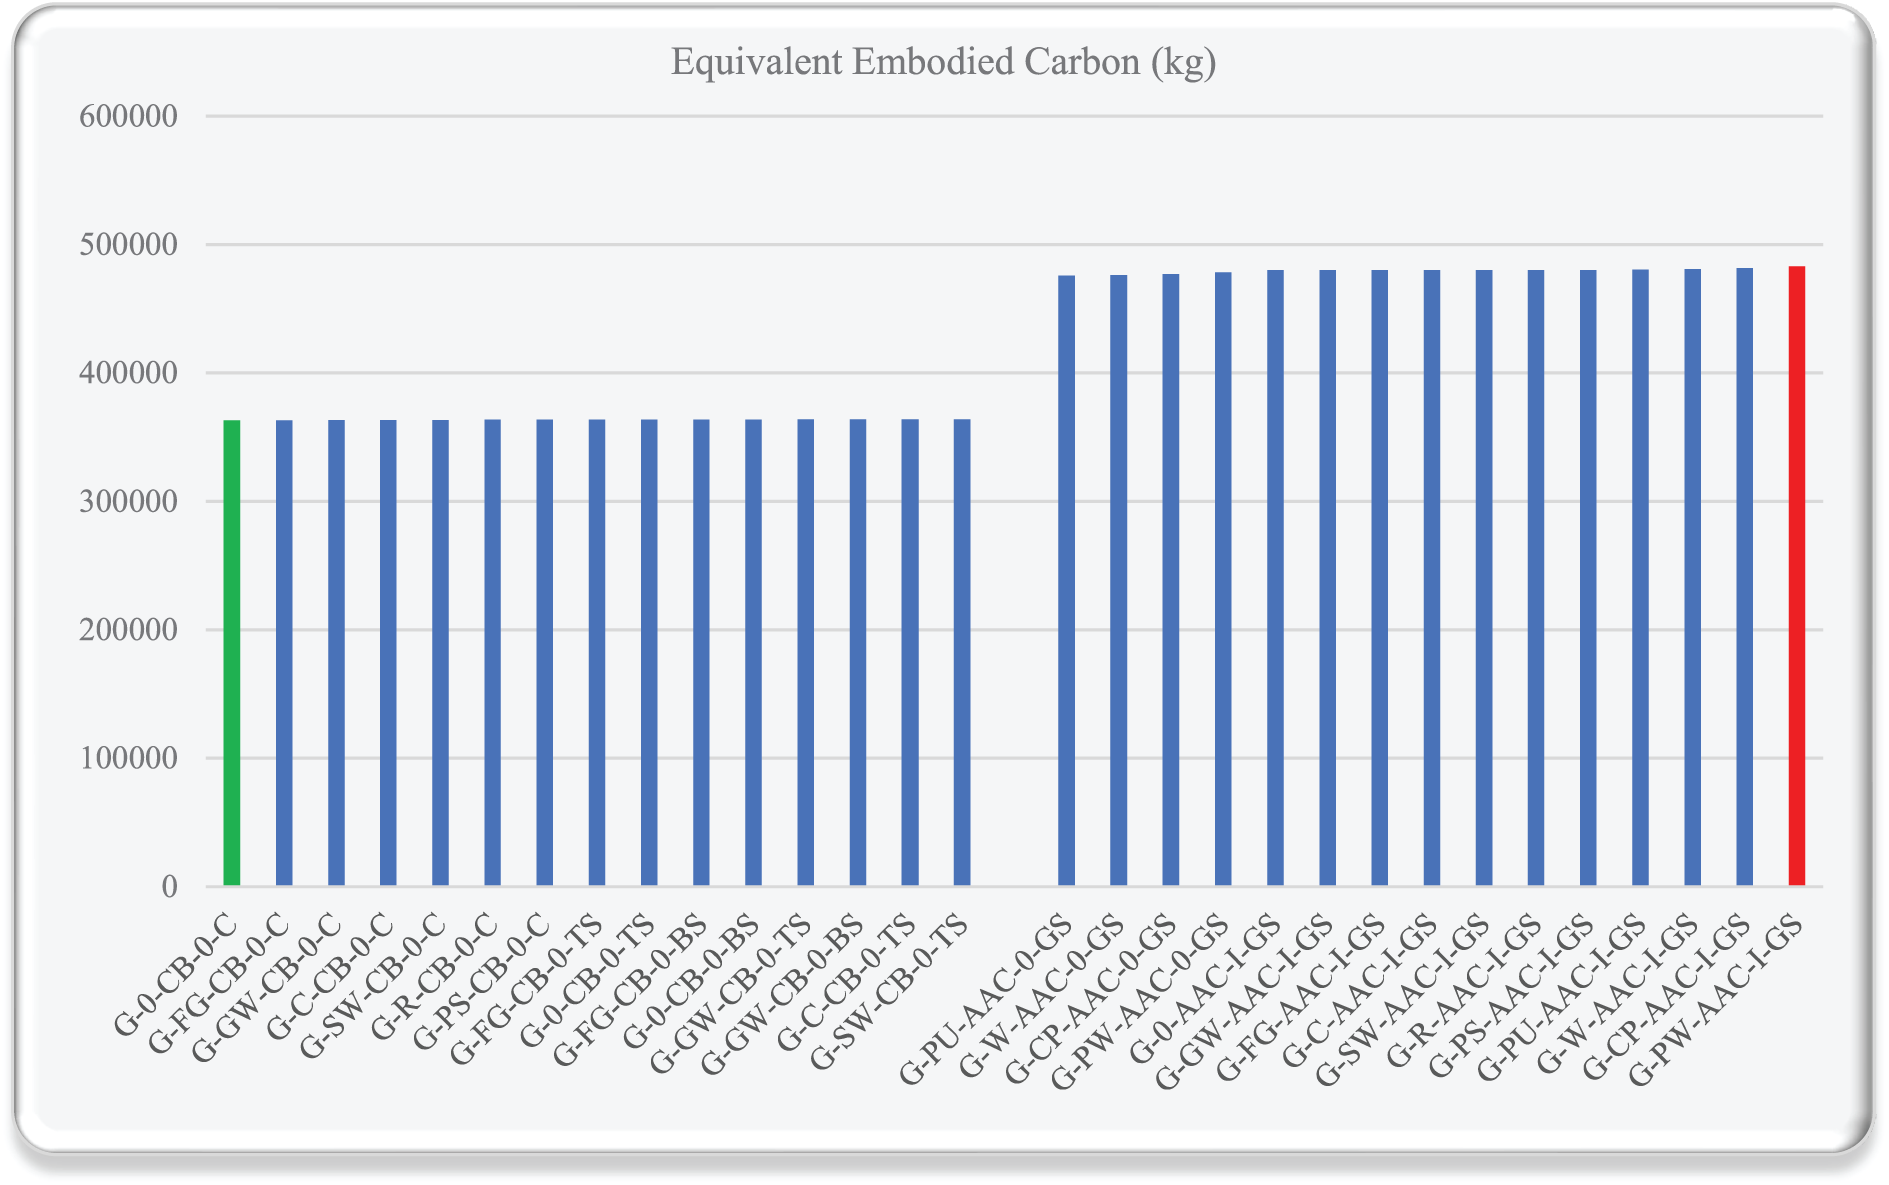
Figure 19: Equivalent embodied carbon levels in different scenarios
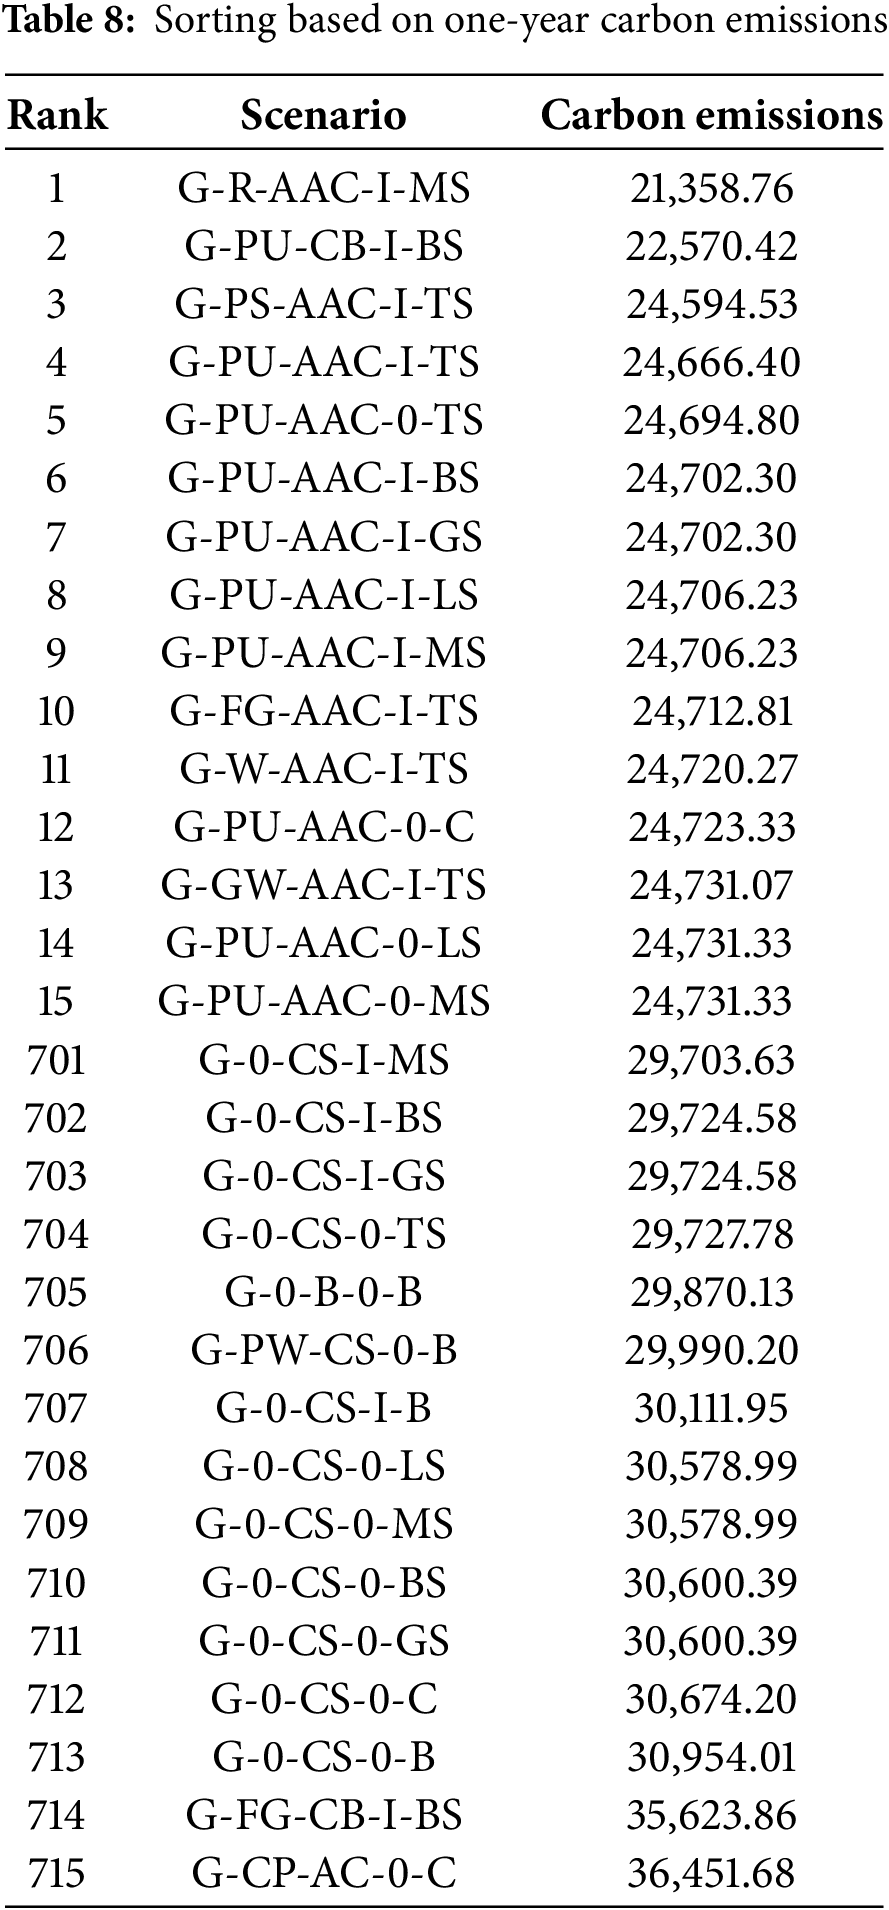
By sorting based on carbon emissions during the operational phase, scenarios with the least and greatest carbon emissions are identified. The 15 scenarios with the lowest and the 15 scenarios with the highest carbon emissions are shown in Table 8.
To facilitate viewing and comparison, the data from Table 8 is presented in Fig. 20, respectively.
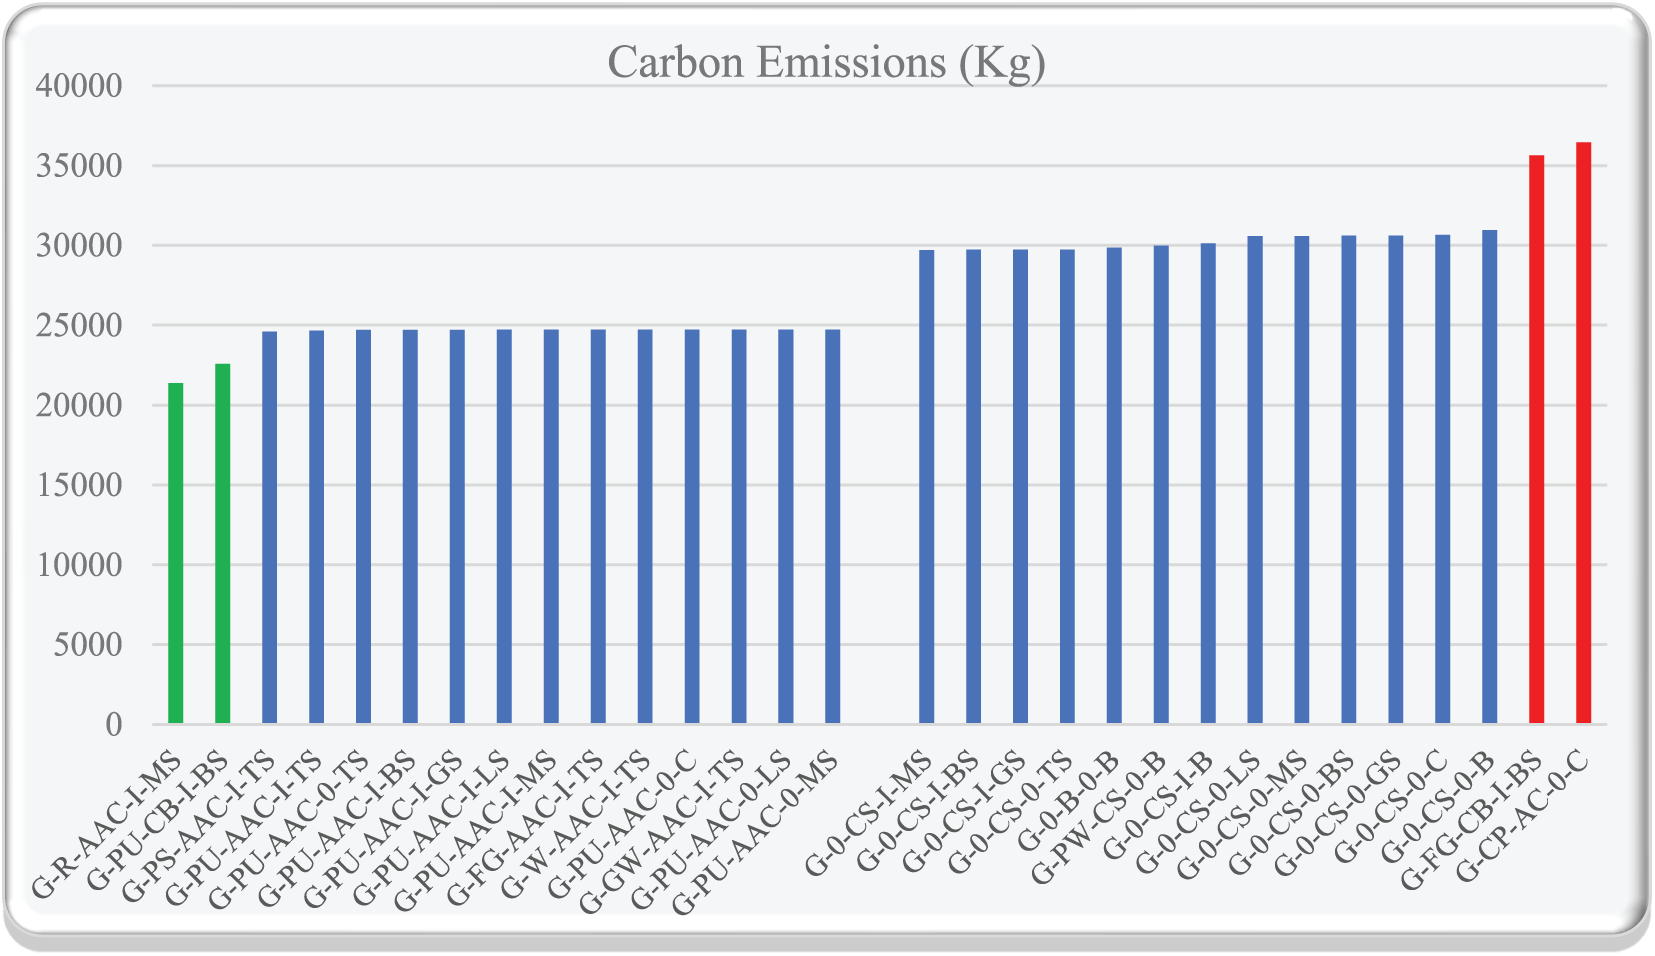
Figure 20: Carbon emission levels in different scenarios
To obtain the optimal scenario, we first need to calculate the payback period for each scenario. The payback period represents the time each scenario requires to offset the additional embodied carbon compared to the scenario with the least embodied carbon.
To calculate the payback period, follow these steps:
1. Determine the increase in embodied carbon for each scenario relative to the reference scenario (G-0-CB-0-C, as shown in Table 6).
2. Next, identify the reduction in carbon emissions compared to the G-0-CB-0-C scenario.
3. Divide these two values to find the time needed to offset the additional embodied carbon per year for each scenario.
Negative values indicate that the scenario, despite adding embodied carbon, still has lower operational carbon emissions than the reference scenario. Positive values indicate that the scenario has higher operational carbon emissions, even after accounting for the added embodied carbon.
After this analysis, eliminate scenarios with positive payback periods. You’ll be left with 372 scenarios. Given that the average lifespan of buildings in Tehran is 30 years, remove scenarios with payback periods exceeding 30 years. The remaining scenarios are shown in Table 9.
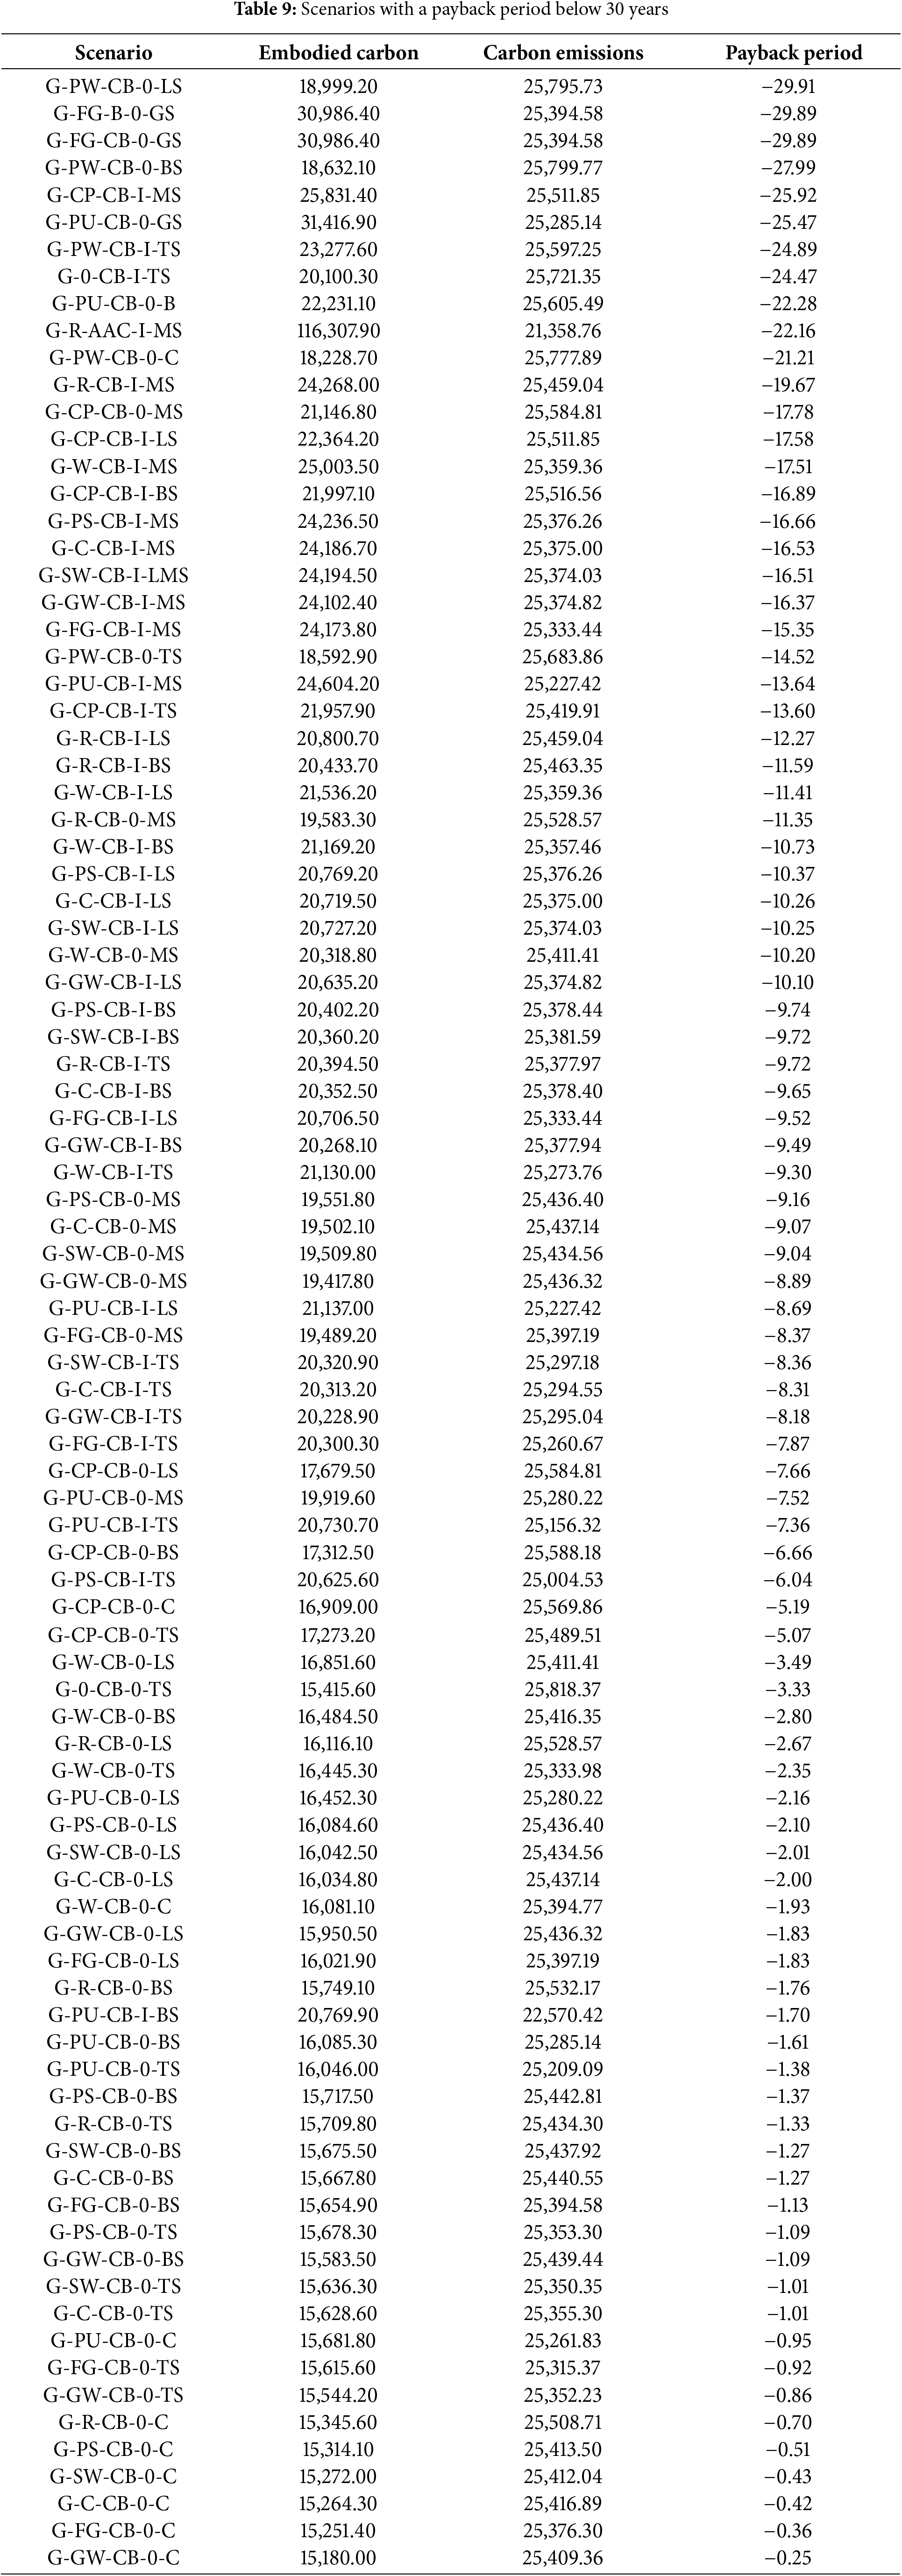
Not necessarily will the scenario with the shortest payback period will be the better scenario. This is because a scenario with a shorter payback period may have a higher carbon emissions rate over a specific period. Therefore, we now sort the remaining scenarios based on their carbon emissions. The scenario with the fewest carbon emissions is the optimal scenario. You can find the top 15 scenarios in Table 10.
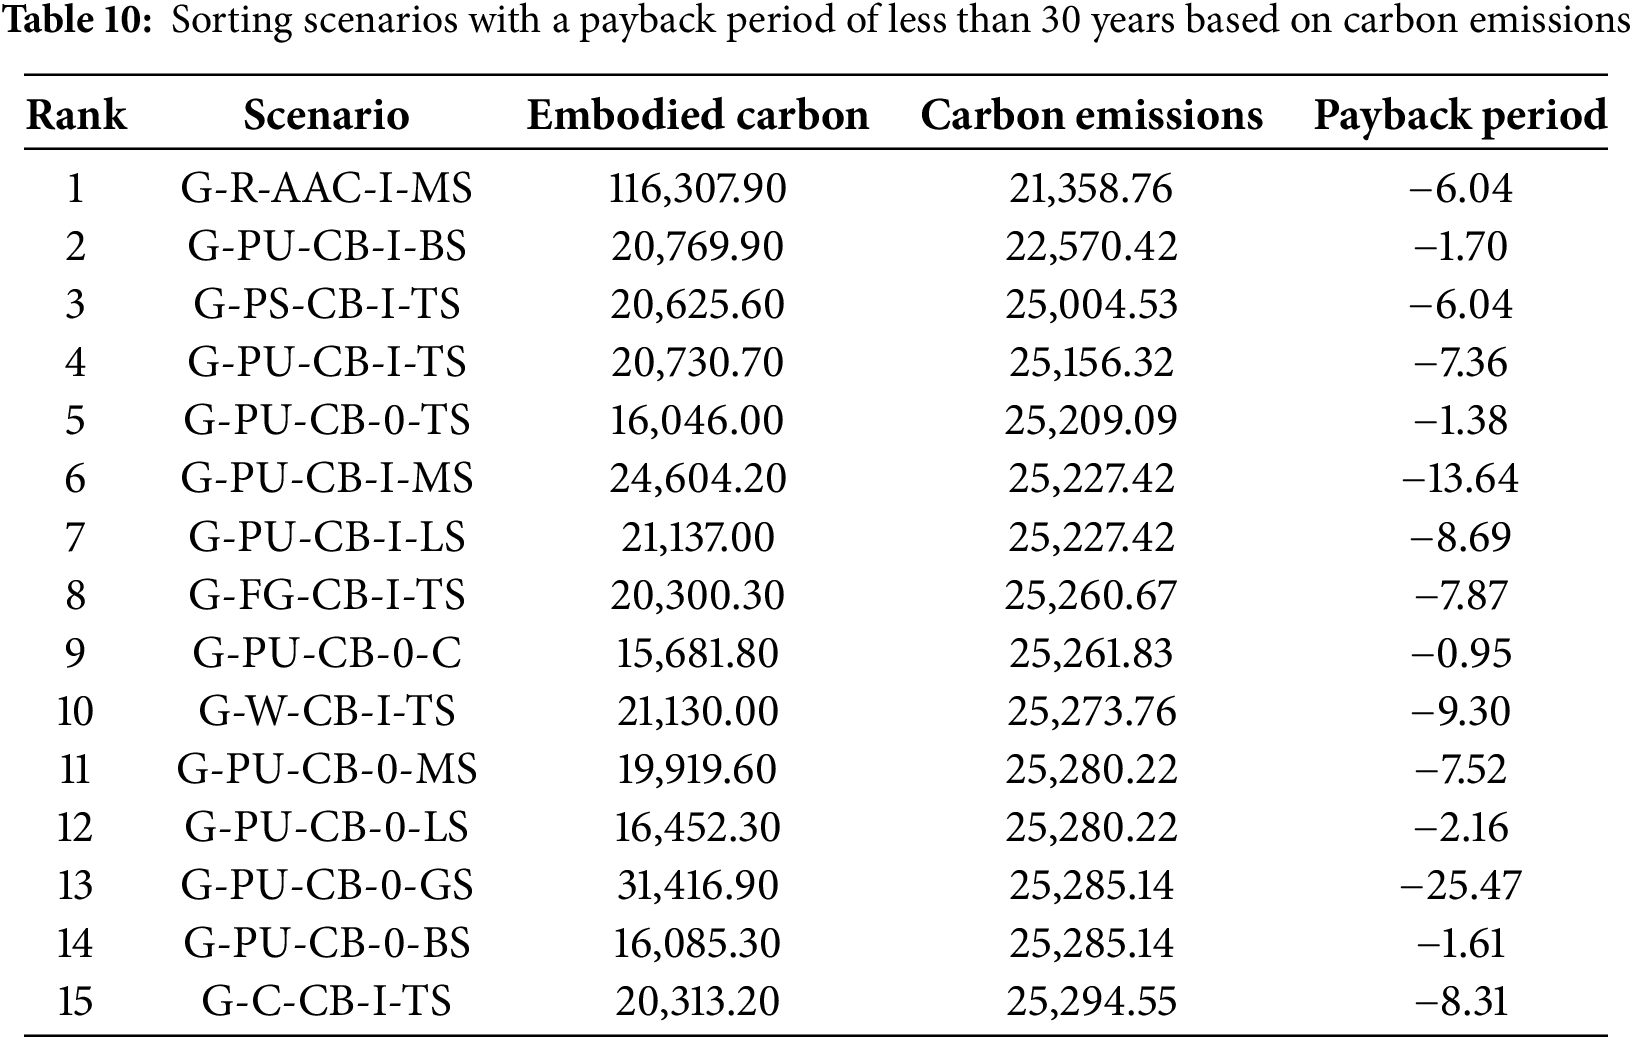
To facilitate viewing and comparison, the data from Table 10 is presented in Fig. 21, respectively.
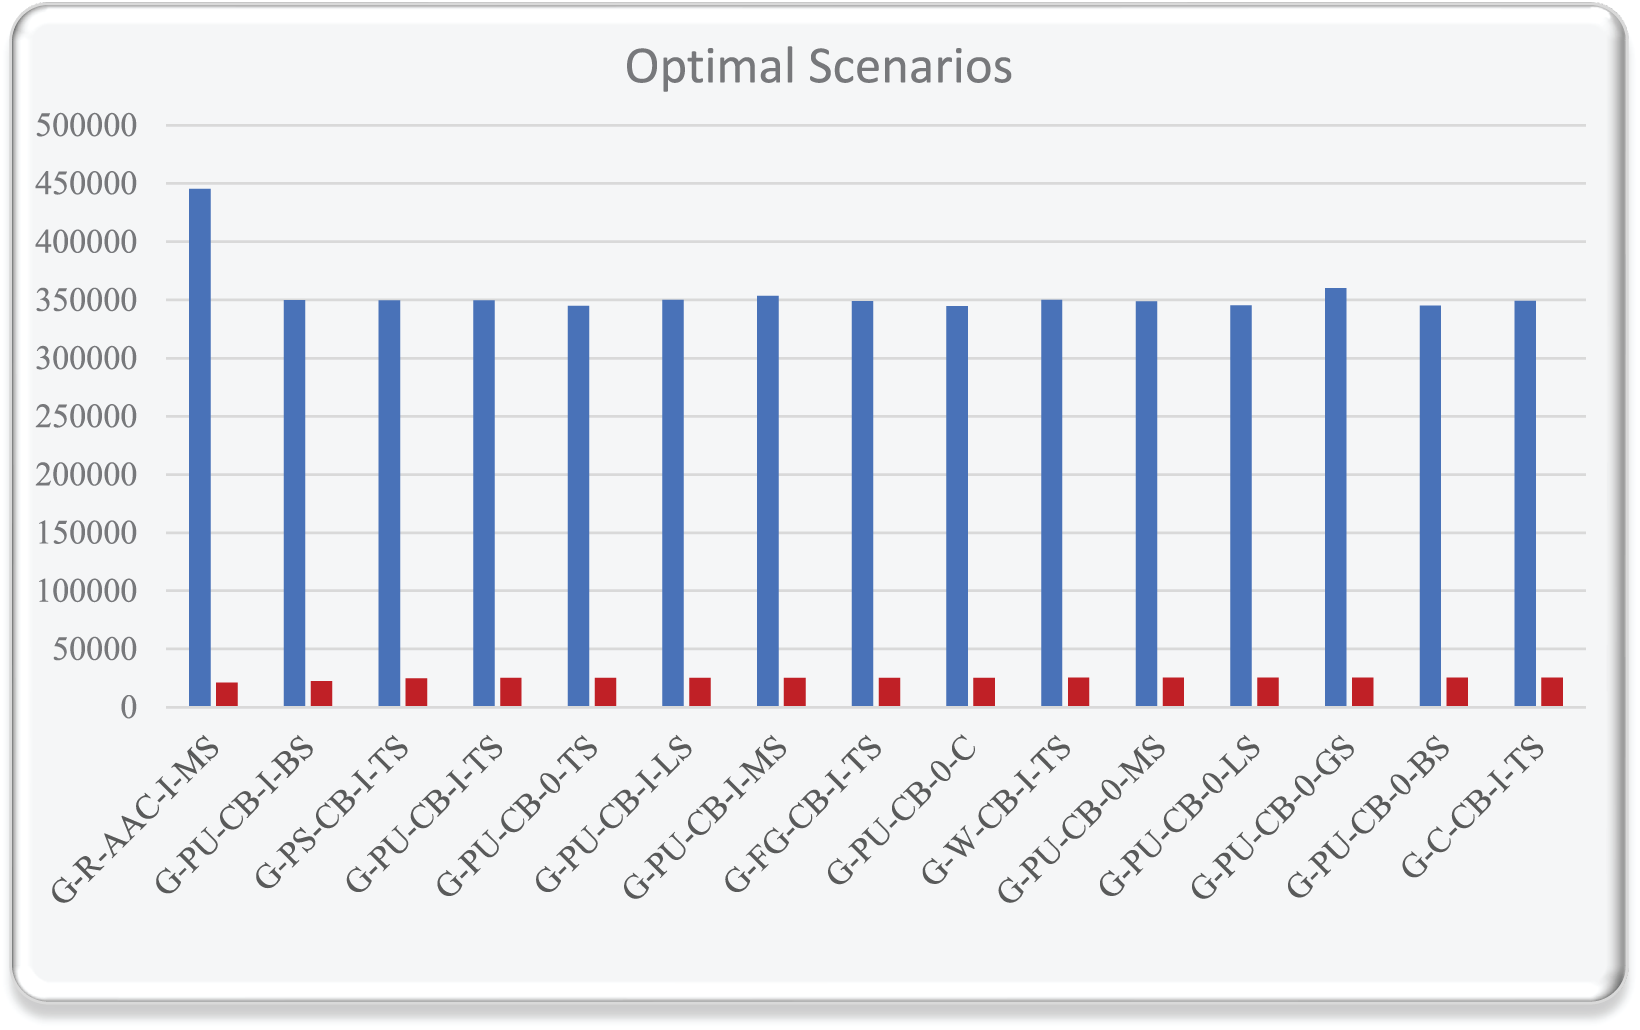
Figure 21: Lowest carbon emission scenarios with a payback period of less than 30 years
By comparing these three tables (Tables 3–5), it can be seen that although the G-PS-AAC-I-TS scenario has the lowest consumption and the highest energy savings in all three scenarios, but necessarily the energy consumption rating for gas and electricity consumption, or the total in different scenarios, is not the same.
For example, the G-PU-AAC-I-TS scenario ranks second in terms of electricity consumption and overall energy usage, but it ranks tenth in terms of gas consumption.
The most energy-efficient scenario across electricity, gas, and total energy consumption is G-CP-AC-0-C. However, in terms of gas consumption, the highest-consuming scenario is G-0-CS-0-C.
Other important observations from analyzing these three tables include:
1. In all 15 scenarios, using AAC (Autoclaved Aerated Concrete) blocks for the basic wall materials results in the lowest energy consumption for both electricity and gas.
2. Among the scenarios with the highest energy consumption, calcium silicate bricks play the most significant role as the basic wall material. This suggests that calcium silicate bricks are not an optimal choice for energy reduction.
3. The foam polyurethane insulation layer has the greatest impact on reducing electricity, gas, and overall energy consumption in the top 15 scenarios.
4. For gas consumption reduction, brick veneer (brick cladding) shows the most influence.
5. Walls without internal insulation have the highest impact on electricity, gas, and overall energy consumption in the top 15 scenarios, emphasizing the importance of using internal insulation layers.
6. After uninsulated walls, Plywood insulation has the most negative effect on reducing electricity, gas, and overall energy consumption in the highest-consuming scenarios, indicating that plywood insulation plays a minor role in energy reduction.
By comparing Tables 6 and 7, it can be seen that:
7. In carbon sequestration, the order and position of certain scenarios change compared to non-sequestered carbon sorting. For example, in carbon sequestration, scenario G-PS-CB-0-C has a lower rank than scenario G-R-CB-0-C. However, in the equivalent non-sequestered carbon sorting, this relationship is reversed. This indicates that the carbon dioxide emissions during the production of materials in scenario G-PS-CB-0-C are lower than in scenario G-R-CB-0-C, but the emissions of other greenhouse gases (such as methane, sulfur dioxide, nitrous oxide, hydrofluorocarbons, sulfur hexafluoride, and perfluorocarbons) apart from carbon dioxide are higher in scenario G-PS-CB-0-C compared to scenario G-R-CB-0-C. Mineral sequestration is another method where carbon dioxide removed from the atmosphere can be stored in the Earth’s crust by injecting it underground or in the form of insoluble carbonate salts, ensuring long-term sequestration. To enhance carbon sequestration in oceans, various technologies have been proposed, including seaweed farming, ocean fertilization, artificial upwelling, basalt storage, mineralization, deep-sea sediments, and adding bases to neutralize acids. However, large-scale application of these methods has not been achieved yet.
8. In all 15 scenarios with the lowest amount of embodied carbon and equivalent embodied carbon, the basic materials of the wall are cement blocks, and the wall has no insulation layer on the outside.
9. Also, the top 7 scenarios with the lowest amount of embodied carbon and equivalent Embodied carbon have a cement shell, and the other 8 scenarios have an outer shell with tufa stone or basalt stone.
10. In all 15 scenarios with the highest amount of embodied carbon and equivalent embodied carbon from Granite stone has been used in outer shells.
11. In all 15 scenarios with the highest amount of Embodied carbon and embodied carbon equivalent, the basic wall materials are AAC blocks.
By checking table number 8, it can be seen that:
12. In the top 15 scenarios with the lowest amount of carbon emission, except for one case, in 14 scenarios, the basic wall material is AAC block.
13. In the top 15 scenarios with the lowest amount of carbon emission, the internal insulation layer of polyurethane foam has had the greatest effect.
14. In 15 scenarios with the highest amount of carbon emission, the most basic material of the wall was calcium silicate brick.
By checking table number 9, it can be seen that:
15. In all 92 scenarios with a return period of less than 30 years, except for 2 cases, the basic wall material is cement block.
By checking table number 10, it can be seen that:
16. In all the top 15 scenarios with the lowest number of emissions among the scenarios with a return period of less than 30 years, except for one case, the basic material of the wall is cement block.
17. The polyurethane insulation layer had the most impact among the top 15 scenarios.
9 Suggestions for Future Research
Based on the new insights and questions that emerged during and after this research, the following topics are recommended for esteemed researchers in their future studies:
1. Investigating the impact of the thickness of various layers in the building’s external shell on energy consumption and carbon emissions.
2. Examining the influence of different regional climates on the studied sample and the optimal scenario.
3. Assessing the effect of facade colors on energy consumption and carbon emissions.
4. Analyzing the economic feasibility of implementing the top scenarios and the payback period.
Acknowledgement: I would like to express my heartfelt gratitude to the Islamic Azad University, Science and Research Branch for providing the necessary facilities and support that made this research possible. I am deeply thankful to my supervisors and mentors at the university for their invaluable guidance and constructive feedback throughout the project. Furthermore, I also wish to extend my appreciation to my colleagues and friends for their collaborative spirit and encouragement. Last but not least, I am immensely grateful to my family for their unwavering support and understanding during this academic journey.
Funding Statement: The authors received no specific funding for this study.
Author Contributions: Amir Sina Darabi: Writing—original draft, formal analysis, resources, data collection, literature review, data curation, writing—review & editing. Mehdi Ravanshadnia: Conceptualization, methodology, project administration, reviewing manuscript, and supervision. All authors reviewed the results and approved the final version of the manuscript.
Availability of Data and Materials: The datasets and materials used in this study are available upon reasonable request. Interested readers can contact us via email.
Ethics Approval: Not applicable.
Conflicts of Interest: The authors declare no conflicts of interest to report regarding the present study.
References
1. Gan S, Feng J, Fang B, Chen W. Carbon emission measurement of the envelope of a university teaching building in Hefei City. Int J Low Carbon Technol. 2024;19:1026–40. doi:10.1093/ijlct/ctae043. [Google Scholar] [CrossRef]
2. Navaei SAM, Jozaei AF, Ghafouri A, Adeli MM. The effect of using air gaps in the walls on reducing the energy consumption of a residential building. New Pract Comput Find Mech Syst. 2024;3(3):56–64. [cited 2025 Jul 13]. Available from: https://journals.iau.ir/article_708901.html. (In Persian). [Google Scholar]
3. Allahyari F, Behbahaninia A, Rahimi H, Farahani M, Khadivi S. Optimizing energy consumption in the building sector using neural networks and PSO algorithms (case study: bandar Abbas city). Environ Sci Technol. 2022;10(23):1–17. [cited 2025 Jul 13]. Available from: https://sanad.iau.ir/fa/Article/834842. (In Persian). [Google Scholar]
4. Ghodousifar SM, Asli MF. Analyzing the double skin shell moving in the efficiency of energy consumption in residential buildings’ sustainability in Tabriz city. J Sus Dev Environ. 2022;3(4):21–41. [cited 2025 Jul 13]. Available from: https://sanad.iau.ir/Journal/jsde/Article/846637. (In Persian). [Google Scholar]
5. Ghadikolaei FM, Darzi JM, Goudarzi ZM. Principles of ecological architecture for designing residential building envelopes in hot and humid climates to lower indoor air temperature based on ecological architecture. J Iran Archit Urban. 2022;13(2):297–316. (In Persian). doi:10.30475/isau.2021.249604.1524. [Google Scholar] [CrossRef]
6. Ustaoglu A, Yaras A, Sutcu M, Gencel O. Investigation of the residential building having novel environment-friendly construction materials with enhanced energy performance in diverse climate regions: cost-efficient, low-energy and low-carbon emission. J Build Eng. 2021;43:102617. doi:10.1016/j.jobe.2021.102617. [Google Scholar] [CrossRef]
7. Aghakhani S, Haghparast F, Asefi M. Environmental effects of concrete, brick, and wood usage in construction on energy consumption and carbon emissions; case study of northwestern Iran. Geogr Res. 2021;36:313–21. (In Persian). [Google Scholar]
8. Fathalian A, Kargarsharifabad H. Investigating the effect of different energy-saving strategies on the energy rating of the building by design builder software (case study: office building). Environ Sci Technol. 2020;22(7):199–214. [cited 2025 Jul 13]. Available from: sid.ir/paper/390217/fa. (In Persian). [Google Scholar]
9. Soler D, Salandin A, Bevivino M. Using integer linear programming to minimize the embodied CO2 emissions of the opaque part of a façade. Build Environ. 2020;177:106883. doi:10.1016/j.buildenv.2020.106883. [Google Scholar] [CrossRef]
10. Dabaieh M, Heinonen J, El-Mahdy D, Hassan DM. A comparative study of life cycle carbon emissions and embodied energy between Sun-dried bricks and fired clay bricks. J Clean Prod. 2020;275(1):122998. doi:10.1016/j.jclepro.2020.122998. [Google Scholar] [CrossRef]
11. Xu J, Deng Y, Shi Y, Huang Y. A bi-level optimization approach for sustainable development and carbon emissions reduction towards construction materials industry: a case study from China. Sustain Cities Soc. 2020;53(3):101828. doi:10.1016/j.scs.2019.101828. [Google Scholar] [CrossRef]
12. Karami M, Anbarzadeh E. Optimizing the insulation thickness of the building in different climatic conditions with an environmental approach. Build Eng Hous Sci. 2020;13(4):1–5. (In Persian). [Google Scholar]
13. Mohaghar A, Hosseinzadeh M, Amoozad H, Shakerzadeh A. Investigating policies to reduce carbon dioxide emissions from the construction industry using dynamic modeling. Glob Strateg Stud. 2020;9(30):307–28. [cited 2025 Jul 13]. Available from: sid.ir/paper/230000/fa. (In Persian). [Google Scholar]
14. Safa BS, Heydari F, Soleimanpoor N. Auditing the amount of energy loss through the external walls of the building and the effect of thermal insulation by simulation in Design Builder software (case example: an office building in Tehran). J Sci Eng Elites. 2020;5(3):169–79. [cited 2025 Jul 13]. Available from: https://www.sid.ir/paper/367436/fa. (In Persian). [Google Scholar]
15. Pedroso M, Flores-Colen I, Silvestre JD, Gomes MG, Silva L, Sequeira P, et al. Characterisation of a multilayer external wall thermal insulation system. Application in a mediterranean climate. J Build Eng. 2020;30:101265. doi:10.1016/j.jobe.2020.101265. [Google Scholar] [CrossRef]
16. Ildarabadi P, Rahimi M, Omidvar P. Optimization of material consumption using novel technologies in the construction industry and its influences on sustainable development considering CO2 emission mitigation. J Environ Sci Stud. 2019;4(1):917–28. [cited 2025 Jul 13]. Available from: https://www.jess.ir/article_86834.html?lang=fa. (In Persian). [Google Scholar]
17. Gholipour Y, Yousefi F. Life cycle assessment of a real residential building in Tehran. J Fine Arts Archit Urban Plan. 2018;23(1):81–92. [cited 2025 Jul 13]. doi:10.22059/jfaup.2018.247936.671899. (In Persian). [Google Scholar] [CrossRef]
Cite This Article
 Copyright © 2025 The Author(s). Published by Tech Science Press.
This work is licensed under a Creative Commons Attribution 4.0 International License , which permits unrestricted use, distribution, and reproduction in any medium, provided the original work is properly cited.
 Downloads
 Citation Tools