
 Submit a Paper
 Propose a Special lssue
 Open Access
ARTICLE

Numerical Simulation of Air-Assisted Heating for Cold-Start in Cathode-Open Proton Exchange Membrane Fuel Cells
1 College of Energy Engineering, Zhejiang University, Hangzhou, 310027, China
2 Provincial Key Laboratory of New Energy Vehicles Thermal Management, Longquan, 323700, China
3 Longquan Industrial Innovation Research Institute, Longquan, 323700, China
4 Jiashan Power Supply Company, State Grid Zhejiang Electric Power Co., Ltd., No. 858 South Station Road, Jiaxing, 314100, China
* Corresponding Author: Shusheng Xiong. Email:
Energy Engineering 2025, 122(9), 3507-3523. https://doi.org/10.32604/ee.2025.065579
Received 17 March 2025; Accepted 11 June 2025; Issue published 26 August 2025
 View Full Text
 Download PDF
Abstract
In the realm of all-electric aircraft research, the integration of cathode-open proton exchange membrane fuel cells (PEMFC) with lithium batteries as a hybrid power source for small to medium-sized unmanned aerial vehicles (UAVs) has garnered significant attention. The PEMFC, serving as the primary energy supply, markedly extends the UAV’s operational endurance. However, due to payload limitations and spatial constraints in the airframe layout of UAVs, the stack requires customized adaptation. Moreover, the implementation of auxiliary systems to facilitate cold starts of the PEMFC under low-temperature conditions is not feasible. Relying solely on thermal insulation measures also proves inadequate to address the challenges posed by complex low-temperature startup scenarios. To overcome this, our study leverages the UAV’s lithium battery to heat the cathode inlet airflow, aiding the cathode-open PEMFC cold start process. To validate the feasibility of the proposed air-assisted heating strategy during the conceptual design phase, this study develops a transient, non-isothermal 3D cathode-open PEMFC unit model incorporating cathode air-assisted heating and gas-ice phase change. The model’s accuracy was verified against experimental cold-start data from a stack composed of identical single cells. This computational framework enables quantitative analysis of temperature fields and ice fraction distributions across domains under varying air-assisted heating powers during cold starts. Building upon this model, the study further investigates the improvement in cold start performance by heating the cathode intake air with varying power levels. The results demonstrate that the fuel cell achieves self-startup at temperatures as low as −13°C under a constant current density of 100 mA/cm2 without air-assisted heating. At an ambient temperature of −20°C, a successful start-up can be achieved with a heating power of 0.45 W/cm2. The temperature variation overtime during the cold start process can be represented by a sum of two exponential functions. The air-assisted heating scheme proposed in this study has significantly improved the cold start performance of fuel cells in low-temperature environments. Additionally, it provides critical reference data and validation support for component selection and feasibility assessment of hybrid power systems.Keywords
In recent years, heightened concerns over greenhouse gas emissions (with the aviation industry contributing to 2% to 3% of global carbon dioxide emissions, a figure expected to rise) alongside significant noise pollution issues, have catalyzed a robust push toward the development of “more electric aircraft” [1–3]. While hybrid-electric and turboelectric aircraft still partially depend on conventional combustion engines, all-electric aircraft align more closely with stringent environmental protection standards. The majority of all-electric UAVs are powered exclusively by batteries. Although batteries can deliver high power outputs over short durations, their energy density remains relatively low, at approximately 2.5% that of hydrocarbon fuel engines [4,5]. This limitation has been demonstrated to be inadequate for meeting the long-endurance requirements of UAVs [2].
Therefore, fuel cells have gained considerable popularity as the primary power source in UAV electric propulsion systems. For an equivalent energy storage capacity, a hydrogen fuel cell can be 3 to 5 times lighter than a lithium-based battery [6]. Moreover, the unique refueling method of fuel cells circumvents the lengthy charging processes associated with batteries [7]. The cathode-open PEMFC utilizes forced convection via fans to deliver air to the cathode, supplying oxygen for the oxygen reduction reaction while removing heat and water generated by the reaction. This design eliminates the need for complex gas distribution and additional thermal management systems, resulting in a more compact and lightweight architecture. Although its power density is relatively low, it demonstrates satisfactory performance in low-power applications, particularly for small-to-medium electric UAVs. The hybrid power system, integrating cathode-open PEMFC with lithium batteries, is installed within the UAV airframe. Fig. 1 illustrates the layout of such a system in a fixed-wing UAV with a 3.8-m wingspan, highlighting the severe spatial constraints imposed by the airframe. Furthermore, stringent payload limitations rule out most conventional fuel cell cold-start solutions. For small and medium-sized rotorcraft UAVs, dedicated carriers are utilized to reach the operational area, where temperature requirements within the carrier are met before commencing work. In the case of small and medium-sized fixed-wing UAVs, hangars equipped with heating auxiliary devices are constructed near the takeoff runway. For the aircraft themselves, only passive measures such as adding insulating materials are employed. Mobile systems employing cathode-open PEMFC as primary power sources face limited adoption in cold regions due to the absence of active heating mechanisms [8–10].
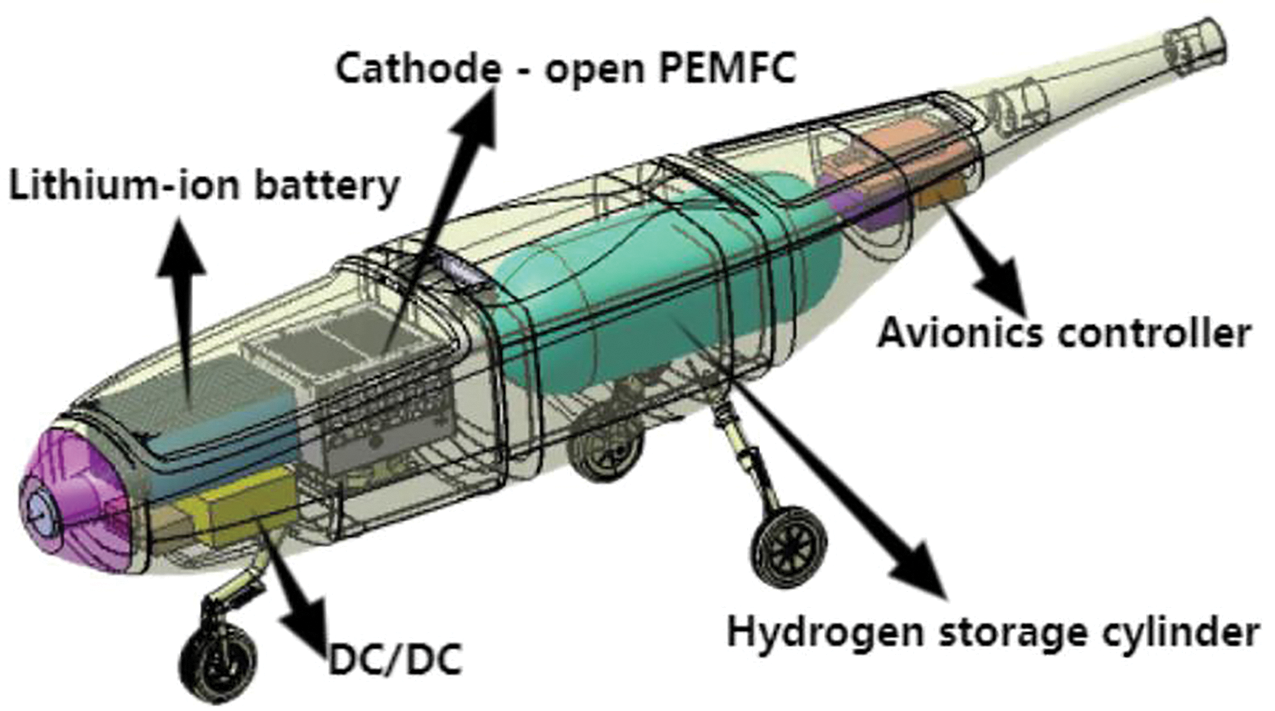
Figure 1: Schematic of the hybrid power system layout in the fixed-wing UAV airframe
Achieving sufficiently high fuel cell temperatures is critical before water generated by redox reactions freezes into ice and ultimately blocks further reactions. One method involves applying insulation [11] and heating the fuel cells during the shutdown period to prevent the battery temperature from dropping below 0°C. However, this strategy merely delays the inevitable drop in fuel cell temperature by several hours or days, while also increasing the stack’s volume and energy consumption. This approach is particularly unsuitable for use in UAVs, where weight and efficiency are paramount.
Instead of the insulation strategy, initial heating is a more prevalent approach for achieving a sufficiently high temperature during the cold start process. There are generally three methods to raise the stack temperature: self-heating through electric propulsion, external heating, and a combination of both. Self-heating utilizes the heat generated by electrochemical reactions within the fuel cells, which can produce a higher rate of heat generation mainly due to ohmic resistance and the overpotential of oxygen reduction reaction (ORR).
Cold-start strategies for PEMFCs are primarily classified into three control modes: current [12–14], voltage [12], and power regulation [15]. In power-controlled startups, current density exhibits a characteristic rise-and-fall profile, with activation heat dominating the thermal balance. Current-controlled operations demonstrate superior performance at lower initial current densities [12], as reduced water production delays ice-induced failure [16]. However, the current objective is not to extend run time before failure but to successfully achieve a cold start. Jiao and Li demonstrated enhanced cold-start capability at elevated current densities. The rationale is that the rate of water production, internal voltage drop, and rate of heat generation are all proportional to current density, with the relationship between internal voltage drop and rate of heat generation being even more pronounced relative to water production. The same authors also concluded that a low fuel cell voltage under potentiostatic cold start conditions is even better, as fuel cell resistance can vary during cold start, and low voltage potentiostatic control ensures a high current density. This low fuel cell voltage approach has also been proposed by other studies [17] and implemented in Toyota’s fuel cell hybrid vehicles. Lei et al. [18] employed a 1D transient model to investigate loading mode effects on stack cold-start performance at −20°C, including constant current loading mode, ramped current slope, zigzag current, and stepwise variable current. The stepwise current loading strategy demonstrated superior cold-start performance, exhibiting faster startup, enhanced thermal management, and optimized water/ice dynamics compared to constant loading methods.
In addition to internal heating, various external heating strategies have been employed to enhance cold start capability. Antifreeze agents such as methanol can mitigate ice formation but tend to reduce cell performance above 0°C [19]. Electrically heated coolant represents a feasible solution [20,21], albeit with significant energy consumption. Integrated auxiliary heating strategies synergize external and internal heating phases to minimize cold-start duration while maximizing process efficiency.
In summary, under stringent UAV payload and spatial constraints, the optimal active heating solution for cold starts combines structurally simplified cathode-open PEMFCs with air-assisted heating, where the hybrid system’s lithium battery provides auxiliary power. However, this approach remains understudied, with no existing numerical models for its analysis. This work develops a validated gas-ice two-phase fuel cell model with air-assisted heating capability, building upon the transient, non-isothermal 3D PEMFC framework in [22]. Through parametric calibration against experimental stack data, the model accurately predicts cold-start performance under varying air heating power inputs, enabling systematic evaluation of temperature-dependent startup characteristics.
Current studies confirm that PEMFC cold-start modeling must resolve five distinct water phases: vapor, supercooled liquid, ice, frozen membrane water, and non-frozen membrane water. Furthermore, the generation, existence, and transformation of water vary significantly at different locations within the cell [23]. This variability substantially increases the complexity and computational demands of fuel cell models, posing challenges to the study of cold start mechanisms. Ge and Wang’s [24] instantaneous sublimation assumption is supported by experimental evidence showing ≤2°C freezing suppression in the catalyst layer, demonstrating negligible impact on cold-start performance. Consequently, for simplicity, the presence of liquid water during cold start operations can be excluded. The PEMFC can be modeled by considering only the gaseous phase of water and the solid phase of ice, under the assumption that gaseous water directly transforms into solid ice.
The specific assumptions employed in the model are as follows:
Given the low flow rate of reactant gases, it is postulated that the internal flow within the gas channels (GC) exhibits laminar characteristics.
The reactant gas mixture is treated as an ideal gas.
The transition from liquid water to solid ice is considered instantaneous.
Porous media flow adheres to Darcy’s law.
The charging and discharging processes of the electrochemical double layer at the catalytic layer (CL) are negligible.
The effects of gravity are disregarded.
The influence of anode electronic valve periodic venting on hydrogen supply is ignored, assuming a steady-state hydrogen supply.
The schematic diagram of the cathode-open PEMFC stack with air-assisted heating is depicted in Fig. 2a. The fan and electric heating wire are powered by a battery, and the performance of the stack is controlled by adjusting the flow rate of cathode air through regulation of the fan speed. It is crucial to emphasize that this process necessitates careful consideration of the thermal management of the fuel cell. The 3D simulation domain is illustrated in Fig. 2b. To streamline the model and reduce computational time, the serpentine flow channel of the anode hydrogen is simplified to a straight channel.
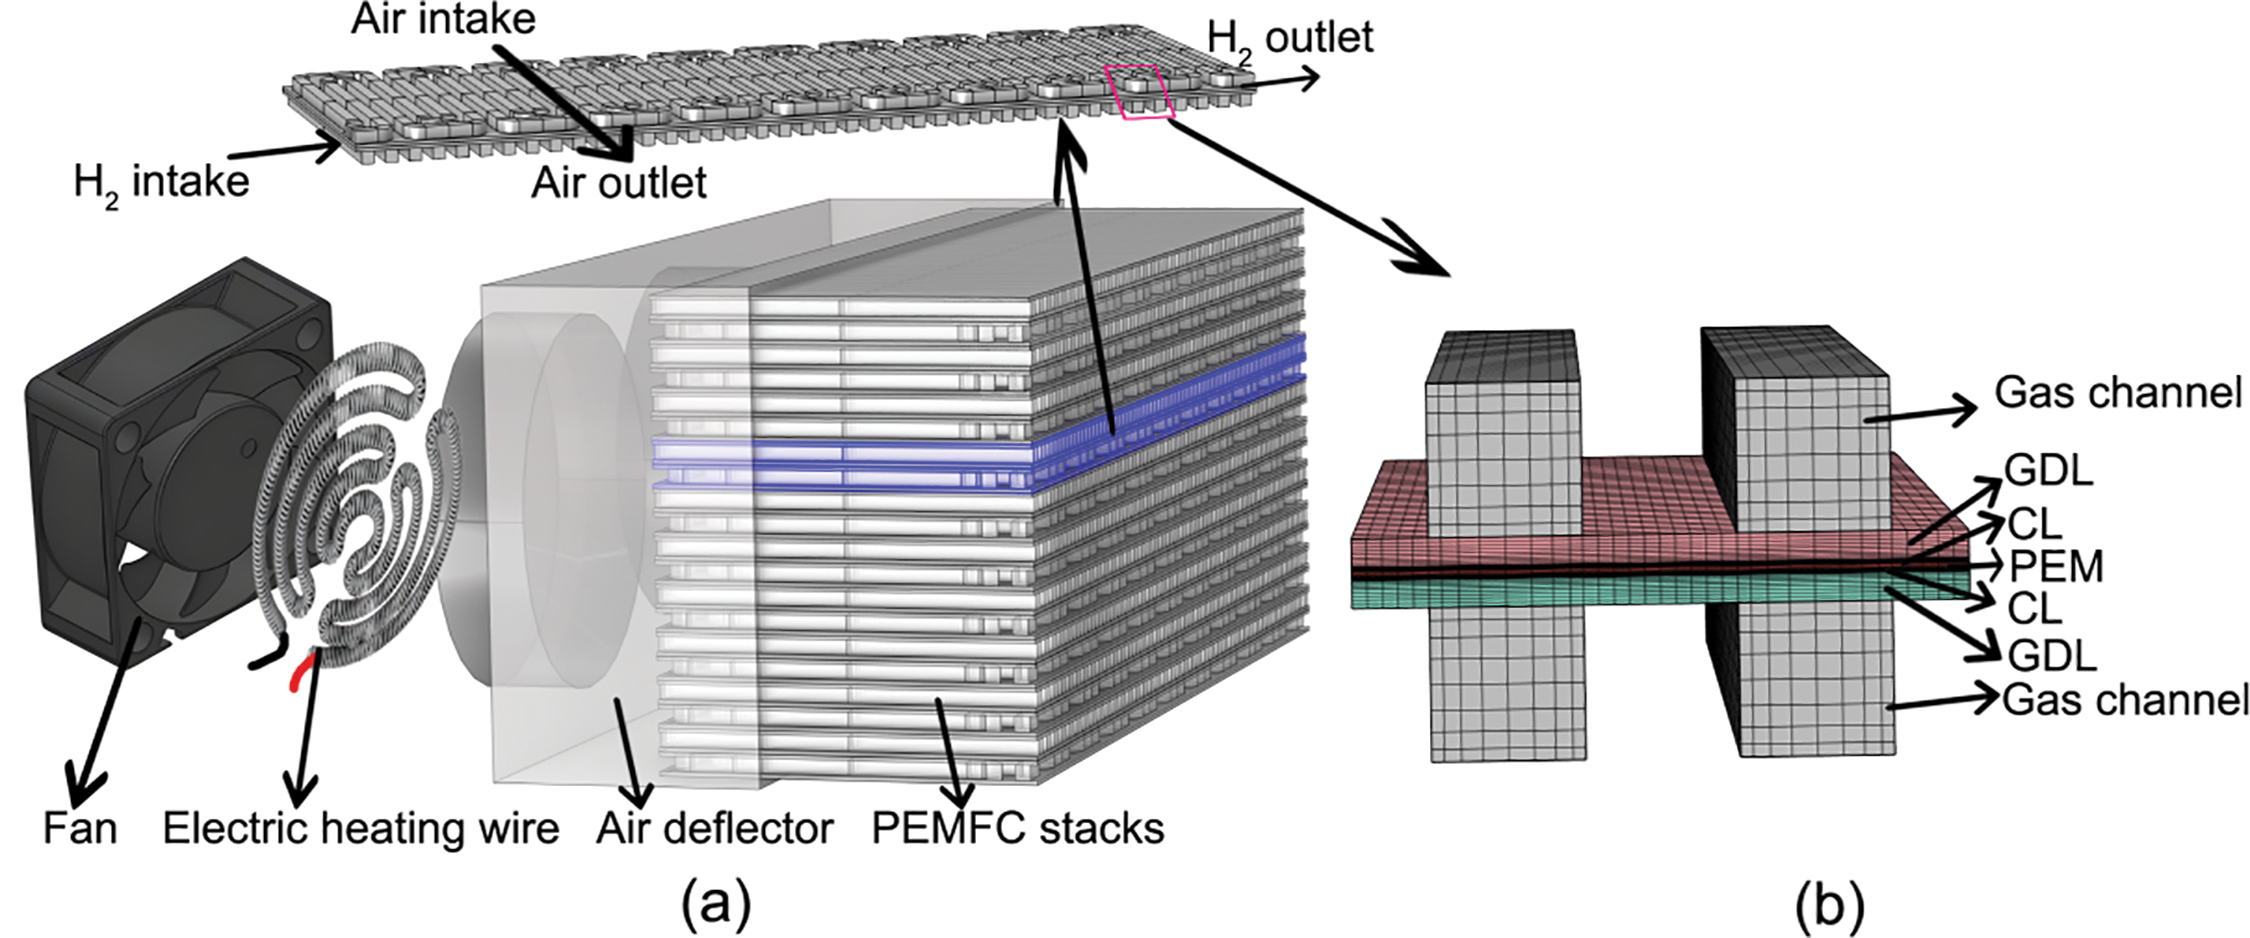
Figure 2: (a) Schematic diagram of cathode-open PEMFC stack structure; (b) Geometry and numerical mesh of a 2-channels cathode-open PEMFC
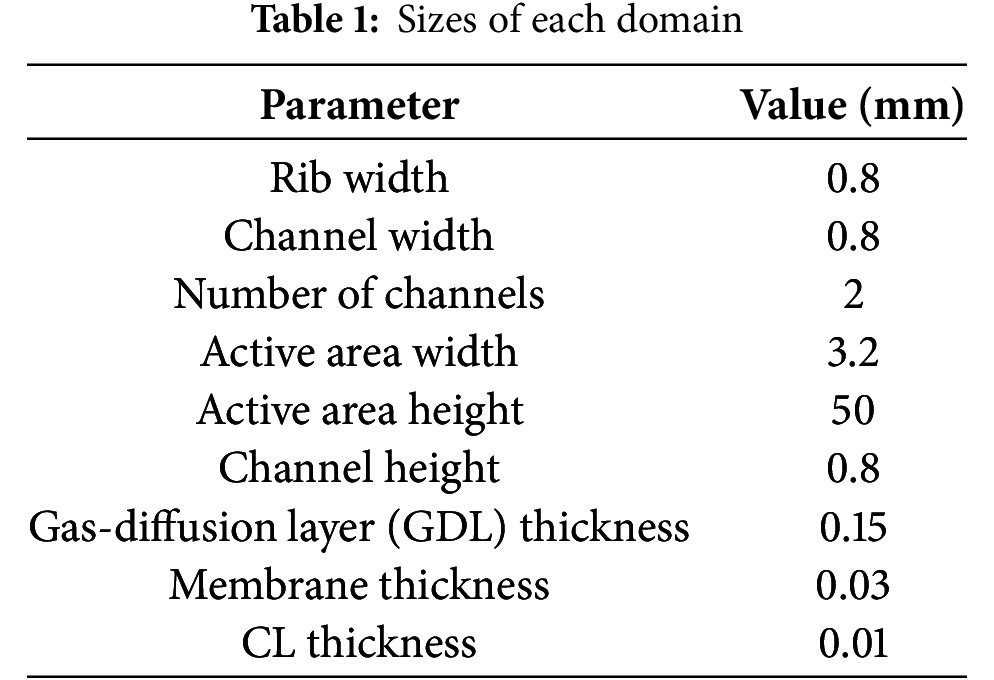
The 3D simulation domain is depicted in Fig. 2b, with the dimensions of each layer detailed in Table 1. The fuel cell is thermally coupled via air, as illustrated. In practical applications, air is heated by an electric heating wire and subsequently delivered to the guide hood by a fan. The streamlined gas is then directed into the cathode channel. Given the complexity of modeling this process, this paper simplifies the model and expedites computation by calculating the air temperature and mass flow rate entering the channel post-heating based on the magnitude of the heating power. The cold start model was developed following the methodologies outlined in the literature [25–27].
2.3 Governing Equations and Source/Sink Terms
The model framework integrates five coupled conservation equations (mass, momentum, species, charge, and energy) with their corresponding source terms. The conservation equations are presented in Table 2. For detailed explanations of symbols, superscripts, subscripts, and abbreviations used in the formulas, please refer to the nomenclature.
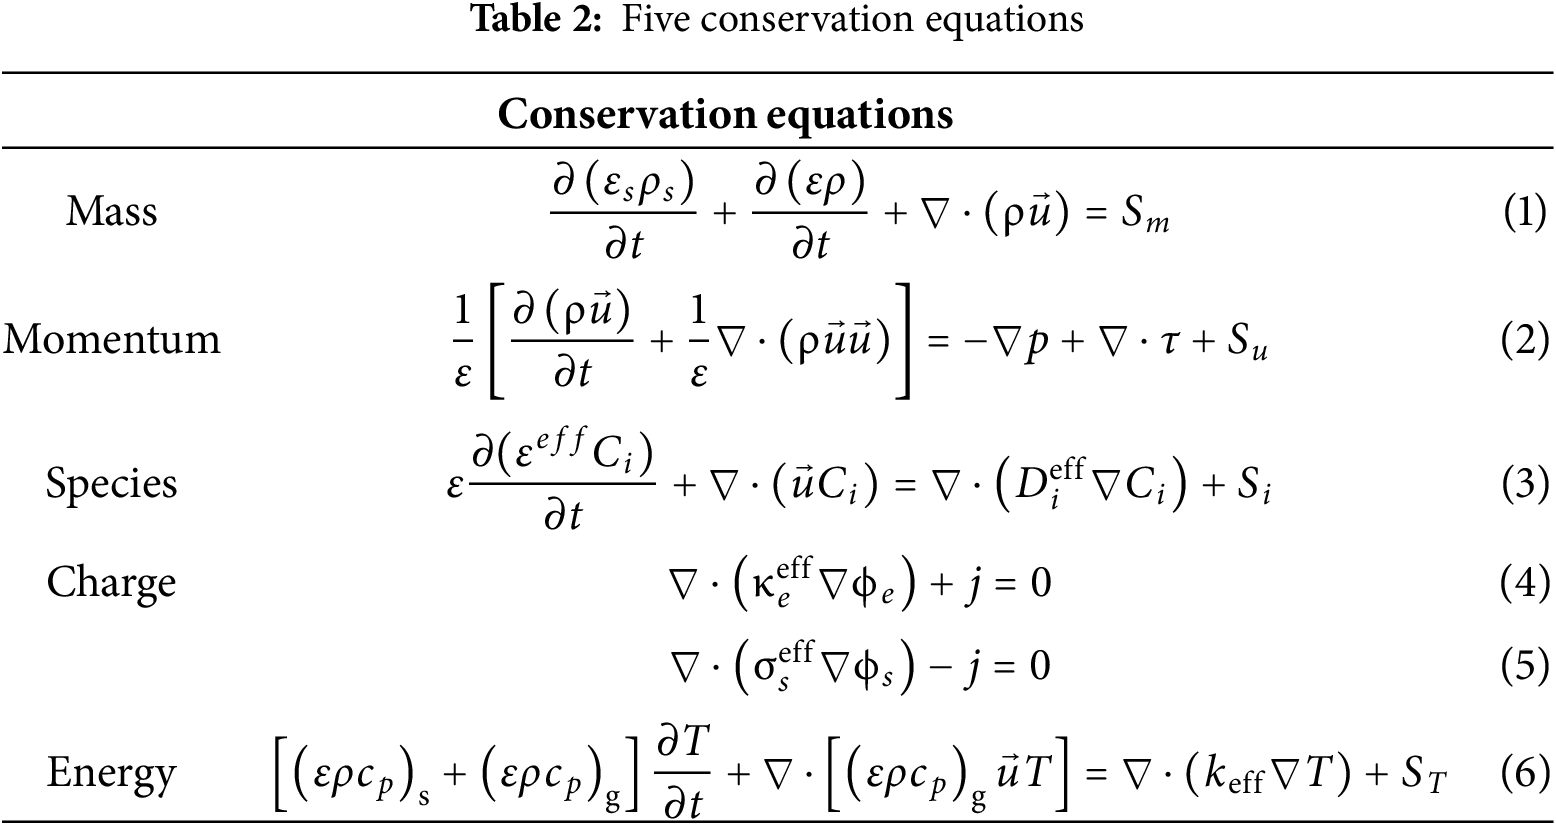
In Table 2, all conservation equations include source terms. In the mass conservation equation,
At the anode, the gas mixture comprises vapor and hydrogen, whereas on the cathode side, it consists of vapor, oxygen, and nitrogen. The sum of the diffusion rates between components in the gas phase is equal to zero. The species’ effective diffusivity in the gas mixture combines molecular and Knudsen diffusion through the Bruggeman correlation [28], accounting for porous media porosity and tortuosity:
In the water fluid phase, multiple sources and sinks contribute to the various forms of water: ORR, adsorption of water on the ionomeric polymer, freezing, and desorption reactions. The water phase transition satisfies mass conservation. In porous media, water vapor transport follows Darcy’s law, while in flow channels it obeys laminar flow equations. Under the instantaneous sublimation assumption [29], excess vapor beyond saturation immediately condenses into ice, which accumulates locally. Conversely, ice melts directly into vapor when the temperature reaches the melting point, with the local temperature remaining fixed until complete ice dissolution. The water transport equation for CL/GDL regions incorporates a phase-change source term
In the context of water transport dynamics,
The membrane primarily accounts for the drag of water and proton conductivity. The parameters used in the model include
The energy balance formulation (Eq. (6)) accounts for thermal energy storage in both solid and fluid phases, convective and conductive heat transfer mechanisms, and comprehensive heat generation effects including electrochemical reaction entropy, irreversible losses, Joule heating, and water phase-change enthalpy.
In the source term equation,
The current density
The cathode exhibits slower reaction kinetics characterized by higher surface overpotential, appropriately modeled through Tafel:
The surface overpotential in the aforementioned kinetic equations is defined as:
The thermodynamic equilibrium potential
As mentioned above, the power system of small and medium-sized UAVs is generally a hybrid power source composed of fuel cells matched with lithium-ion batteries. It is postulated that lithium-ion batteries, having recovered their external power supply capability through self-heating technology in low-temperature environments [30,31], can serve as a power source for fans and heating elements. The mass flow rate in the airflow channel can be calculated using the following formula:
After obtaining the flow rate, the inlet air temperature can be calculated based on the heating power and the heat capacity of the mixed gas. Assuming that the temperature of the intake air is uniform, its calculation formula is as follows, noting that the heating power has taken efficiency into account.
In simulations, the heating power density (obtained by dividing total heating power by stack intake area) can be multiplied by the simulation domain area to determine the localized heating power.
The material parameters of the membrane are primarily characterized by four attributes: the density of the membrane in the absence of water (1980 kg/m3), the equivalent weight of dry membrane (1.1 kg/mol), the specific heat capacity of the membrane (1650 kJ/(m3·K)), and the thermal conductivity. The thermal conductivity is not a fixed value, but related to its water content.
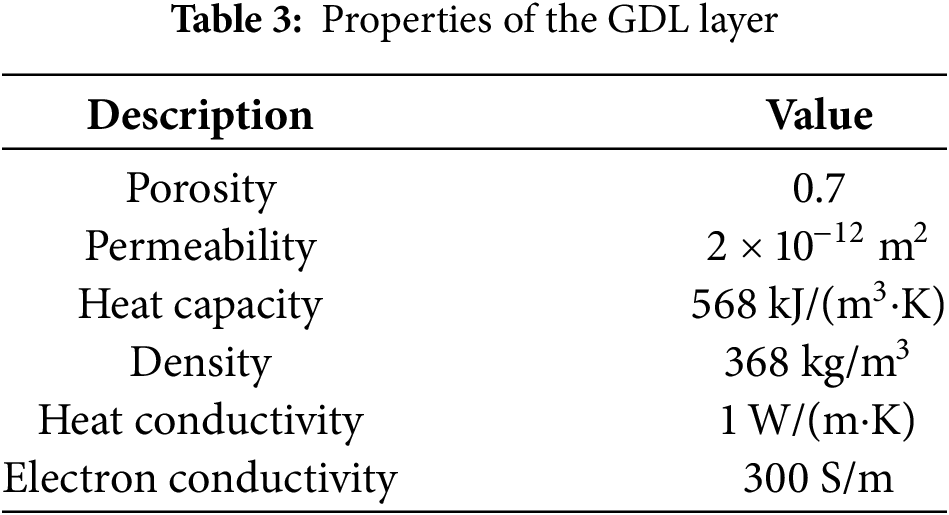
The parameters used in the CL layer model include porosity (55%), permeability (6.2 × 10⁻¹³ m2), catalyst volume fraction (30%), density (2200 kg/m3), thermal conductivity (4.8 W/(m∙K)), and electronic conductivity (20 S/m). Table 3 shows the material properties of the GDL.
2.5 Numerical Simulation Procedure
The governing equations and physical models described in the preceding sections were implemented in the commercial computational software COMSOL Multiphysics, with water phase change and cathode air heating modules incorporated through user-defined functions. In the transient simulation, the time step is set to 0.001 s. The grid division of the model is shown in Fig. 3.
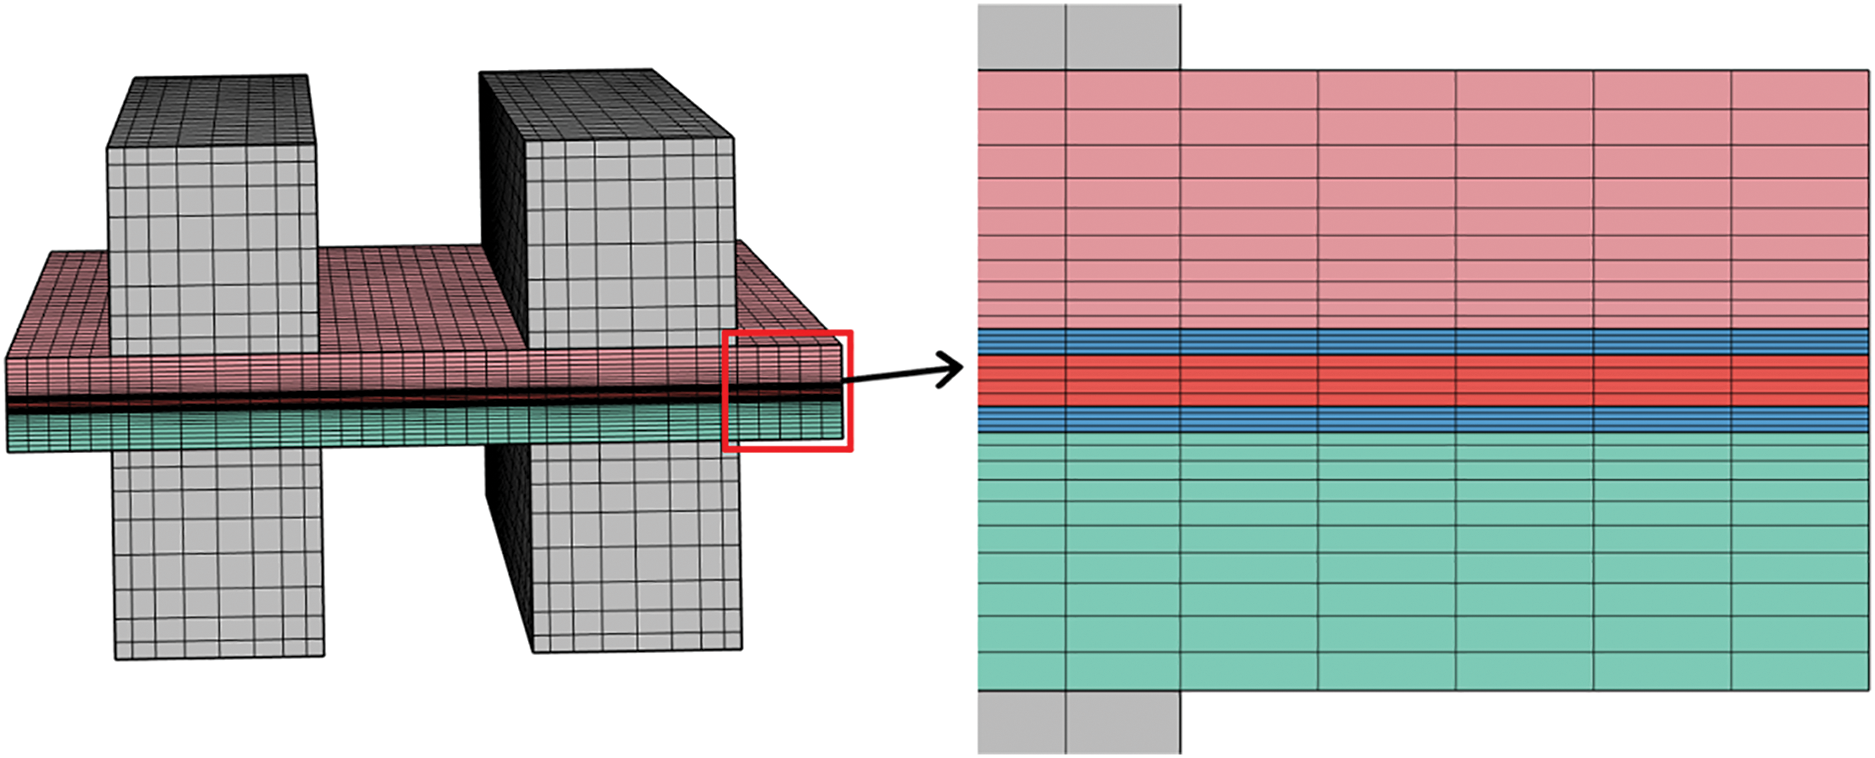
Figure 3: The mesh generation of the model and its local enlarged view
The grid independence of the solution was examined prior to the simulation calculations. The procedure was as follows: initially, the constant current density was set at 40 mA/cm2. The key physical quantity under consideration for the steady-state simulation was the boundary potential. In accordance with the characteristics of the model, a combined mapping and sweeping technique was employed for the initial mesh generation. Subsequently, the number of elements in the mapped distribution was changed by factors of 0.5, 1.5, 2, and 2.5, respectively. This adjustment aimed to reduce the size of the mesh elements and increase the mesh density. The boundary potentials obtained under different mesh configurations were recorded and compared to verify the grid independence. The results of the grid independence check are presented in the Table 4:
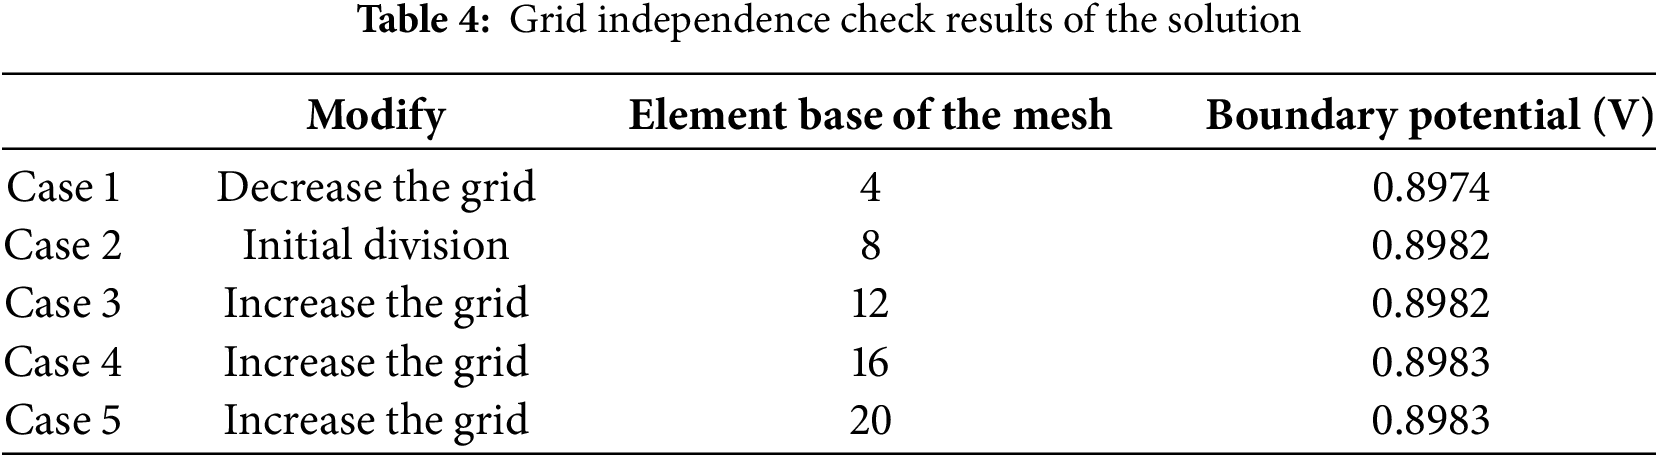
As shown in Table 4, in the grid division, when the element base is greater than or equal to 8, the calculated boundary potential tends to a fixed value. Therefore, an element base of 8 can not only ensure the accuracy of the simulation calculation but also reduce the number of mesh elements and improve the running speed.
3 Simulation Verification and Discussion
3.1 Validation of the 2-Channel Cathode-Open PEMFC Model
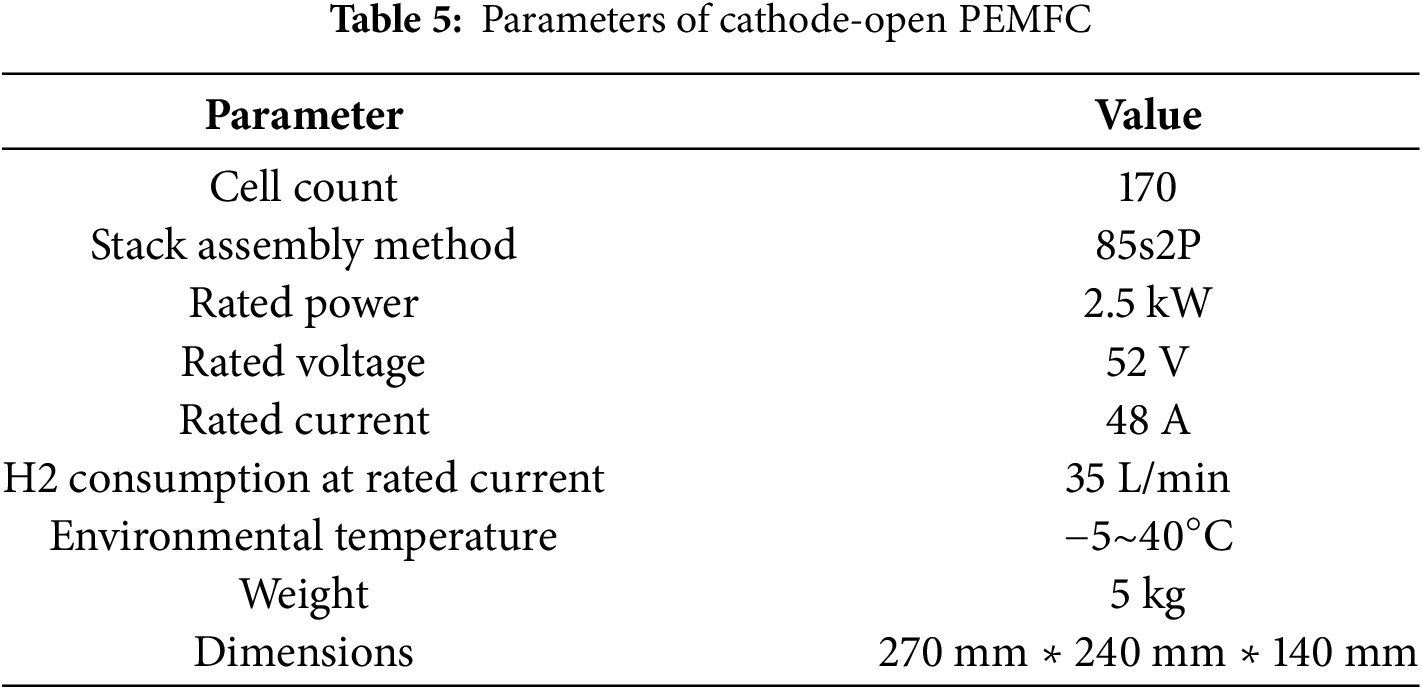
For model validation, the simulation results were compared with experimental cold-start voltage data measured at −20°C. As shown in Fig. 4, the tested cathode-open fuel cell stack (specifications in Table 5) consists of 170 unit cells configured in a 2-parallel 1-series arrangement. Each unit cell contains 40 flow channels, thus under the homogeneous assumption, the simulation domain represents 1/3400 of the full stack. Notably, this product’s minimum operating temperature (−5°C) significantly differs from conventional PEMFC systems with active air supply and thermal management subsystems.
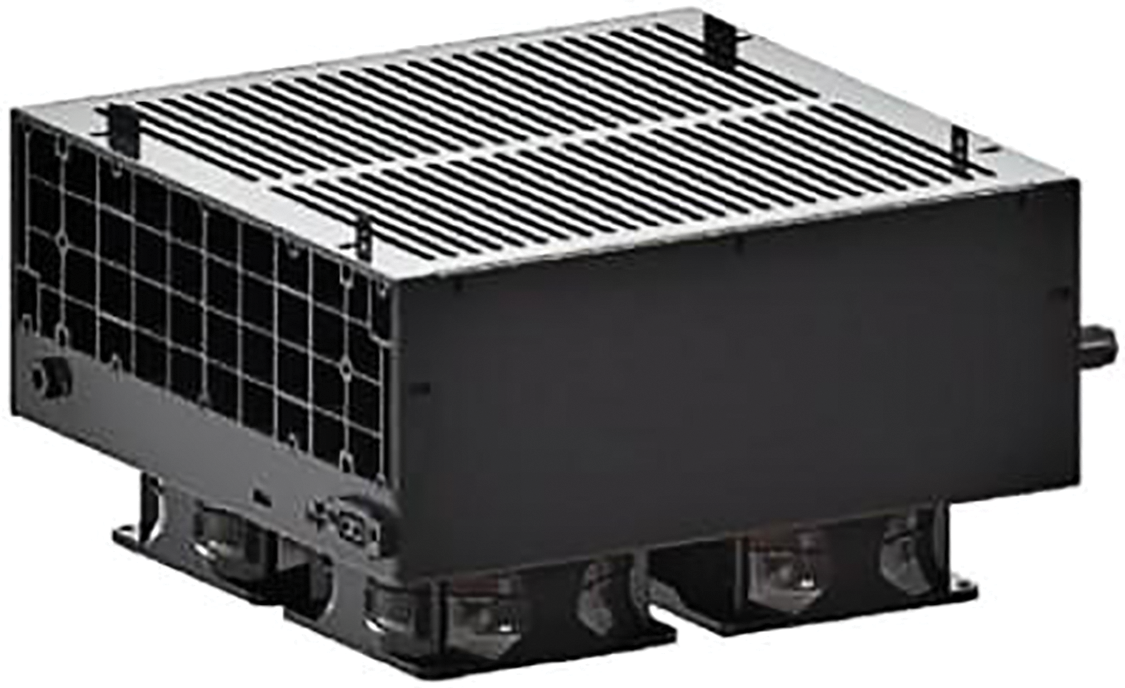
Figure 4: Cathode-open PEMFC for −20°C cold-start experimental validation
In these experiments, water content was controlled using the equilibrium sweeping method [32]. This paper does not discuss the influence of membrane water content [33]. The cold-start protocol employed a two-phase current control strategy: (1) a 10-s ramp phase at 10 mA/cm2/s, followed by (2) constant-current operation at 100 mA/cm2 until either stack temperature exceeded 0°C (successful startup) or average cell voltage decayed to ≤0.4 V (failure criterion). Specifically, the initial applied current in the simulation was set to 10 mA/cm2 to avoid numerical issues associated with zero current density. For the following simulation calculations, apart from the parameters in the air-assisted heating part which are reset based on the heating scheme, the values of other parameters are kept the same as those in the verification model.
As shown in Fig. 5, there are four sets of data in total. It compares experimental and simulated data during −20°C cold-start, presenting both single-cell voltage and stack current dynamics. Initial experimental voltage measured 0.9792 V, while the simulation (at 10 mA/cm2) predicted 0.9279 V. Upon reaching 100 mA/cm2, the stack delivered 18 A output current with average cell voltage decaying to 0.62 V (equivalent to 52 V stack output), representing only 37.5% of rated power. These results demonstrate significantly slowed ORR kinetics and reactant transport rates under cryogenic conditions.
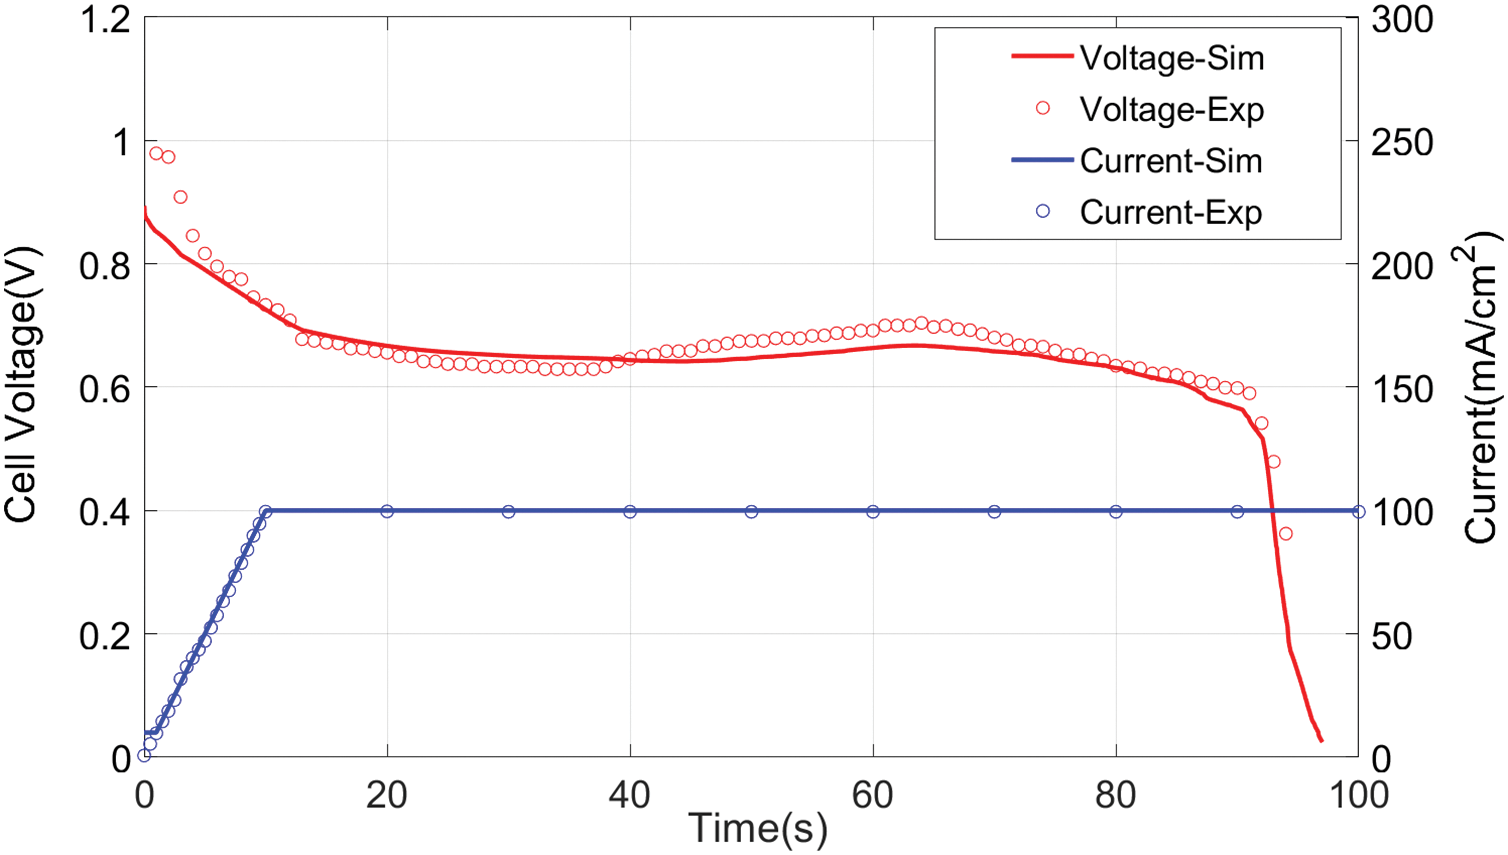
Figure 5: Comparison of voltage evolution curves predicted (lines) and experimental data (symbols) for startup temperatures of −20°C
Fig. 6 presents the temperature field and gas flow velocity profile within the air channels at 20 s into the simulation, with an ambient temperature of −20°C. It was observed that the cathode air channel exhibited the lowest temperatures due to the high inlet airflow rate. Within such a small simulation domain, the temperature difference across the entire field reached 1.6°C. Consequently, this temperature gradient would be a significant concern throughout the entire fuel cell stack. For further research on temperature gradients in fuel cell temperature fields, refer to [23,34]. The primary focus of this study is on the impact of air-assisted heating during cold start processes, with particular attention given to the temperature distribution within the cathode CL.
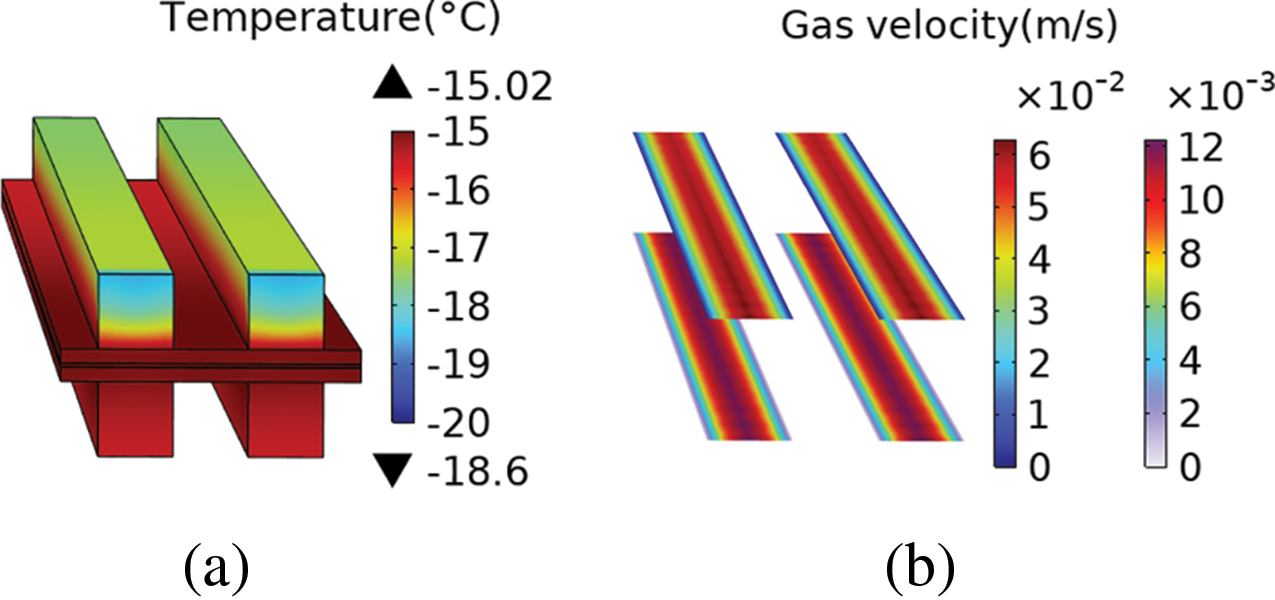
Figure 6: (a) Temperature difference in the temperature field; (b) The inlet flow rates of the anode and cathode differ by an order of magnitude
Fig. 7 illustrates the temperature distribution across the CL, with Fig. 7a depicting the scenario at the 20th second and Fig. 7b at the 60th second. In the figure, the upward-pointing triangle above the legend represents the maximum value in the temperature field, and the downward-pointing triangle below the legend denotes the minimum value. It is observed that at the 20th second, the temperature difference across the CL is 0.65°C, which increases to 1.36°C by the 60-s mark. The side with higher temperatures corresponds to the air inlet side, where the oxygen concentration is elevated, leading to increased heat generation from the ORR reaction.
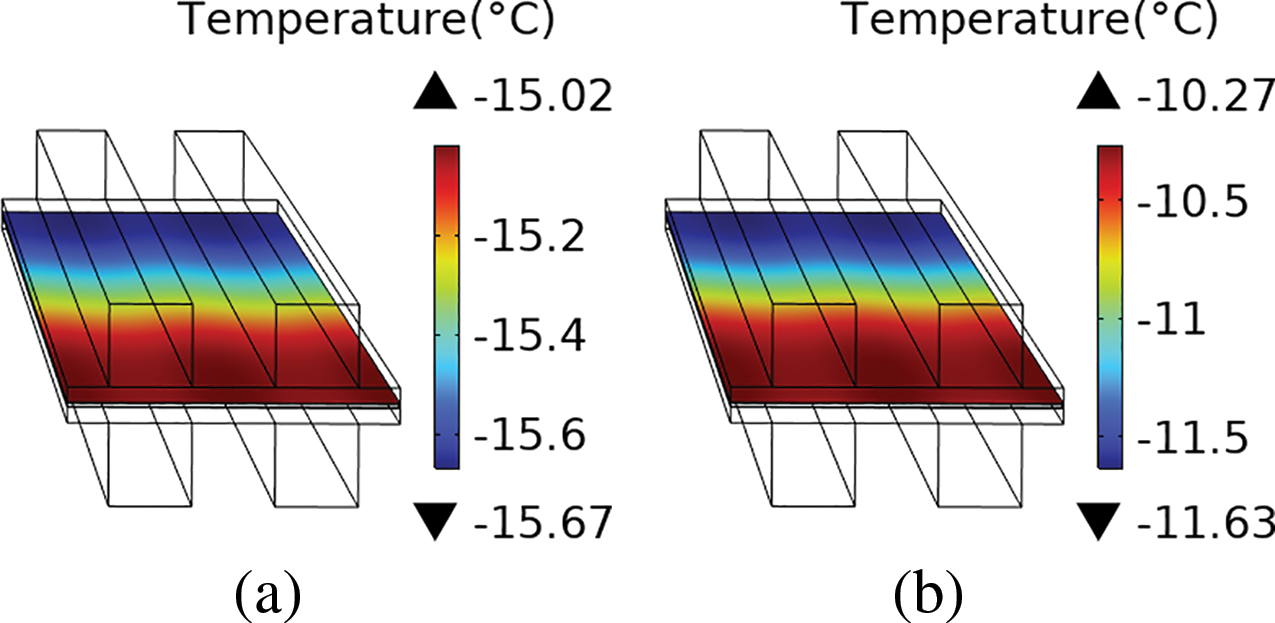
Figure 7: (a) The temperature distribution in the CL layer at the 20th second; (b) The temperature distribution in the CL layer at the 60th second
In subsequent analyses, the successful cold start of the fuel cell is evaluated based on the average temperature of the cathode CL. A successful cold start is defined as when the average temperature of the CL exceeds 0°C and the volume fraction of ice remains below 100%. The effects of temperature gradients are disregarded in this evaluation. Taking the −20°C startup data as an example, the temperature and ice fraction distribution at the time of failure are presented in Fig. 8. It shows that the ice fraction at the interface between the gas channels and the porous medium is lower than in other regions.
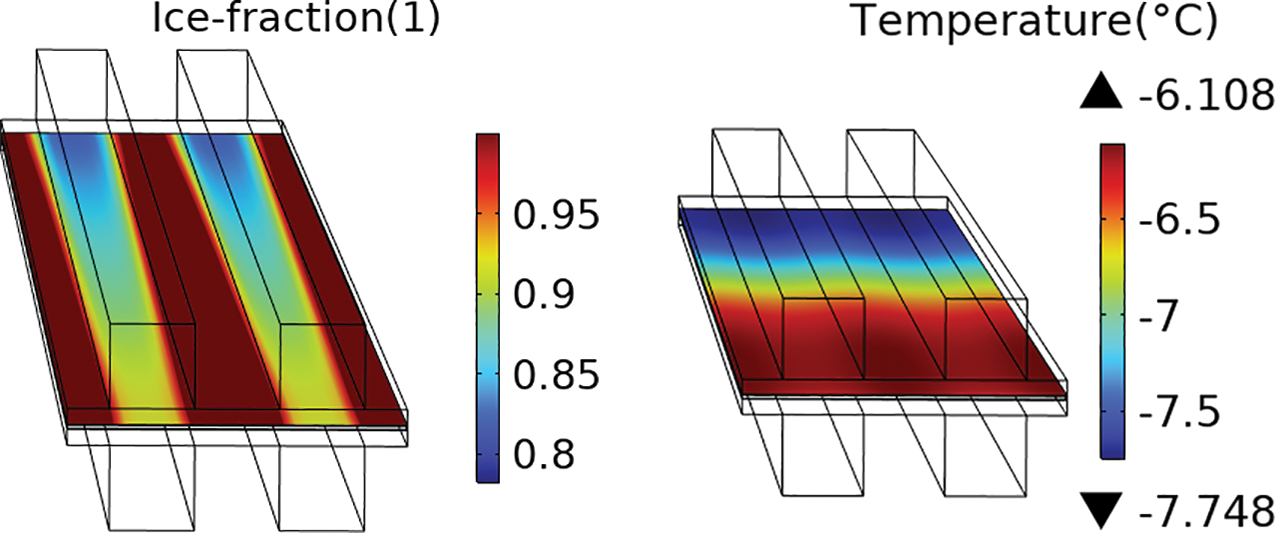
Figure 8: The temperature and ice fraction distribution at the time of failure
Based on the criteria mentioned above, a parameter sweep of the startup temperature using the model reveals that −13°C is the minimum temperature at which the fuel cell can successfully start under this current startup strategy.
This subsection verifies the accuracy of a transient, non-isothermal, 3D hydrogen fuel cell model. Using this model, temperature field data and ice fraction data during the cold-start process can be calculated. In the next subsection, multiple cases will be set according to the air-assisted heating strategy, and the above-mentioned model will be used for simulation, with a discussion on the simulation data to follow.
3.2 Air-Heating Assisted Cold Start
There are two strategies for air-assisted cold start: the first involves heating the air to bring the fuel cell temperature above −13°C, allowing the fuel cell to start independently. The second strategy begins the startup process when the temperature is below −13°C and uses air-assisted heating to lower the minimum startup temperature of the fuel cell. This study adopts the second strategy and conducts simulation calculations using four heating schemes. The configuration of these heating schemes and the corresponding simulation results are presented in Table 6. During the simulations, stopping criteria are established. The simulation stops if either of the following conditions is met: (1) the temperature reaches or exceeds 0°C, or (2) the ice fraction reaches 100%. The H2 is delivered from the tank to the anode of the fuel cell through an uninsulated hose. Given the lack of thermal insulation in the hose and the relatively low mass flow rate of hydrogen, it is assumed in the simulation that the temperature of the hydrogen entering the fuel cell equals the ambient temperature.
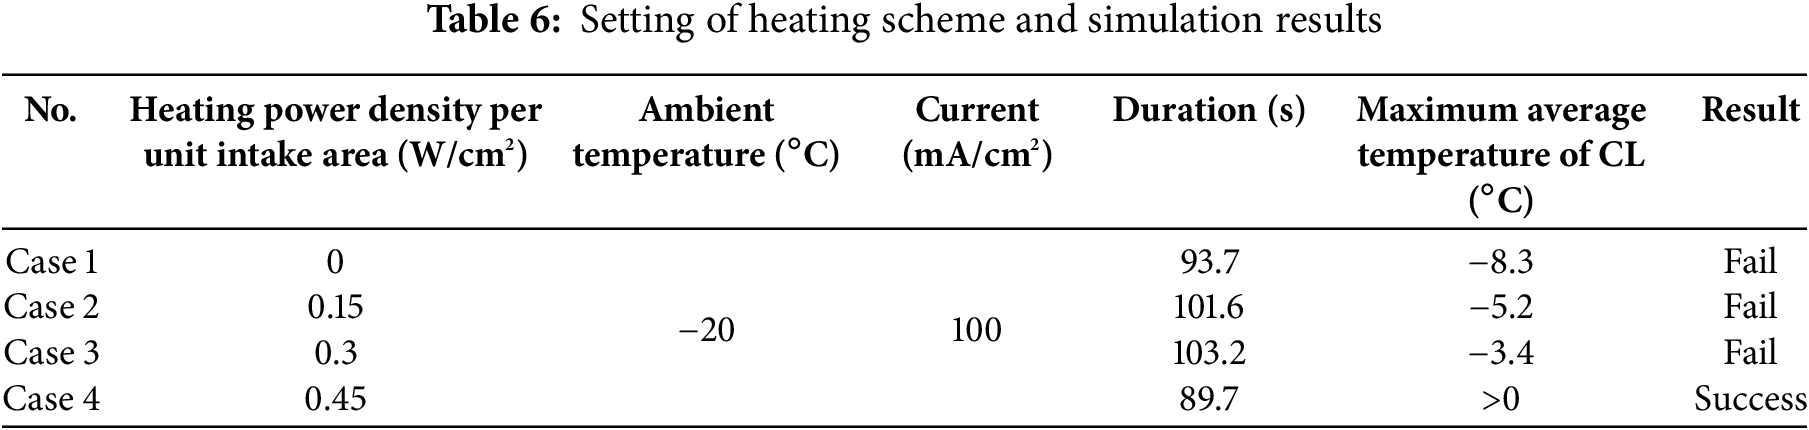
The temperature distribution of Case 1 and Case 3 at the 20th second is shown in Fig. 9.
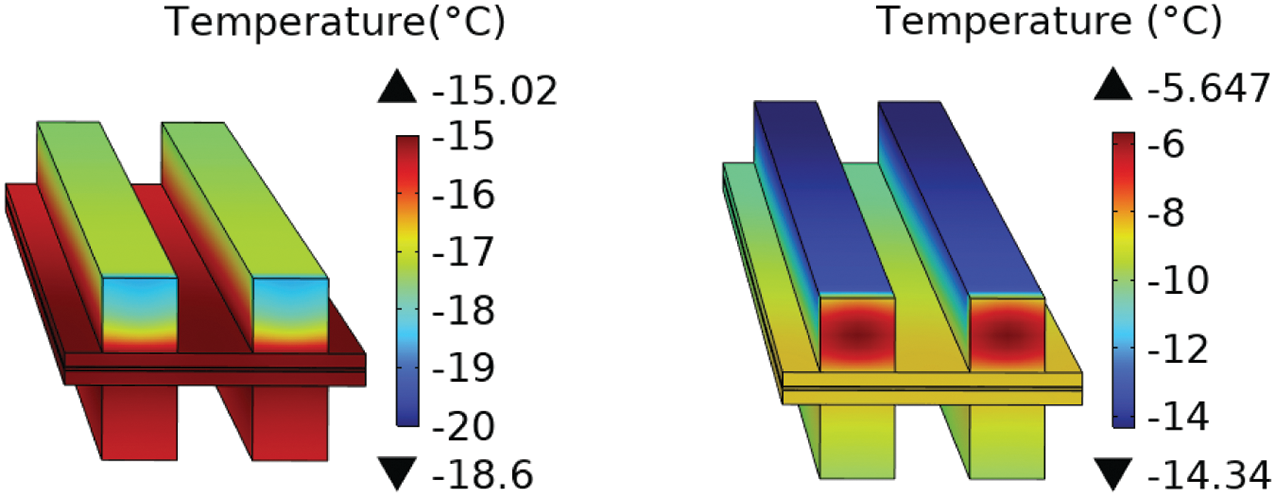
Figure 9: Comparative analysis of temperature field distributions: Case 1 (left) and Case 3 (right)
Fig. 9 illustrates that the intake air temperature increases after heating. In Case 1, the temperature is highest near the GDL at the air inlet, while in Case 3, the middle part of the air inlet has the highest temperature. Across the entire simulation domain, the temperatures in Case 3 are higher than those in Case 1.
It is important to note that the temperature at the cathode air outlet is higher than the ambient temperature. This indicates that under the current flow rate, the set heating power is not entirely utilized for heating the PEMFC itself. To further elucidate this point, screenshots of the cathode air outlet temperatures at the 20-s time point for all schemes have been included in Fig. 10. For ease of comparison, a consistent color scale is used for different schemes in Fig. 10. It can be observed that the temperature distribution trends at the cathode air outlet are consistent across all schemes.
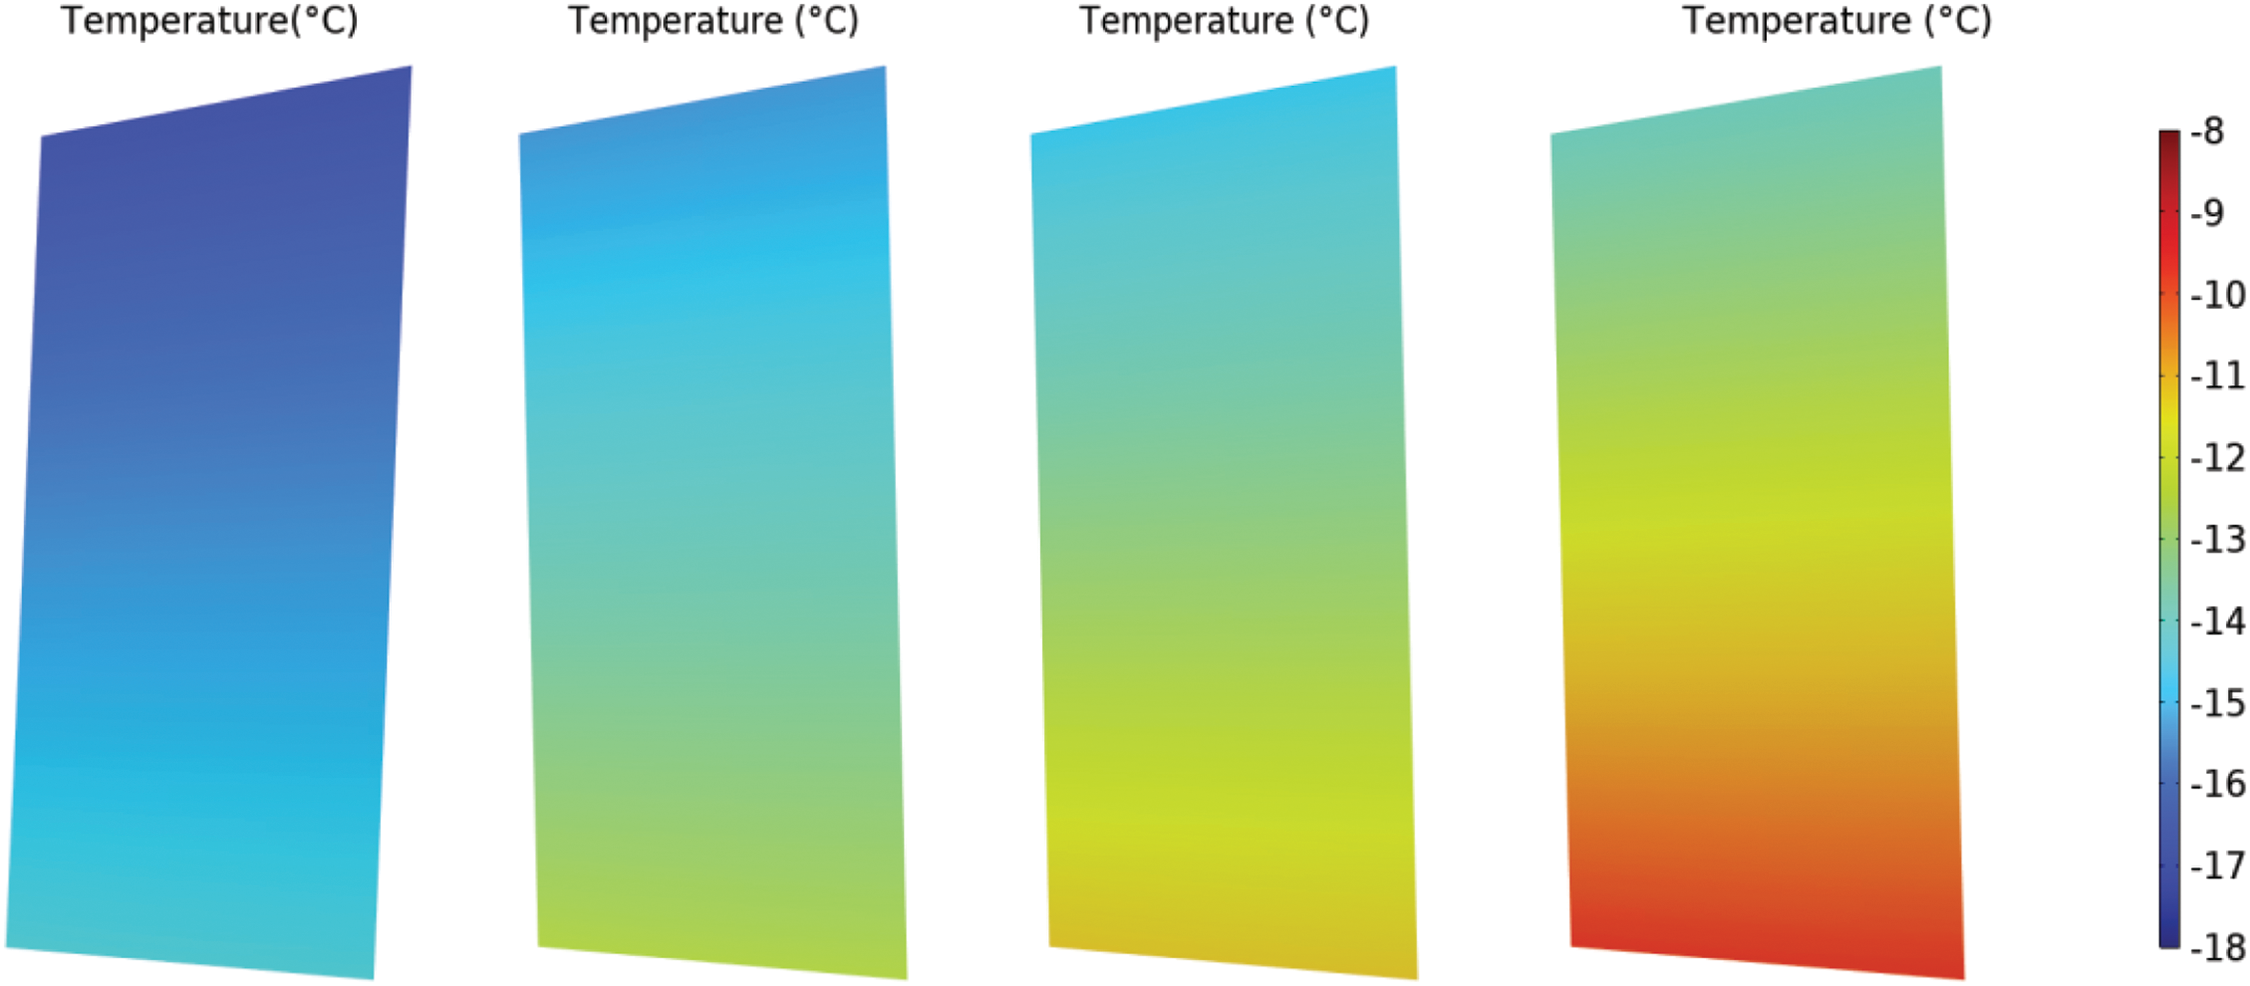
Figure 10: Interface temperature of the cathode air outlet. From left to right, there are cases 1 to 4
As discussed previously, the success of the start-up is evaluated based on the average temperature of the CL. The time-dependent variation curve of the average temperature of the CL is shown in Fig. 11.
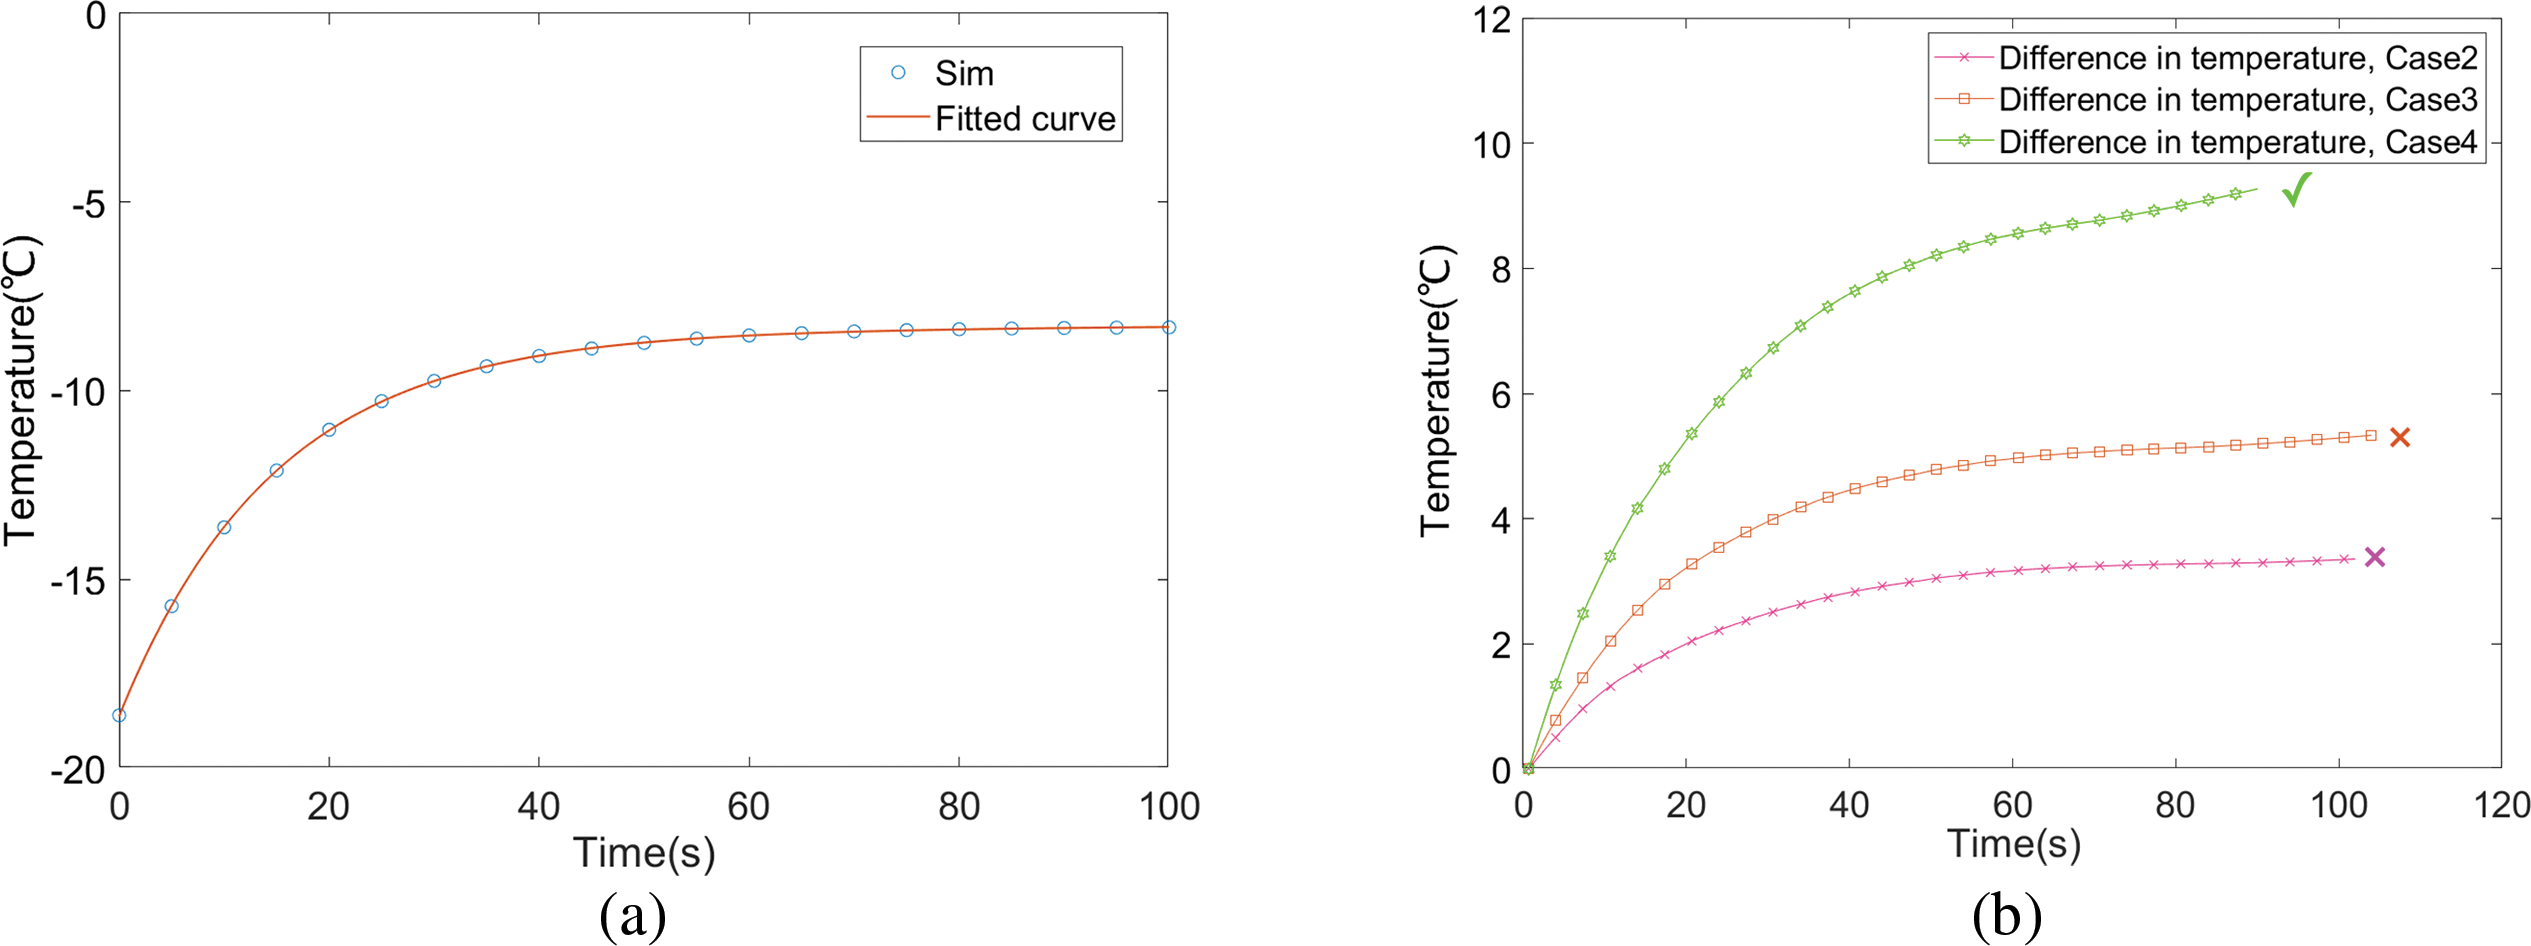
Figure 11: (a) Temperature curve and fitting curve of Case 1; (b) Temperature difference curves of three air-heating cases and no air-heating case
The temperature curve obtained from Case 1 simulation was fitted to derive Eq. (20). As shown in Figs. 11a, a two-term exponential fit accurately represents the temperature (for temperatures below 0°C) as a function of time. It is important to note that during the fitting process, the temperature drop at the final moment was not included.
Fig. 11b illustrates that both Case 2 and Case 3 ultimately fail to start up. However, Case 3, with a higher temperature, sustains operation for a longer duration compared to Case 2. This observation indicates that the positive effects of increased saturation vapor pressure and decreased viscosity coefficient at higher temperatures, which reduce the ice fraction, outweigh the negative impact of enhanced ORR activity at elevated temperatures.
To tackle the low-temperature cold-start problem of cathode-open PEMFC as primary power sources in small and medium-sized UAVs, this study develops a transient, non-isothermal, 3D cathode-open PEMFC model that incorporates gas-ice phase changes. The simulation results are compared with experimental cold-start voltage data measured at −20°C. While preserving the model’s precision, the study investigates the effectiveness of heating the cathode inlet air at four different power levels and its impact on improving cold start performance. Results show that without cathode inlet air heating, the highest temperature is observed in the CL, where electrochemical reactions occur. The temperature on the anode side is higher than that on the cathode side. This finding demonstrates that cathode inlet air heating constitutes a highly targeted active thermal management strategy. The fuel cell achieves self-startup capability as low as −13°C at 100 mA/cm2 without requiring air-assisted heating. At an ambient temperature as low as −20°C, a successful startup can be achieved by applying a heating power density of 0.45 W/cm2. During the cold-start process, the temporal evolution of the average CL temperature in the subzero temperature regime can be effectively characterized by a sum of two exponential functions.
In this study, only one constant current density was used in the simulation. The ambient temperature of the fuel cell was kept constant in the simulations. The analysis of heat exchange and coupled temperature fields among PEMFC, lithium-ion battery, and air was lacking. Addressing these limitations will be the focus of the next phase of research.
Acknowledgement: Not applicable.
Funding Statement: This research was funded by Zhejiang Province Spearhead and Leading Goose Research and Development Key Program, grant number 2023C01239.
Author Contributions: Conceptualization, Wei Shi; methodology, Wei Shi; software, Wei Shi; validation, Wei Li; formal analysis, Wei Shi; investigation, Kai Meng; resources, Qingsheng Liu; data curation, Wei Li; writing—original draft preparation, Wei Shi; writing—review and editing, Wei Shi; visualization, Wei Li; supervision, Shusheng Xiong; project administration, Shusheng Xiong; funding acquisition, Shusheng Xiong. All authors reviewed the results and approved the final version of the manuscript.
Availability of Data and Materials: Not applicable.
Ethics Approval: Not applicable.
Conflicts of Interest: The authors declare no conflicts of interest to report regarding the present study.
Nomenclature
| a | Water activity |
| C | Molar concentration, mol/m3 |
| CL | Catalytic layer |
| Cp | Specific heat, J/(kg·K) |
| Di | Mass diffusivity of species i, m2/s |
| F | Faraday constant, 96487 C/mol |
| GC | Gas channels |
| GDL | Gas-diffusion layer |
| H2 | Hydrogen |
| h | Convective heat transfer coefficient, W/(m2·K) |
| H2O | Water |
| I | Operating current density, mA/cm2 |
| j | Transfer current density, mA/cm3 |
| k | Thermal conductivity, W/(m·K) |
| K | Hydraulic permeability, m2 |
| M | Molecular weight, kg/mol |
| mf | Mass flow rate, kg/s |
| n | Number of electrons in electrochemical reaction |
| nd | Electro-osmotic drag coefficient |
| O2 | Oxygen |
| ORR | Oxygen reduction reaction |
| P | Pressure, Pa; power, W |
| PEMFC | Proton exchange membrane fuel cells |
| R | Universal gas constant, 8.314 J/(mol·K) |
| s | Stoichiometry coefficient in electrochemical reaction or ice fraction |
| S | Source term in transport equation |
| T | Temperature, K |
| t | Time, s |
| Fluid velocity and superficial velocity in porous medium, m/s | |
| UAV | Unmanned aerial vehicles |
| Uo | Thermodynamic equilibrium potential, V |
| w | Mass fraction, % |
| Greek Symbols | |
| α | Transfer coefficient |
| ε | Volume fraction of gaseous phase in porous region |
| εI | Volume fraction of ionomer phase in CL |
| λ | Membrane water content |
| ϕ | Potential equation |
| η | Overpotential, V |
| ρ | Density, kg/m3 |
| σ | Electronic conductivity, S/m |
| τ | Viscous shear stress, N/m2 |
| κ | Ionic conductivity, S/m |
| ξ | Stoichiometry flow ratio |
| Superscripts | |
| eff | Effective value in porous region |
| g | Gas |
| mem | Membrane |
| ref | Reference value |
| sat | Saturation value |
| Subscripts | |
| a | Anode |
| amb | Ambient |
| c | Cathode |
| desub | Desublimation |
| e | Electrolyte phase |
| g | Gas |
| i | Species index |
| in | Channel inlet |
| m | Mass equation |
| mem | Membrane |
| s | Solid, electron phase |
| sg | Solid-vapor phase transition |
| sub | Sublimation |
| u | Momentum equation |
References
1. Centracchio F, Rossetti M, Iemma U. Approach to the weight estimation in the conceptual design of hybrid-electric-powered unconventional regional aircraft. J Adv Transp. 2018;2018(8):6320197. doi:10.1155/2018/6320197. [Google Scholar] [CrossRef]
2. Boukoberine MN, Zhou Z, Benbouzid M. Power supply architectures for drones—a review. In: IECON 2019—45th Annual Conference of the IEEE Industrial Electronics Society; 2019 Oct 14–17; Lisbon, Portugal. doi:10.1109/IECON.2019.8927702. [Google Scholar] [CrossRef]
3. Andrew JK, András S, James PS. Small unmanned fixed-wing aircraft design. Beijing, China: National Defense Industry Press; 2023. [Google Scholar]
4. Schäfer AW, Barrett SRH, Doyme K, Dray LM, Gnadt AR, Self R, et al. Technological, economic and environmental prospects of all-electric aircraft. Nat Energy. 2019;4(2):160–6. doi:10.1038/s41560-018-0294-x. [Google Scholar] [CrossRef]
5. Yezeguelian A, Isikveren AT. Methods to improve UAV performance using hybrid-electric architectures. Aircr Eng Aerosp Technol. 2020;92(5):685–700. doi:10.1108/aeat-11-2019-0227. [Google Scholar] [CrossRef]
6. Pan ZF, An L, Wen CY. Recent advances in fuel cells based propulsion systems for unmanned aerial vehicles. Appl Energy. 2019;240:473–85. doi:10.1016/j.apenergy.2019.02.079. [Google Scholar] [CrossRef]
7. Boukoberine MN, Zhou Z, Benbouzid M. A critical review on unmanned aerial vehicles power supply and energy management: solutions, strategies, and prospects. Appl Energy. 2019;255(6):113823. doi:10.1016/j.apenergy.2019.113823. [Google Scholar] [CrossRef]
8. Rice CA. Review—subzero automotive fuel cells: water fill tests vs cold-starts. J Electrochem Soc. 2021;168(4):044513. doi:10.1149/1945-7111/abf4ec. [Google Scholar] [CrossRef]
9. Liu J, Chen H, Zhang T. Analysis of cold start characteristics in a PEMFC stack with different current loading modes. Int J Hydrogen Energy. 2024;51:1456–76. doi:10.1016/j.ijhydene.2023.06.303. [Google Scholar] [CrossRef]
10. Sun W, Li M, Li G, Sun K, Bai S. Research on ECMS based on segmented path braking energy recovery in a fuel cell vehicle. Energy Eng. 2024;121(1):95–110. doi:10.32604/ee.2023.042096. [Google Scholar] [CrossRef]
11. Li Y, Xu S, Yang Z, Li Y. Experiment and simulation study on cold start of automotive PEMFC. In: 2011 International Conference on Electric Information and Control Engineering; 2011 Apr 15–17; Wuhan, China. doi:10.1109/ICEICE.2011.5776891. [Google Scholar] [CrossRef]
12. Liang J, Fan L, Miao T, Xie X, Wang Z, Chen X, et al. Cold start mode classification based on the water state for proton exchange membrane fuel cells. J Mater Chem A. 2022;10(38):20254–64. doi:10.1039/d2ta05175c. [Google Scholar] [CrossRef]
13. Rajbongshi BM, Shaneeth M, Verma A. Investigation on sub-zero start-up of polymer electrolyte membrane fuel cell using un-assisted cold start strategy. Int J Hydrogen Energy. 2020;45(58):34048–57. doi:10.1016/j.ijhydene.2020.09.075. [Google Scholar] [CrossRef]
14. Xiong S, Wu Z, Jiang Q, Zhao J, Wang T, Deng J, et al. Research on cold start of proton-exchange membrane fuel cells based on model predictive control. Membranes. 2023;13(2):184. doi:10.3390/membranes13020184. [Google Scholar] [PubMed] [CrossRef]
15. Niu H, Ji C, Wang S, Shi M, Zhang H, Liang C. Analysis of the cold start behavior of a polymer electrolyte membrane fuel cell in constant power start-up mode. Int J Energy Res. 2021;45(13):19245–64. doi:10.1002/er.7025. [Google Scholar] [CrossRef]
16. Guo Q, Luo Y, Jiao K. Modeling of assisted cold start processes with anode catalytic hydrogen–oxygen reaction in proton exchange membrane fuel cell. Int J Hydrogen Energy. 2013;38(2):1004–15. doi:10.1016/j.ijhydene.2012.10.067. [Google Scholar] [CrossRef]
17. Knorr F, Sanchez DG, Schirmer J, Gazdzicki P, Friedrich KA. Methanol as antifreeze agent for cold start of automotive polymer electrolyte membrane fuel cells. Appl Energy. 2019;238:1–10. doi:10.1016/j.apenergy.2019.01.036. [Google Scholar] [CrossRef]
18. Lei L, He P, He P, Tao WQ. A comparative study: the effect of current loading modes on the cold start-up process of PEMFC stack. Energy Convers Manag. 2022;251(5):114991. doi:10.1016/j.enconman.2021.114991. [Google Scholar] [CrossRef]
19. Montaner Ríos G, Schirmer J, Gentner C, Kallo J. Efficient thermal management strategies for cold starts of a proton exchange membrane fuel cell system. Appl Energy. 2020;279(7):115813. doi:10.1016/j.apenergy.2020.115813. [Google Scholar] [CrossRef]
20. Kim S, Jeong H, Lee H. Cold-start performance investigation of fuel cell electric vehicles with heat pump-assisted thermal management systems. Energy. 2021;232:121001. doi:10.1016/j.energy.2021.121001. [Google Scholar] [CrossRef]
21. Luo M, Zhang J, Zhang C, Chin CS, Ran H, Fan M, et al. Cold start investigation of fuel cell vehicles with coolant preheating strategy. Appl Therm Eng. 2022;201(2):117816. doi:10.1016/j.applthermaleng.2021.117816. [Google Scholar] [CrossRef]
22. Jahnke T, Futter GA, Baricci A, Rabissi C, Casalegno A. Physical modeling of catalyst degradation in low temperature fuel cells: platinum oxidation, dissolution, particle growth and platinum band formation. J Electrochem Soc. 2020;167(1):013523. doi:10.1149/2.0232001jes. [Google Scholar] [CrossRef]
23. Luo Y, Jiao K. Cold start of proton exchange membrane fuel cell. Prog Energy Combust Sci. 2018;64(1):29–61. doi:10.1016/j.pecs.2017.10.003. [Google Scholar] [CrossRef]
24. Ge S, Wang CY. In situ imaging of liquid water and ice formation in an operating PEFC during cold start. Electrochem Solid-State Lett. 2006;9(11):A499. doi:10.1149/1.2337860. [Google Scholar] [CrossRef]
25. Gwak G, Ko J, Ju H. Numerical investigation of cold-start behavior of polymer-electrolyte fuel-cells from subzero to normal operating temperatures—effects of cell boundary and operating conditions. Int J Hydrogen Energy. 2014;39(36):21927–37. doi:10.1016/j.ijhydene.2014.03.143. [Google Scholar] [CrossRef]
26. Ko J, Ju H. Comparison of numerical simulation results and experimental data during cold-start of polymer electrolyte fuel cells. Appl Energy. 2012;94(3):364–74. doi:10.1016/j.apenergy.2012.02.007. [Google Scholar] [CrossRef]
27. Mao L, Wang CY, Tabuchi Y. A multiphase model for cold start of polymer electrolyte fuel cells. J Electrochem Soc. 2007;154(3):B341. doi:10.1149/1.2430651. [Google Scholar] [CrossRef]
28. Chippar P, O K, Kang K, Ju H. A numerical investigation of the effects of GDL compression and intrusion in polymer electrolyte fuel cells (PEFCs). Int J Hydrogen Energy. 2012;37(7):6326–38. doi:10.1016/j.ijhydene.2011.04.154. [Google Scholar] [CrossRef]
29. Wang Y, Wang CY. Dynamics of polymer electrolyte fuel cells undergoing load changes. Electrochim Acta. 2006;51(19):3924–33. doi:10.1016/j.electacta.2005.11.005. [Google Scholar] [CrossRef]
30. Li W, Shi W, Xiong S, Huang H. Voltage-feedback internal heating strategy of lithium-ion battery in an extremely cold environment implemented with drive system of electric vehicle. IEEE Trans Transp Electrif. 2024;10(3):6049–63. doi:10.1109/TTE.2023.3348104. [Google Scholar] [CrossRef]
31. Gertel VS, Kharitonov SA, Udovichenko AV. Internal heating of the lithium-ion batteries based on alternating pulse current and methods of its implementation. In: 2024 IEEE 3rd International Conference on Problems of Informatics, Electronics and Radio Engineering (PIERE); 2024 Nov 15–17; Novosibirsk, Russia. doi:10.1109/PIERE62470.2024.10804965. [Google Scholar] [CrossRef]
32. Futter GA. Physical modeling of PEMFC performance and chemical membrane degradation [dissertation]. Baden-Württemberg, Germany: Universität Stuttgart; 2019. [Google Scholar]
33. Zhu M, Xie X, Wu K, Najmi AUH, Jiao K. Experimental investigation of the effect of membrane water content on PEM fuel cell cold start. Energy Proc. 2019;158:1724–9. doi:10.1016/j.egypro.2019.01.401. [Google Scholar] [CrossRef]
34. Wang C, Zhan Z, Wan X, Lu X, Xiao Z, Zhang H, et al. Phasic icing phenomena of part single cells during the successful cold start processes of PEMFC stacks. Int J Hydrogen Energy. 2024;50:262–78. doi:10.1016/j.ijhydene.2023.08.117. [Google Scholar] [CrossRef]
Cite This Article
 Copyright © 2025 The Author(s). Published by Tech Science Press.
This work is licensed under a Creative Commons Attribution 4.0 International License , which permits unrestricted use, distribution, and reproduction in any medium, provided the original work is properly cited.
 Downloads
 Citation Tools