
 Submit a Paper
 Propose a Special lssue
 Open Access
ARTICLE

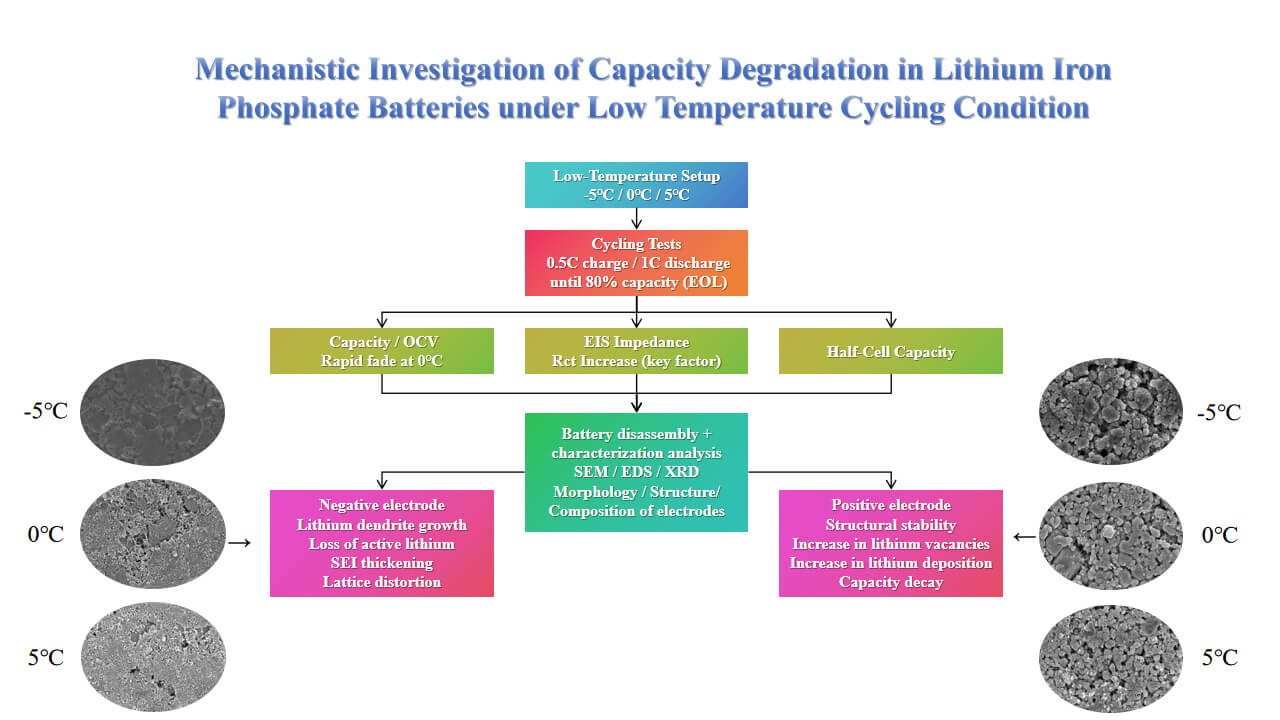
Mechanistic Investigation of Capacity Degradation in Lithium Iron Phosphate Batteries under Low Temperature Cycling Conditions
School of Civil Engineering and Transportation, Beihua University, Jilin, 132000, China
* Corresponding Author: Shuqing Guo. Email:
Energy Engineering 2025, 122(9), 3625-3646. https://doi.org/10.32604/ee.2025.067159
Received 26 April 2025; Accepted 03 July 2025; Issue published 26 August 2025
 View Full Text
 Download PDF
Abstract
Since lithium-ion batteries have been put into use, the recession of work cycle efficiency at low temperatures has received widespread attention. In this paper, we investigated the effect of low temperature (−5°C, 0°C, 5°C) environments on the performance of lithium-ion batteries, which are well-known for their excellent discharge performance, cycle life, and safety. However, lithium-ion batteries exhibit significant capacity degradation at low temperatures, especially at 0°C, losing availability after only 10 cycles. Therefore, we conducted cycle degradation tests at 1C discharge and 100% charge-discharge conditions. In this paper, we analyzed the surface morphology, structure, and elemental composition of the positive and negative electrodes before and after the aging process by disassembling them into half-cells and using three physical characterization techniques: scanning electron microscopy (SEM), energy dispersive spectroscopy (EDS), and X-ray diffraction (XRD). Our study identifies the temperature range for accelerated aging, which provides guidance for the optimal use of lithium-ion batteries in low temperature environments, thus contributing to the rational utilization and enhanced the performance of lithium-ion batteries at low temperatures.Graphic Abstract
Keywords
Lithium iron phosphate (hereinafter all referred to as LFP) batteries are commonly used in electric vehicles due to their high energy density, long cycle life, low cost, and the abundance of raw materials [1]. Low temperature increases the internal resistance and polarization of the battery and reduce the state of charge transfer to the electrodes, leading to a decrease in capacity and degradation during continuous cycling. Low temperature also alters the migration behavior of lithium ions in the battery components, which increases the impedance of the battery [2]. Currently, many studies have been conducted on batteries at low temperatures [3–5]. In regions with extreme cold climates (e.g., northern China), low temperatures accelerate the degradation of LFP batteries, limiting the widespread use of electric vehicles [6,7]. Therefore, it is crucial to study the performance of batteries at low temperatures and extend their service life for advancing electric vehicle technology. The low temperature performance of power batteries is a key indicator for vehicle evaluation. Although LFP batteries perform poorly at low temperatures, their inherent safety makes them suitable for experimental testing. Many researchers have investigated the rapid aging and cycling performance of LFP batteries at low temperatures. Zhang et al. [8] investigated the heat generation process of lithium-ion batteries and found that ambient temperature significantly affects their performance. Extreme temperatures, both high and low, reduce battery efficiency and may trigger thermal runaway in severe cases. Worku et al. [9] showed that low temperatures reduce ionic conductivity and slow desolvation, making it difficult to improve the electrochemical performance of lithium-ion batteries. To optimize the low temperature performance of Li-ion batteries, an integrated electrode design strategy using a solid polymer electrolyte (SPE), a highly conductive anode, a modified commercial cathode, and lithium-rich separator materials has been used. Senol et al. [10] observed that Li-ion batteries in electric vehicles undergo severe degradation at low temperatures. The depressed ionic conductivity and sluggish charge transfer kinetics at low temperatures lead to threefold consequences: (1) increased internal resistance, (2) reduced battery capacity, and (3) ultimately shortened driving range of electric vehicles. Rauhala et al. [11] found that cells were disassembled following cycling at low temperatures, revealing no significant failures in the LiFePO4 cathode, thereby reinforcing its reputation for structural integrity. Nevertheless, the LiFePO4 cathode continues to constrain the overall electrochemical performance of the battery under low-temperature conditions. A primary factor contributing to this limitation is the inherently low electronic and ionic conductivity of LiFePO4, which is exacerbated at lower temperatures. Consequently, the diffusion of lithium ions within the bulk LiFePO4 is significantly slowed. Kong et al. [12] used a reduced-order model and an abuse model to show that irreversible heat is dominant at higher discharge rates and vice-versa, with heat generation increasing at lower temperatures (258.15 and 263.15 K) but failed to show cells’ controlling mechanism that is influencing the change. Wang et al. [13] investigated the battery at different temperatures of −5°C, 10°C, 25°C and 40°C, and concluded that the highest percentage of discharge capacity was achieved from the open-circuit voltage to the initial voltage stage of the plateau phase at an ambient temperature of −20°C, which provides a reference for the modeling and design of control strategies for lithium-ion power batteries in electric vehicle energy storage systems. Zeng [14] used SEM (GAIA 3 XMN) and electrochemical impedance spectroscopy (EIS) (frequency range: 0.01 to 10 kHz) to analyze the sample morphology and impedance curves. The test curves, as well as the constant current charge-discharge test curves, exhibited perfect symmetry and material reversibility. Ma et al. [15] optimized the electrolyte for LFP graphite batteries and achieved 74.3% capacity retention at 0°C, along with significantly improved low temperature discharge capacity and voltage plateau. Siani et al. [16] proposed two health indicators independent of charging cycles and validated the method using a CC-CV (Constant Current-Constant-Voltage) charging protocol, achieving a maximum estimation error of <2%. Du et al. [17] observed 8.7% capacity retention after cycling at 5°C. In addition, the charging and discharging capacity of the battery decreased significantly. Post-mortem analysis revealed the formation of lithium plating between the Solid Electrolyte Interface (SEI) layer and the anode surface. Mostafa et al. [18] performed XRD analysis on aluminum alloy samples using a novel method to estimate microstructural parameters. Feinauer et al. [19] investigated lithium deposition at low temperatures (0°C and 10°C) and found that battery capacity decreased rapidly after cycling. The presence of lithium deposition accelerates battery aging at low temperatures. Cheng et al. [20] discussed how X-ray absorption fine structure spectroscopy (XAFS), small-angle X-ray scattering (SAXS), and XRD reveal the electrochemical reaction processes and mechanisms of Li-ion batteries. Their review summarizes recent advances in XAFS, SAXS, XRD and their combined applications for multiscale battery characterization.
According to domestic and international research, significant progress has been achieved in understanding the low temperature capacity loss of lithium-ion batteries. As indicated by existing studies, the performance of lithium-ion batteries deteriorates significantly in low temperature environments, leading to challenges in charging and discharging. As depicted in Fig. 1, the low temperature induced performance deterioration manifests as vehicle starting becomes difficult, reduced driving range, decreased acceleration performance, shortened battery life and so on.
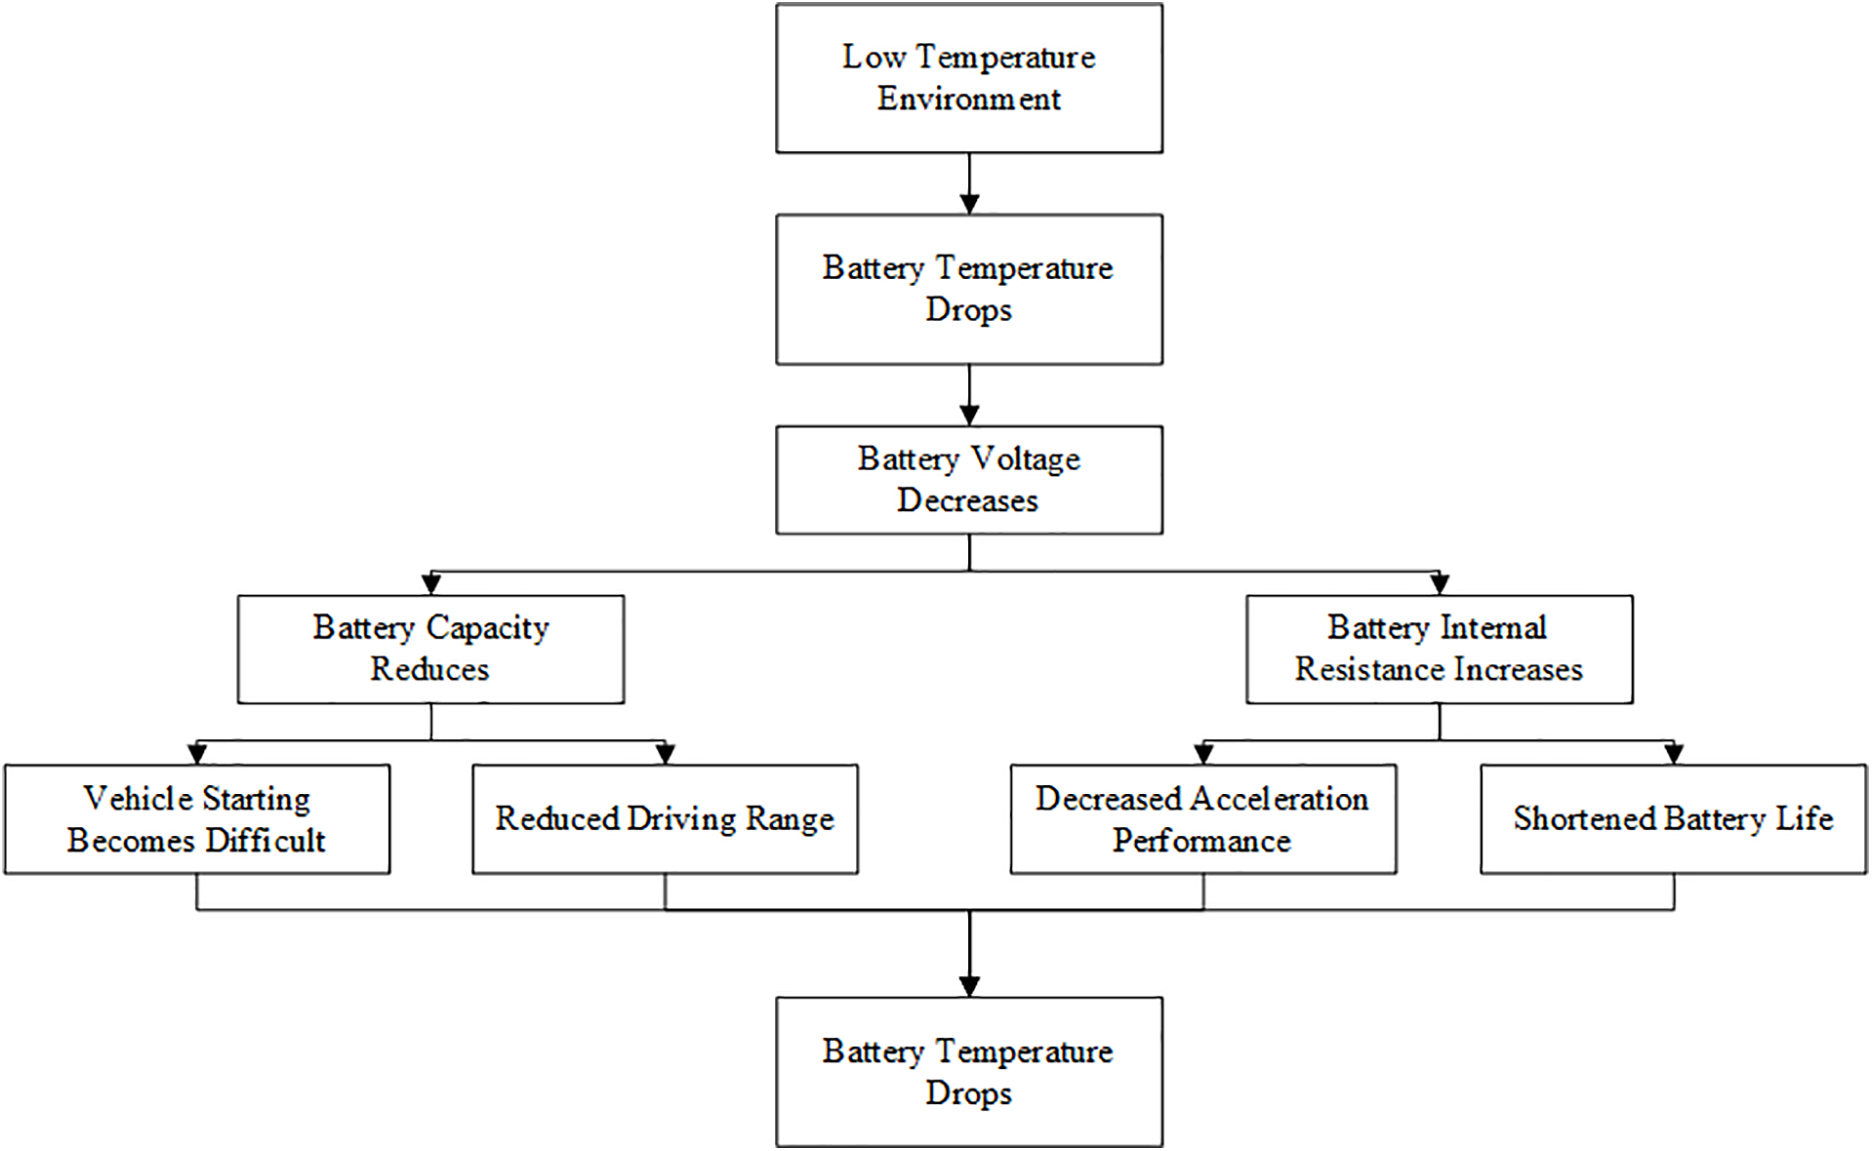
Figure 1: Damage to automotive performance in low temperature environments
Additionally, low temperature exacerbates the severe lithium plating on the anode, where the deposited lithium metal reacts with the electrolyte. This reaction results in the thickening of the SEI, which can trigger internal short circuits, thermal runaway, and other safety hazards, further reducing the battery’s lifespan. In extreme low temperature conditions, phenomena such as electrolyte solidification may occur, preventing lithium ions from shuttling between the cathode and anode. Therefore, enhancing the low temperature performance of lithium-ion batteries is crucial for their application in high-latitude, high-altitude, and ultra low temperature regions. Currently, there are limited studies utilizing XRD for the physical characterization of cathode and anode materials, with most domestic and international research relying on SEM, a more commonly used testing method. However, existing studies have not fully elucidated the structural changes on the surfaces of the cathode and anode through image analysis. In this study, the effects of low temperature environments on battery capacity were investigated under three specific temperature conditions: −5°C, 0°C, and 5°C. After disassembling the batteries into half-cells, empirical studies were conducted to assess the capacity degradation of the cathode and anode. The physical properties of the cathode and anode materials were characterized using SEM, EDS, and XRD. By combining the degradation data from the half-cell tests with the results of the three physical characterization methods, this study analyzes the impact of low temperatures (−5°C, 0°C, and 5°C) on the performance of LFP batteries. The findings aim to reveal the mechanisms and patterns of capacity loss in lithium-ion batteries at low temperatures, providing valuable insights for the design of low temperature batteries.
2 Basic Structure and Reaction Principles of Lithium-Ion Batteries
In the past few years, new energy vehicles have been developing rapidly in China, and the penetration rate of new energy vehicles in some regions has been increasing rapidly, but in certain low temperature regions, the penetration rate of new energy vehicles is very low, and Fig. 2 shows the current penetration rate of new energy vehicles in some regions of China in relation to the local temperature. One of the factors contributing to this is due to the lower temperature, which has a greater impact on the battery. Therefore, the batteries selected in this study are LFP batteries. The negative electrode is primarily composed of graphite or graphite-like carbon materials, with copper foils serving as the current collector [21]. The electrolyte consists of lithium hexafluorophosphate (LiPF6) as the solute and dimethyl carbonate as the solvent. The separator is a polyolefin-based polymer porous membrane. For flexible pouch batteries, the casing material is aluminum-plastic film, while cylindrical batteries employ aluminum or nickel-plated steel shells [22].
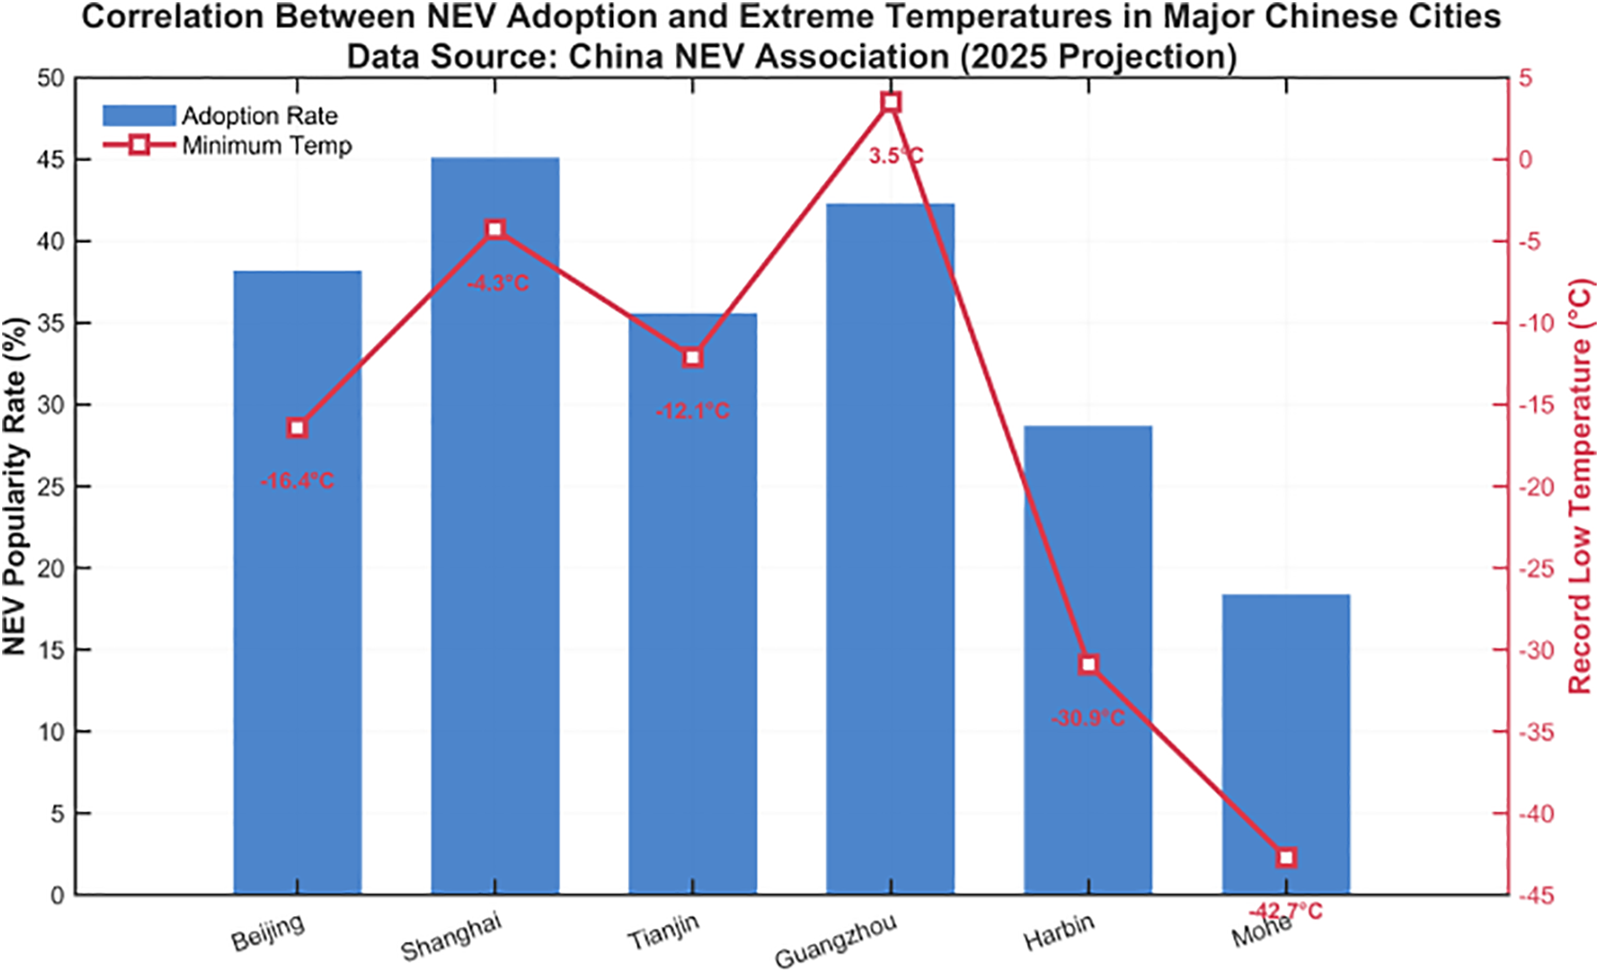
Figure 2: Correlation between new energy vehicles adoption and extreme temperatures in major Chinese cities data source: China new energy vehicles association
In general, at the atomic scale, the charge-discharge dynamics of LFP batteries manifest as a cooperative process comprising three interdependent mechanisms:
(1) Reversible two-phase transition between LFP and FP governed by Li+ extraction/insertion;
(2) Electron transfer mediated by Fe2+/Fe3+ redox couples at the cathode-electrolyte interface;
(3) Li+-e− pair transport across the bulk electrodes and electrolyte, obeying the Nernst-Planck equation under concentration polarization [23]. As shown in Fig. 3, This tripartite interaction establishes thermodynamic spontaneity during discharging and kinetic reversibility during charging, as validated by in situ X-ray absorption spectroscopy.
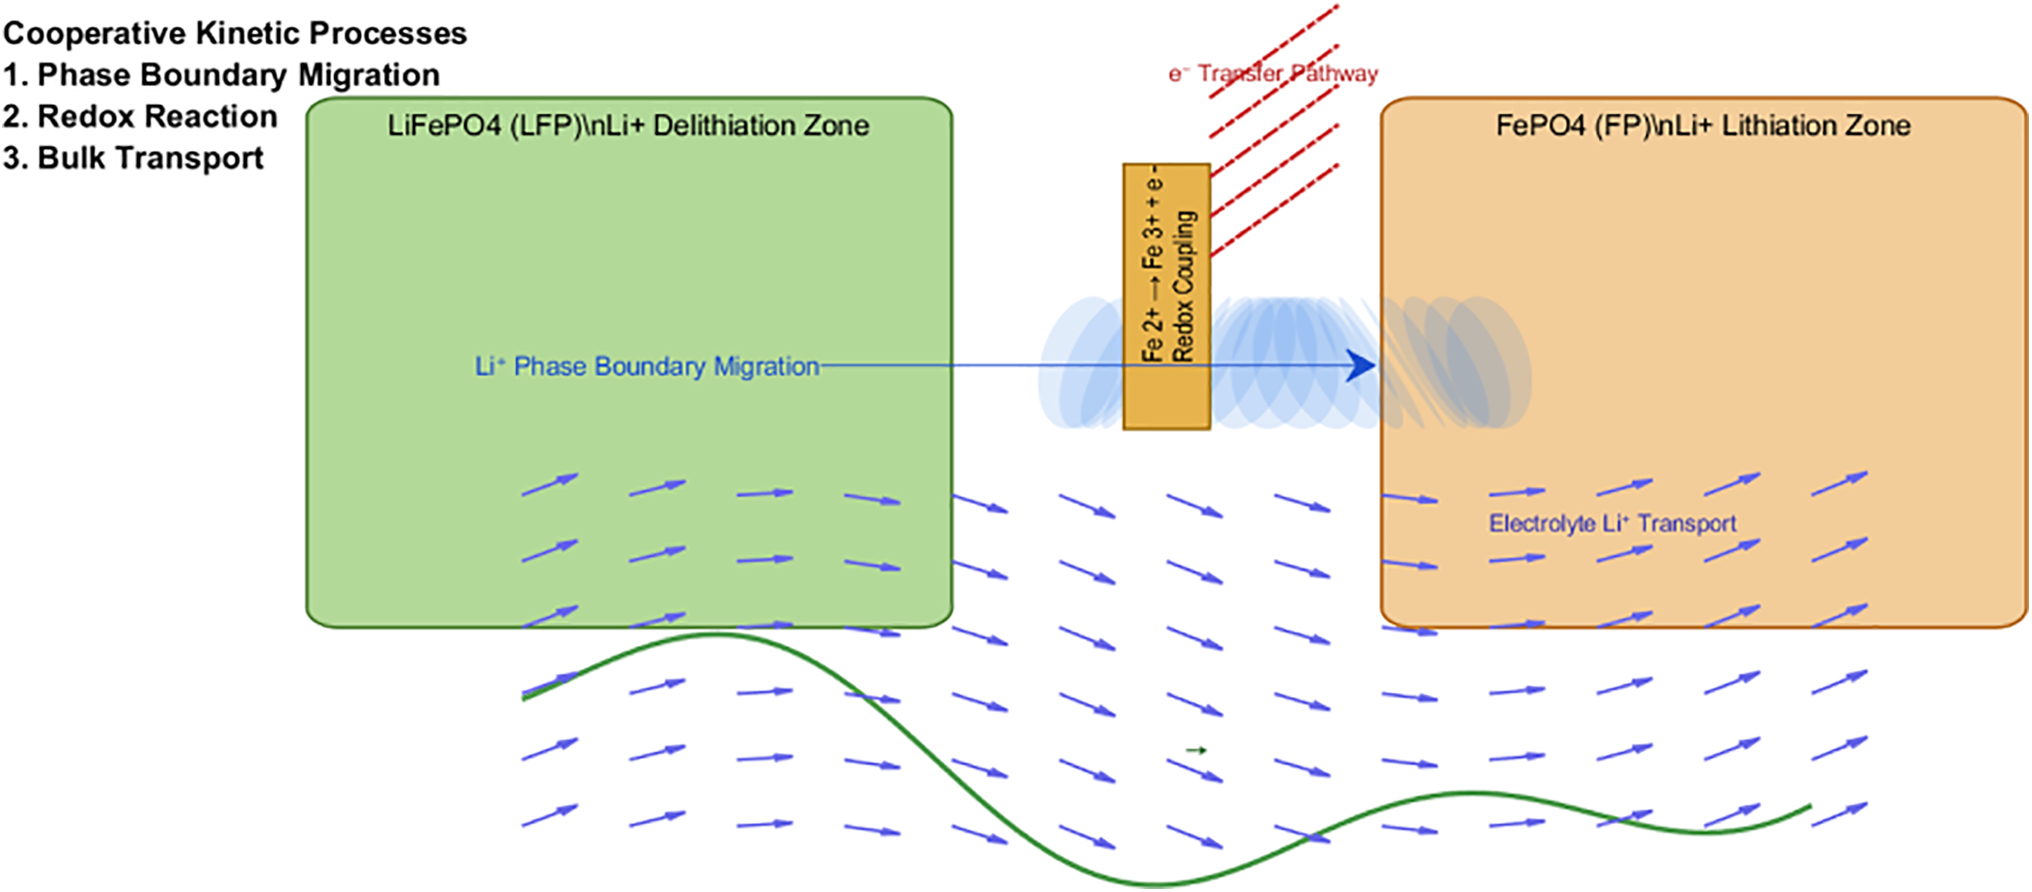
Figure 3: Three interdependent mechanisms for charging and discharging processes
During the charging phase, lithium ions deintercalate from the LFP crystal lattice and migrate toward the anode surface. This electrochemical process [24] can be described by the following reactions:
Charging:
Discharging:
The discharge phase is the reverse of the charging process, governed by the reactions:
The specific flow of the charging and discharging process equation above is shown in Fig. 4, where the black box is the battery casing, and the diagram contains the positive electrode, the negative electrode, the electrolyte, the lithium ions and the electrons.
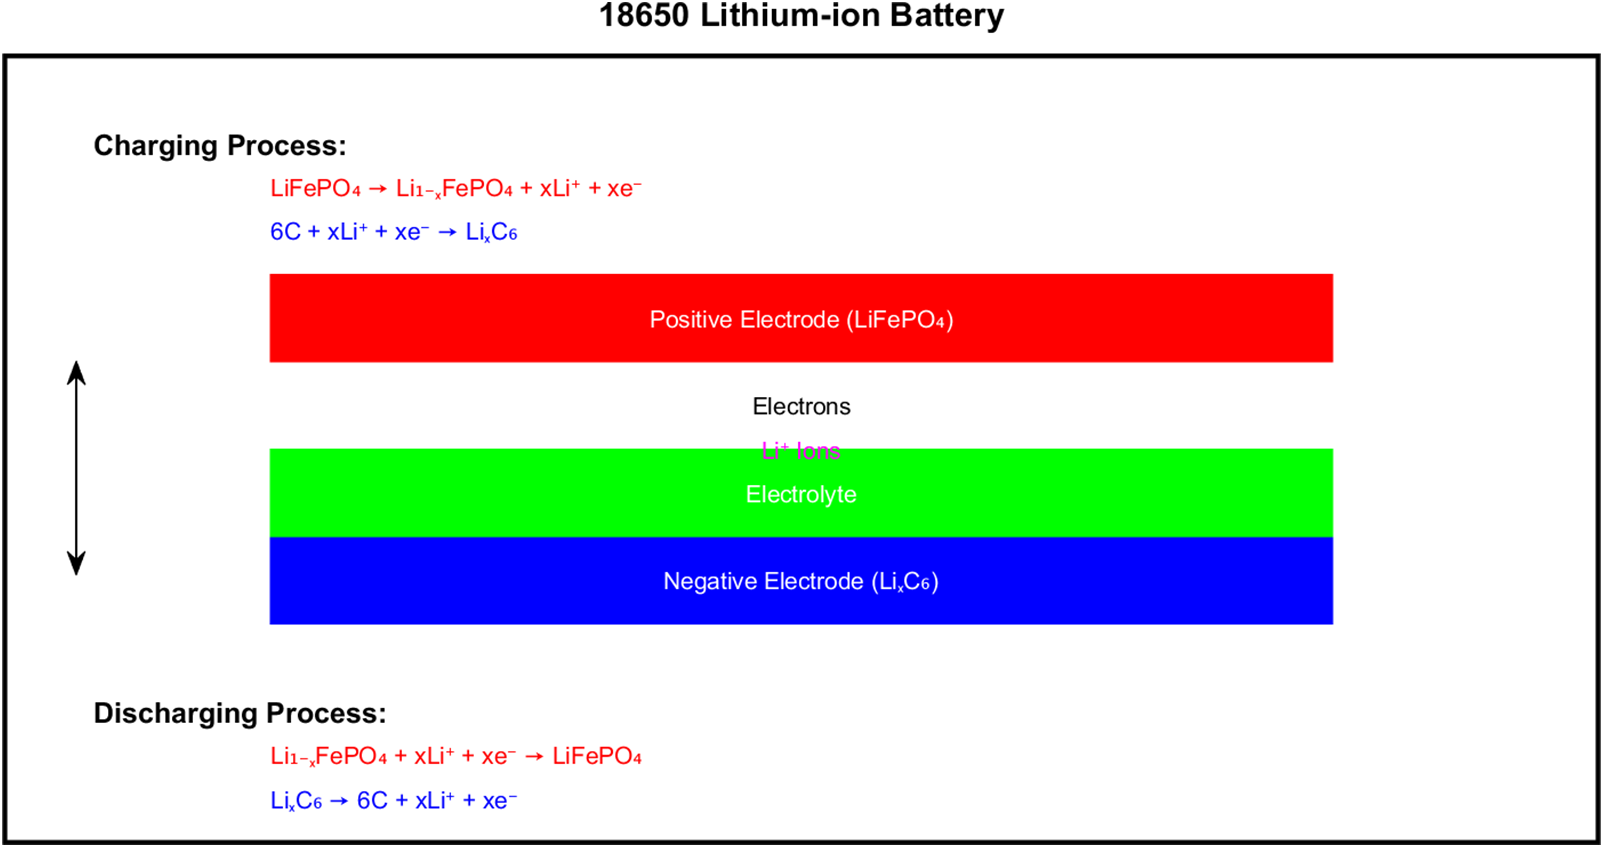
Figure 4: Charge-discharge process description diagram
Fig. 5 shows the charge state voltage case of the batteries at different low temperatures. With the increasing of time, the battery voltage at the same charge state decreases with the decrease of temperature, which is due to the fact that the lithium iron phosphate material undergoes a phase transition during charging and discharging, and low temperatures inhibit such a phase transition, which affects the structural stability of the material, and consequently affects the battery voltage.
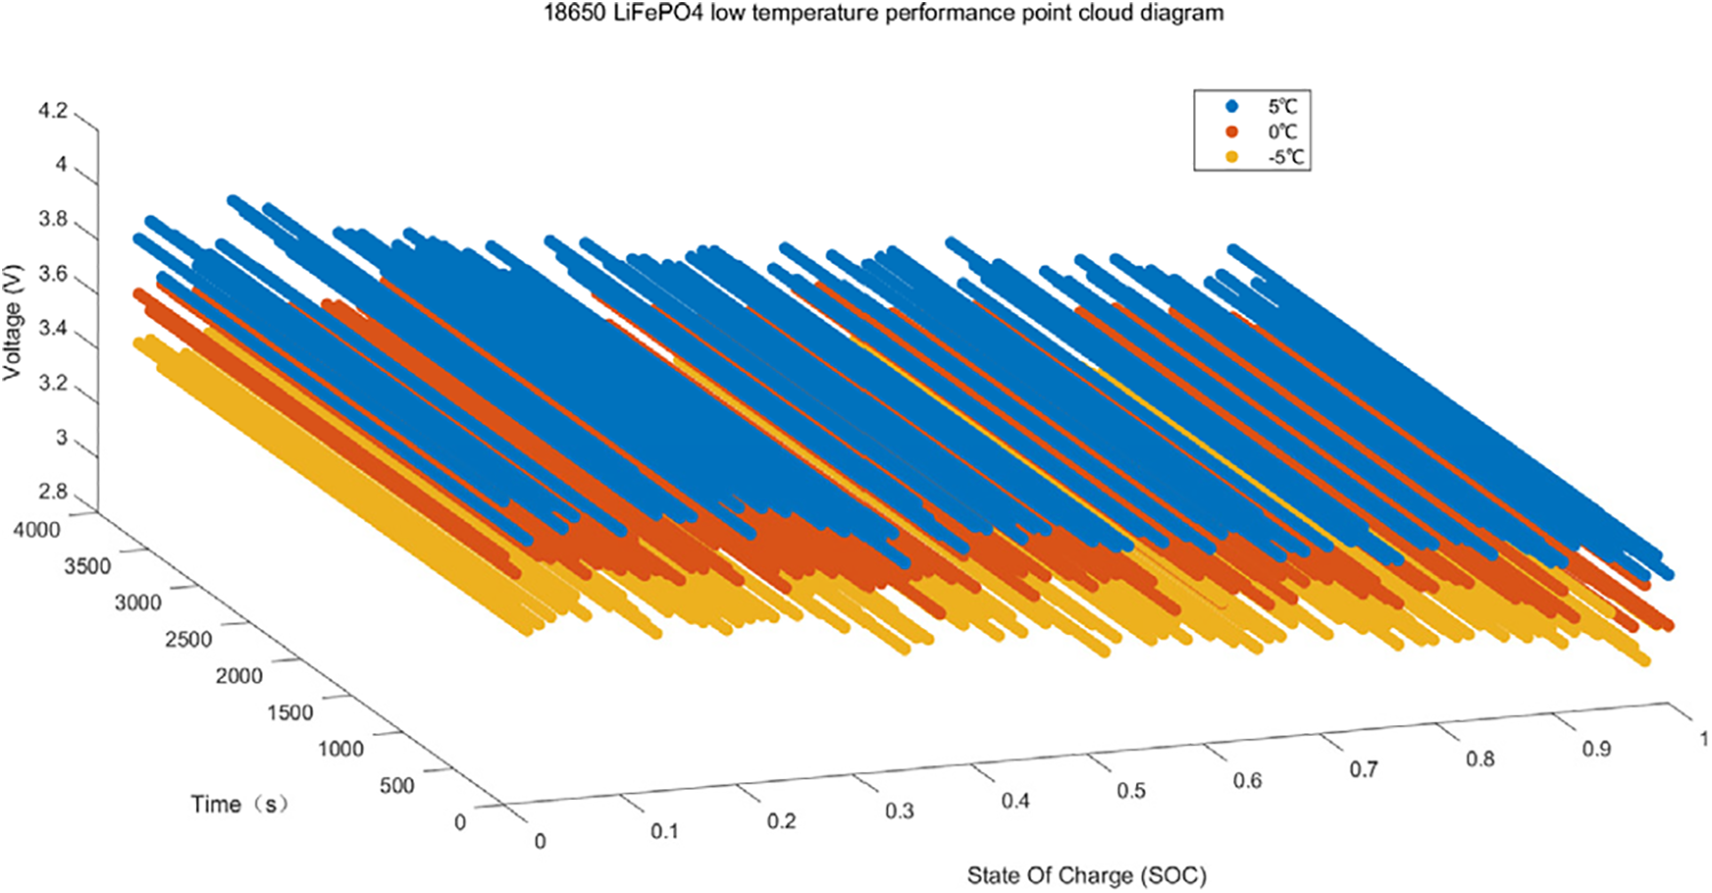
Figure 5: State-of-charge-voltage case of batteries at different low temperatures
The battery voltage is determined by the change in the Gibbs free energy of the battery; the relationship can be expressed as:
where ΔG is the Gibbs free energy change, n is the number of electrons transferred, F is Faraday’s constant, and E is the cell voltage. A change in temperature affects ΔG and therefore the cell voltage. In order to indicates the effect of low temperature conditions on the cell directly, Fig. 6 shows the point cloud comparison of the LFP battery at three different temperatures.
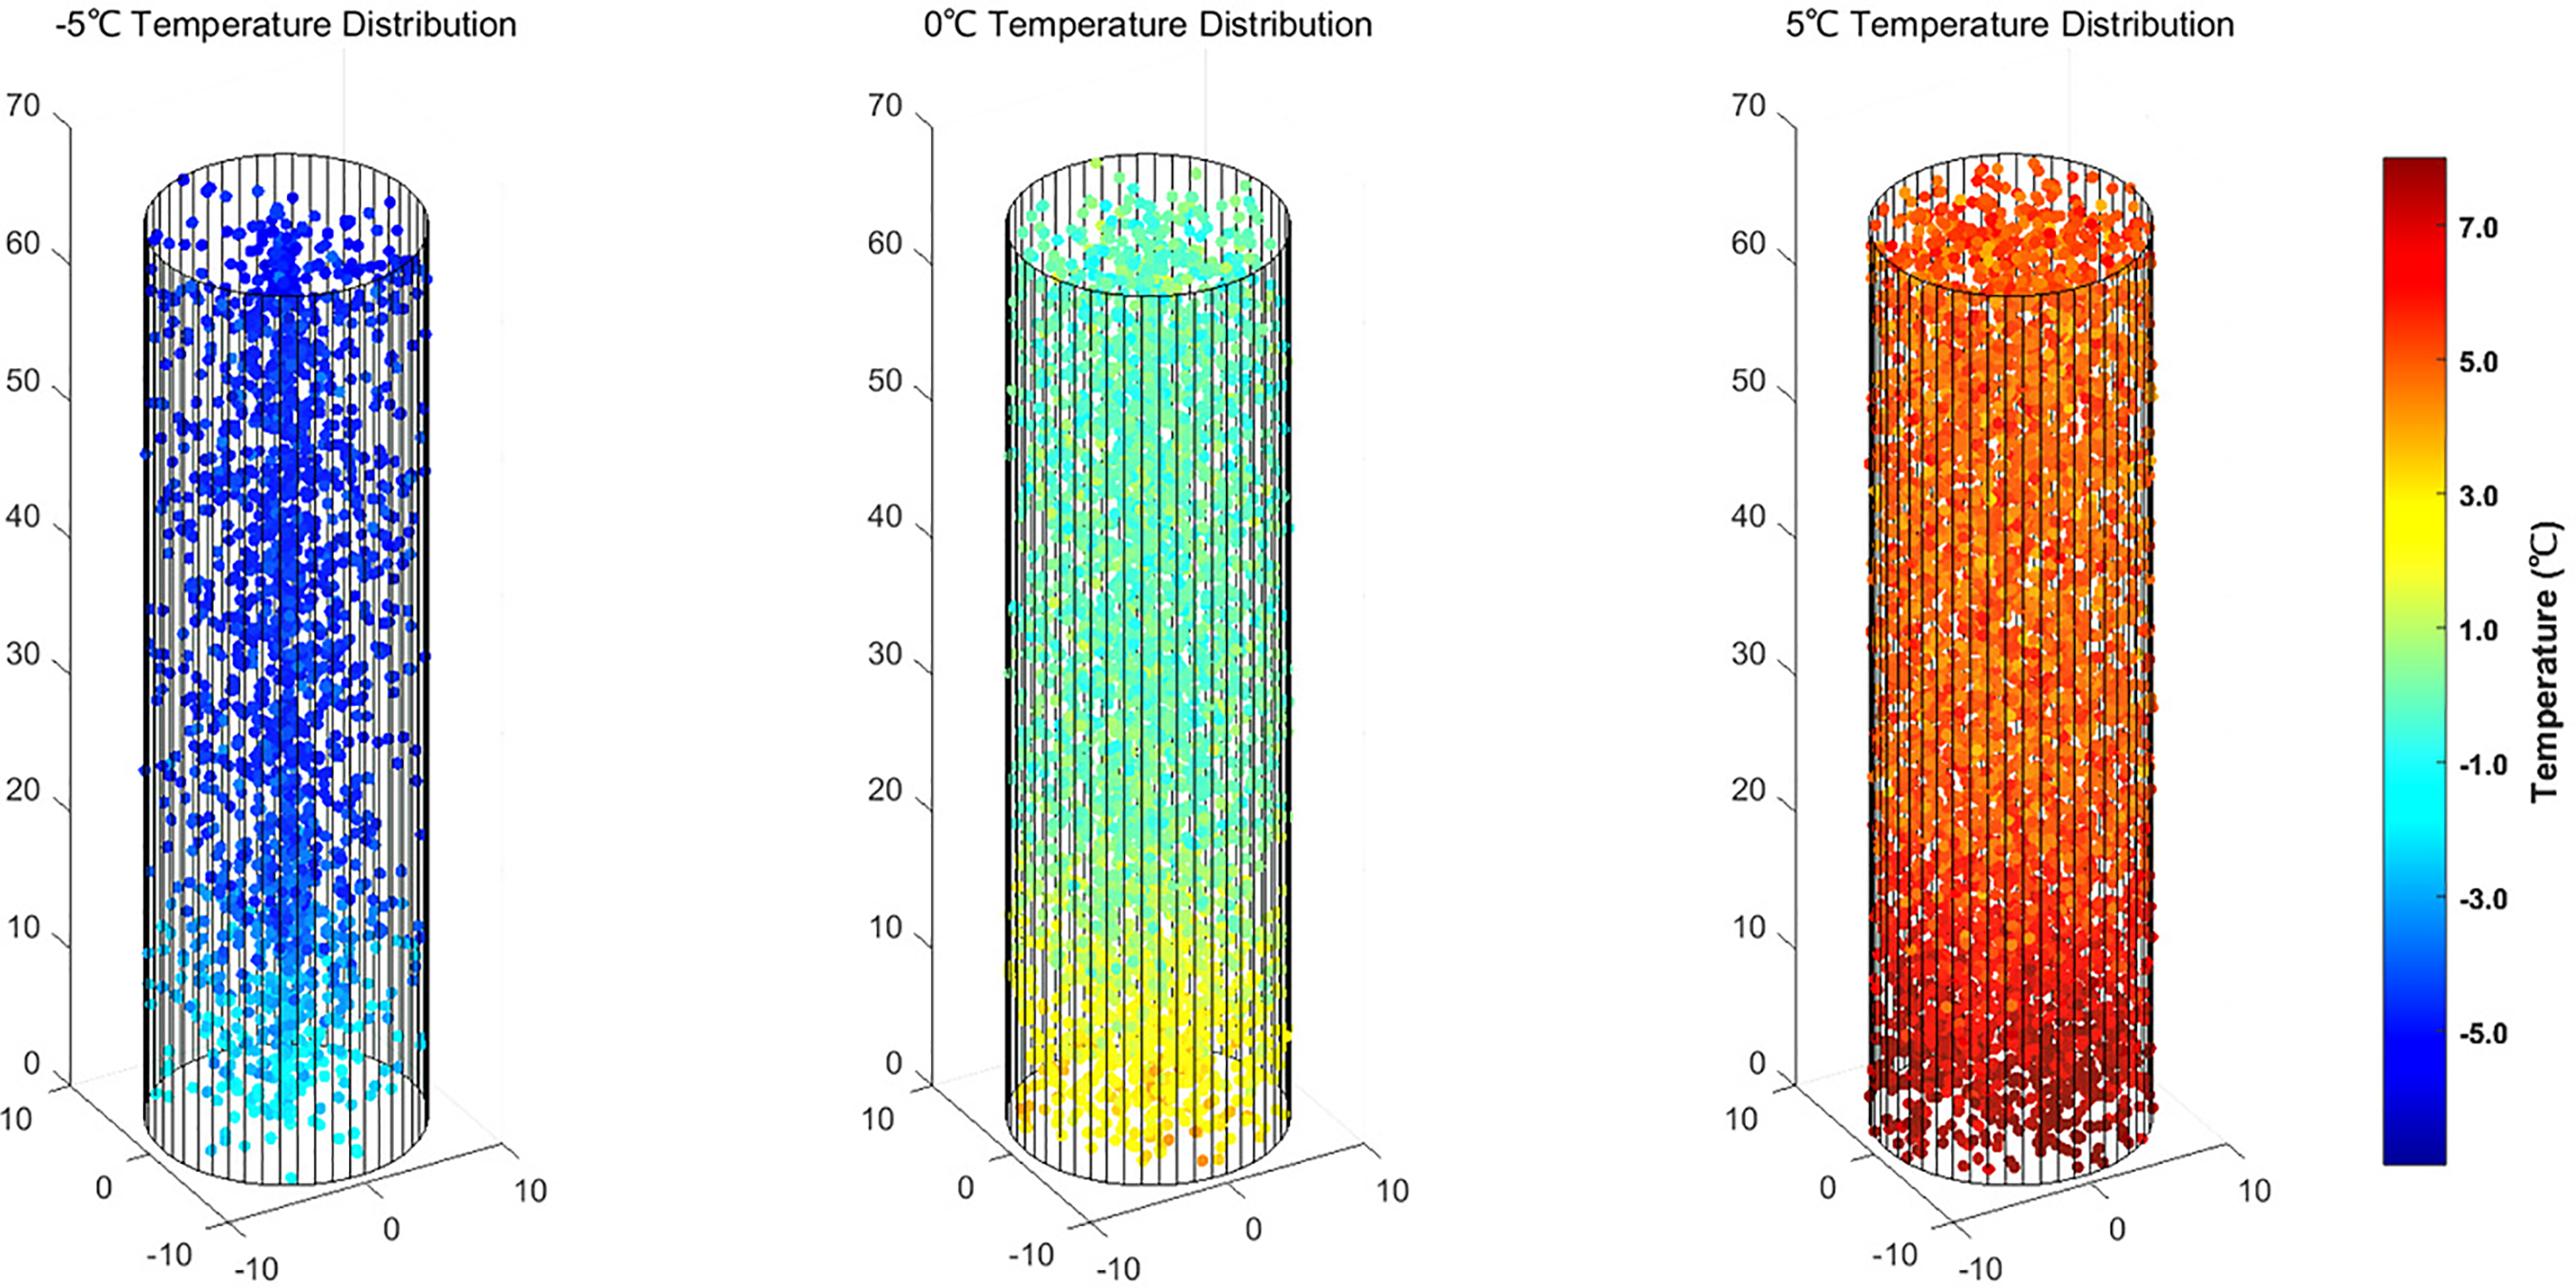
Figure 6: Comparison of LFP battery point clouds at three different temperatures
According to the comparison in Fig. 6, it can be seen that the lithium-ion migration is hindered and the internal reactivity is reduced at −5°C, the SEI membrane impedance partially increases at 0°C but some lithium ions are still able to proceed normally, and uniform de-embedding of lithium ions can still be carried out at 5°C relatives to −5°C and 0°C. Therefore, the study of batteries in low temperature environments can prolong the battery service life, which is of significance for the wide application of batteries.
3 Experimental Preparation and Test Methods
In this study, a commercial 18650 LFP battery was utilized, manufactured by a Chinese domestic lithium-ion battery manufacturer was used. The key specifications are as follows: nominal capacity of 1.5 Ah (measured at 0.2C discharge rate), nominal voltage of 3.2 V, charge termination voltage of 3.65 V and discharge cut-off voltage of 2.5 V, operational temperature ranges of 20°C–60°C (discharge) and 0°C–45°C (charge).
3.1 Construction of Experimental Platform
To systematically evaluate and record the capacity, voltage, and current variations of LFP batteries during low temperature cycling, a dedicated battery cycle test platform was established, as illustrated in Fig. 7.
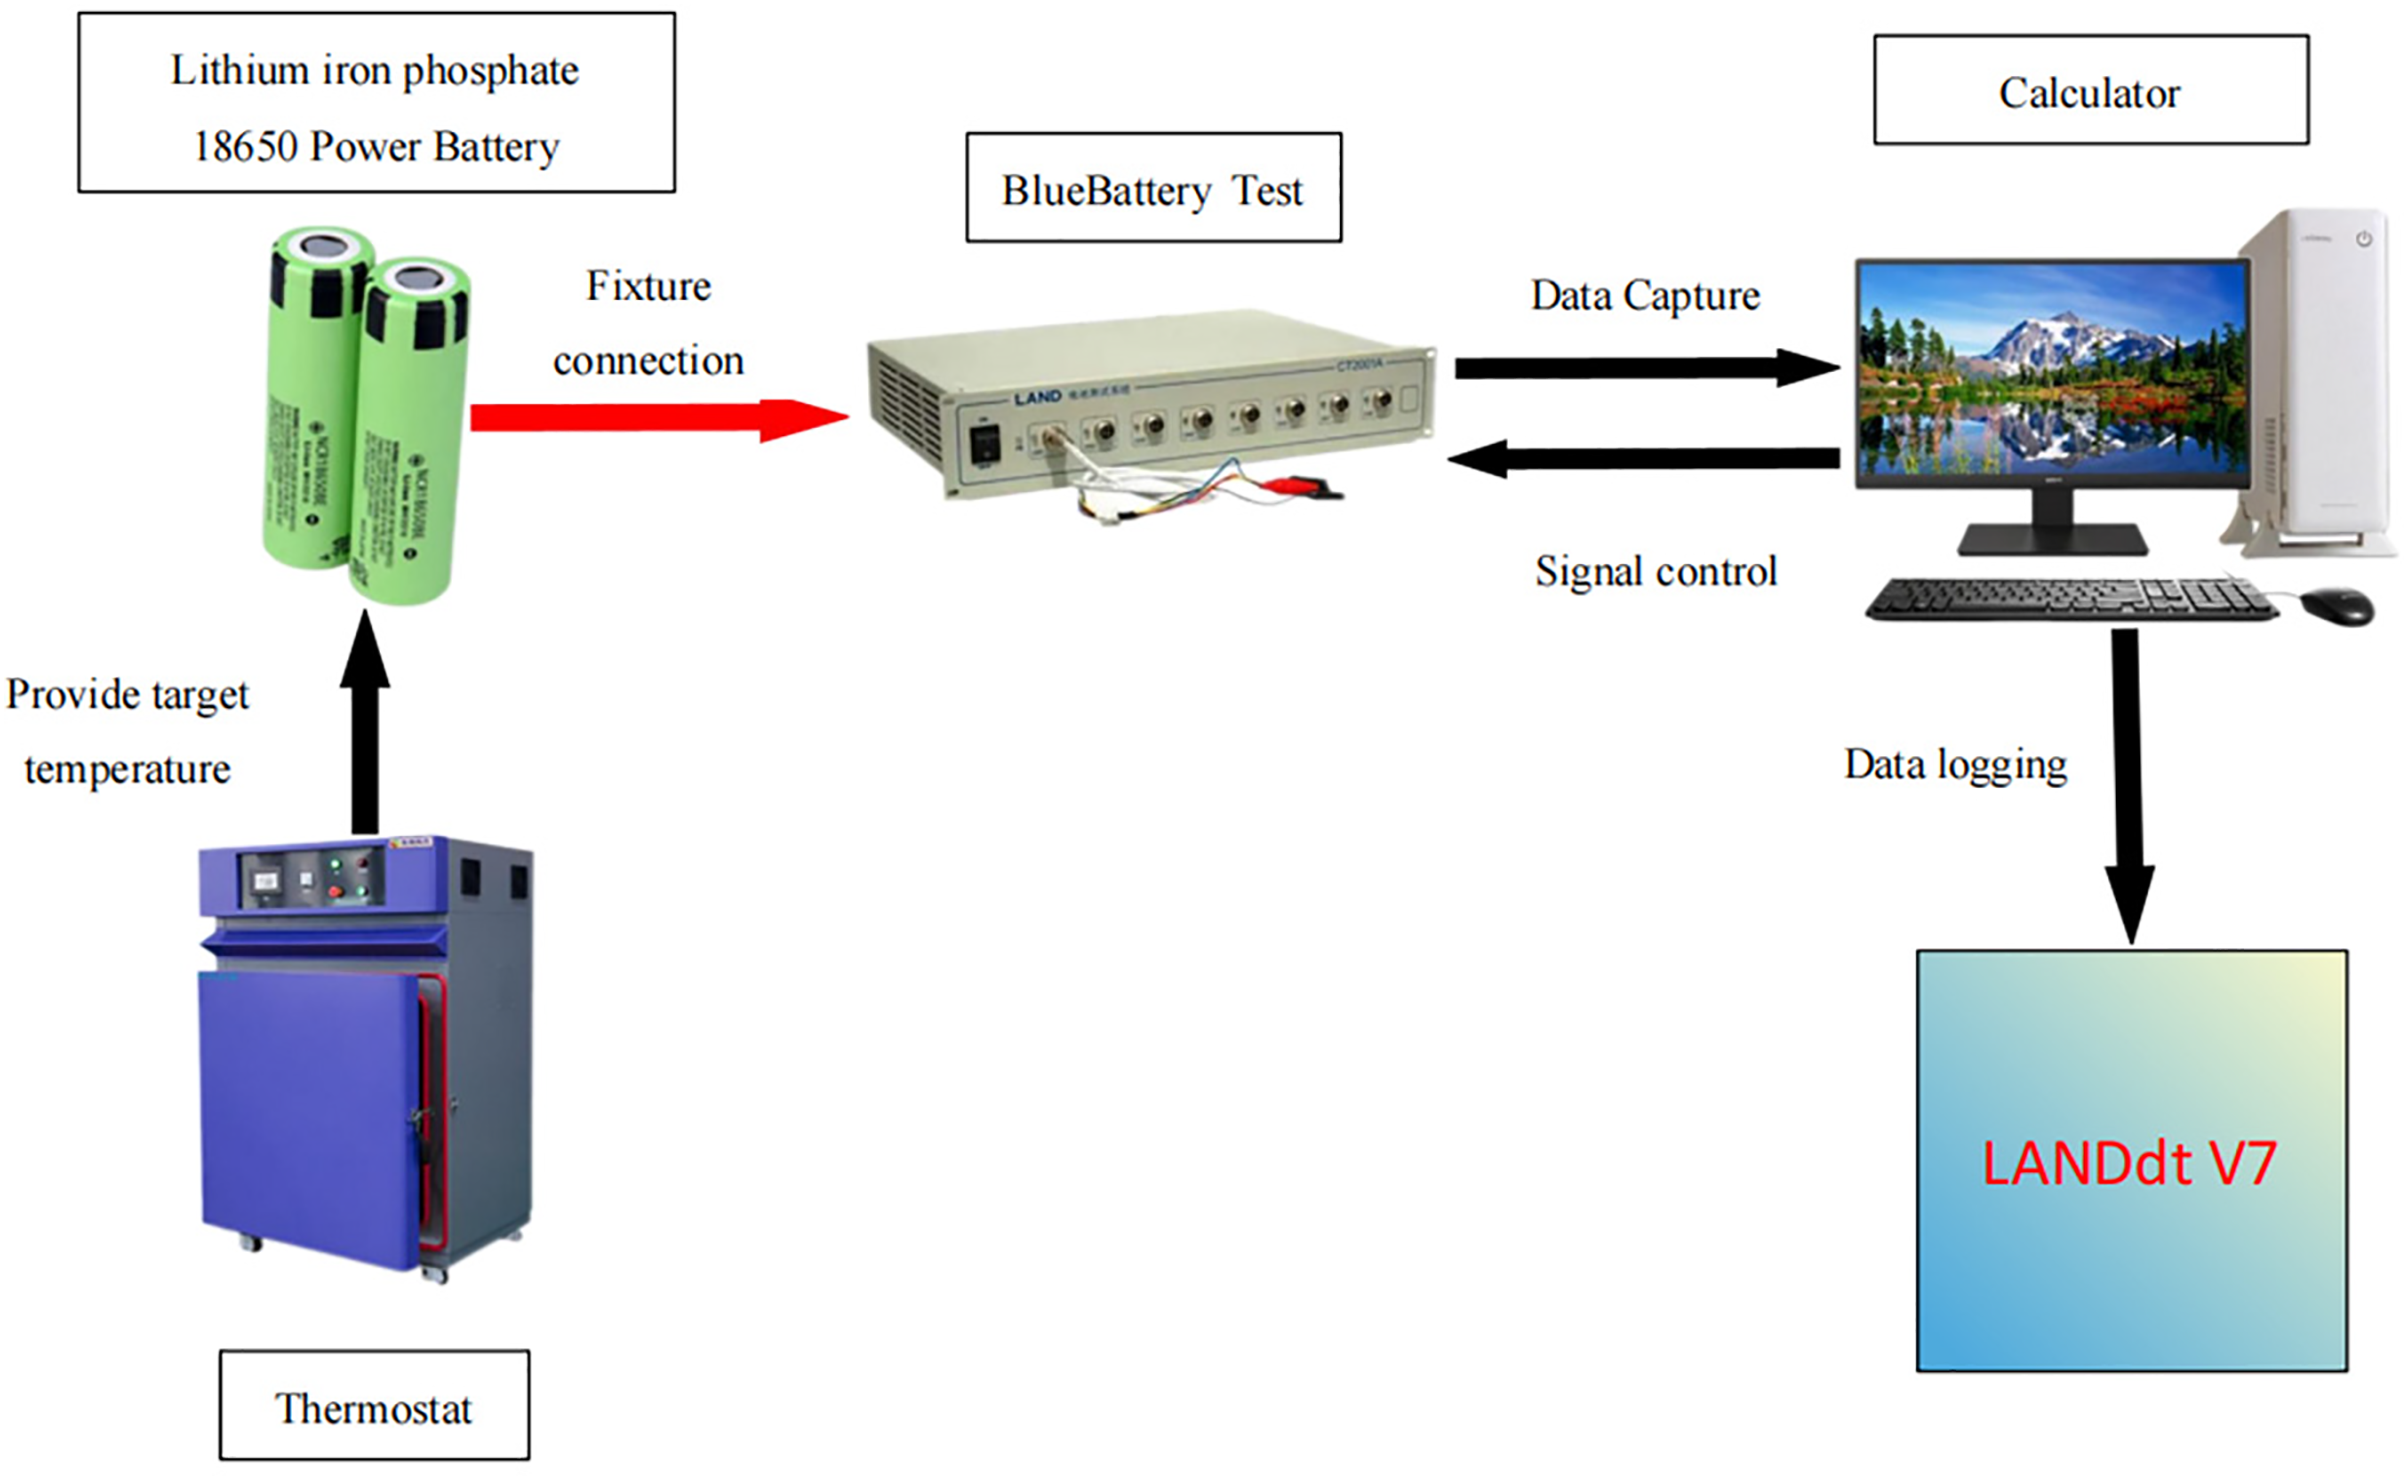
Figure 7: Battery cycle testing platform
Furthermore, to investigate the role of internal resistance in battery capacity degradation, the electrochemical impedance variations were analysed using EIS. The EIS measurements were conducted on the batteries before and after ageing tests [25], with the corresponding experimental setup depicted in Fig. 8.
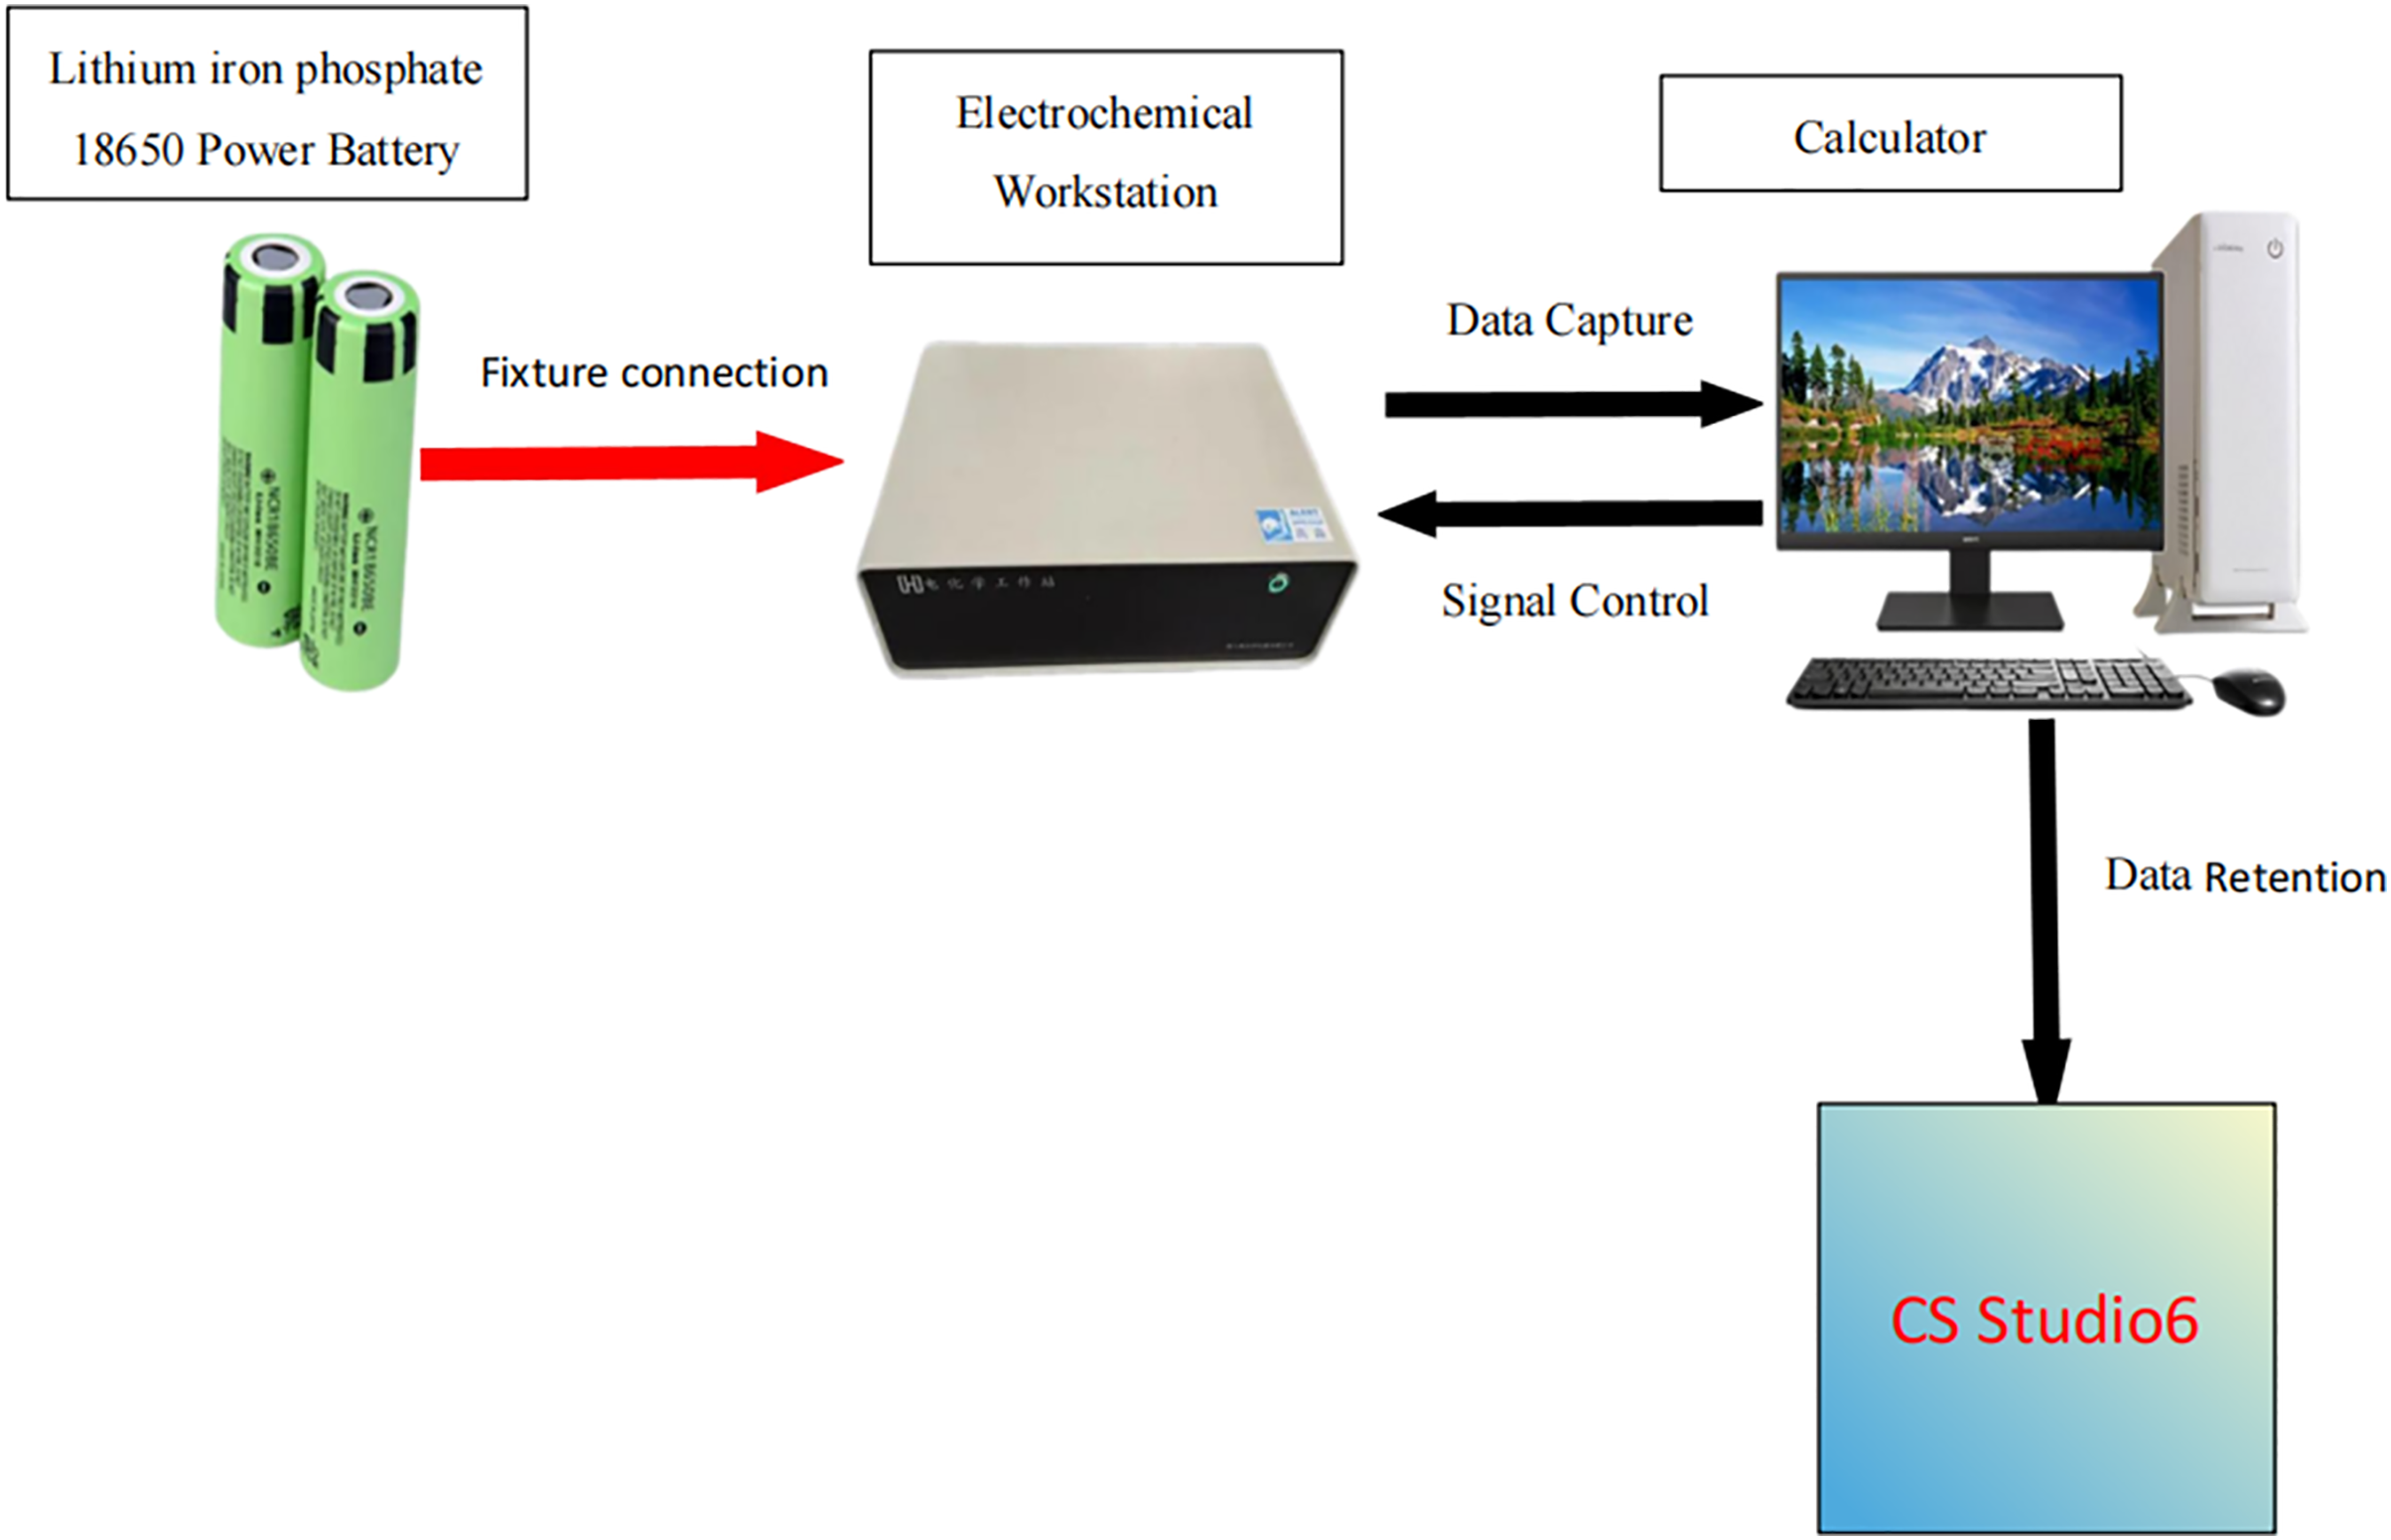
Figure 8: Electrochemical impedance spectroscopy (EIS) testing platform
To ensure the battery is fully charged, this study employed the constant current-constant voltage (CC-CV) charging method and constant current (CC) discharge protocol. Throughout the cycling tests, the battery was subjected to complete charge-discharge cycles until its discharge capacity degraded to 80% of the initial capacity, which was defined as the end of life (EOL). The charging rate was consistently set to 0.5C, while the discharge rate was maintained at 1C. The charging process was terminated when the upper voltage limit of 3.65 V was reached, followed by a 1C-rate discharge until the cut-off voltage of 2.5 V was attained. This cycle was repeated until the battery reached its EOL. The single charging and discharging process is shown in Fig. 9.
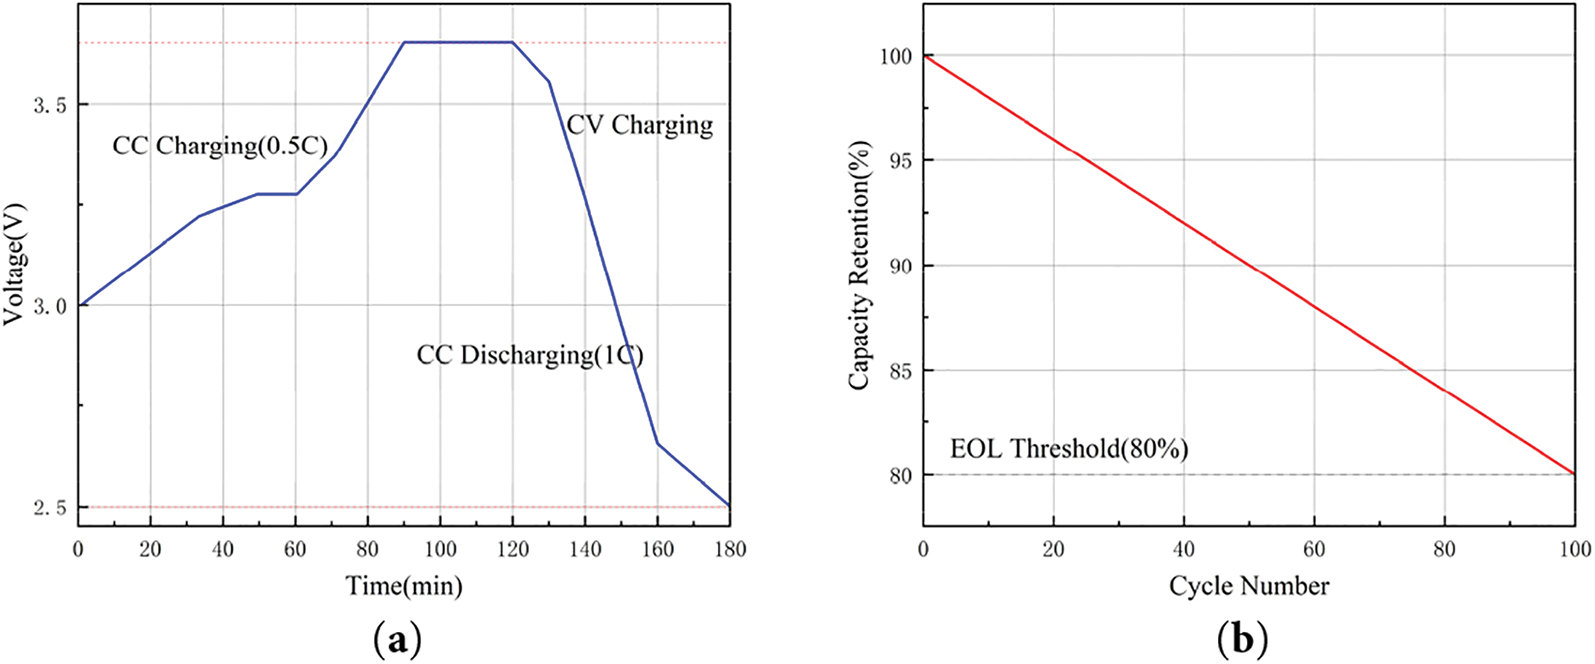
Figure 9: Primary charging and discharging process: (a) voltage profile; (b) capacity decay trend
3.3 Disassembly of Batteries and Production and Testing of Positive and Negative Half-Cells
To determine the capacity density values of the cathode and anode before battery aging, the battery was first fully discharged to a state of charge (SOC) of 0%. Subsequently, the battery was disassembled, and the cathode and anode were extracted for the fabrication and testing of half-cells. The disassembly process was carried out in an argon-filled glove box to prevent exposure to ambient air. The extracted electrodes were then assembled into CR2025 coin cells for electrochemical testing.
4 Analysis of the Effect of Low Temperature Environment on the Capacity Degradation of LFP Batteries
4.1 Cycling Performance Analysis of LFP Battery in Low Temperature Environment
The batteries were cycled under three low temperature conditions: −5°C, 0°C, and 5°C. The charging and discharging rates were consistently maintained at 0.5C and 1C, respectively. To account for variations in the initial capacities of batteries within the same batch, capacity normalization was applied. This approach facilitated the comparison and analysis of capacity retention rates across different test groups.
4.1.1 Decay Process of LFP Battery at Low Temperature
When analyzing the effect of ambient temperature on the capacity degradation of lithium-ion batteries, researchers commonly employ the Arrhenius equation [26] to describe the relationship between the capacity loss rate (Closs) and the cycle time (t) as expressed in Eq. (6):
Taking the natural logarithm of both sides of Eq. (6) yields Eq. (7):
A is the pre-exponential factor, and Ea is the activation energy. Both the capacity loss rate (Closs) and activation energy (Ea) are assumed to remain constant under fixed temperature and reaction conditions. T represents the absolute temperature in Kelvin (K), R is the ideal gas constant; and z is an indicator of cycle time. Eq. (7) shows that ln (Closs) and ln(t) exhibit a linear correlation. In addition, since the discharge capacity of the battery (C) is proportional to the cycle duration (t), the above expression can be converted to Eq. (8):
Table 1 shows the impact factor Z obtained by linear fitting of the battery capacity Closs and discharge capacity C after aging at different temperatures. Fig. 10 demonstrates the relationship between capacity retention, number of cycles and cycle time.
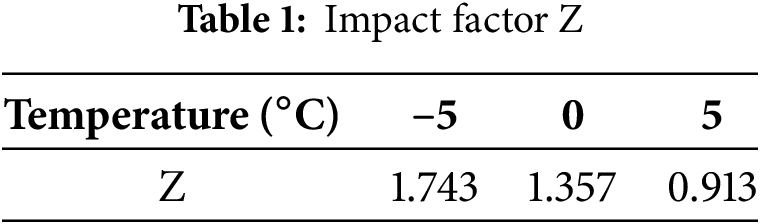
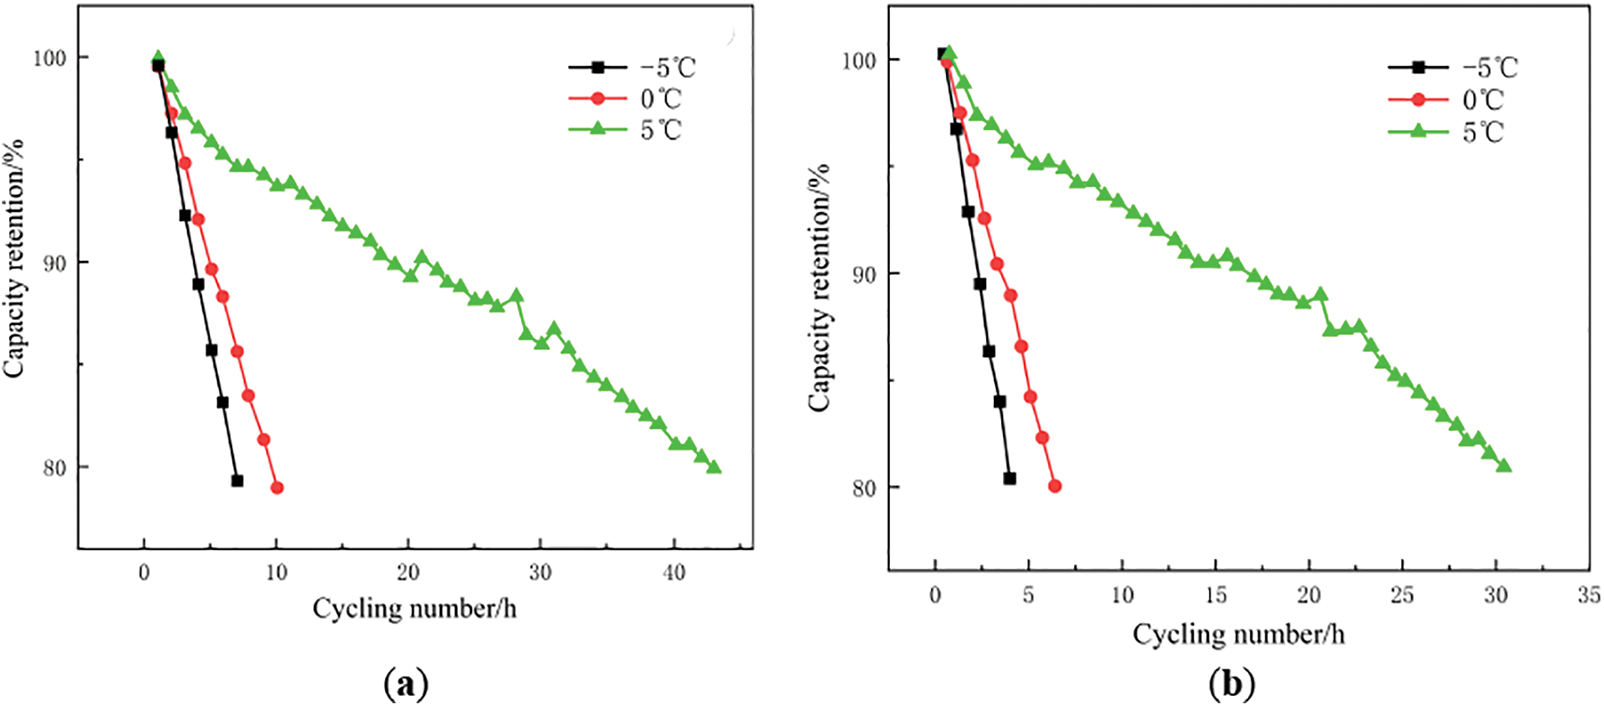
Figure 10: Capacity retention vs. cycle number: (a) and cycle time; (b) under different temperatures
Fig. 10 clearly demonstrates that the rate of battery capacity decay accelerates as the ambient temperature decreases. This is attributed to the significant reduction in lithium-ion conductivity within the electrolyte, leading to a sharp decline in discharge capacity under the same discharge conditions. Fig. 11 illustrates the relationship between discharge voltage and capacity at the three low temperature conditions.
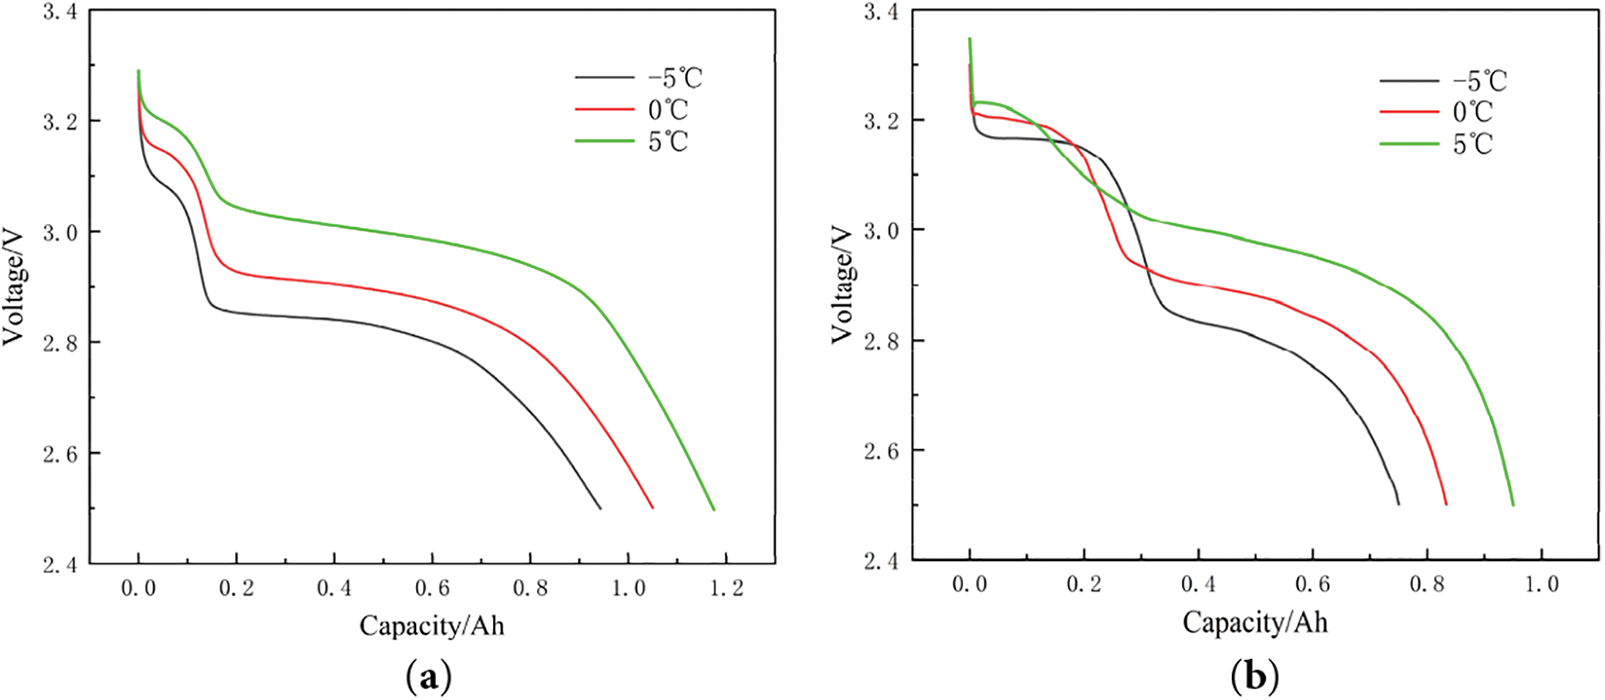
Figure 11: Relationship between discharge voltage and capacity at the three low temperature conditions: (a) early cycle; (b) late cycle
The data indicate that lower voltages exacerbate the poor conductivity of LFP and weaken the binding of lithium ions to the anode. In Fig. 12, the open-circuit voltage (OCV) at a state of charge (SOC) of 0% is compared for the three low temperature cases at equivalent capacity retention levels.
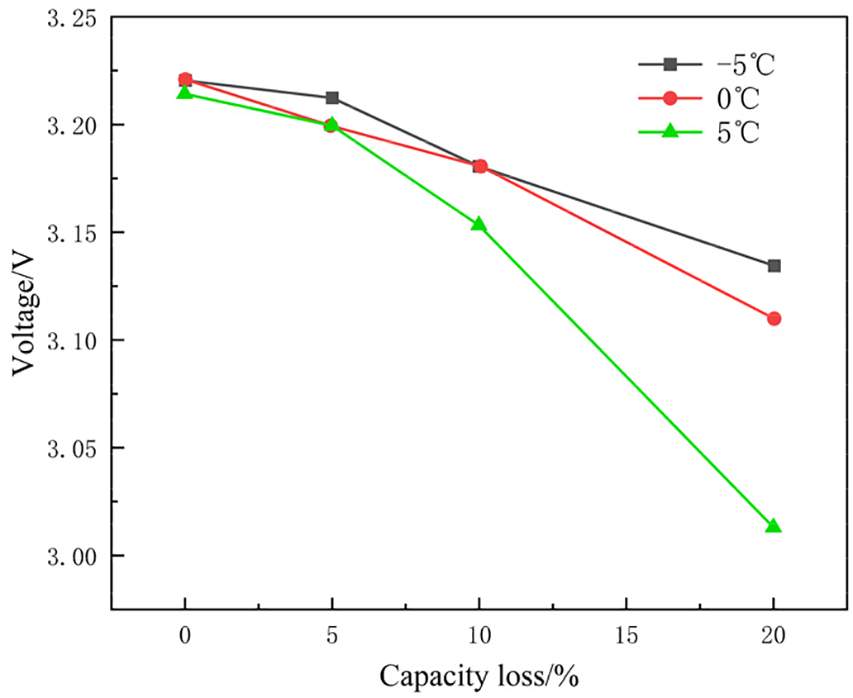
Figure 12: Comparison of battery open circuit voltage (SOC = 0) at the same capacity retention rate in three low temperature environments
The influence of temperature on the OCV (SOC = 0%) is relatively negligible during the initial stages of capacity degradation. However, when the capacity retention falls to approximately 95%, the OCV (SOC = 0%) begins to decrease significantly. This suggests that the impact of temperature on battery performance is predominantly concentrated in the later stages of capacity depletion.
4.1.2 Electrochemical Impedance Spectroscopy (EIS) Analysis of Batteries under Low Temperature Aging
Prior to conducting electrochemical impedance spectroscopy (EIS) analysis, it is critical to ensure the battery is fully discharged to a state of charge (SOC) of 0% and stabilised to a steady internal state. During EIS testing, the frequency range was swept from high to low (10 kHz to 0.01 Hz) with a sinusoidal current amplitude of 200 mA, while the polarisation voltage was maintained at the cell’s open-circuit voltage (OCV). To mitigate experimental variability, three independent EIS measurements were performed for each cell. Fig. 13 illustrates the EIS curve of battery capacity retention rate of 80% at different low temperatures, (a) is full EIS image, (b) is enlarged image of semicircular arc area.
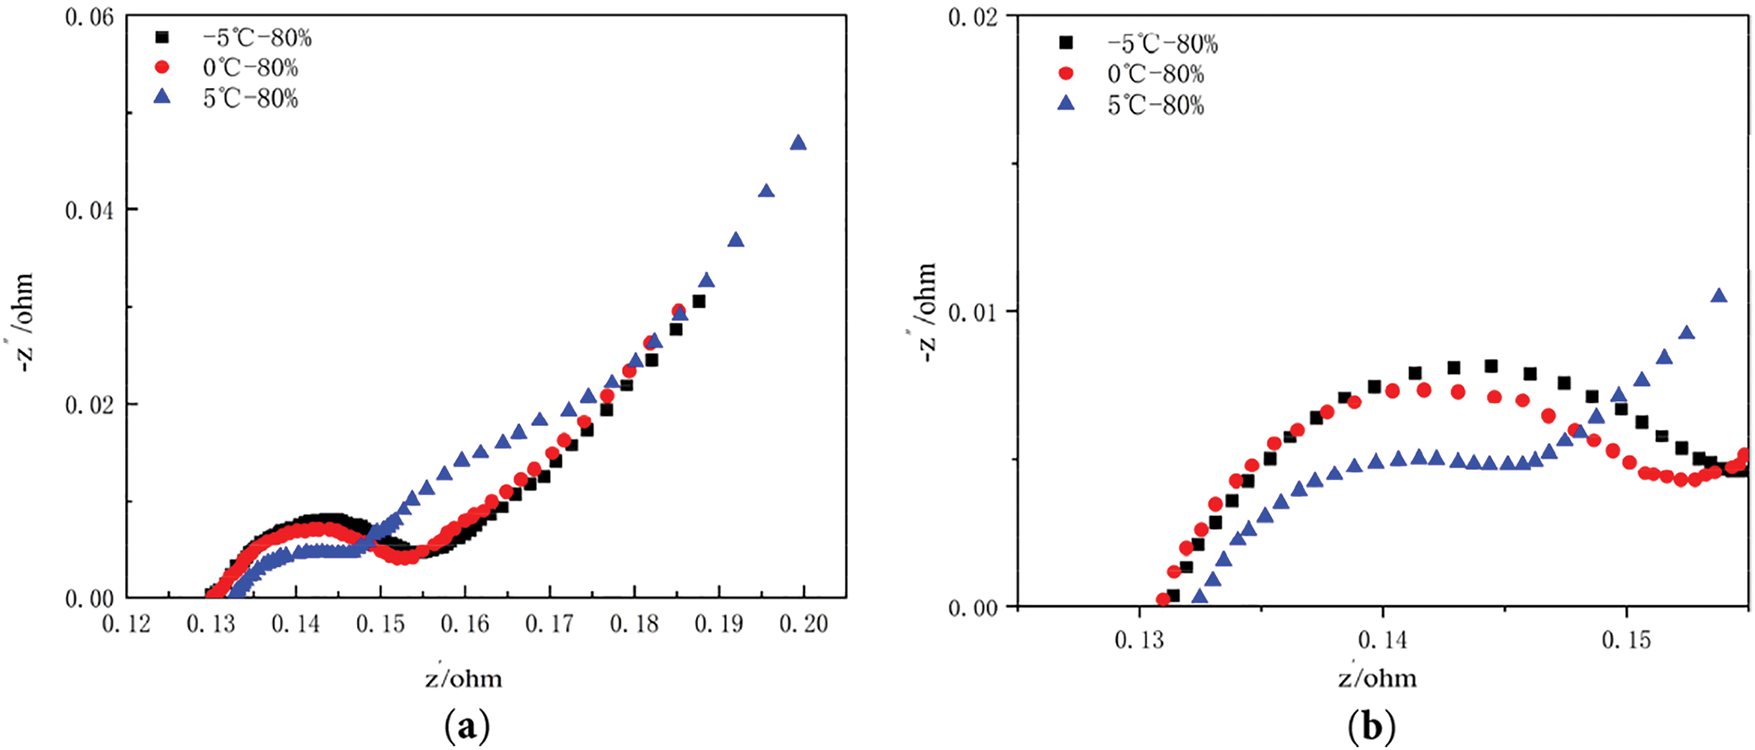
Figure 13: EIS curve of battery capacity retention rate of 80% at different low temperatures: (a) Full image of EIS; (b) Enlarged image of semicircular arc area (−5°C, 0°C, 5°C)
The ohmic impedance Ro of the cell is the intersection of the graph with the horizontal axis. The two semicircular arcs in the high-frequency and medium-high-frequency regions represent the solid surface film impedance Rs and the charge transfer impedance Rct, respectively. The ohmic impedance (Ro) of these cells that have been cycled to end-of-life is significantly different from the solid interface film impedance Rs and charge transfer impedance Rct. The radius of the semicircular arcs in the high-frequency and mid-high-frequency portions of the EIS impedance spectrum increased with decreasing temperature.
In order to understand the quantitative relationship between the different factors more precisely, the values of each parameter were adjusted using Zview software. The estimated values of each parameter were obtained by segmental fitting and overall fitting (fitting error less than 20%), as shown in Table 2. The fit model is shown in Fig. 14.
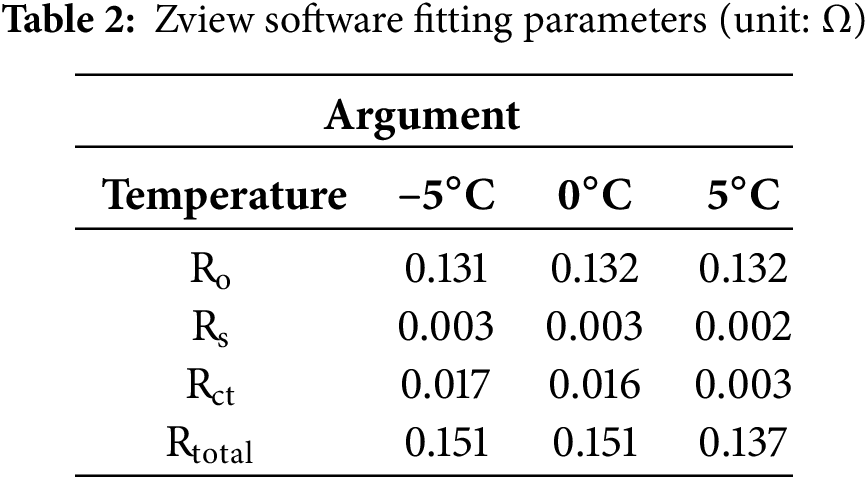
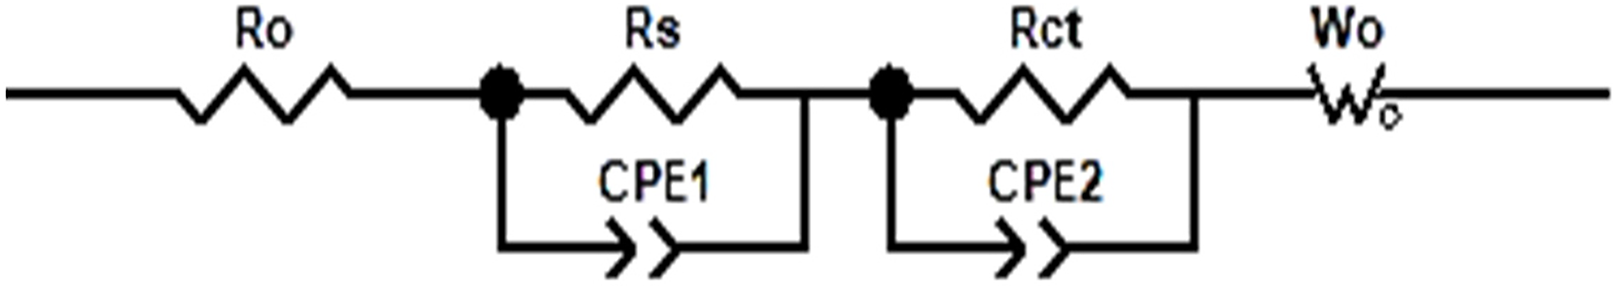
Figure 14: EIS impedance fitted model diagram
These impedances consist of internal resistances in ohms. r(o) is related to the resistance of the electrolyte and the metal shell. The Weber impedance Wo represents the diffusion process that occurs after the charge transfer impedance Rct in the model. The constant phase angle element (CPE) is the equivalent element that represents the deviation of the bilayer from the pure capacitance C. The CPE is a parameter of the model. The parameter magnitudes and variation curves of the model are shown in Table 2 and Fig. 15.
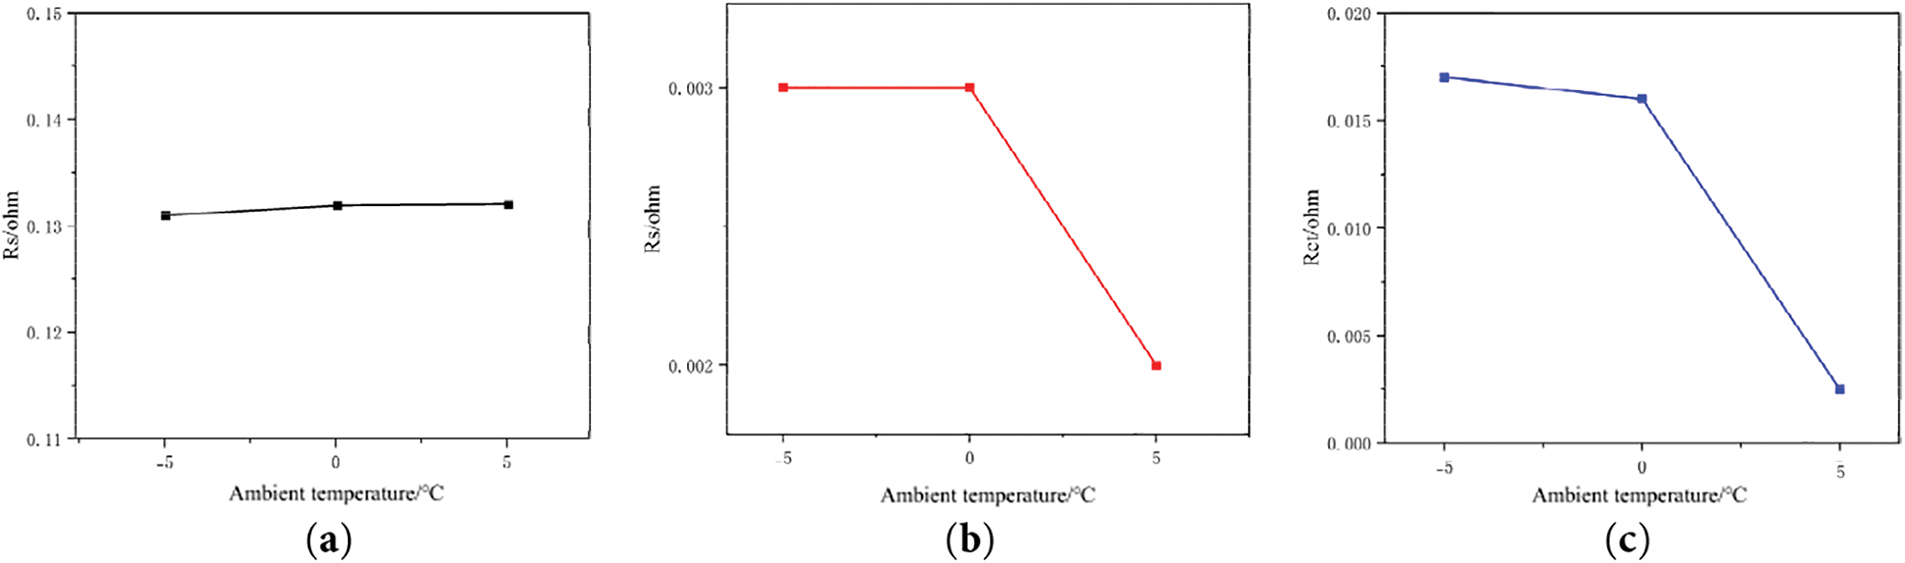
Figure 15: EIS impedance fitting results with battery capacity retention rate of 80% at different low temperatures: (a) Ro; (b) Rs; (c) Rct fitting value
By examining the data in Table 2 and the change curves in Fig. 15, it can be seen that Ro and Rs hardly fluctuate throughout the cooling process, indicating that they have less influence on the battery performance at low temperatures. On the contrary, the value of Rct increases significantly as the temperature decreased, and its variation with temperature is significantly larger than that of Ro and Rs. Therefore, 0°C is the critical temperature for slowing down the rate of capacity decay for this battery type.
4.2 Analysis of Capacity Degradation Mechanisms in LFP Batteries under Three Low Temperature Conditions
In this study, physical characterization of cathode and anode materials was conducted using SEM, EDS and XRD. These techniques were employed to systematically analyse the morphological evolution, structural changes, and elemental composition variations of the electrode materials before and after ageing under low temperature cycling.
4.2.1 Anode Material Capacity Testing and Analysis
To minimize unforeseen errors, the available capacity of the LFP battery’s positive electrode was determined by calculating the average discharge capacity over three cycles. Subsequently, the specific capacity was determined by considering the mass of the active material on a circular electrode with a diameter of 12 mm. The exact calculation is shown in Eq. (9).
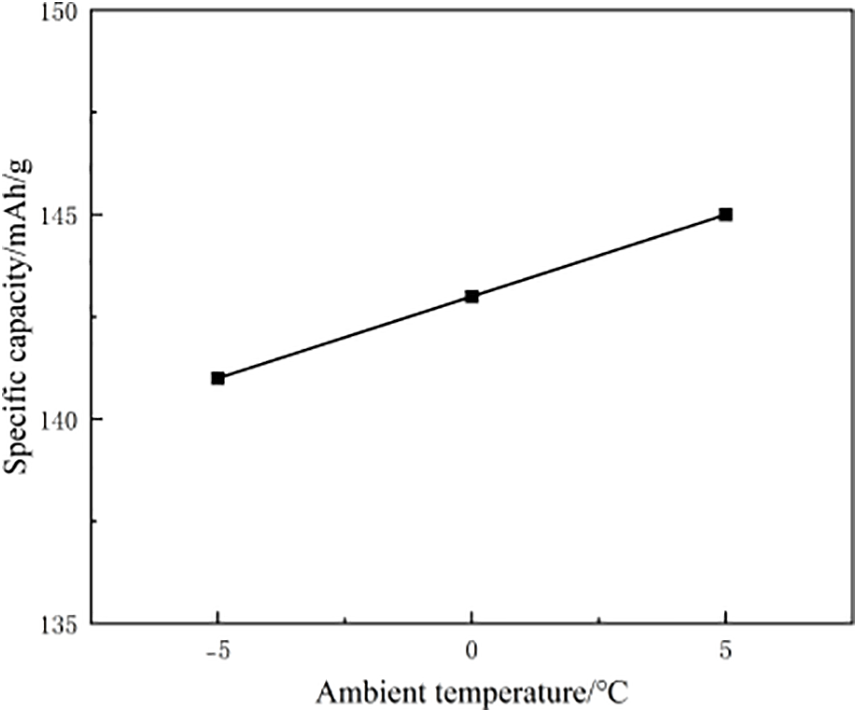
Figure 16: Specific capacity of LFP cathode material after aging at three different low temperatures
As evidenced by the experimental data, the cathode exhibits progressively deteriorating performance with decreasing temperature. This trend indicates that even moderate reductions in ambient temperature significantly accelerate cathode-specific capacity fade. However, comparative analysis of full-cell vs. half-cell degradation rates reveals that cathode deterioration under low temperature conditions contributes only partially to the overall capacity loss. The dominant factors governing complete cell failure likely reside in synergistic effects between anode lithium plating, electrolyte conductivity limitations, and interfacial impedance growth.
4.2.2 Negative Electrode Material Capacity Testing and Analysis
The test method for determining the available capacity of graphite anode material and calculating its specific capacity is similar to that of LFP cathode. The specific method is detailed in Eq. (10).
where Qa is the actual discharge specific capacity of the negative electrode; Ca is the average discharge capacity of the negative half-cell; Ma is the average total mass of the pole piece; mCopper is the average mass of the copper foil of the collector material, and its value is 8.2 mg; the value of K is also 0.95, which indicates that the mass of the graphite powder accounts for 95% of the total mass of the active material. Fig. 17 shows the exact capacity of three different graphite anode materials after aging at low temperature.
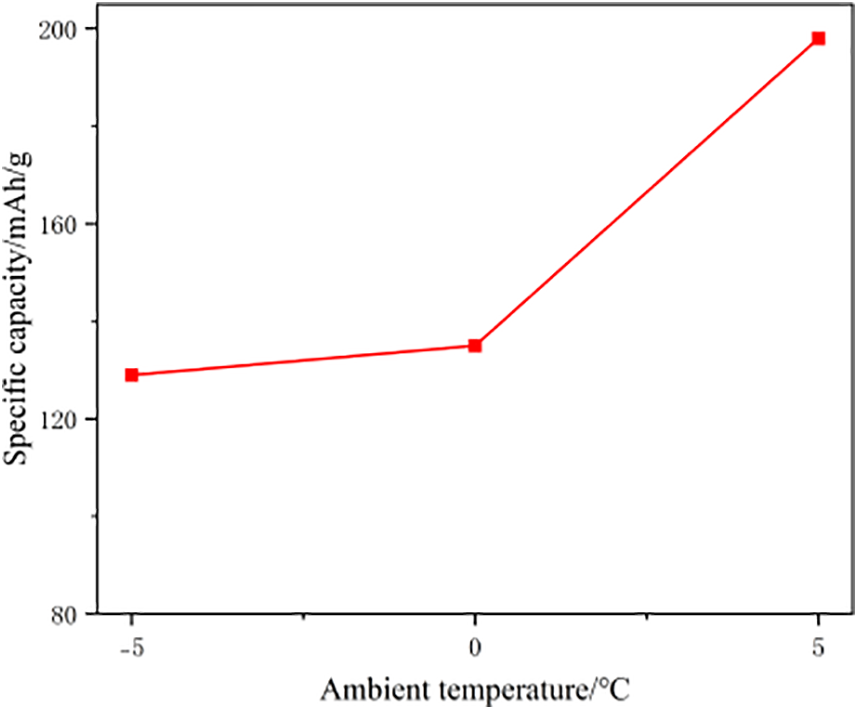
Figure 17: Specific capacity of graphite anode materials after aging at three different low temperatures
The graph shows that the specific capacity of the graphite negative electrode decreases with age, especially when the temperature decreased. These data show that the negative electrode capacity decreased rapidly at 0°C, which suggests that the decay of the negative electrode capacity is the main reason for the loss of battery capacity.
4.2.3 Analysis of the Causes of Negative Electrode Performance Degradation
To ascertain the precise causes of capacity decline in graphite anodes under three distinct low temperature conditions, a comprehensive investigation into the physical properties, arrangement, and chemical composition of the degraded electrode materials is essential. This study can be carried out by using physical characterization techniques such as SEM, EDS, and XRD.
In the light of the negative electrode morphology analysis. Fig. 18 shows digital images of the negative labeling after exposure to three different cryogenic settings. These images were taken after the entire cell was disassembled. Fig. 19 shows scanning electron micrographs of the negative electrode after aging at three different low temperatures.
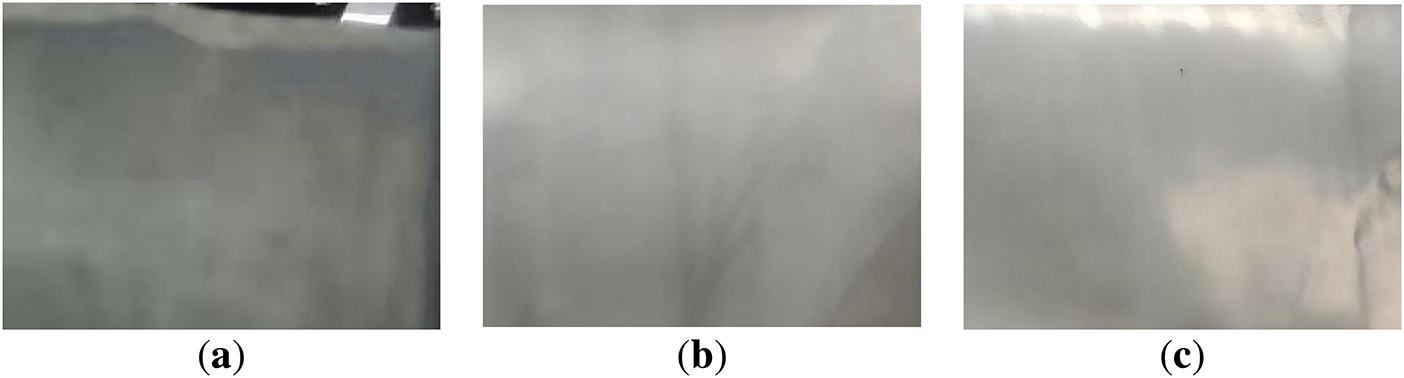
Figure 18: Digital photos of negative pole pieces after aging under different low temperature conditions: (a) 5°C; (b) 0°C; (c) −5°C
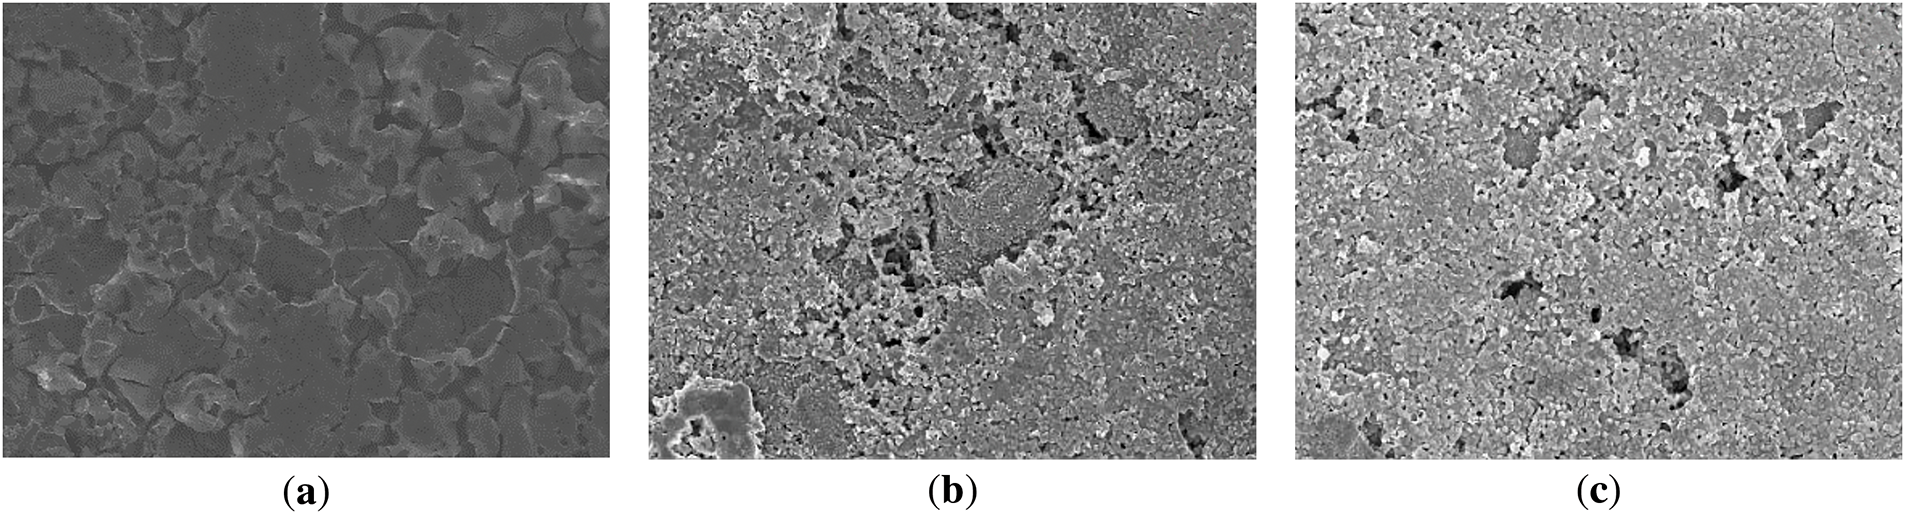
Figure 19: SEM photos of the negative electrode after aging in three different low temperature environments: (a) 5°C; (b) 0°C; (c) −5°C
These photographs show that the lithium dendrites on the anode surface increase with decreasing temperature and the potential distribution of the lithium-ion battery is not uniform. The apparent polarization effect leads to uneven lithium dendrites on the anode. This process consumes a large amount of active lithium, which reduces the battery capacity and leads to battery failure. Therefore, the change of anode surface morphology also verified the accuracy of the battery cycling analysis.
In the light of changes in the surface composition of the negative electrode. Fig. 20 shows the SEM image of the negative electrode after exposure to −5°C for a given time. The EDS test used both anomalous and normal regions of the negative electrode surface. This was done to measure changes in Carbon (C), Oxygen (O), and Fluorine (F) and to understand their causes.
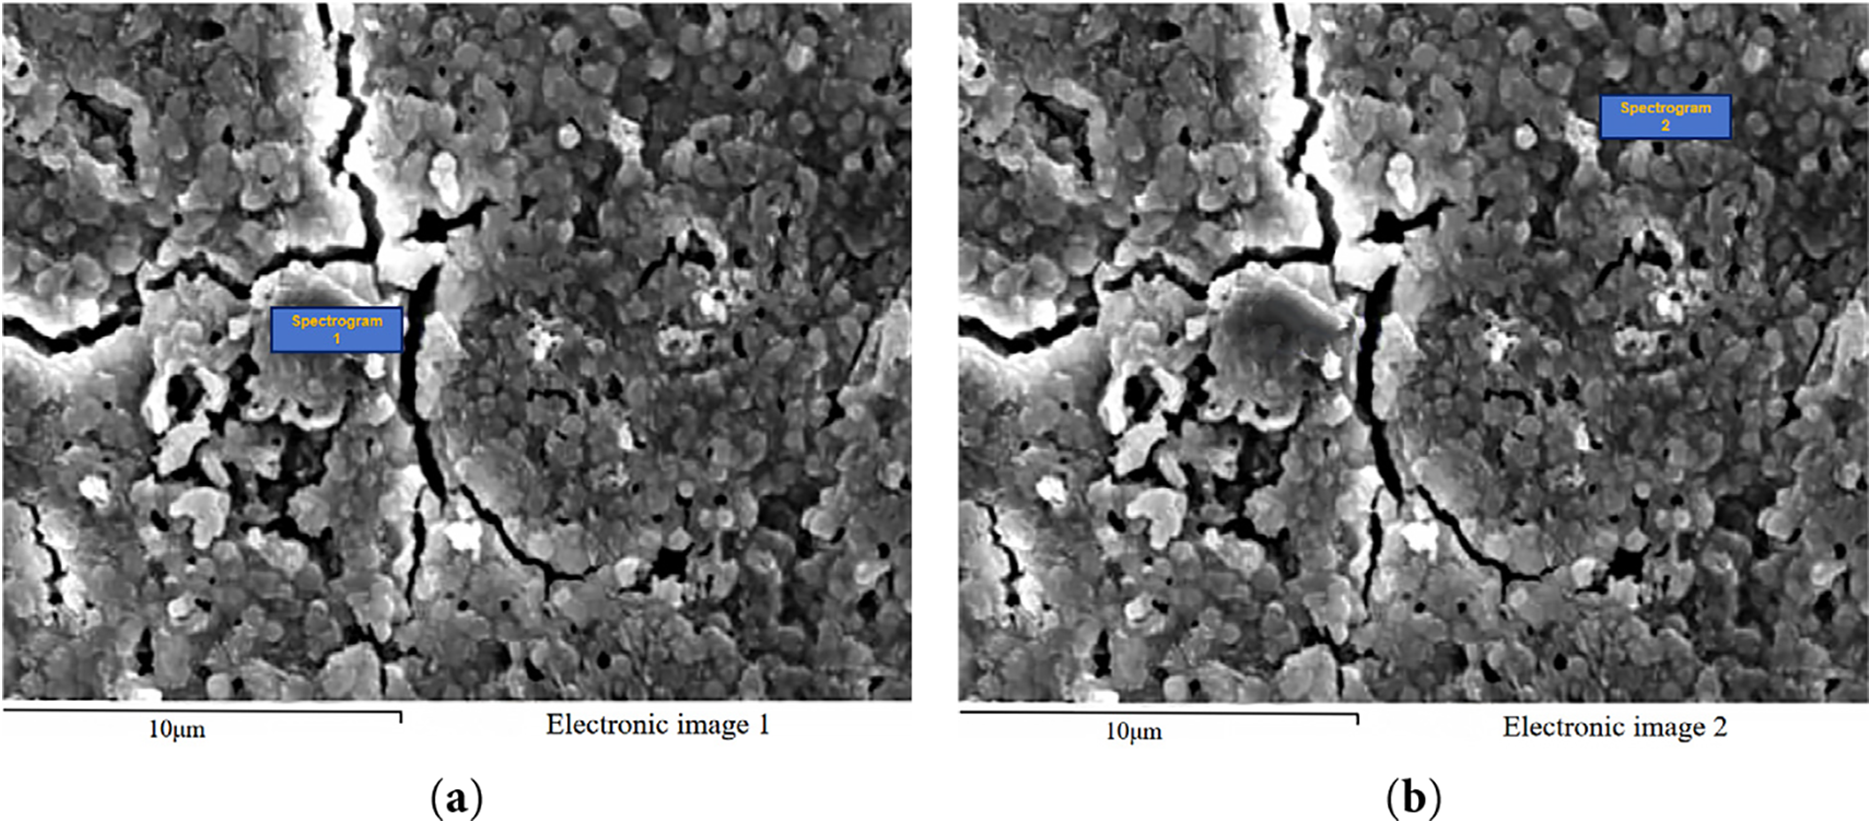
Figure 20: Electron microscope photos of different positions of negative electrode at −5°C: (a) Spectrogram 1; (b) Spectrogram 1
The anomalous location in the figure exhibits distinct prominences and cracks compared to the typical location, along with a large amount of white material surrounding the cracks. Table 3 displays the difference in elemental composition between these two locations:
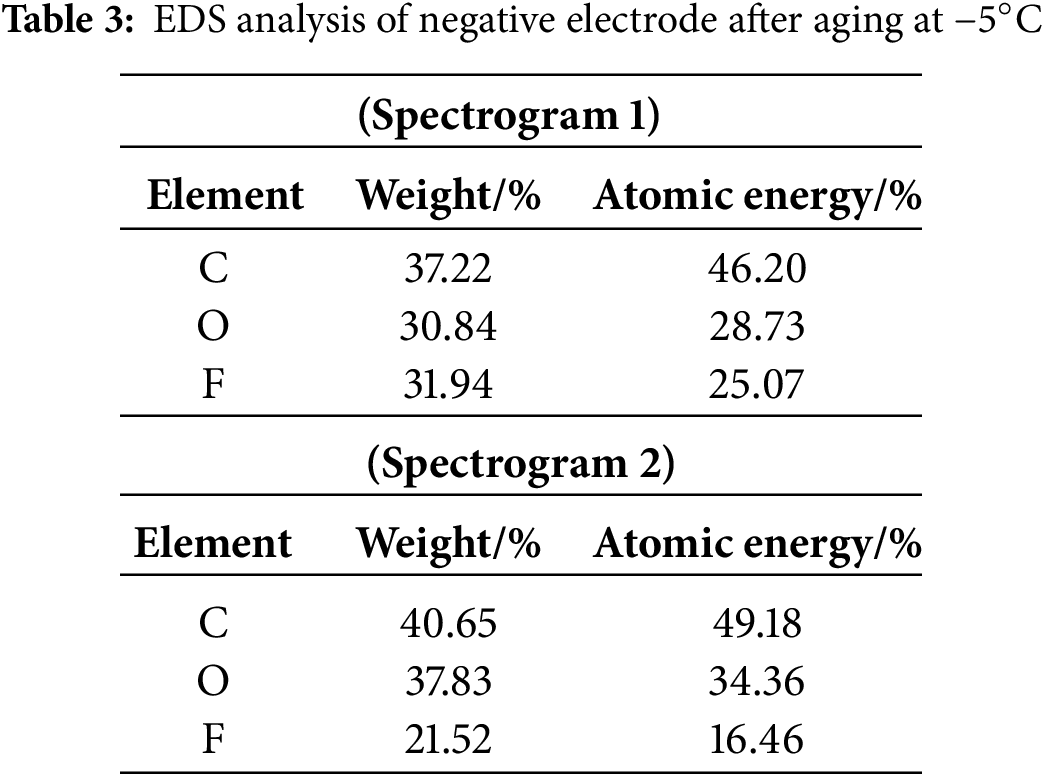
As indicated in Table 3, at −5°C, carbon decreased by 2.98% and oxygen by 5.63%. Conversely, elemental fluorine (F) increased by 8.61%. LiPF6 is the primary source of fluorine in batteries. The low temperature degrades the electrolyte and enhances lithium deposits. These lithium deposits significantly impact lithium-ion battery performance [27].
In the light of the negative electrode structure. Fig. 21 shows the XRD analysis performed on graphite samples at three different cryogenic conditions, (a) is the XRD pattern, (b) is the local enlarged view of 002 peak.
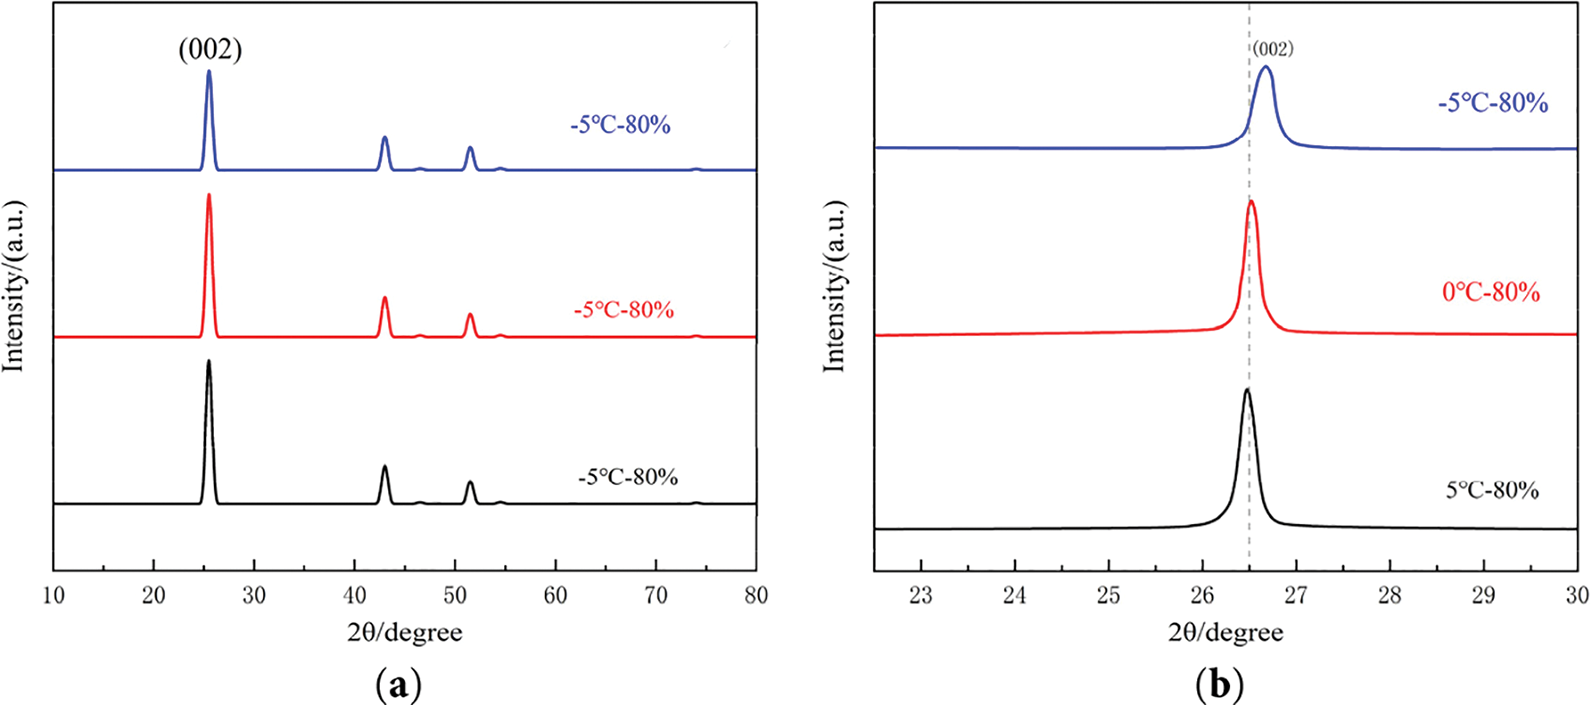
Figure 21: Graphite XRD test after different low temperature aging: (a) XRD pattern; (b) Local enlarged view of 002 peak
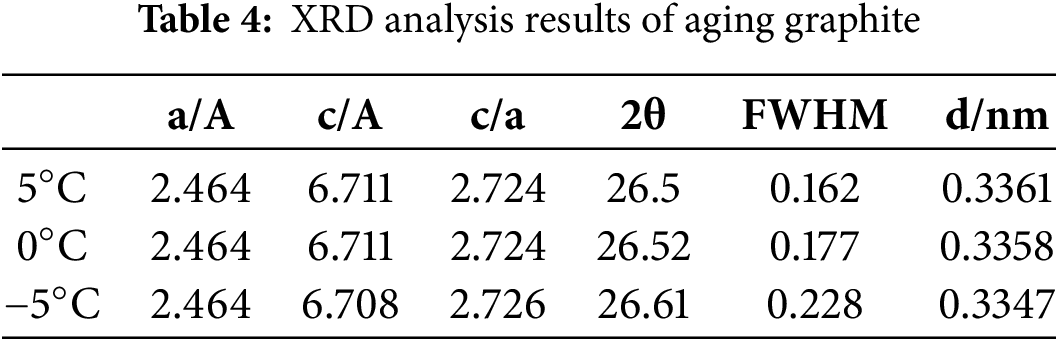
According to the XRD spectra in Fig. 21a, no additional peaks were observed in the graphite anode after ageing under the three low temperature conditions, indicating the absence of new crystalline phase formation. The characteristic 002 diffraction peak of graphite exhibited a pronounced rightward shift with decreasing temperature, as shown in the magnified view Fig. 21b. Concurrently, the peak broadened progressively, accompanied by a reduction in diffraction intensity. Quantitative analysis of the XRD patterns (Table 4) revealed an increase in full width at half maximum (FWHM), suggesting lattice distortion or crystallite size reduction. Additionally, variations in the unit cell parameters (a and c) further corroborated structural degradation of the graphite matrix under low temperature cycling.
According to Bragg’s Eq. (11), as the temperature decreased, the diffraction peak of graphite is shifted to the right and the diffraction angle 2θ increases, then the graphite crystal surface layer spacing d becomes smaller, leading to a decrease in the graphite’s capacity to accommodate lithium ions, resulting in a decrease in the anode capacity.
where
Eq. (12) represents the Scherrer equation [28], where D is the average thickness of the crystal in the direction perpendicular to the crystal face, k is the Scherrer constant, and B is the width of the peak at half height. The constant k is 0.89, and the integral breadth of the diffraction peaks is denoted by B, with k equal to 1. θ is half the diffraction angle, and γ is the wavelength of the X-rays. Utilizing Scherrer’s formula and the data from Table 4, it is evident that the thickness of the graphite crystal diminishes and its size decreases as the width of the half peak B of the diffraction peak increases. Concurrently, the diminished intensity of the diffraction peaks suggests a reduction in the crystallinity of graphite, indicating that cooling facilitates the exfoliation of the graphite material. This finding aligns with the results obtained from scanning electron microscopy.
4.2.4 Analysis of the Causes of Positive Electrode Performance Degradation
The positive capacity of LFP batteries will decrease at low temperatures. Following three instances of low temperature exposure, the positive surface of the LFP battery exhibits no color change or luminescence. Without magnification, the surfaces of the other compounds remain imperceptible. Consequently, we rely solely on SEM and XRD to detect microstructural and morphological alterations in the positive electrode.
In the light of the morphological analysis of positive electrodes. Fig. 22 shows the SEM images of the anode surface of LFP exposed to three different cryogenic environments.
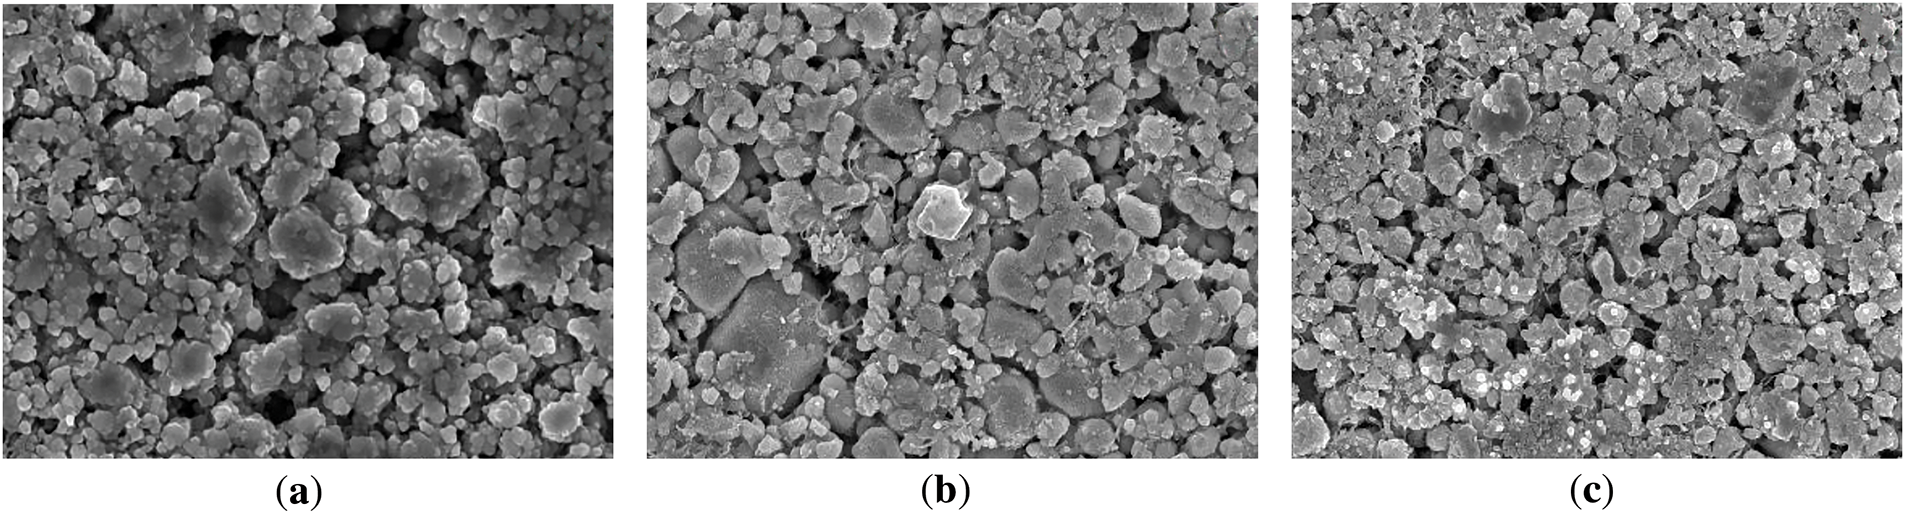
Figure 22: SEM photos of the positive electrode of the battery after aging in three different low temperature environments: (a) 5°C; (b) 0°C; (c) −5°C
The deposition of lithium on the surface of the LFP cathode increases with decreasing temperature, while the surface structure of the particles remains essentially unchanged. These results indicate that the decrease in capacity at low temperatures is primarily due to lithium deposition.
In the light of the positive electrode structure analysis. XRD tests were conducted on LFP materials aged at three distinct temperatures to examine the structure of the anode composed of LFP. The diffraction patterns obtained are displayed in Fig. 23.
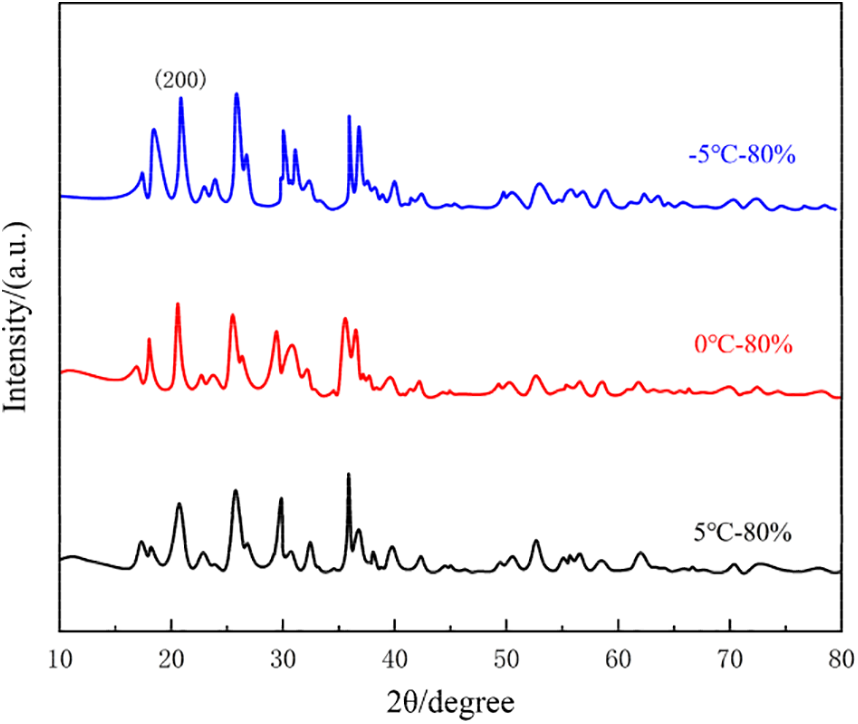
Figure 23: XRD pattern of positive electrode after aging at three different low temperatures
The XRD spectra of aged LFP exhibit a well-preserved pattern. The intensity of the 200 peak in-creases steadily as the temperature decreased, indicating an increase in the concentration of the iron phosphate phase. This suggests that there are more lithium vacancies in the anode at this point. Consequently, the active lithium ions are not returning to the anode but are being depleted at other locations, resulting in a decrease in the anode’s capacity.
4.3 Innovativeness of This Study and Comparison with Existing Work
(1) Since most of the current studies focus on a fixed low-temperature condition rather than experiments under multi-temperature conditions, the thesis selects three key low-temperature points (−5°C, 0°C, and 5°C) to conduct comparative experiments, revealing the performance change and degradation mechanism of batteries at different low temperatures, and in particular, finding that 0°C is the critical point for the rapid capacity degradation. Compared with previous studies that only tested at a single temperature point, this thesis provides more representative and practical temperature interval test data.
(2) Most of the current studies are conducted by a single characterization method of SEM or XRD, so this paper combines the in-depth analysis of the three physical characterization means, and comprehensively adopts three means of SEM, EDS and XRD to systematically analyze the changes in the morphology, structure, and composition of the positive and negative electrodes before and after aging. In particular, the negative electrode lithium dendrite deposition and lattice changes were verified from multiple perspectives, which was then confirmed as one of the main causes of capacity decline.
(3) Most of the current studies use the overall battery data for analysis, lacking microphysical analysis, so this paper adopts an analytical framework from macro performance to micro structure, and forms a more complete aging path modeling and validation system by studying the cycling performance of the battery (capacity, impedance) to the analysis of the half-cell performance to the change of material morphology and structure, and combines the EIS impedance fitting data and the Zview software modeling, the evolution law of each impedance component was quantitatively analyzed.
This study focuses on the causes of capacity degradation of LFP 18650 power batteries under three different low temperature conditions (5°C, 0°C, and −5°C). Lowering ambient temperature accelerates the capacity degradation of the battery, and the capacity of the battery is more affected by the temperature changes above 0°C, and less affected below 0°C. Through the test, it is concluded that the effect of low temperature environment on the negative electrode is greater than that on the positive electrode. When the temperature is lowered from 5°C to −5°C, the attenuation of the positive electrode is 3.4% and that of the negative electrode is 48%, which is much smaller than that of the negative electrode. Analysis of the Arrhenius equation and test results shows that the capacity of the battery declines rapidly at 0°C, with the battery approaching the end of its useful life after only 10 cycles. By combining SEM, EDS, and XRD testing methods, the micro-morphology images of the positive and negative electrodes were obtained. Comparison of the images reveals that the negative electrode graphite material is more susceptible to delamination in the temperature range of −5°C to 5°C. The main reason for the capacity decrease of the positive electrode at low temperatures may accelerate lithium deposition, as the decomposition of the positive electrode material promotes lithium accumulation on its surface. XRD tests of aged graphite show an increase in LFP content, indicating the generation of lithium vacancies in the cathode. This prevents active lithium from returning to the cathode and causes its migration to other locations, leading to cathode capacity reduction. In addition, the negative electrode retains a higher lithium content than the positive electrode, which promotes electrolyte decomposition and the formation of lithium deposits and SEI films. These deposits cover the negative electrode surface and increase the film impedance (Rs), thereby hindering lithium-ion deintercalation. Since the negative electrode capacity declines more severely at low temperatures, designing batteries for low temperature applications should allocate a larger capacity margin to the negative electrode.
Acknowledgement: Not applicable.
Funding Statement: This work was supported by the Zhuhai Science and Technology Program in the field of Social Development program of China under Grant ZH22036201210039PWC.
Author Contributions: Conceptualization, Jianwei Sun; Data curation, Jianwei Sun and Shikai Li; Formal analysis, Jianwei Sun; Funding acquisition, Jianwei Sun; Investigation, Jianwei Sun and Shikai Li; Methodology, Jianwei Sun; Project administration, Jianwei Sun; Resources, Jianwei Sun; Software, Jianwei Sun; Supervision, Shuqing Guo; Validation, Shuqing Guo; Visualization, Jianwei Sun; Writing—original draft, Jianwei Sun; Writing—review & editing, Jianwei Sun. All authors reviewed the results and approved the final version of the manuscript.
Availability of Data and Materials: All data generated or analyzed during this study are included in the published article.
Ethics Approval: Not applicable.
Conflicts of Interest: The authors declare no conflicts of interest to report regarding the present study.
References
1. Naseri T, Mousavi SM. Treatment of spent lithium iron phosphate (LFP) batteries. Curr Opin Green Sustain Chem. 2024;47:100906. doi:10.1016/J.COGSC.2024.100906. [Google Scholar] [CrossRef]
2. Belgibayeva A, Rakhmetova A, Rakhatkyzy M, Kairova M, Mukushev I, Issatayev N, et al. Lithium-ion batteries for low-temperature applications: limiting factors and solutions. J Power Sources. 2023;557:232550. doi:10.1016/J.JPOWSOUR.2022.232550. [Google Scholar] [CrossRef]
3. Zheng S, Khan N, Worku BE, Wang B. Review and prospect on low-temperature lithium-sulfur battery. Chem Eng J. 2024;484:149610. doi:10.1016/J.CEJ.2024.149610. [Google Scholar] [CrossRef]
4. Wätzold F, Schlösser A, Leistikow M, Kowal J. Design analysis of 26650 and 18650 LFP cells for high power and low temperature use cases. Batteries. 2025;11(1):38. doi:10.3390/BATTERIES11010038. [Google Scholar] [CrossRef]
5. Popović O, Rupar V, Praštalo Ž, Aleksandrović S, Milisavljević V. Testing of NMC and LFP Li-ION cells for surface temperature at various conditions. Case Stud Therm Eng. 2024;61(1):104930. doi:10.1016/J.CSITE.2024.104930. [Google Scholar] [CrossRef]
6. Shi X, Li G, Zhang R, Esan OC, Huo X, Wu Q, et al. Operation of rechargeable metal-ion batteries in low-temperature environments. Renew Sustain Energy Rev. 2024;189(3):113861. doi:10.1016/J.RSER.2023.113861. [Google Scholar] [CrossRef]
7. Sun S, Wang K, Hong Z, Zhi M, Zhang K, Xu J. Electrolyte design for low-temperature Li-metal batteries: challenges and prospects. Nano-Micro Lett. 2024;16(1):35. doi:10.1007/s40820-023-01245-9. [Google Scholar] [PubMed] [CrossRef]
8. Zhang X, Li Z, Luo L, Fan Y, Du Z. A review on thermal management of lithium-ion batteries for electric vehicles. Energy. 2022;238:121652. doi:10.1016/J.ENERGY.2021.121652. [Google Scholar] [CrossRef]
9. Worku BE, Zheng S, Wang B. Review of low-temperature lithium-ion battery progress: new battery system design imperative. Int J Energy Res. 2022;46(11):14609–26. doi:10.1002/ER.8194. [Google Scholar] [CrossRef]
10. Senol M, Bayram IS, Naderi Y, Galloway S. Electric vehicles under low temperatures: a review on battery performance, charging needs, and power grid impacts. IEEE Access. 2023;11:39879–912. doi:10.1109/access.2023.3268615. [Google Scholar] [CrossRef]
11. Rauhala T, Jalkanen K, Romann T, Lust E, Omar N, Kallio T. Low-temperature aging mechanisms of commercial graphite/LiFePO4 cells cycled with a simulated electric vehicle load profile—a post-mortem study. J Energy Storage. 2018;20:344–56. doi:10.1016/j.est.2018.10.007. [Google Scholar] [CrossRef]
12. Kong D, Zhao H, Ping P, Zhang Y, Wang G. Effect of low temperature on thermal runaway and fire behaviors of 18650 lithium-ion battery: a comprehensive experimental study. Process Saf Environ Prot. 2023;174:448–59. doi:10.1016/J.PSEP.2023.04.017. [Google Scholar] [CrossRef]
13. Wang X, Zhang Y, Ni H, Lv S, Zhang F, Zhu Y, et al. Influence of different ambient temperatures on the discharge performance of square ternary lithium-ion batteries. Energies. 2022;15(15):5348. doi:10.3390/EN15155348. [Google Scholar] [CrossRef]
14. Zeng Z. Preparation and electrochemical performance of NiCo2S4 nanoelectrode materials. Ferroelectrics. 2023;615:427–36. [Google Scholar]
15. Ma C, Qiu Z, Shan B, Song Y, Zheng R, Feng W, et al. The optimization of the electrolyte for low temperature LiFePO4-graphite battery. Mater Lett. 2024;356:135594. doi:10.1016/J.MATLET.2023.135594. [Google Scholar] [CrossRef]
16. Siani AG, Mousavi BM, Rismani H, Saeedimoghadam M. State of health estimation of lithium-ion batteries based on the CC-CV charging curve and neural network. IETE J Res. 2023;69(5):2950–63. doi:10.1080/03772063.2021.1908853. [Google Scholar] [CrossRef]
17. Du Y, Shironita S, Asakura D, Hosono E, Sone Y, Miseki Y, et al. Post-mortem analysis of the Li-ion battery with charge/discharge deterioration in high-and low-temperature environments. Electrochim Acta. 2024;473(6):143421. doi:10.1016/J.ELECTACTA.2023.143421. [Google Scholar] [CrossRef]
18. Mostafa MYA, Mostafa A, Ibrahim H, Rahman MA, Saxena KK, Akram SV, et al. Natural ageing systems of 6063 Al-alloys using diverse XRD ways. Adv Mater Process Technol. 2024;10(2):541–53. doi:10.1080/2374068x.2023.2176078. [Google Scholar] [CrossRef]
19. Feinauer M, Mehrens WM, Hölzle M, Waldmann T. Temperature-driven path dependence in Li-ion battery cyclic aging. J Power Sources. 2024;594:233948. doi:10.1016/J.JPOWSOUR.2023.233948. [Google Scholar] [CrossRef]
20. Cheng W, Zhao M, Lai Y, Wang X, Liu H, Xiao P, et al. Recent advances in battery characterization using in situ XAFS, SAXS, XRD, and their combining techniques: from single scale to multiscale structure detection. Exploration. 2024;4(1):20230056. doi:10.1002/EXP.20230056. [Google Scholar] [PubMed] [CrossRef]
21. Wang J, Yu D, Sun X, Wang H, Li J. Anodes for low-temperature rechargeable batteries. eScience. 2024;4(5):100252. doi:10.1016/J.ESCI.2024.100252. [Google Scholar] [CrossRef]
22. Huang K, Wang ZX, Liu SQ. Principle and key technology of lithium-ion battery. J Power Sources. 2008;184:553–8. [Google Scholar]
23. Zhao T, Mahandra H, Marthi R, Ji X, Zhao W, Chae S, et al. An overview on the life cycle of lithium iron phosphate: synthesis, modification, application, and recycling. Chem Eng J. 2024;485(23):149923. doi:10.1016/J.CEJ.2024.149923. [Google Scholar] [CrossRef]
24. Adaikkappan M, Sathiyamoorthy N. Modeling, state of charge estimation, and charging of lithium-ion battery in electric vehicle: a review. Int J Energy Res. 2022;46(3):2141–65. doi:10.1002/ER.7339. [Google Scholar] [CrossRef]
25. Wang Y, Tang Y, Xie C, Xia XP. The applications of the electrochemical impedance spectroscopy in the materials researches. Mater Rep. 2011;25(13):5–9. [Google Scholar]
26. Kohout J. Modified Arrhenius equation in materials science, chemistry and biology. Molecules. 2021;26(23):7162. doi:10.3390/MOLECULES26237162. [Google Scholar] [PubMed] [CrossRef]
27. Murdock BE, Toghill KE, Tapia-Ruiz N. A perspective on the sustainability of cathode materials used in lithium-ion batteries. Adv Energy Mater. 2021;11(39):2102028. doi:10.1002/AENM.202102028. [Google Scholar] [CrossRef]
28. Ulhakim MT, Sukarman S, Khoirudin K, Fazrin N, Irfani T, Hakim A. Determining the crystallite size of TiO2/EG-water XRD data using the Scherrer equation. Indones J Appl Phys. 2024;14(1):141–50. doi:10.13057/ijap.v14i1.79195. [Google Scholar] [CrossRef]
Cite This Article
 Copyright © 2025 The Author(s). Published by Tech Science Press.
This work is licensed under a Creative Commons Attribution 4.0 International License , which permits unrestricted use, distribution, and reproduction in any medium, provided the original work is properly cited.
 Downloads
 Citation Tools