
 Submit a Paper
 Propose a Special lssue
 Open Access
ARTICLE
Defect Identification Method of Power Grid Secondary Equipment Based on Coordination of Knowledge Graph and Bayesian Network Fusion
State Grid Southwest Branch Dispatch Control Center, Chengdu, 610000, China
* Corresponding Author: Jun Xiong. Email:
Energy Engineering 2026, 123(1), 13 https://doi.org/10.32604/ee.2025.069438
Received 23 June 2025; Accepted 04 September 2025; Issue published 27 December 2025
 View Full Text
 Download PDF
Abstract
The reliable operation of power grid secondary equipment is an important guarantee for the safety and stability of the power system. However, various defects could be produced in the secondary equipment during long-term operation. The complex relationship between the defect phenomenon and multi-layer causes and the probabilistic influence of secondary equipment cannot be described through knowledge extraction and fusion technology by existing methods, which limits the real-time and accuracy of defect identification. Therefore, a defect recognition method based on the Bayesian network and knowledge graph fusion is proposed. The defect data of secondary equipment is transformed into the structured knowledge graph through knowledge extraction and fusion technology. The knowledge graph of power grid secondary equipment is mapped to the Bayesian network framework, combined with historical defect data, and introduced Noisy-OR nodes. The prior and conditional probabilities of the Bayesian network are then reasonably assigned to build a model that reflects the probability dependence between defect phenomena and potential causes in power grid secondary equipment. Defect identification of power grid secondary equipment is achieved by defect subgraph search based on the knowledge graph, and defect inference based on the Bayesian network. Practical application cases prove this method’s effectiveness in identifying secondary equipment defect causes, improving identification accuracy and efficiency.Keywords
Modern power systems are continuously increasing in scale and complexity. In this context, the stability and reliability of secondary equipment must be ensured. Relay protection devices and safety/stability control systems are key components. Their performance directly impacts the safe operation of power systems [1]. Long-term operation may cause various defects in secondary equipment. Relay protection device malfunctions and communication failures are common examples. Such problems not only disrupt normal power system operation but may also trigger major safety incidents [2,3].
At present, there has been some research on the identification of defects in power grid secondary equipment. Ref. [4] employs the intelligent substation profile to integrate secondary equipment alarm characteristics, designs a node-based graph neural network with information characterization strategy, constructs the graph database, and achieves fault localization through node topology and feature analysis. Ref. [5] investigated intelligent substation secondary equipment failures. Through analysis of fault characteristics and application of generalized variable ratio theory, a diagnostic model for current/voltage circuit faults was established. Ref. [6] uses an improved particle swarm optimization algorithm to adjust the parameters of a one-class support vector machine, which in turn constructs an anomalous data flow detection model. Ref. [7] constructs a protection misoperation defect set based on the analysis of field data and proposes a relay protection system using fault tree analysis method. Ref. [8] analyzes substation relay protection data to establish autonomous inspection and intercalibration mechanisms, thereby detecting and locating equipment/circuit abnormalities. However, the above methods are mainly aimed at the identification of single defects, and it is difficult to deal with complex defect feature information.
Deep implicit knowledge embedded in massive random data can be extracted by artificial intelligence algorithms. Deep feature mining is thereby enabled. Application to power equipment defect identification is now being implemented progressively [8,9]. Ref. [10] generates the basic events of the fault tree based on the real-time operation data of relay protection and combines them with Bayesian formulas to realize the localization and tracking of fault causes. Ref. [11] models defect events by association rule mining algorithms and builds a knowledge base of event features based on the association rule results, so as to discover abnormal equipment actions to achieve defect recognition. Ref. [12] extracts three-phase current data features for fault classification/localization, proposing a CNN-BiLSTM integrated microgrid relay protection fault diagnosis method. Ref. [13] describes the application of various deep learning algorithms in the identification of power equipment defects, such as through convolutional neural networks, target detection algorithms and other techniques to achieve efficient detection of power equipment defects. Ref. [14] improved the Bayesian network approach based on the semi-tensor product by introducing protection and circuit breaker action moment confidence and action state confidence. However, due to the large number and high relevance of abnormal alarm information of power grid secondary equipment, it is difficult for traditional alarm techniques to effectively obtain key alarm information and precisely locate defects.
Power grid secondary equipment defect data comes from a wide range of sources, mainly including structured data and unstructured data. These data have various formats, complex contents and rich information, which are difficult to be directly stored and processed in traditional databases [15–17]. The current method is difficult to comprehensively explore the effective components of various types of information when processing data, which may adversely affect the accuracy of defect recognition. In addition, the existing defect recognition model has deficiencies such as insufficient data utilization and limited real-time updating capability in real-time defect data processing and defect cause reasoning, which makes it difficult to accurately obtain the complex relationship and probabilistic influence between defect phenomena and multi-layered causes. To this end, a knowledge graph and Bayesian network fusion of power grid secondary equipment defect recognition strategy is proposed. The diverse-source, complex-structure defect data of power grid secondary equipment is first transformed into a structured knowledge graph through knowledge extraction and fusion. Based on the structural features and semantic connotations of the knowledge graph, a mapping strategy to Bayesian network is proposed. Entities and relationships in the knowledge graph are converted into nodes and directed connections respectively in the Bayesian network. Through integration of historical defect data statistical analysis with the Noisy-OR model, prior and conditional probabilities of the Bayesian network are properly assigned, constructing a correlation-revealing model between defect phenomena and potential causes.
Defect identification in power grid secondary equipment is implemented through knowledge graph-based subgraph search and Bayesian network inference. Experimental results demonstrate that defect phenomena can be effectively retrieved using the knowledge graph, with potential causes quickly located. The probabilistic inference mechanism of Bayesian network enables conditional probability distribution calculation for each potential defect cause, significantly improving identification accuracy and efficiency.
The main contributions of this paper are summarized as follows:
1. Compared with traditional fault tree-Bayesian network defect identification methods, the defect identification method for secondary power grid equipment described in this paper integrates knowledge graphs and Bayesian networks, enabling the integration of structured and unstructured defect data. Furthermore, defect subgraph retrieval using knowledge graphs can avoid wasting Bayesian network computing resources.
2. Simulation experiments were conducted on historical data from secondary equipment in a regional power grid. The results showed that the model proposed in this paper can help field personnel quickly identify and eliminate defects, and significantly improve the accuracy of defect identification compared with existing models.2 Modeling.
2.1 Construction of a Knowledge Graph of Defects in Secondary Equipment
The secondary equipment failure data in the power system exhibits structured, semi-structured and unstructured characteristics. Among them, structured data usually comes from equipment operation records, maintenance logs, etc., with a clear format and organization; semi-structured data such as XML configuration files, although with a certain format specification, but its rigor is relatively limited; unstructured data including equipment defects text description, log files, etc., the format is not fixed and difficult to analyze directly. Therefore, knowledge graphing can be used to extract heterogeneous data related to secondary equipment defects and organize them into structured and intuitively visual expressions, thus describing the logical relationship between events in secondary equipment defects. The process of constructing the knowledge graph of power grid secondary equipment defects is shown in Fig. 1, which mainly includes three parts: defect knowledge modeling, knowledge extraction and knowledge fusion. First, according to the needs of defect diagnosis, the ontology of defect knowledge is established, including the types of fault knowledge, attributes, and types of relationships. The secondary equipment defect knowledge graph covers the equipment and its constituent parts as entities, and details the specific manifestations of defects, causes and corresponding treatment means as attributes, and the relationship between entities and attributes can be categorized as whole-local, defect phenomenon, cause and effect, measures, etc.
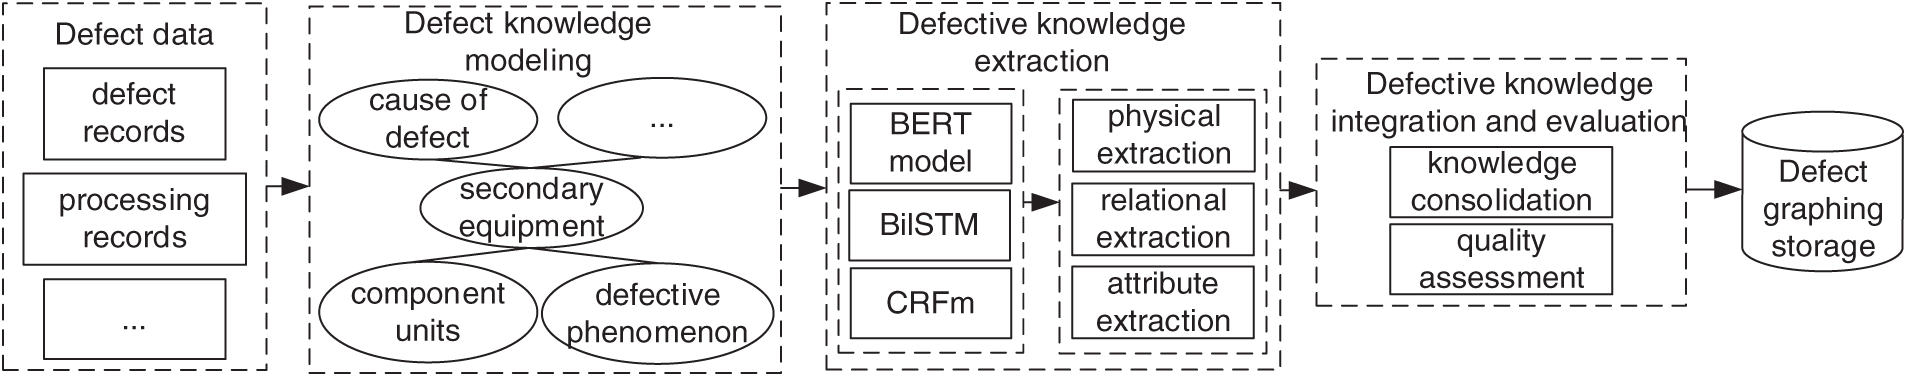
Figure 1: Construction process of defect knowledge graph of power grid secondary equipment
Knowledge extraction refers to the extraction of knowledge elements from the historical defect data of secondary equipment by automated or semi-automated means through the analysis of such data using rules or machine learning techniques. The core components of a knowledge unit are entities, associations between entities, and corresponding characterizations. For structured defective data, it can be directly transformed into the form of “entity/attribute-relationship-entity/attribute”, which forms the basic unit of knowledge graph. For the unstructured or semi-structured information embedded in the historical defect data of power grid secondary equipment, we adopt the bidirectional encoded characterization (BERT) technique based on the Transformer architecture. On this basis, a combination of BERT and Bidirectional Long Short-Term Memory Network (BiLSTM) is used to extract the knowledge content from the above information. First, BERT is utilized to pre-train the original defective text into a vector representation containing rich semantic information, capturing the contextual semantic relationship of each word in the text sequence. The word vectors are processed using BiLSTM to extract contextually relevant features, and a feature matrix is constructed accordingly. Subsequently, this feature matrix is used as input data for Conditional Random Fields (CRFs) for training. During the training process, the CRF generates semantic structure labels corresponding to entities, relations and attributes by calculating transfer probabilities.
Knowledge fusion aims to address the inconsistency of multiple representations of the same entity existing in multiple data sources. For example, “Capture Plugin” and “Capture Board” correspond to “Capture Module”. When dealing with manually written defect reports and defect handling experiences, where irregularities in terminology are more common, deep learning can be used to convert defect entities into word vectors and calculate the similarity between these word vectors as a means of evaluating the correlation between the defect entities and providing a basis for analyzing and processing. When the similarity exceeds a set threshold, the entity designation is unified to form a standardized entity name. Power grid secondary equipment defects knowledge graph storage will be stored in the form of “entity/attribute-relationship-entity/attribute” ternary group, as shown in Fig. 2. Neo4j adopts the attribute graph model to store the data, and through the nodes, relationships and attributes to visually represent the relationship between defective equipment, phenomena and causes. Neo4j uses the attribute graph model to store data, which visually represents the correlation between defective devices, phenomena and causes through nodes, relationships and attributes.
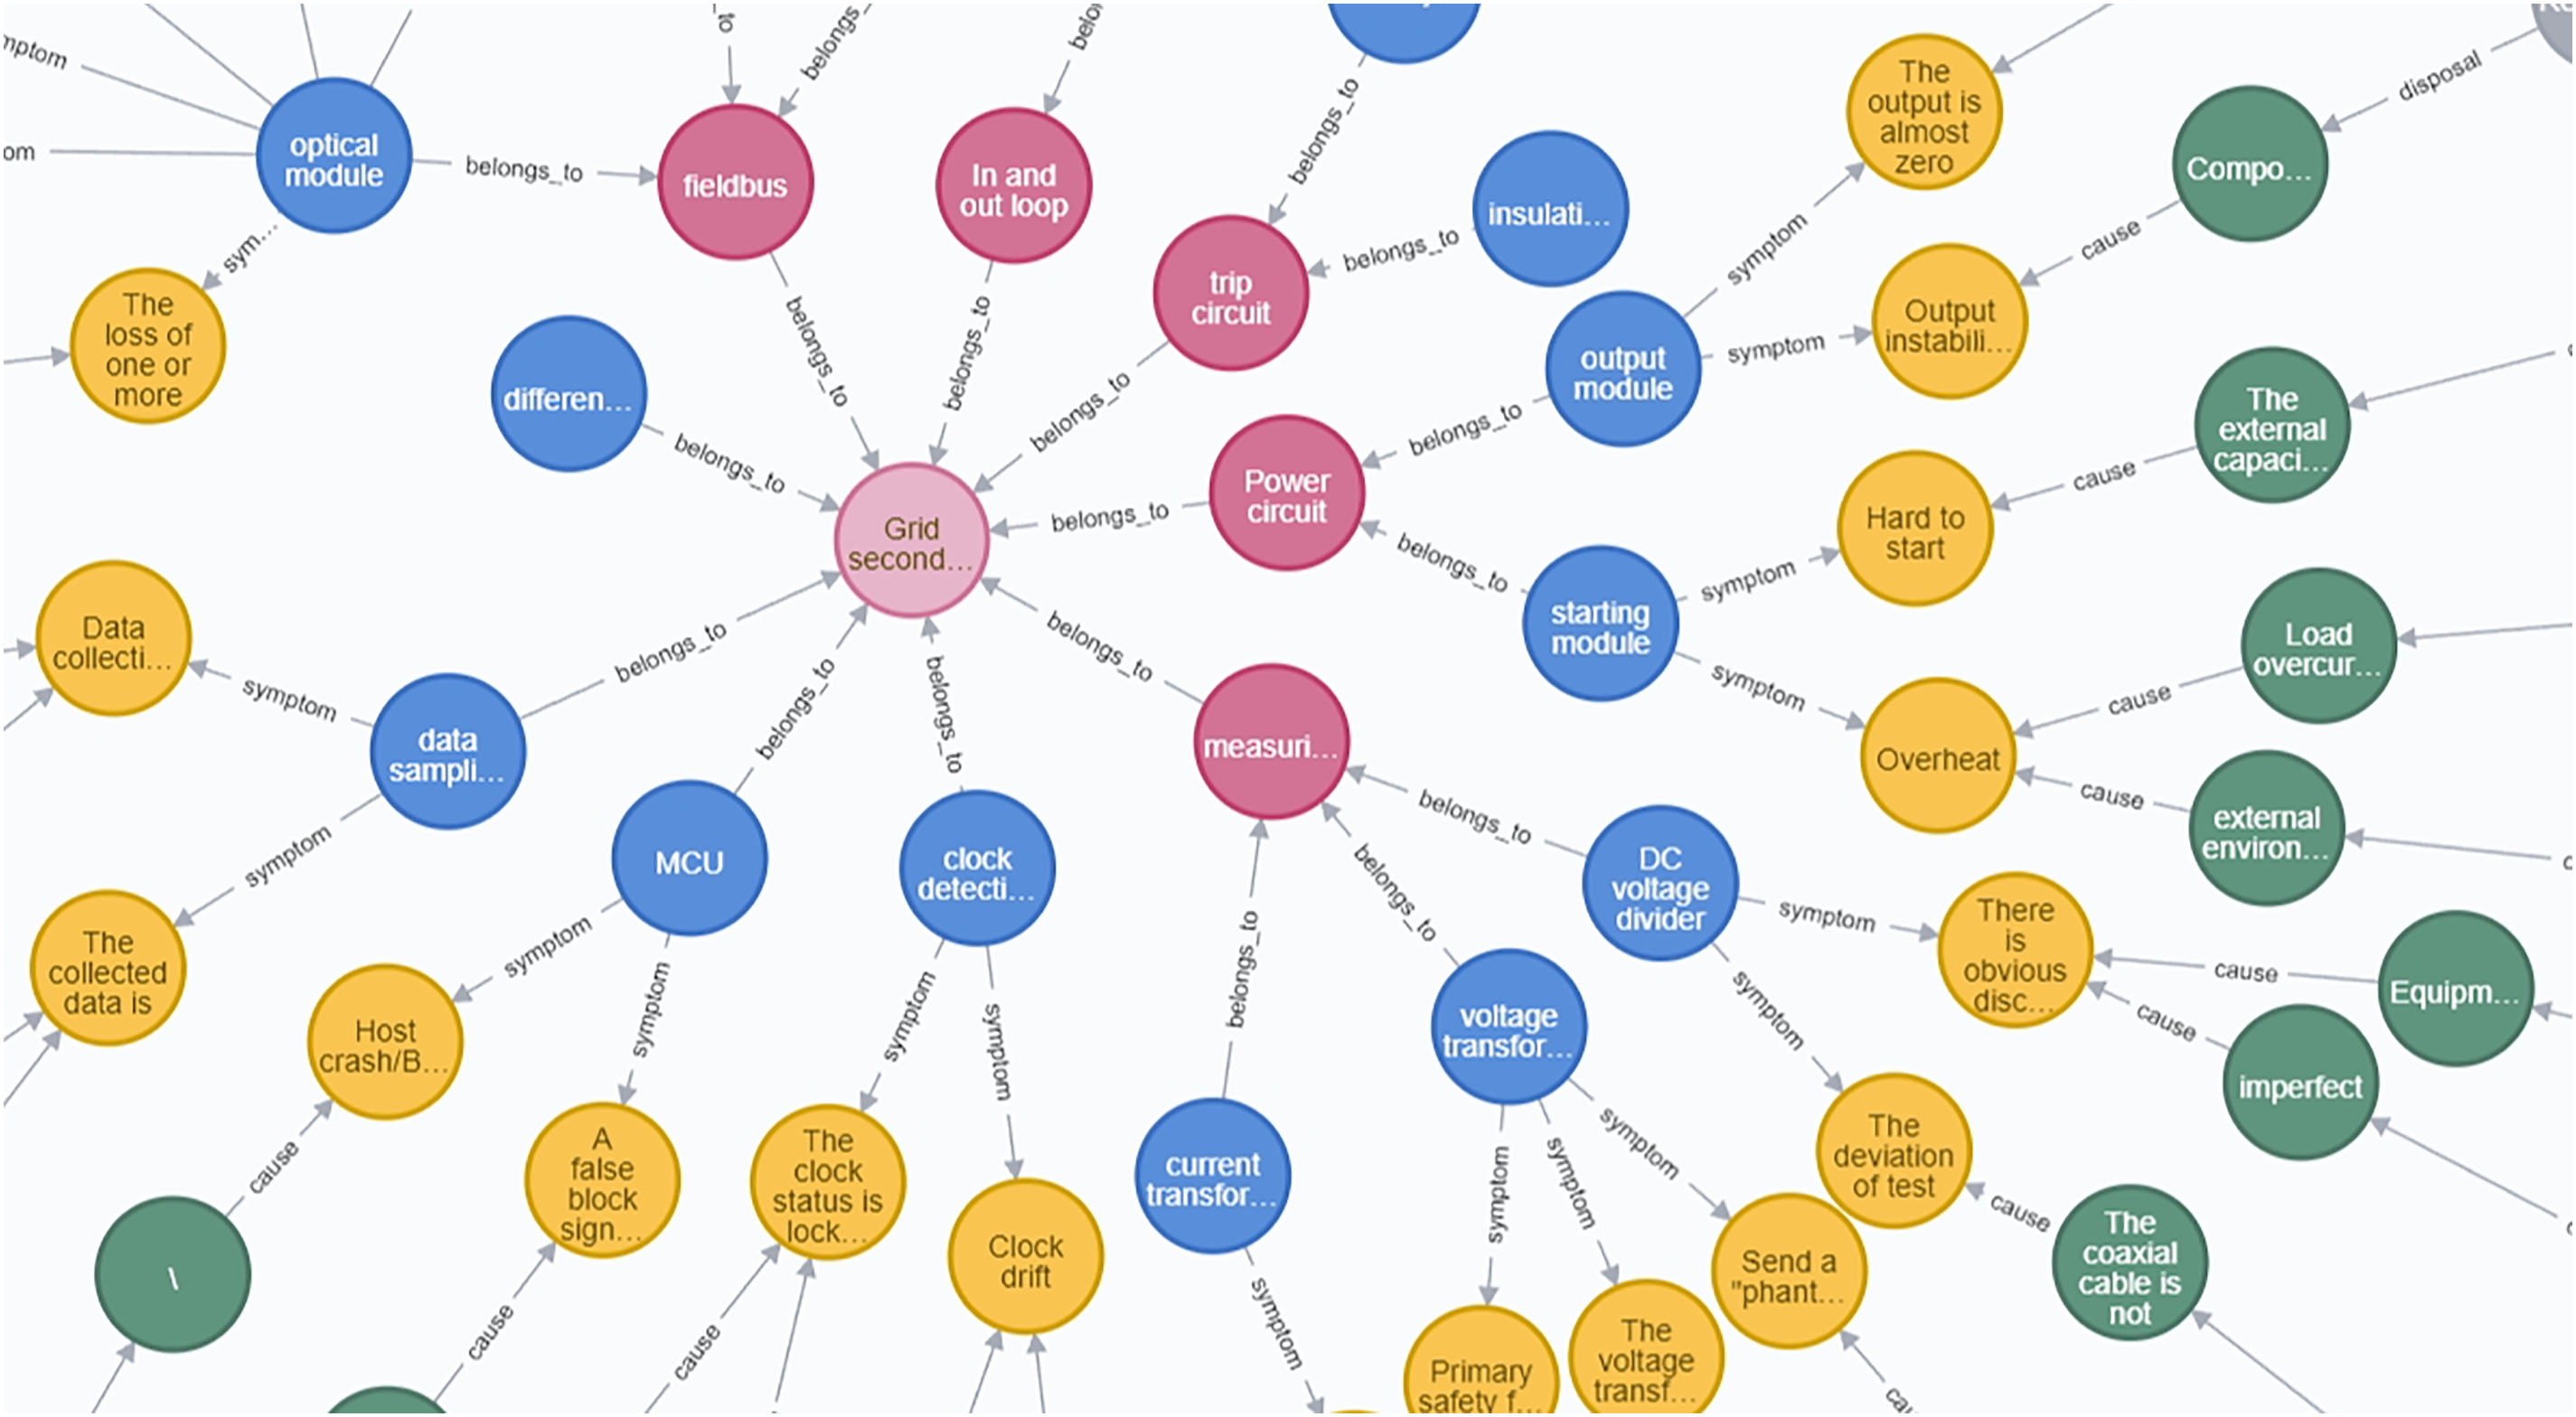
Figure 2: Power grid secondary equipment defect knowledge graph
2.2 Construction of Bayesian Networks for Defects in Secondary Equipment
2.2.1 Mapping of Knowledge Graph to Bayesian Network
The knowledge graph facilitates efficient discovery of multiple underlying root causes for defects in secondary equipment. However, the staff still needs to check all the defect causes one by one, which is less efficient. Therefore, by constructing a Bayesian network corresponding to the knowledge graph of power grid secondary equipment, reflecting the probabilistic influence between defect phenomena and causes, the most likely defect causes of defects occurring are determined through probabilistic calculations. In the Bayesian network structure, the joint probability distribution of the nodes can be decomposed into the form of a product of conditional probability tables, implying that the probability distribution of each node is only constrained by its immediate parent node. In addition, Bayesian networks follow the Markov property, i.e., when the state of a node’s parent is known, that node will exhibit conditional independence from other nodes that are not its direct parent, denoted as:
where
In a Bayesian network,
After determining the conditional probabilities of all nodes, the joint probability distribution of the simultaneous occurrence of these nodes can be derived:
In defect identification, Bayesian networks mainly use backward inference, when a defective phenomenon is known to occur, the posterior probability of the cause of the potential defect is deduced inversely using the Bayesian formula for the posterior probability:
At the level of structure construction, Bayesian network has certain similarity with knowledge graph. The entities of the knowledge graph and the attributes such as defect causes and phenomena correspond to the nodes of the Bayesian network, and the relationship between the entities/attributes and the entities/attributes in the knowledge graph can be transformed into directed edges, as shown in Fig. 3. For a particular defect, it is first necessary to locate the device or component related to the defect in the knowledge graph of defects of power grid secondary equipment through feature extraction and entity matching, and extract the corresponding defect subgraph. Subsequently, using the knowledge graph, the secondary equipment defect entities in the defect subgraph are mapped to the node structure of a Bayesian network. Where defect cause I and defect cause II are used as root and intermediate nodes, respectively, and defect phenomena are used as leaf nodes. In addition, entity/attribute to entity/attribute associations are transformed into directed connections of the Bayesian network.
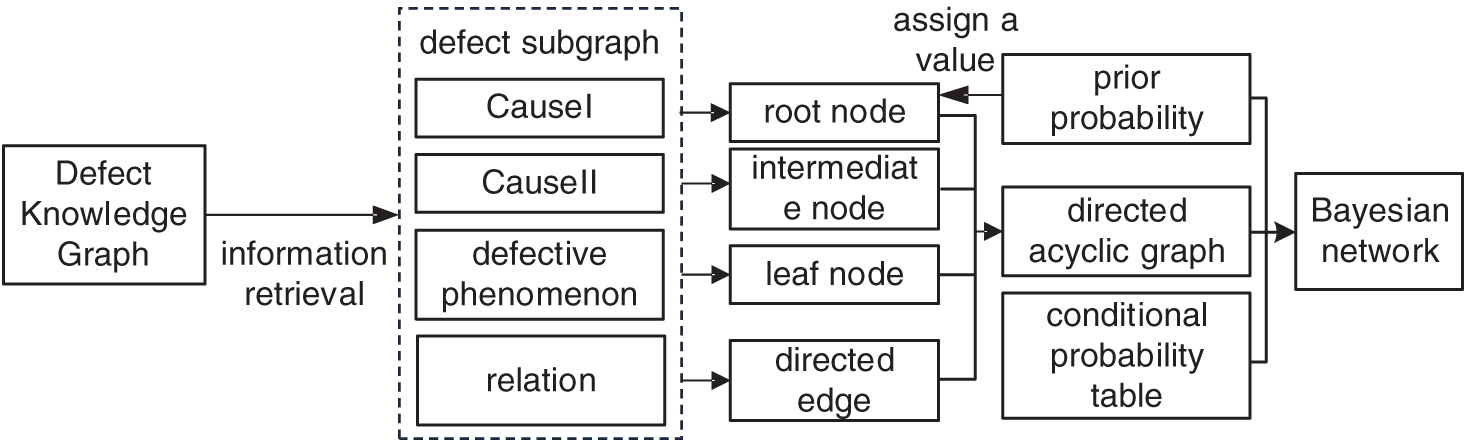
Figure 3: Bayesian networks for secondary equipment defects in power grids
2.2.2 Bayesian Network Parameter Setting
The parameter setting of Bayesian network models primarily involves determining prior probabilities and conditional probabilities. Defect prior probabilities reflect the historical defect status of secondary equipment in power grids and serve as an important basis for identifying current defect types. Defect prior probabilities can be determined by calculating the proportion of the target defect cause in the entire set of defect examples. Considering that conditional probabilities cannot be expressed using precise mathematical formulas or numerical values, triangular membership functions are selected. Through the experience and knowledge of experts, an appropriate fuzzy number for the directed edge is provided. The mean area method is used to convert this into a precise numerical value, thereby determining the conditional probabilities between nodes.
Triangular fuzzy numbers are used to describe the fuzziness of the association strength between nodes, and their membership function form is as follows:
In the formula,
In order to determine the strength of node association, it is necessary to consult multiple experts. Assuming there are s experts, the fuzzy number of node
At the same time, the evaluation capabilities of experts are taken into consideration. Based on the position, professional title, and educational background of each expert, the evaluation weight for each expert is determined using the following formula:
In the formula,
Use the mean area method to convert this fuzzy number into an exact numerical value:
The above method can be used to obtain the fuzzy probability of the association strength between a child node and its parent node. However, when the Bayesian network is large and there are many parent nodes, the number of parameters requiring expert evaluation will increase exponentially. Therefore, the Noisy-OR model is used to establish the conditional probability table.
For a child node with N parent nodes, 2N independent conditional probability parameters need to be obtained when calculating its posterior probability, but in practice, it is usually difficult to collect all of this information, especially the probability of defects occurring under various combinations of causes is difficult to count. In this case, assuming that the parent nodes are independent in their influence, the Bayesian network nodes can be regarded as Noisy-OR nodes. Let
where
With the adoption of the Noisy-OR node, it is only necessary to define the probability of the strength of association between a single cause and a defective phenomenon, rather than having to explicitly specify the specific probability of occurrence of a defective phenomenon for all combinations of potential causes. This model assumes that the effects of each cause on the outcome are independent, and therefore the effects of individual causes can be coupled to derive the probability of defective phenomena for different combinations of causes.
Defect recognition of power grid secondary equipment based on knowledge graph and Bayesian network includes 2 parts: defect recognition based on knowledge graph and defect recognition by Bayesian network. Defect recognition based on knowledge graph is based on matching the current equipment defect information with the defect records stored in the knowledge graph line by line and outputting the corresponding possible defect causes, as shown in Fig. 4. The input data can be either defective text or defective phenomena. When the input is defective text, entity extraction is required for the text; when the input is defective phenomenon entity, entity extraction is not required and then entity alignment is performed for the defective entity. The defect phenomenon entity obtained is used as input for defect information query, and the subgraph search is performed on the knowledge graph through Cypher statement to match the defect information with higher similarity in the knowledge graph and output the defect subgraph.
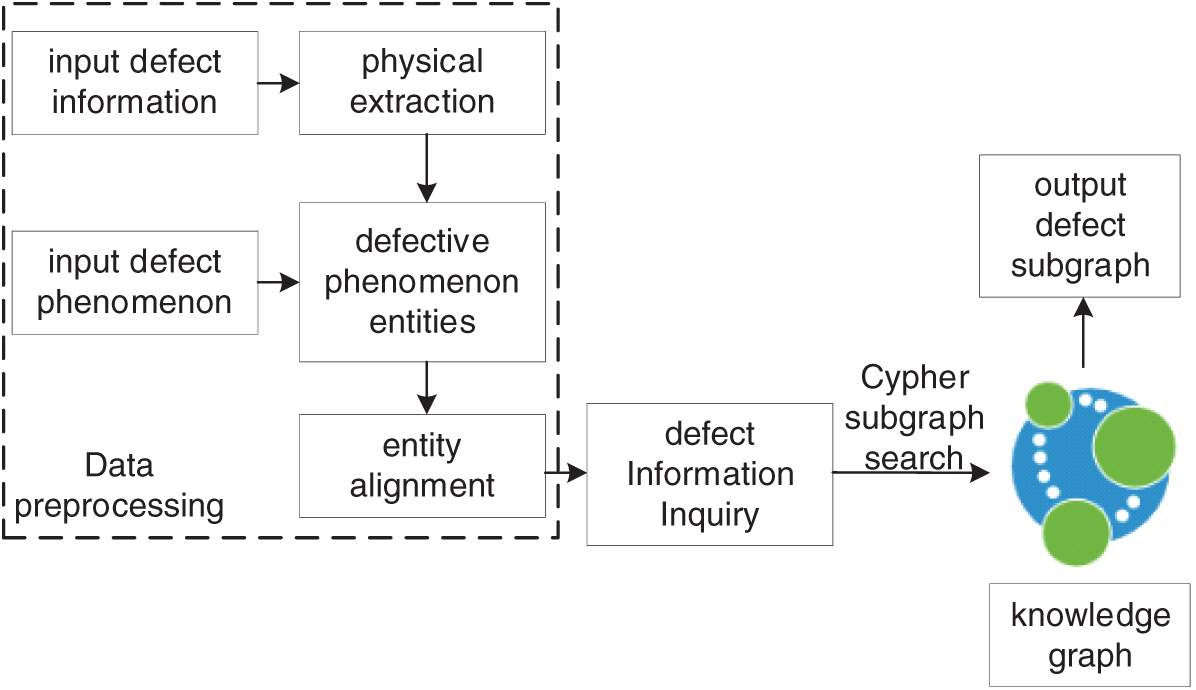
Figure 4: Defect identification process based on knowledge graph
The input data can be either defective text or defective phenomena. When the input is defect text Bayesian network based defect recognition for power grid secondary equipment is tasked with reasoning about the most probable causes of defects on the basis of a knowledge graph to increase the efficiency of defect processing. Fig. 5 illustrates the defect recognition process of power grid secondary equipment based on Bayesian network. First, the directed acyclic graph corresponding to the defect subgraph is constructed according to the mapping rules of the knowledge graph to the Bayesian network. Subsequently, based on the historical defect data statistics of the power grid secondary equipment and combined with the Noisy model, the a priori probabilities and conditional probabilities in the Bayesian network are accurately assigned to initialize the network. The historical information is used as the evidence node, and the input defect information is used as the query node, and the a posteriori probability of each possible defect cause node of the power grid secondary equipment is obtained by inference in the Bayesian network, and the most probable defect cause is used as the inference result; the adjustment and maintenance of the equipment is carried out with reference to the inference result. If the equipment is still in the alarm stage or has not been restored to normal, the cause is excluded and the identification information continues to be obtained, and they are used together as evidence nodes after the knowledge graph query to update the identification results. Based on knowledge graph and Bayesian network, the defect recognition method of power grid secondary equipment can not only quickly and accurately identify the causes of defects of power grid secondary equipment, but also gradually narrow the range of defect causes according to the actual operating state of the equipment through dynamic updating and iterative optimization mechanism, which further improves the accuracy of diagnosis.
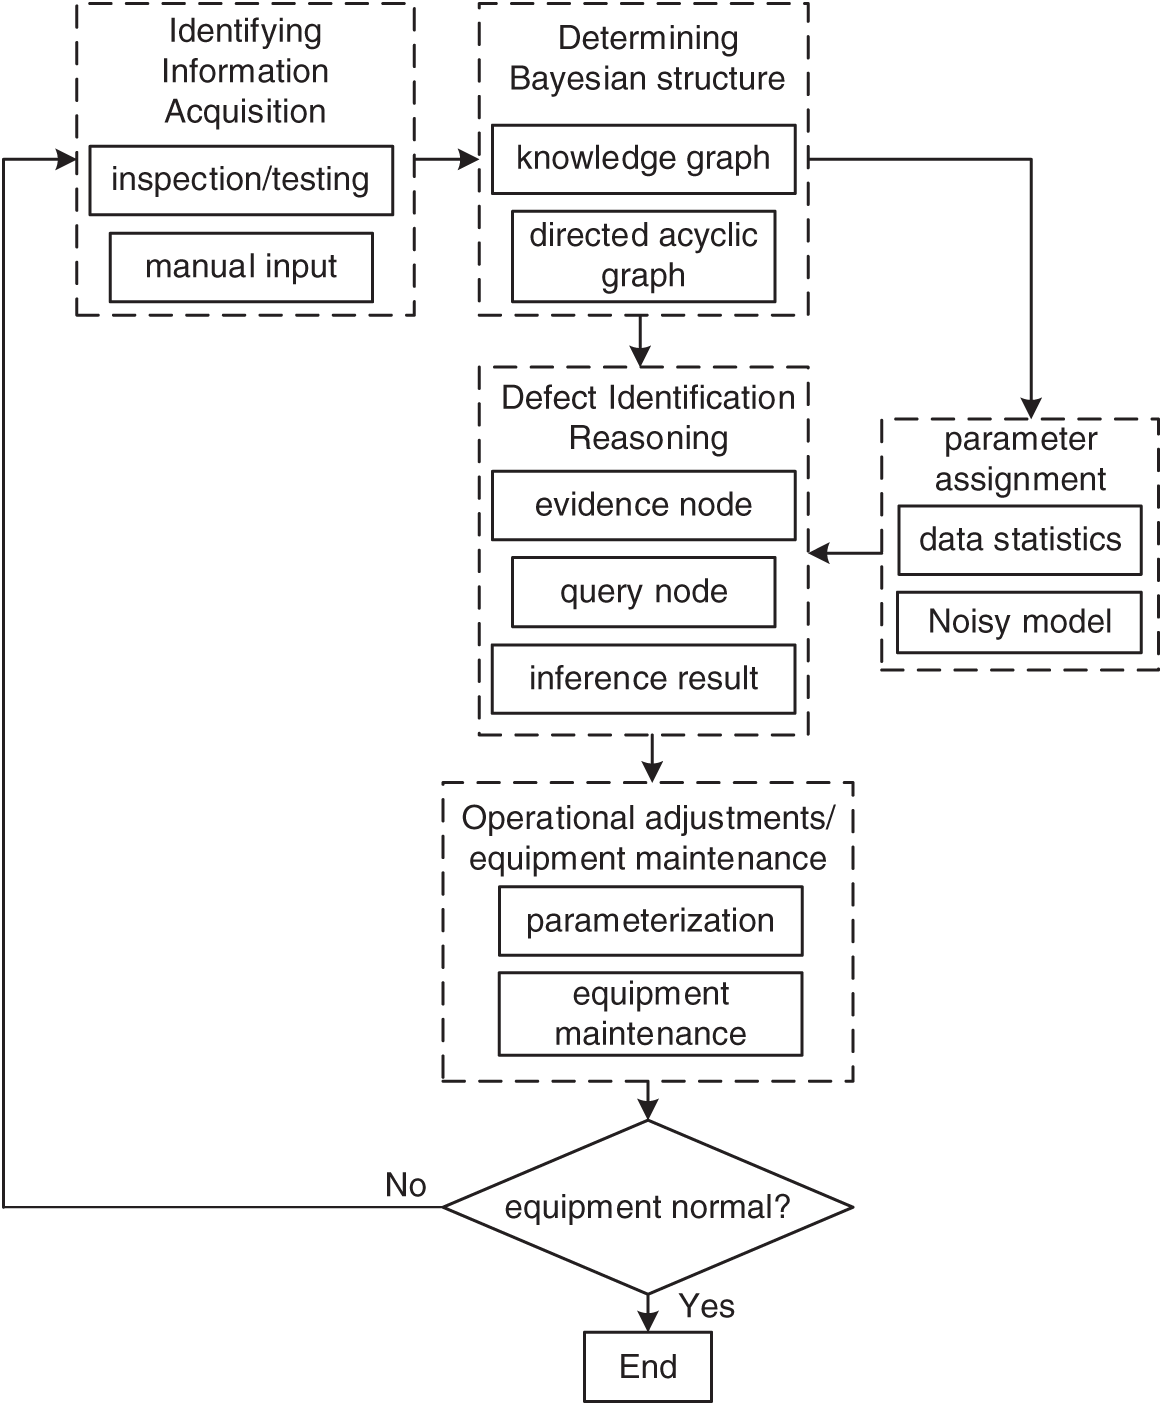
Figure 5: Defect identification process based on bayesian network
7759 text records of secondary equipment defects of a power grid company are selected to verify the effectiveness of the power grid secondary equipment defect recognition method based on the fusion of knowledge graph and Bayesian, and based on the Neo4j platform, the knowledge graph of power grid secondary equipment defects, which contains 1265 nodes and 1564 relations, is constructed, as shown in Fig. 2.
4.1 Case Scenario 1: Communication Defect
This section verifies communication defect cases in secondary power grid equipment. Based on the knowledge graph, nine examples of nodes related to “Fiber Channel Alarm” are obtained for validation. The search commands are shown in Table 1, and the output search sub-graphs are shown in Fig. 6 based on the knowledge graph. According to the query, the possible causes of Fiber Channel alarms include: loose jumper connectors, pigtails with excessive bends or dirty connectors, fused fiber quality problems, and multiplexing interface device failures, which in turn include unstable power supply, misconfiguration of multiplexing methods, and link interruptions.
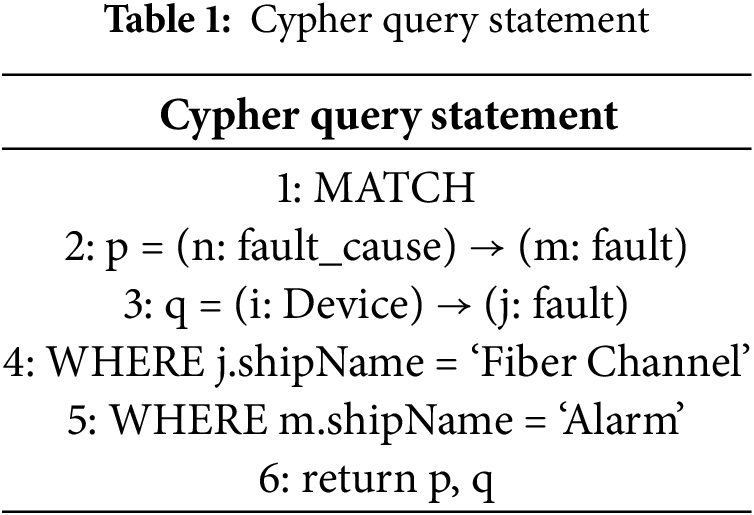
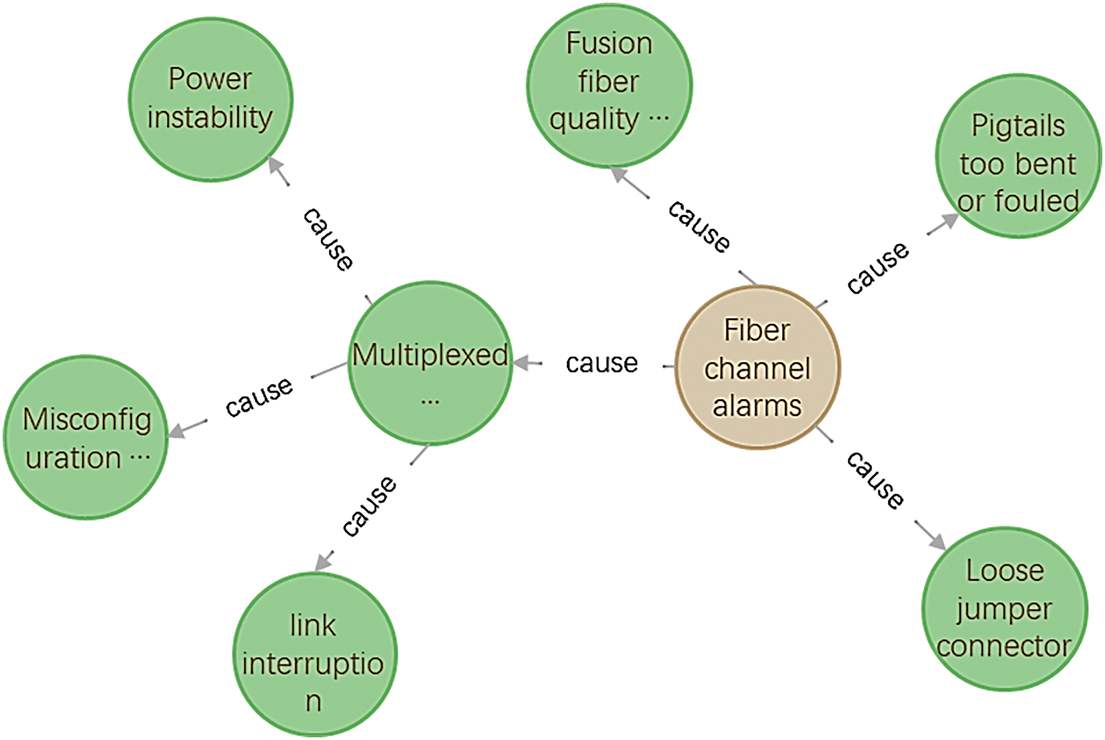
Figure 6: Sub-view of fibre channel alarm
After the retrieval is completed, it is transformed into a Bayesian network based on the knowledge graph, and the retrieval results are modeled using the GeNIe Bayesian modeling tool, and the Bayesian-based identification model for power grid secondary equipment defects is shown in Fig. 7.
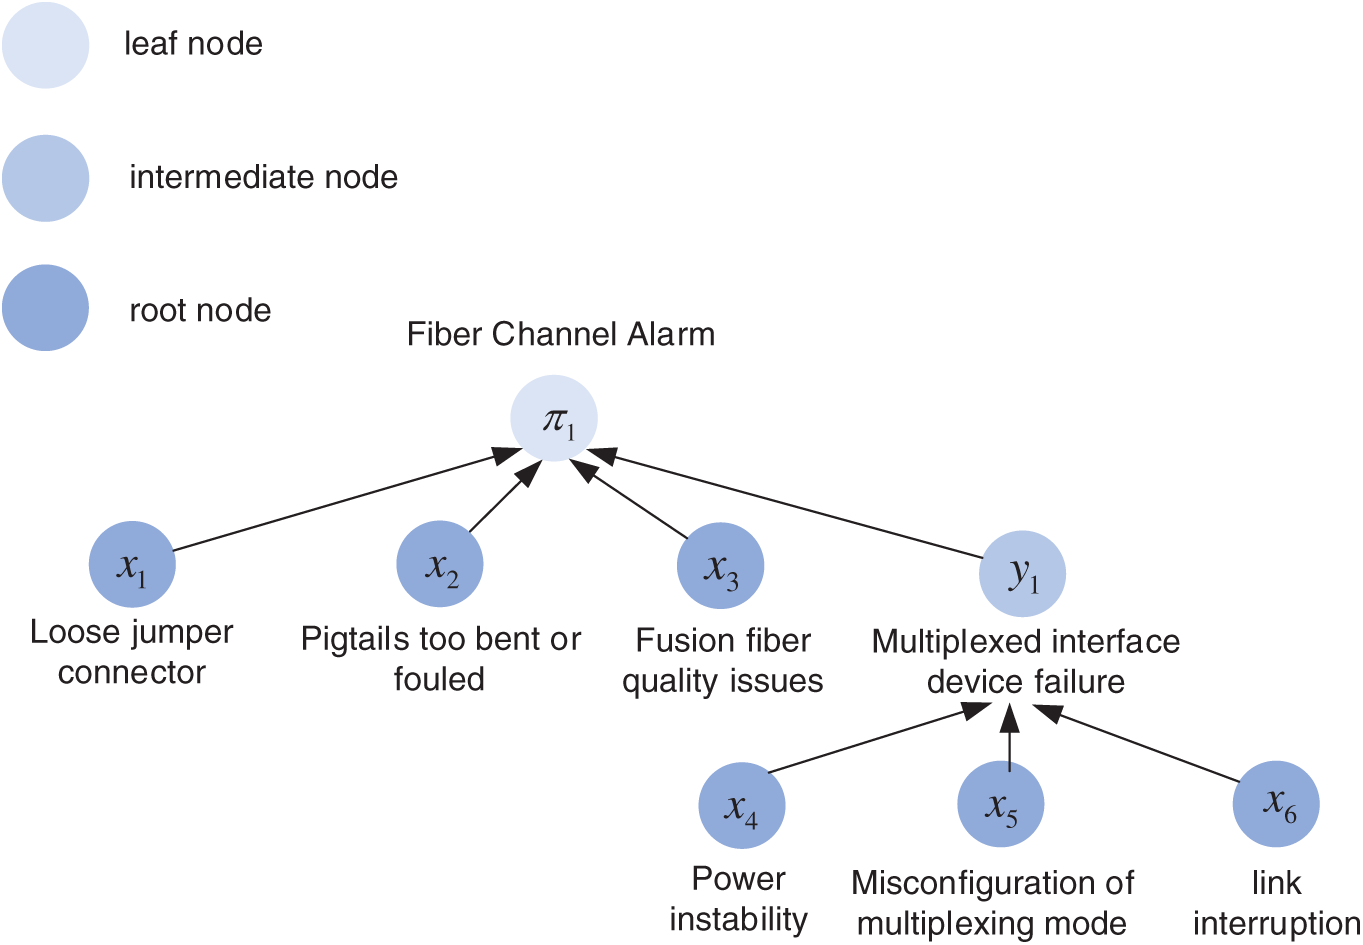
Figure 7: Defect Bayesian network diagram of fiber channel alarm
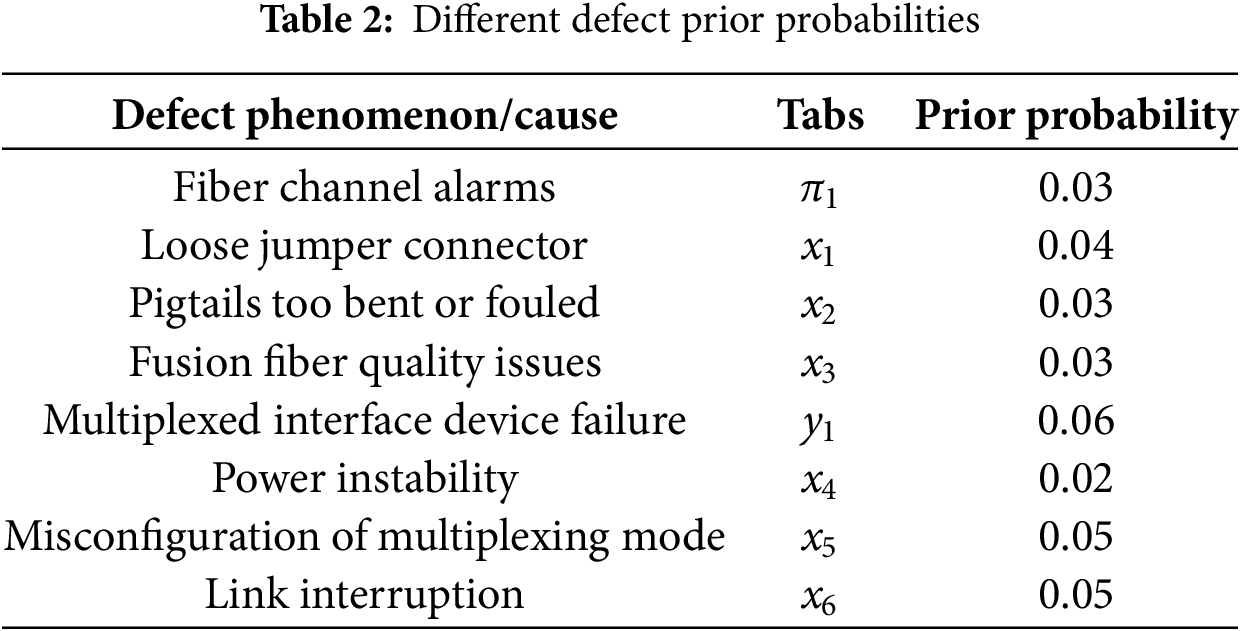
The above secondary equipment defect text data is used to parameterize the Bayesian network, and the prior probability statistics are shown in Table 2. The a priori probability of the leaf node “Fiber Channel Alarm” is 0.04, the a priori probability of the intermediate node “Multiplex Interface Device Failure” is 0.07, and the other root nodes “loose jumper connector”, “pigtail bend too big or fouled”, “fusion fiber quality issues”, “unstable power supply”, The a priori probabilities of “multiplexing mode misconfiguration” and “link interruption” are 0.05, 0.02, 0.02, 0.03, 0.04 and 0.04, respectively.
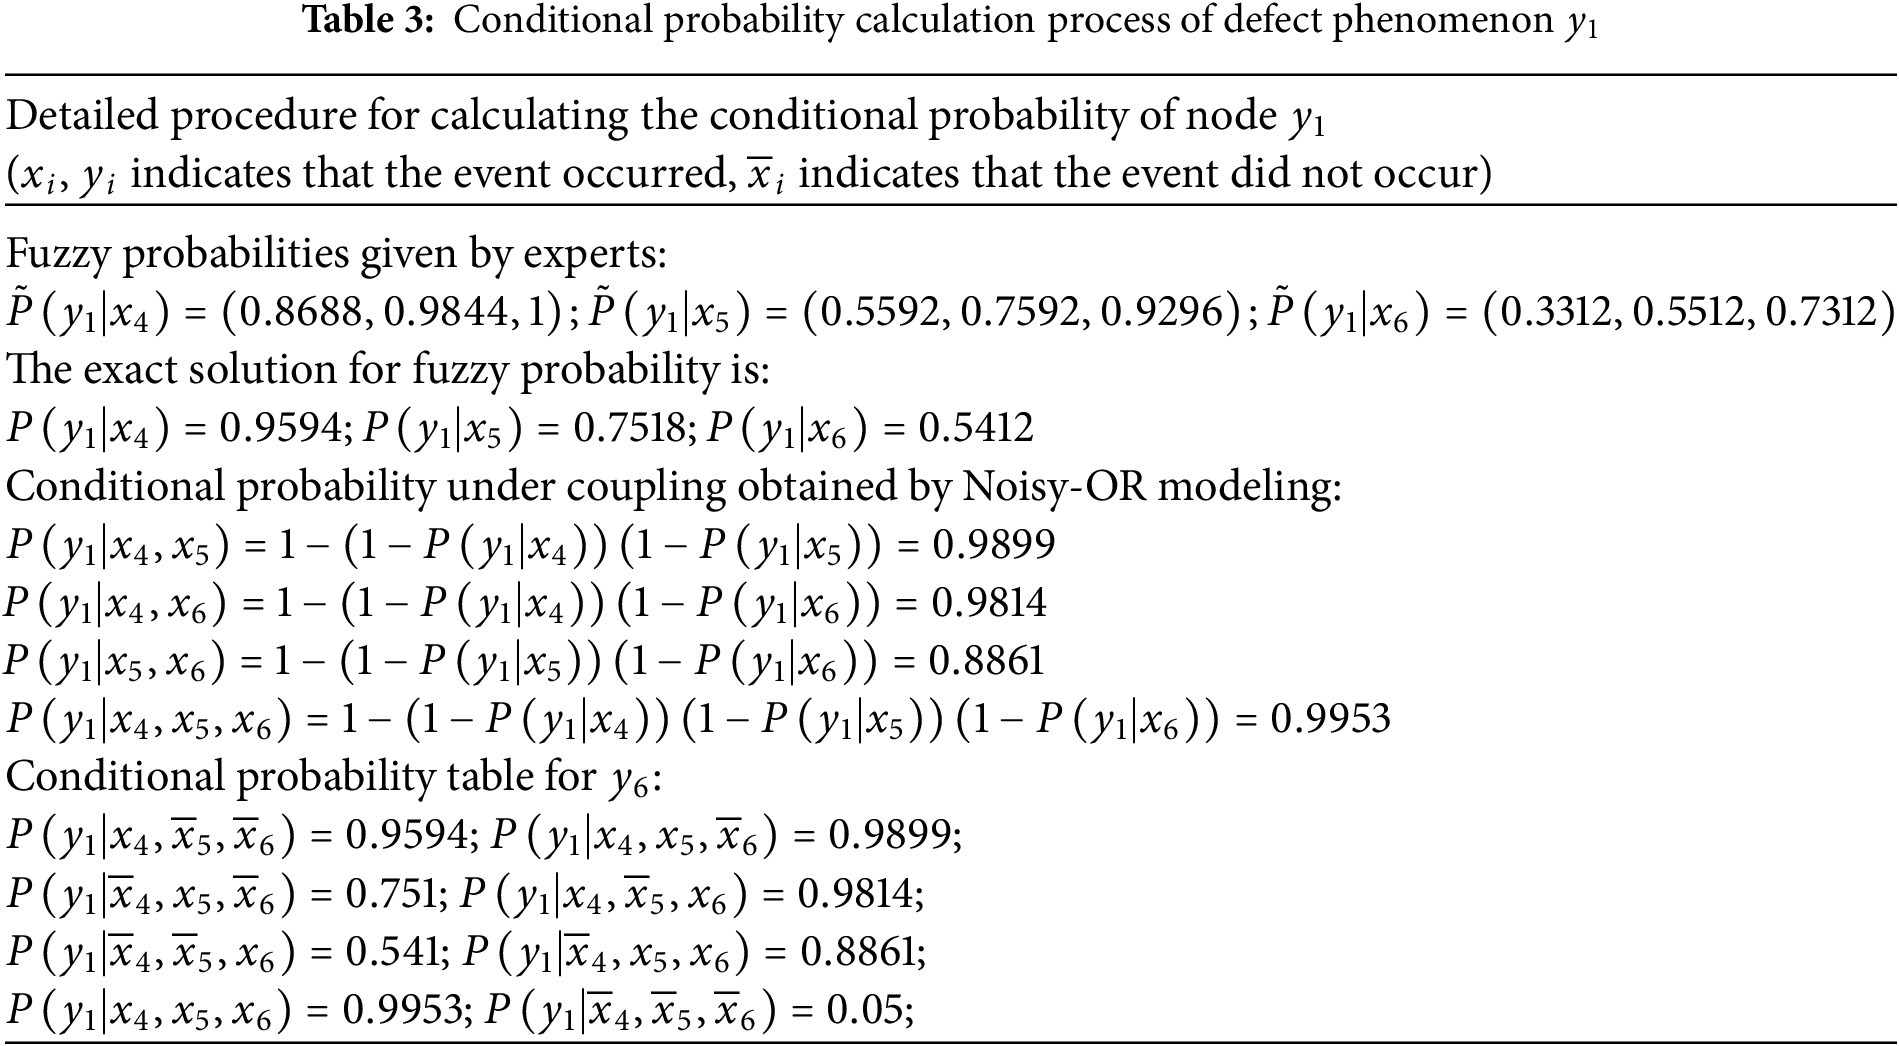
Based on the Noisy-OR node model in Eq. (5), each node is processed to determine the conditional probability distribution of the Bayesian network. Taking node
On the basis of obtaining all the conditional probability distributions, Bayesian network inference is utilized for quantitative assessment. The state probability of the node “Fiber Channel Alarm” is preset to 100%, and then the a posteriori probability of each defect cause is calculated using the inverse inference mechanism of Bayesian network. The results of the Bayesian network for defect identification are shown in Fig. 8.
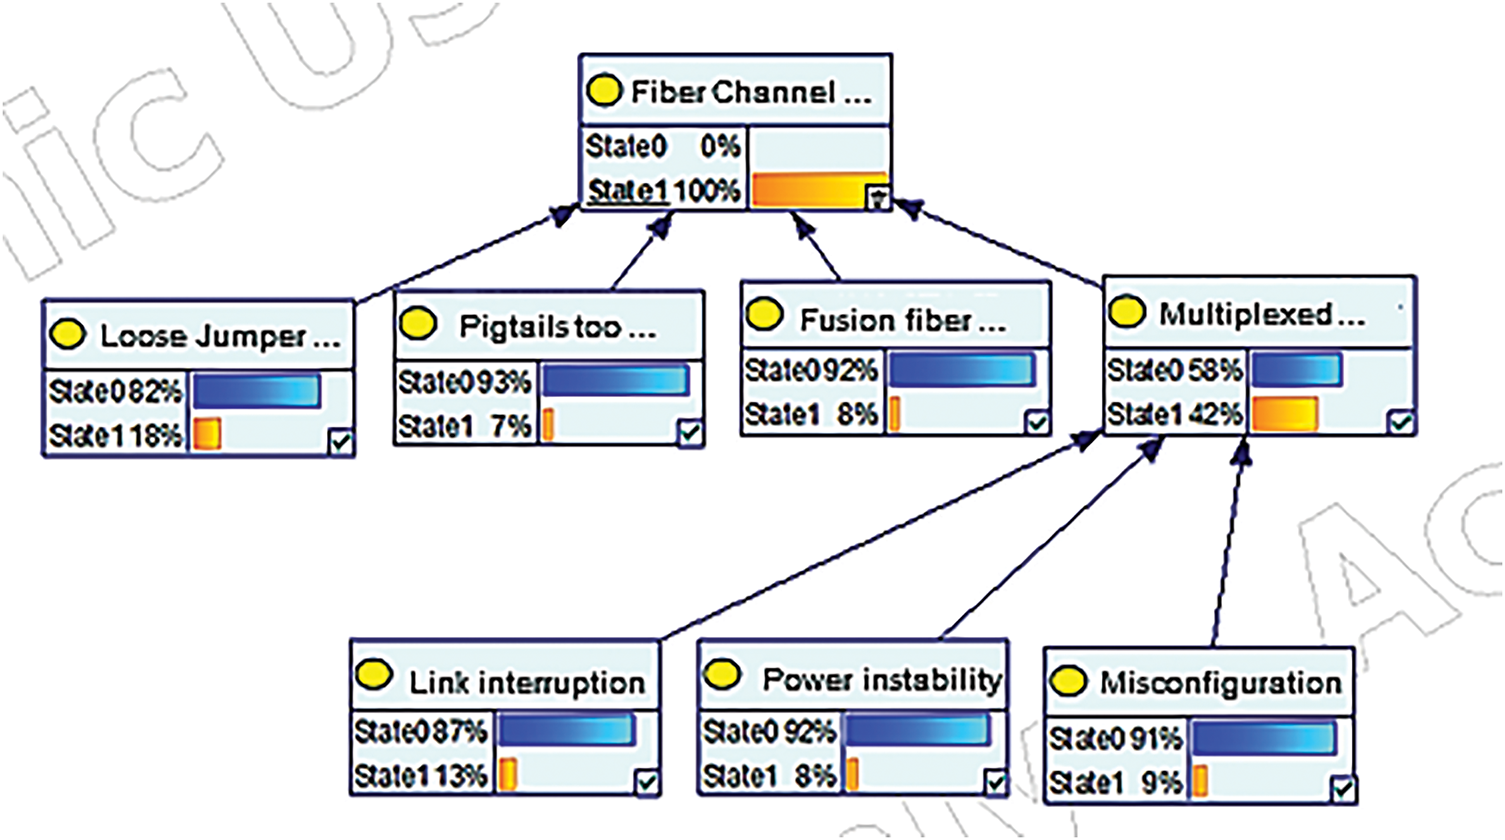
Figure 8: Bayesian network defect identification results
When the Fibre Channel alarms, the probability of occurrence of loose jumper connectors, pigtail bends too large or connector defacement, fused fiber quality problems, link interruption, power supply instability, and multiplexing mode configuration error causes are 18%, 7%, 8%, 13%, 8%, and 9%, respectively. The higher the probability of occurrence of the cause of the defect, the higher the detection priority, with a view to eliminating the defect more quickly. From Fig. 8, the a posteriori probability of each defective root cause is:

Figure 9: Defect identification results of the updated bayesian network
4.2 Case Scenario 2: Protective Device Defect
This section identifies and verifies the reasoning behind cases of protective device defects in secondary power grid equipment. Perform subgraph search based on the knowledge graph for the alarm message “Protection device issues TWJ abnormal signal,” then establish the TWJ abnormal Bayesian network topology structure according to the mapping method from the power grid secondary equipment defect knowledge graph to the Bayesian network, as shown in Fig. 10.
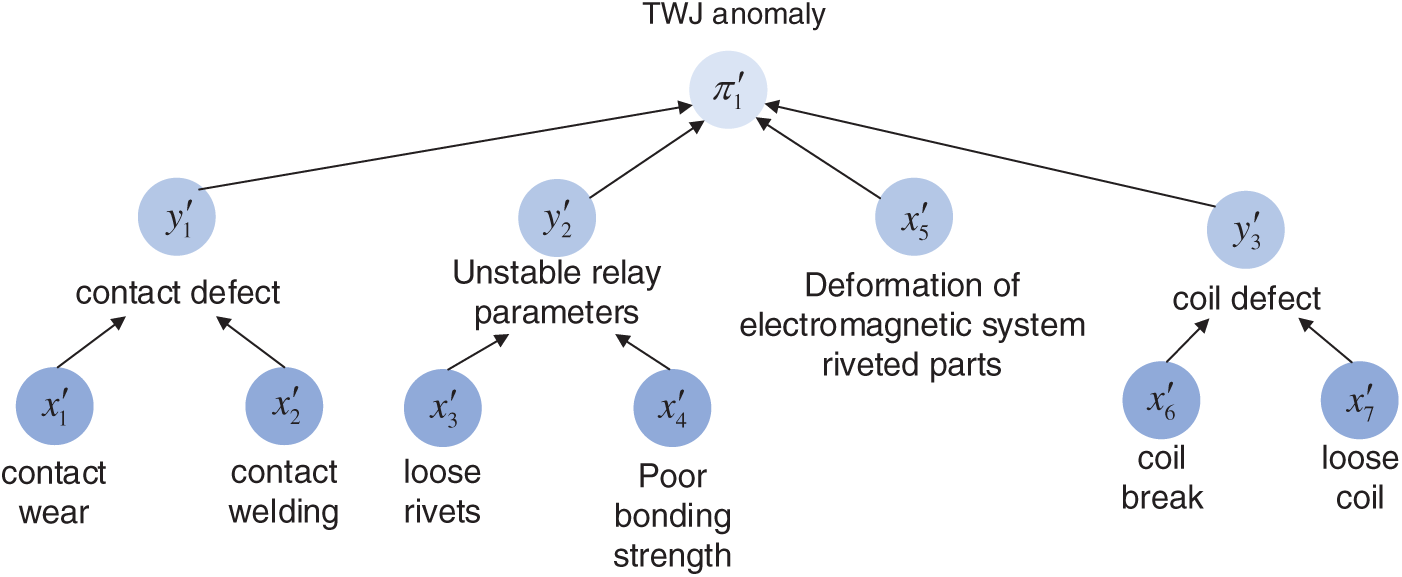
Figure 10: Defect Bayesian network diagram of TWJ anomaly
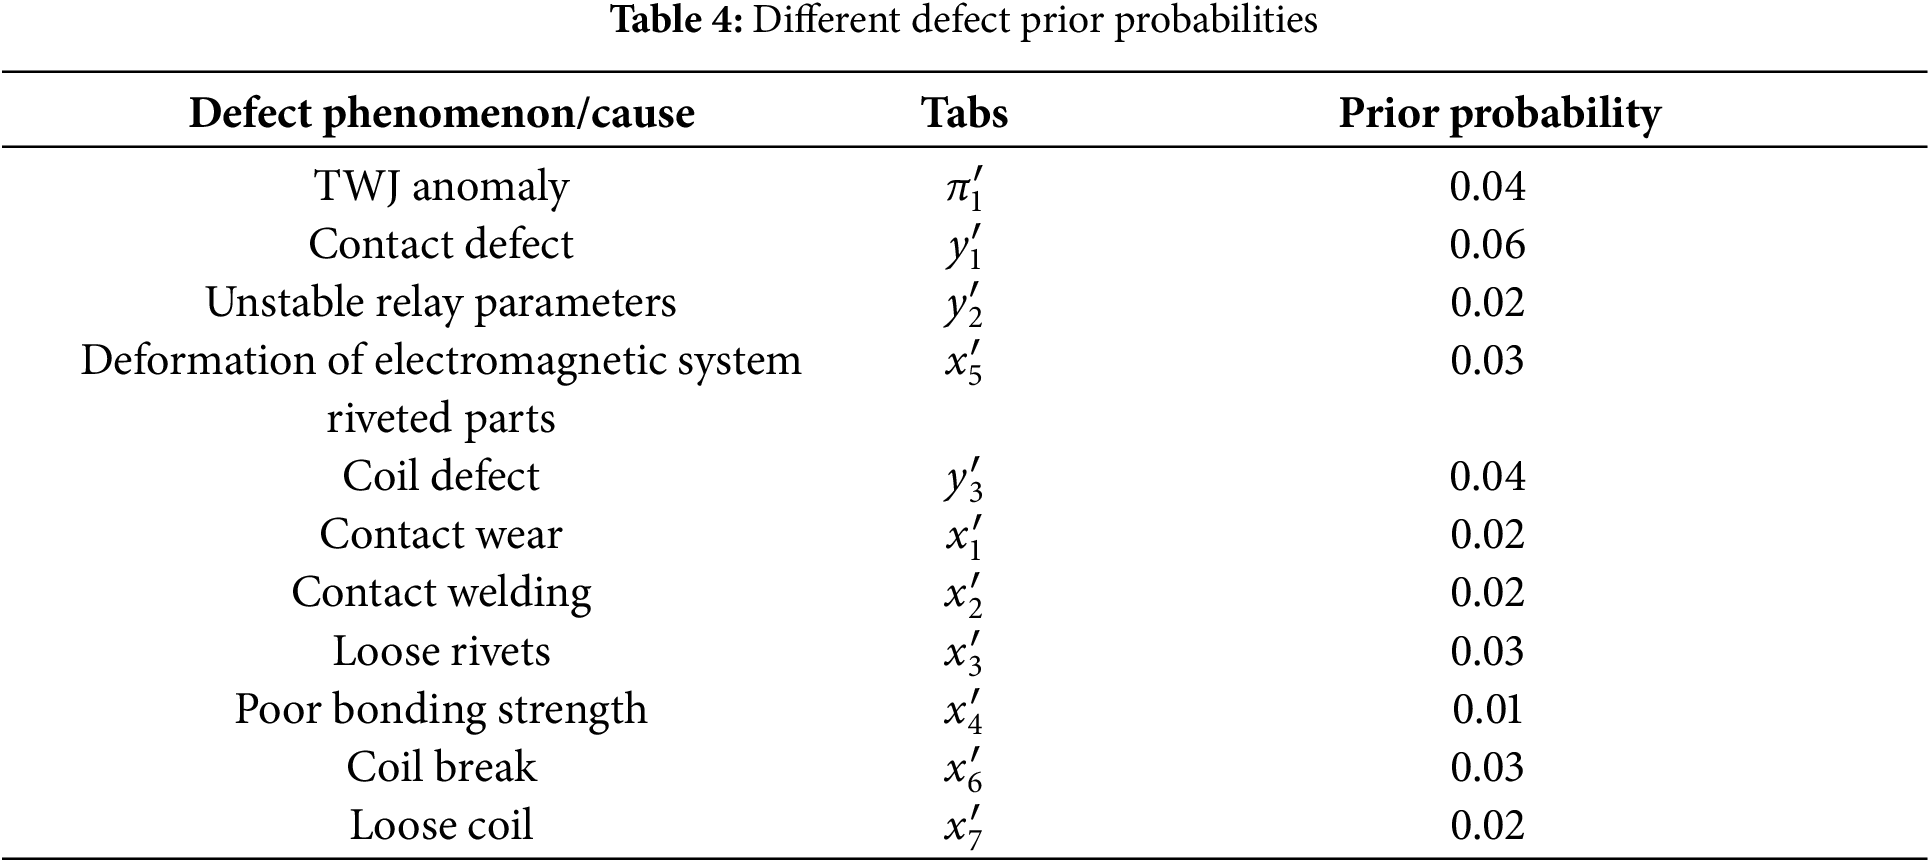
Using the historical data of TWJ abnormal alarm defects from the power grid over the past five years as the data sample, the prior probability statistics are shown in Table 4.
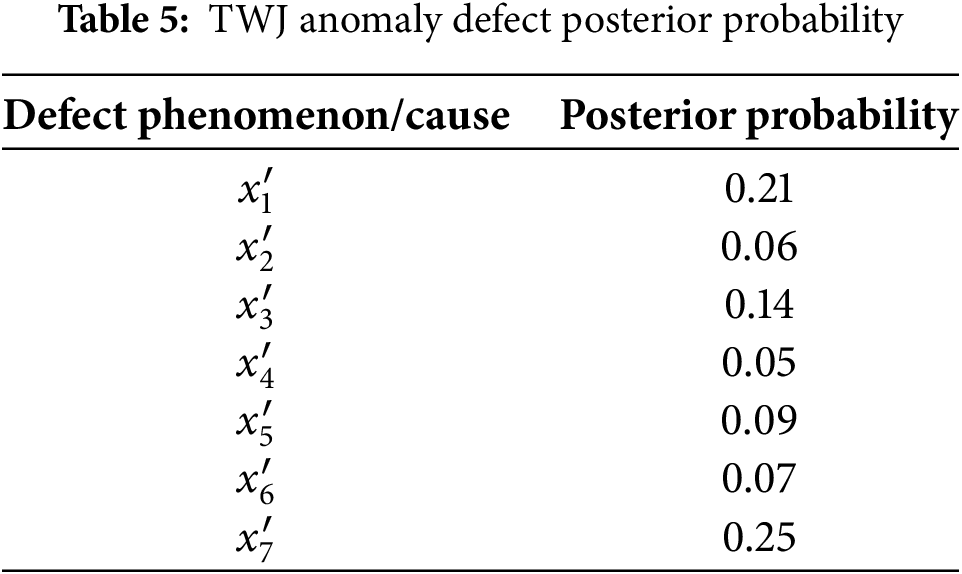
After obtaining the conditional probability table based on expert opinions and the Noisy-OR model, Bayesian networks were applied to perform inference analysis on the TWJ anomaly, yielding the posterior probabilities of the root causes of each defect, as shown in Table 5. When using Bayesian networks for quantitative analysis of defect causes in TWJ anomaly defects, the most likely result is a contact defect.
In order to validate the defect recognition method for power grid secondary equipment proposed in this paper, the Precision, Recall and F1-score are used as the evaluation indexes. Meanwhile, Latent Semantic Analysis (LSA), Latent Dirichlet Allocation (LDA) model based on machine learning, and single knowledge graph model are used as comparisons. Where Precision indicates the proportion of all predicted positive samples that are actually positive, the higher the value, the higher the accuracy of the prediction [18].
TP represents the number of samples that were correctly determined to be in the positive category, while FP represents the number that were incorrectly determined to be in the positive category.
Recall measures the proportion of all actual positive samples that are correctly predicted as positive:
where FN denotes the number of positive samples categorized as negative and TP + FN is the number of all positive samples in the original sample.
Of the two metrics Precision and Recall, usually increasing one tends to decrease the other. In order to balance the accuracy and recall, F1 is used as the comprehensive evaluation index, which is the reconciled average of Precision and Recall, and its calculation formula is:
In the formula, the parameter
4.3.1 Verification of Knowledge Extraction Methods
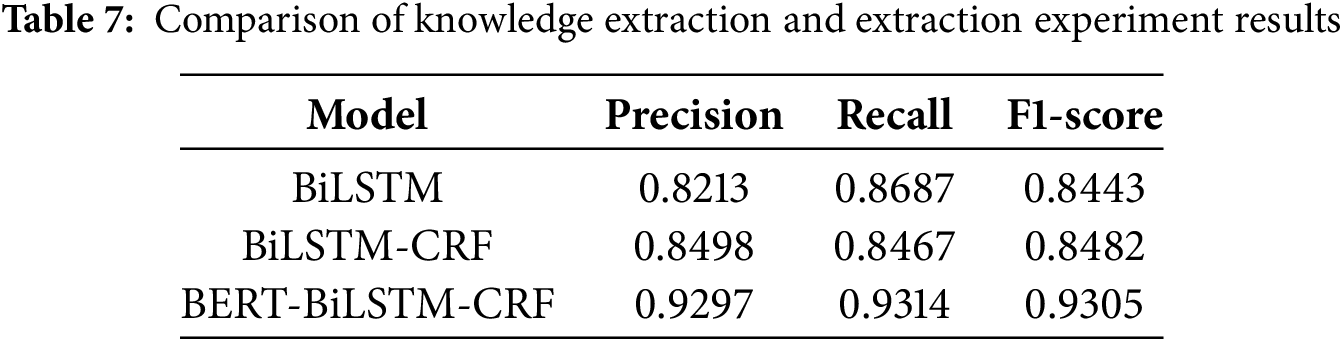
To evaluate the entity extraction performance of different models, experiments were conducted using the same dataset to determine the superiority of the BERT-BiLSTM-CRF model. To ensure the reliability of the entity extraction experiment results, the average of five experiments was taken for each model in this experiment. The specific parameters of the models used in this experiment are shown in Table 6. The experimental results are shown in Table 7.

The F1 scores of the BERT-BiLSTM-CRF model as a function of epoch are shown in Fig. 11.
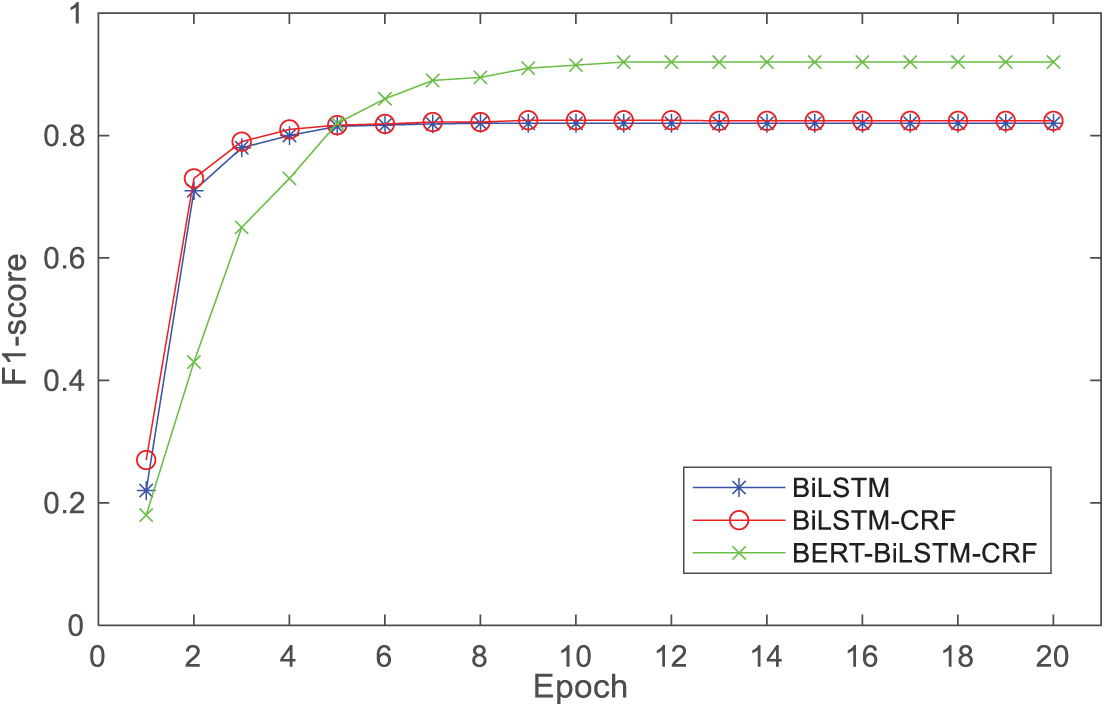
Figure 11: Knowledge extraction F1 score comparison
The experimental results indicate that the BERT-BiLSTM-CRF model performs poorly in terms of F1 score during the initial stages of training, even falling below the relatively simpler BiLSTM and BiLSTM-CRF models. This is primarily attributed to its more complex model structure, which makes it difficult for the BERT pre-training layer to effectively learn the continuous features of sequence information when under-trained. However, as the number of training epochs increases, the model’s performance improves significantly, ultimately achieving an F1 score of 0.9201, which is notably superior to the other two methods. This performance improvement is attributed to the BERT pre-trained model’s strong ability to capture context dependencies after sufficient training, as well as the synergistic effect formed by its collaboration with the BiLSTM’s context encoding capability and the CRF’s sequence optimization capability, thereby optimizing the overall model training efficiency.
4.3.2 Defect Identification Method Verification
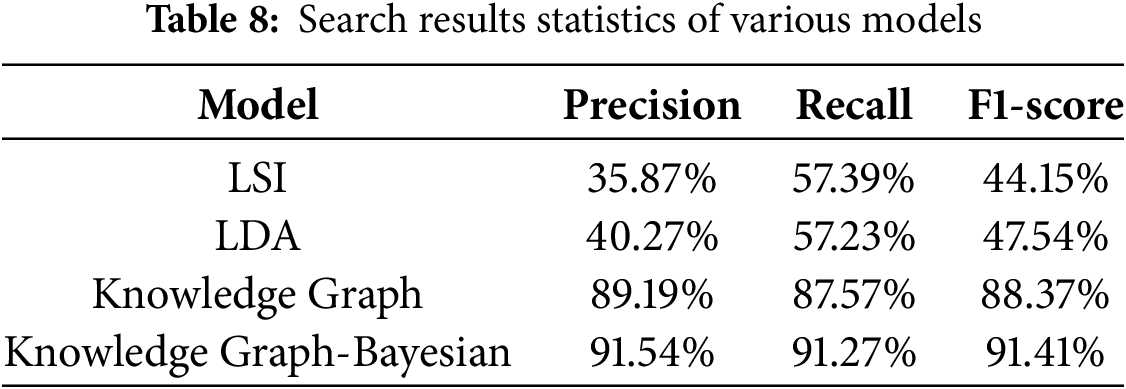
The LSI, LDA, single knowledge graph model, and the power grid secondary equipment defect recognition model fused with knowledge graph and Bayesian network were utilized to retrieve 1000 defect records respectively, and the retrieval results of each model were counted, as shown in Table 8. The comparison results show that the fusion model of knowledge graph and Bayesian network outperforms LSI, LDA and single knowledge graph model in terms of Precision, Recall and F1-score. Knowledge graph and Bayesian network fusion can accurately identify key information, perform knowledge and probabilistic reasoning, and realize the modeling and analysis of the complex relationship between defect phenomena and causes.
To validate the confidence of the Knowledge Graph-Bayesian model, false retrieval results are automatically generated as negative examples to introduce errors and conflicts. During the specific generation process, the number of negative examples is ensured to be equal to the number of positive examples, and then the retrieval results are randomly replaced to generate false retrieval results.
After testing, the confidence values of the search results are displayed in a coordinate system, as shown in Fig. 12. The left region shows the value distribution of negative examples, while the right region shows the value distribution of positive examples. It can be observed that the confidence values of positive examples are primarily concentrated in the upper region, indicating that the model has a high overall confidence level and demonstrates high certainty and reliability in defect identification. In contrast, the values of negative examples are primarily concentrated in the lower region, confirming that the confidence levels of the retrieval results are meaningful.
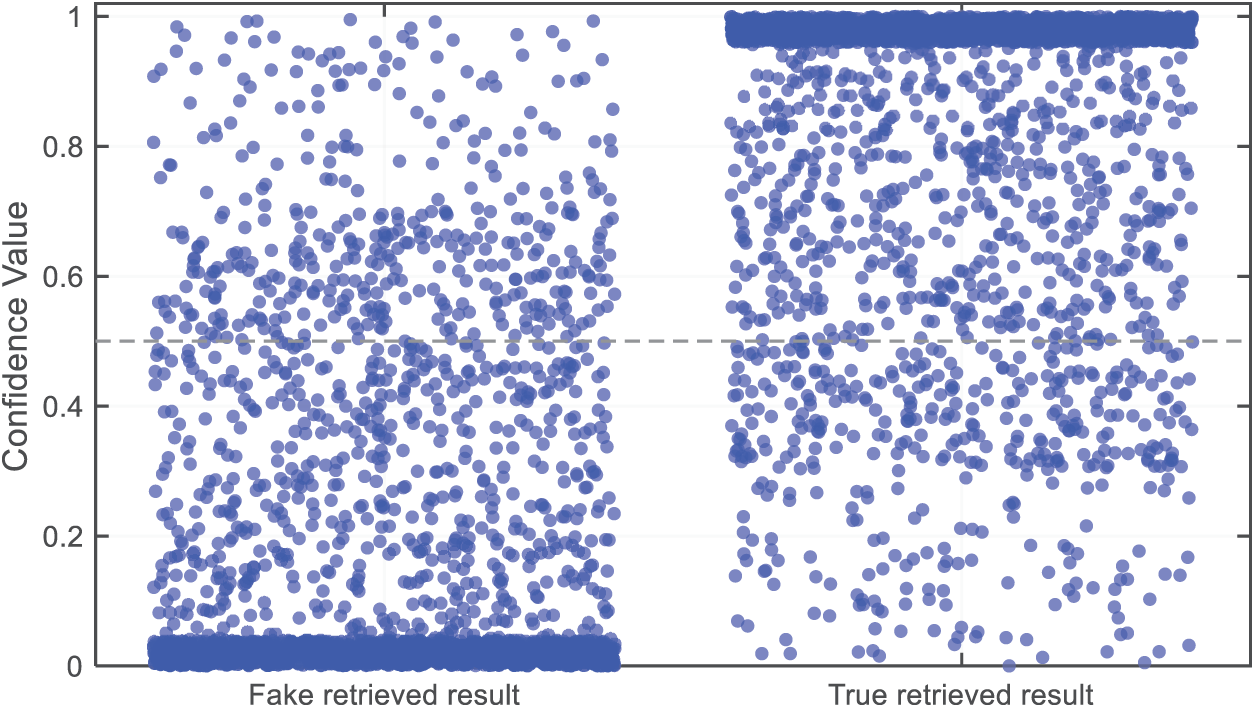
Figure 12: Scatter plot distribution of search result confidence values
Aiming at the problem that the existing methods are difficult to accurately portray the complex relationship and probabilistic influence between the secondary equipment defect phenomenon and the multilayered causes, which restricts the real-time and accuracy of defect identification, a power system secondary equipment defect identification method based on the fusion of knowledge graph and Bayesian network is proposed. Through knowledge extraction and fusion technology, the power grid secondary equipment defect data is transformed into a structured knowledge graph. Subsequently, the knowledge graph is transformed into a Bayesian network, which effectively integrates the historical data and realizes the probabilistic inference between defect phenomena and causes. The experimental results show that the method can effectively identify and locate the causes of defects, significantly improve the defect identification efficiency, and facilitate real-time processing of defect information. In the future, further attention will be paid to the construction and updating mechanism of the knowledge graph of power grid secondary equipment defects to improve the real-time and dynamic adaptability of the Bayesian network of grid secondary equipment defects.
Acknowledgement: Thanks for the support of the research project on defect diagnosis and early warning technology for relay protection and safety automation devices based on multi-source heterogeneous defect data.
Funding Statement: The study was supported by the State Grid Southwest Branch Project “Research on Defect Diagnosis and Early Warning Technology of Relay Protection and Safety Automation Devices Based on Multi-Source Heterogeneous Defect Data”.
Author Contributions: The authors confirm contribution to the paper as follows: study conception and design: Jun Xiong, Peng Yang; data collection: Bohan Chen, Zeming Chen, Peng Yang; analysis and interpretation of results: Jun Xiong, Bohan Chen, Zeming Chen; draft manuscript preparation: Peng Yang, Jun Xiong. All authors reviewed the results and approved the final version of the manuscript.
Availability of Data and Materials: Due to the nature of this research, participants of this study did not agree for their data to be shared publicly, so supporting data is not available.
Ethics Approval: Not applicable.
Conflicts of Interest: The authors declare no conflicts of interest to report regarding the present study.
References
1. Kundur P. Power system stability. In: Power system stability and control. Boca Raton, FL, USA: CRC Press; 2007. [Google Scholar]
2. He X, Dong H, Yang W, Li W. Multi-source information fusion technology and its application in smart distribution power system. Sustainability. 2023;15(7):6170. doi:10.3390/su15076170. [Google Scholar] [CrossRef]
3. Liu J, Ma H, Xie X, Cheng J. Short text classification for faults information of secondary equipment based on convolutional neural networks. Energies. 2022;15(7):2400. doi:10.3390/en15072400. [Google Scholar] [CrossRef]
4. Xiao L, Yang X, Yang X. A graph neural network-based bearing fault detection method. Sci Rep. 2023;13(1):5286. doi:10.1038/s41598-023-32369-y. [Google Scholar] [CrossRef]
5. Ngo QH, Nguyen BLH, Zhang J, Schoder K, Ginn H, Vu T. Deep graph neural network for fault detection and identification in distribution systems. Electr Power Syst Res. 2025;247(2):111721. doi:10.1016/j.epsr.2025.111721. [Google Scholar] [CrossRef]
6. Hosseini E, Saeedpour B, Banaei M, Ebrahimy R. Optimized deep neural network architectures for energy consumption and PV production forecasting. Energy Strategy Rev. 2025;59(2):101704. doi:10.1016/j.esr.2025.101704. [Google Scholar] [CrossRef]
7. Chen Q, Zhang L, Guo P, Zhang H, Tian M, Li Y, et al. Modeling and analysis of incorrect actions of relay protection systems based on fault trees. IEEE Access. 2020;8:114571–9. doi:10.1109/ACCESS.2020.3003938. [Google Scholar] [CrossRef]
8. Li ZM, Sun ZM, Gu QG, Lv H. Smart operation and maintenance system based on situational awareness and assistant decision-making of relay protection devices. Power Syst Prot Control. 2020;48(19):142–50. (In Chinese). doi:10.19783/j.cnki.pspc.191614. [Google Scholar] [CrossRef]
9. Khodaee P, Viktor HL, Michalowski W. Knowledge transfer in lifelong machine learning: a systematic literature review. Artif Intell Rev. 2024;57(8):217. doi:10.1007/s10462-024-10853-9. [Google Scholar] [PubMed] [CrossRef]
10. Wang WH, Guo P, Zhu J, Yang GS, Zhan RR, Zhang L. Fault positioning and risk assessment method of relay protection based on fault tree and Bayesian network. J Electr Power Sci Technol. 2021;36(4):81–90. (In Chinese). doi:10.19781/j.issn.1673-9140.2021.04.011. [Google Scholar] [CrossRef]
11. Fan C, Xiao F, Song M, Wang J. A graph mining-based methodology for discovering and visualizing high-level knowledge for building energy management. Appl Energy. 2019;251:113395. doi:10.1016/j.apenergy.2019.113395. [Google Scholar] [CrossRef]
12. Moradzadeh A, Teimourzadeh H, Mohammadi-Ivatloo B, Pourhossein K. Hybrid CNN-LSTM approaches for identification of type and locations of transmission line faults. Int J Electr Power Energy Syst. 2022;135(1):107563. doi:10.1016/j.ijepes.2021.107563. [Google Scholar] [CrossRef]
13. Mansouri M, Trabelsi M, Nounou H, Nounou M. Deep learning-based fault diagnosis of photovoltaic systems: a comprehensive review and enhancement prospects. IEEE Access. 2021;9:126286–306. doi:10.1109/ACCESS.2021.3110947. [Google Scholar] [CrossRef]
14. Chen Z, Zhou Y, Zhang Z, Liu Z. Semi-tensor product of matrices approach to the problem of fault detection for discrete event systems (DESs). IEEE Trans Circuits Syst II Express Briefs. 2020;67(12):3098–102. doi:10.1109/TCSII.2020.2967062. [Google Scholar] [CrossRef]
15. Wei D, Wang B, Lin G, Liu D, Dong Z, Liu H, et al. Research on unstructured text data mining and fault classification based on RNN-LSTM with malfunction inspection report. Energies. 2017;10(3):406. doi:10.3390/en10030406. [Google Scholar] [CrossRef]
16. Gan Y, Zou Z, Zhang Q, Rao D, Zhao L, Zhang C. Development and application of multi-parameter real-time acquisition system for intelligent secondary equipment. J Phys Conf Ser. 2024;2831(1):012026. doi:10.1088/1742-6596/2831/1/012026. [Google Scholar] [CrossRef]
17. Deng KL, Li DD, Wang Y, Cheng XL, Li M, Fan XQ. Study on a quantitative risk assessment method of primary equipments based on power grid safety analysis. Appl Mech Mater. 2014;541–542:863–8. doi:10.4028/www.scientific.net/amm.541-542.863. [Google Scholar] [CrossRef]
18. Miao J, Zhu W. Precision-recall curve (PRC) classification trees. Evol Intell. 2022;15(3):1545–69. doi:10.1007/s12065-021-00565-2. [Google Scholar] [CrossRef]
Cite This Article
 Copyright © 2026 The Author(s). Published by Tech Science Press.
This work is licensed under a Creative Commons Attribution 4.0 International License , which permits unrestricted use, distribution, and reproduction in any medium, provided the original work is properly cited.
 Downloads
 Citation Tools