
 Submit a Paper
 Propose a Special lssue
 Open Access
ARTICLE
Comprehensive Multi-Criteria Assessment of GBH-IES Microgrid with Hydrogen Storage
1 School of Electricity, Shanghai Dianji University, Shanghai, 201306, China
2 Intelligent Manufacturing Modern Industrial College, Xinjiang University, Urumqi, 830046, China
3 State Grid Xinjiang Electric Power Co., Ltd., Ultra High Voltage Branch Company, Urumqi, 830002, China
* Corresponding Author: Jie Chen. Email:
(This article belongs to the Special Issue: Revolution in Energy Systems: Hydrogen and Beyond)
Energy Engineering 2026, 123(1), 12 https://doi.org/10.32604/ee.2025.069487
Received 24 June 2025; Accepted 11 September 2025; Issue published 27 December 2025
 View Full Text
 Download PDF
Abstract
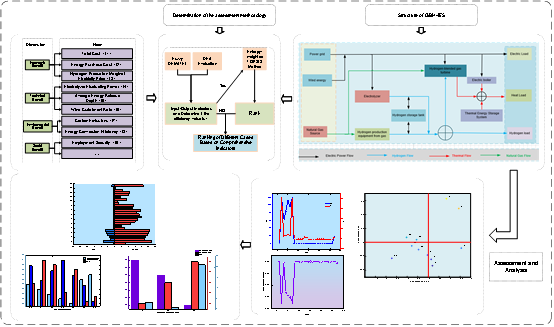
The integration of wind power and natural gas for hydrogen production forms a Green and Blue Hydrogen Integrated Energy System (GBH-IES), which is a promising cogeneration approach characterized by multi-energy complementarity, flexible dispatch, and efficient utilization. This system can meet the demands for electricity, heat, and hydrogen while demonstrating significant performance in energy supply, energy conversion, economy, and environment (4E). To evaluate the GBH-IES system effectively, a comprehensive performance evaluation index system was constructed from the 4E dimensions. The fuzzy DEMATEL method was used to quantify the causal relationships between indicators, establishing a scientific input-output assessment system. The DEA model was then employed for preliminary performance evaluation of the hydrogen storage system, followed by the entropy weight TOPSIS method to enhance the accuracy and reliability of the assessment results. The study also conducted a comprehensive benefit evaluation and sensitivity analysis for different cases involving blue hydrogen, green hydrogen, and their synergistic effects under varying carbon emission factors (CEFs) and hydrogen blending ratios (HBRs). The results indicate that combining green and blue hydrogen can achieve higher comprehensive benefits for the hydrogen storage system, providing valuable insights for hydrogen storage development and demonstrating the effectiveness of the multi-criteria decision-making methods used.Graphic Abstract
Keywords
With the increasing severity of global energy security, climate crisis, and environmental pollution issues, the Sustainable Development Goals (SDGs) and hydrogen energy are dedicated to promoting the sustainable development of a clean energy system [1]. Hydrogen storage technology, as a key player in the transition to sustainable, low-carbon, and net-zero energy systems, plays a central role. Hydrogen, as a crucial part of the future energy system, is steadily gaining in usage due to its advantages in reducing carbon emissions and its acceptance by the public and industry [2,3]. Numerous scholars have been exploring the potential of hydrogen energy [4,5]. Currently, wind power and photovoltaics (PV) are typical representatives of renewable energy, but their power output is uncertain. This characteristic poses many serious challenges to the safe, stable, and efficient operation of power systems when wind power and PV are integrated on a large scale [6,7]. Xiao et al. established a stochastic-dominance-constrained operation strategy for flexible resources to overcome the difficulty of quantitatively controlling the risks arising from intermittent renewable energy in industrial integrated energy systems (IIES), and revealed that increasing the trading account’s financial resources by 33.33% effectively lowers the fixed investment cost of installed storage by 92.59% [8]. Wessel et al. developed a risk-averse intertemporal arbitrage strategy in response to increasing renewable generation uncertainty and intensified electricity price volatility, and validated the effectiveness of integrated market participation through a case study on the Belgian power market [9]. Xiao et al. constructed a risk-aware decision-making framework to tackle the price volatility and operational challenges induced by renewable intermittency, formulated an integrated bi-level optimization model to quantify the impact of strategic bidding on day-ahead and real-time markets, and effectively bridged the critical gap in managing profitability and stability during the energy transition [10]. Beraldi and Khodaparasti developed a stochastic bi-level method under dynamic electricity pricing that explicitly accounts for the intrinsic uncertainty affecting input parameters, conducted extensive computational experiments on a real-world case study, and effectively enhanced the robustness of the decision-making process [11].
Beyond the aforementioned bi-level optimization frameworks that integrate risk factors and system-wide risk awareness, hydrogen energy—characterized by its zero-carbon footprint and versatile conversion pathways—is extensively leveraged to convert surplus renewable electricity into storable hydrogen, which can be subsequently released on demand to satisfy both electrical and thermal loads, thereby generating pronounced economic and environmental co-benefits [12]. Hydrogen energy, as a good way to store electricity, can eliminate the uncertainty of renewable energy through electro-hydrogen coupling and promote the consumption of renewable energy. Blue hydrogen, produced by natural gas reforming combined with carbon capture and storage (CCS) technology, can significantly reduce carbon emissions; green hydrogen, produced by electrolyzing water with renewable energy, achieves true zero-carbon emissions [13]. The blue-green hydrogen hybrid energy storage system combines these two hydrogen production methods, not only fully utilizing the cleanliness of renewable energy but also compensating for the intermittency of green hydrogen production through the stable supply of blue hydrogen. Therefore, in-depth research and promotion of the blue-green hydrogen hybrid energy storage system are indispensable for optimizing the energy structure and achieving sustainable development.
The current research on hydrogen energy storage systems mainly focuses on system integration and operational optimization. In terms of system integration, Liang et al. developed an integrated energy system that combines electricity, heat, and hydrogen, and conducted scheduling to improve the system’s accommodation rate and economic efficiency [14]. Wang et al. constructed a biomass-photovoltaic-hydrogen integrated energy system (BPH-IES) model, analyzed the impact of economic indicators such as energy supply revenue and energy supply costs, and effectively enhanced the system’s energy-use-economic-environmental (4E) performance by expanding the scale of system supply and demand, thereby increasing the penetration rate of clean energy and hydrogen in the system [15]. Saha et al. have conducted an in-depth investigation into the technical and economic feasibility of photovoltaics (PV), biogas, wind energy, and hydrogen energy within net metering programs in developing countries, and concluded that electric vehicles are considered more economical than hydrogen fuel cell vehicles for green transportation in developing countries [16]. Liu and Qin considered the coupled operation of photovoltaics and electrolysis hydrogen production equipment in the planning of a new park’s integrated energy system, which promoted the utilization of photovoltaics and reduced carbon emissions [17]. Zhou et al. built a novel IES model that integrates hydrogen with natural gas and electricity, and analyzed the impact of different hydrogen blending modes on system operation [18]. The above studies have verified various strategies for coupling hydrogen in integrated energy systems, considering the use of renewable energy sources such as wind power and photovoltaics for hydrogen production to ensure system stability. However, these studies are generally biased towards green hydrogen, which, due to its high production cost, lacks market competitiveness. Many scholars have studied the coordination of green and blue hydrogen to achieve the feasibility of reducing current hydrogen costs and gradually transitioning to a green hydrogen energy system. Novotny believes that blue hydrogen can serve as a green energy source during the decarbonization period [19]. Durakovic et al., through sensitivity analysis of electrolyzer costs and natural gas prices, analyzed the degree of complementarity or competitiveness between blue and green hydrogen, and concluded that in the long run, green and blue hydrogen can coexist in the European market without negatively impacting each other [20]. Cavalcante et al., through the assessment of blue hydrogen energy technologies, found that the United States, the United Kingdom, and Republic of Korea are prominent in the number of blue hydrogen publications and citations, indicating significant global contributions to the application research and development of blue hydrogen, which is gradually increasing and also shows that the importance of blue hydrogen in the global energy transition is growing [21]. It is evident that during the current period, the coordinated production and utilization of green and blue hydrogen have certain research value.
In terms of operational optimization, Liu et al. proposed a two-layer optimization method for an electricity-hydrogen integrated energy system (EH-IES) with seasonal hydrogen storage, which is used to coordinate the joint optimization problem of equipment capacity and configuration in the proposed system. The results show that this method can utilize the seasonal complementary benefits to promote the consumption of new energy, improve the system’s operational efficiency, and effectively reduce the total operating cost and carbon emissions of the EH-IES [22]. Liu et al. considered the seasonal fluctuation characteristics of renewable energy and the capacity configuration problem of the electricity-hydrogen coupling system (EHCS), and constructed an adaptive time granularity optimization planning model to coordinate the equipment capacity configuration and operation strategy in the system [23]. Dong et al. developed a detailed modeling and collaborative configuration method for an electricity-hydrogen-heat-gas integrated energy system (EHTG-IES) with a hybrid energy storage system (HESS), aiming to optimize the system’s operational characteristics and reduce the annual total cost [24]. Zhou et al., considering the optimal design of a solar-hydrogen hybrid system, constructed a comprehensive energy control framework model and used an improved harmony search algorithm to optimize the system’s size and reliability while minimizing costs [25]. Li et al. established an integrated energy system model and pointed out that effectively achieving the coordinated optimization scheduling of multiple energy sources, including blue hydrogen, to improve energy utilization efficiency and reduce carbon emissions, is an important direction for future research [26]. Concurrently advancing the state of the art, Khosravi and Abdolmohammadi recently introduced the dual-d-q (DDQ) grid-connected control paradigm and a hierarchical voltage/frequency (V/F) scheme based on HDL-RCNN. These innovations raise the power-flow efficiency of hydrogen-electric hybrid energy storage to 98% and simultaneously attenuate microgrid voltage oscillations and frequency excursions to 0.004 and 0.007 pµ, respectively [27,28]. Collectively, these contributions provide a rigorous foundation for the integration design and operational optimization of hydrogen-based systems, and they set the technical stage for the present study to further corroborate their comprehensive benefits within the proposed 4E assessment framework. However, due to the inherent complexity of hydrogen-containing energy systems and their comprehensive benefits spanning multiple dimensions, the above studies have not fully addressed these issues, and thus there are certain limitations in the practical application and promotion of the systems. In these studies, the main focus has been on a few objectives such as economy and environment, which is not sufficient for a comprehensive evaluation of the integrated benefits of hydrogen-containing energy systems. Therefore, some scholars are increasingly paying attention to the related comprehensive benefit evaluation.
Wu et al. proposed a hybrid evaluation framework that integrates the Best-Worst Method (BWM) and an enhanced entropy weight method, using the coefficient of variation to assess the performance of integrated energy systems that include hydrogen production processes [29]. Zhang et al. introduced a decision-making model combining Z-AHP and Z-TOPSIS, utilizing intuitionistic fuzzy numbers and α-cut techniques to evaluate and prioritize alternatives, and demonstrated its effectiveness through a case study on hydrogen energy storage technology selection [30]. Tang et al. comprehensively evaluated the sustainability of Port Integrated Multi-Energy Systems (PIMES) by introducing an innovative multi-criteria dynamic sustainability assessment framework, employing diverse indicators, a combination weighting method based on game theory, cloud models, and sensitivity analysis [31].
Although the aforementioned multi-criteria decision-making (MCDM) studies have considered some factors such as energy, economy, and environment, the selection of specific indicators and the applicability of the methods still need further exploration. Regarding the analysis of hydrogen-containing integrated energy systems, the following points are summarized: Existing hydrogen storage systems mainly rely on renewable energy sources such as wind power and photovoltaics, which are significantly affected by natural conditions and have high costs for green hydrogen. Despite the great potential of green hydrogen due to its low-carbon and environmentally friendly nature, the coupling of blue and green hydrogen should be fully valued under realistic conditions. Blue hydrogen is cost-effective and, when combined with carbon capture technology, becomes low-carbon. Its coupling with green hydrogen can balance cost and low-carbon characteristics, promoting the sustainable development of hydrogen-containing integrated energy systems (IES). However, in existing hydrogen-containing energy systems, the coupling of blue and green hydrogen has not been fully considered. Current research on hydrogen-containing IES mostly focuses on operational optimization. But with the increasing proportion of renewable energy, the complementary characteristics of hydrogen-containing IES give it significant advantages in economy, environment, energy, and energy efficiency. Although some studies have considered economic and environmental benefits during operational optimization or used different methods to evaluate their economic, environmental, and energy efficiency performance, there has been less attention to the comprehensive benefits of hydrogen-containing energy systems. A wide range of evaluation methods have also been used in the assessment of hydrogen storage. However, there are complex interrelationships between the various aspects of the comprehensive benefits of hydrogen storage. The applicability of traditional MCDM methods needs to be enhanced, and there is a need to construct a more targeted MCDM method system that meets the 4E benefits of hydrogen-containing IES.
Building on this foundation, this paper proposes a Green and Blue Hydrogen Integrated Energy System (GBH-IES) that integrates wind power, natural gas, and other resources for hydrogen production. The performance of the GBH-IES is evaluated from a novel 4E perspective, filling the gap in previous research. By introducing the structure of the GBH-IES, a 4E evaluation index system is constructed from four dimensions: economy, technology, environment, and society. Based on this, an integrated multi-criteria decision-making model is developed. The model employs a fuzzy DEMATEL method composed of triangular fuzzy numbers, centroid fuzzy C-means, and DEMATEL to quantify the causal relationships between indicators and establish a scientific input-output evaluation index system. The DEA model is used to preliminarily assess the performance of the system indicators, and the entropy weight TOPSIS method is introduced to rank the better solutions. Finally, the applicability and effectiveness of the model are verified through case analysis.
Overall, the contributions of this paper are primarily manifested in three aspects. First, considering the economic advantages of blue hydrogen relative to green hydrogen, this paper integrates wind power and natural gas for hydrogen production and storage to construct the Green and Blue Hydrogen Integrated Energy System (GBH-IES) and analyzes its system structure. This system is capable of simultaneously meeting the demands for electricity, heat, and hydrogen. Second, the paper examines the comprehensive benefit characteristics of the GBH-IES from four aspects: economy, technology, environment, and society, and designs a 4E comprehensive benefit evaluation index system for the GBH-IES, which includes 11 indicators. Finally, by combining triangular fuzzy numbers, centroid fuzzy C-means, DEMATEL method, DEA, and entropy weight TOPSIS decision-making methods, a hybrid MCDM model for evaluating the 4E performance of the GBH-IES is constructed. This model examines the causal relationships between indicators and the efficiency ranking, ensuring the stability and interpretability of the evaluation results.
To analyze the performance of blue and green hydrogen in the GBH-IES, a comprehensive benefit assessment and sensitivity analysis are conducted for nine cases under different CEFs and HBRs, considering three cases: solely blue hydrogen, solely green hydrogen, and the synergistic effect of blue and green hydrogen. In addition, a comparison of evaluation methods is carried out to verify the advantages of the proposed hybrid model.
The structure of this paper is organized as follows. Section 2 presents the structure of the GBH-IES and constructs a system performance evaluation index system from a 4E perspective. Section 3 introduces the hybrid MCDM model. Section 4 conducts a comprehensive benefit assessment and sensitivity analysis for nine cases under different CEFs and HBRs, considering three cases: solely blue hydrogen, solely green hydrogen, and the combination of blue and green hydrogen. It also compares the hybrid MCDM model with the DEA evaluation method. Section 5 concludes the paper with a summary of the findings.
2 Structure of GBH-IES and Analysis of 4E Indicator Selection
2.1 Structural Analysis of GBH-IES
The structure of the GBH-IES is shown in Fig. 1. The GBH-IES can meet diverse energy demands by optimizing the production, conversion, and storage of various types of energy, including electricity, hydrogen, gas, and heat. Electrolyzers utilize electrical energy to split water into hydrogen and oxygen. The produced hydrogen can be stored in hydrogen storage tanks or directly transported to hydrogen-blended gas turbines and hydrogen loads. Gas-to-hydrogen units convert natural gas into hydrogen through processes such as steam methane reforming or partial oxidation, further enriching the hydrogen supply of the system. Hydrogen-blended gas turbines, one of the key conversion devices in the system, use hydrogen-enriched natural gas as fuel to generate electricity and heat. The generated electricity can be fed into the higher-level grid or directly supplied to electrical loads, while the generated heat is transferred to thermal storage tanks via a heat recovery system for later use. Electric boilers and the thermal storage system further enhance the supply capability of thermal energy, ensuring the stable satisfaction of thermal loads. In terms of energy demand, the system is designed with three main output ports for electrical, thermal, and hydrogen loads to adapt to different energy consumption cases. Electrical loads are met by the higher-level grid, wind power, hydrogen-blended gas turbines, and electrolyzers; thermal loads are provided by hydrogen-blended gas turbines, electric boilers, and the thermal storage system; and hydrogen loads are supplied by electrolyzers, gas-to-hydrogen units, and hydrogen storage tanks. The operation of the entire system follows the principles of multi-energy complementarity and cascaded utilization. By dynamically adjusting the conversion and storage of different types of energy, the system adapts to the constantly changing load demands, achieving efficient energy conversion and utilization. The electricity flow is mainly transmitted and converted through the higher-level grid, wind power, hydrogen-blended gas turbines, and electrolyzers; the hydrogen flow is produced, stored, and used through electrolyzers, gas-to-hydrogen units, hydrogen storage tanks, and hydrogen-blended gas turbines; the heat flow is generated, stored, and released through hydrogen-blended gas turbines, electric boilers, heat recovery systems, and thermal storage tanks; and the natural gas flow is utilized through gas-to-hydrogen units and hydrogen-blended gas turbines. Overall, the GBH-IES can improve energy efficiency and energy supply reliability through energy cascading, and it has significant economic and environmental benefits.
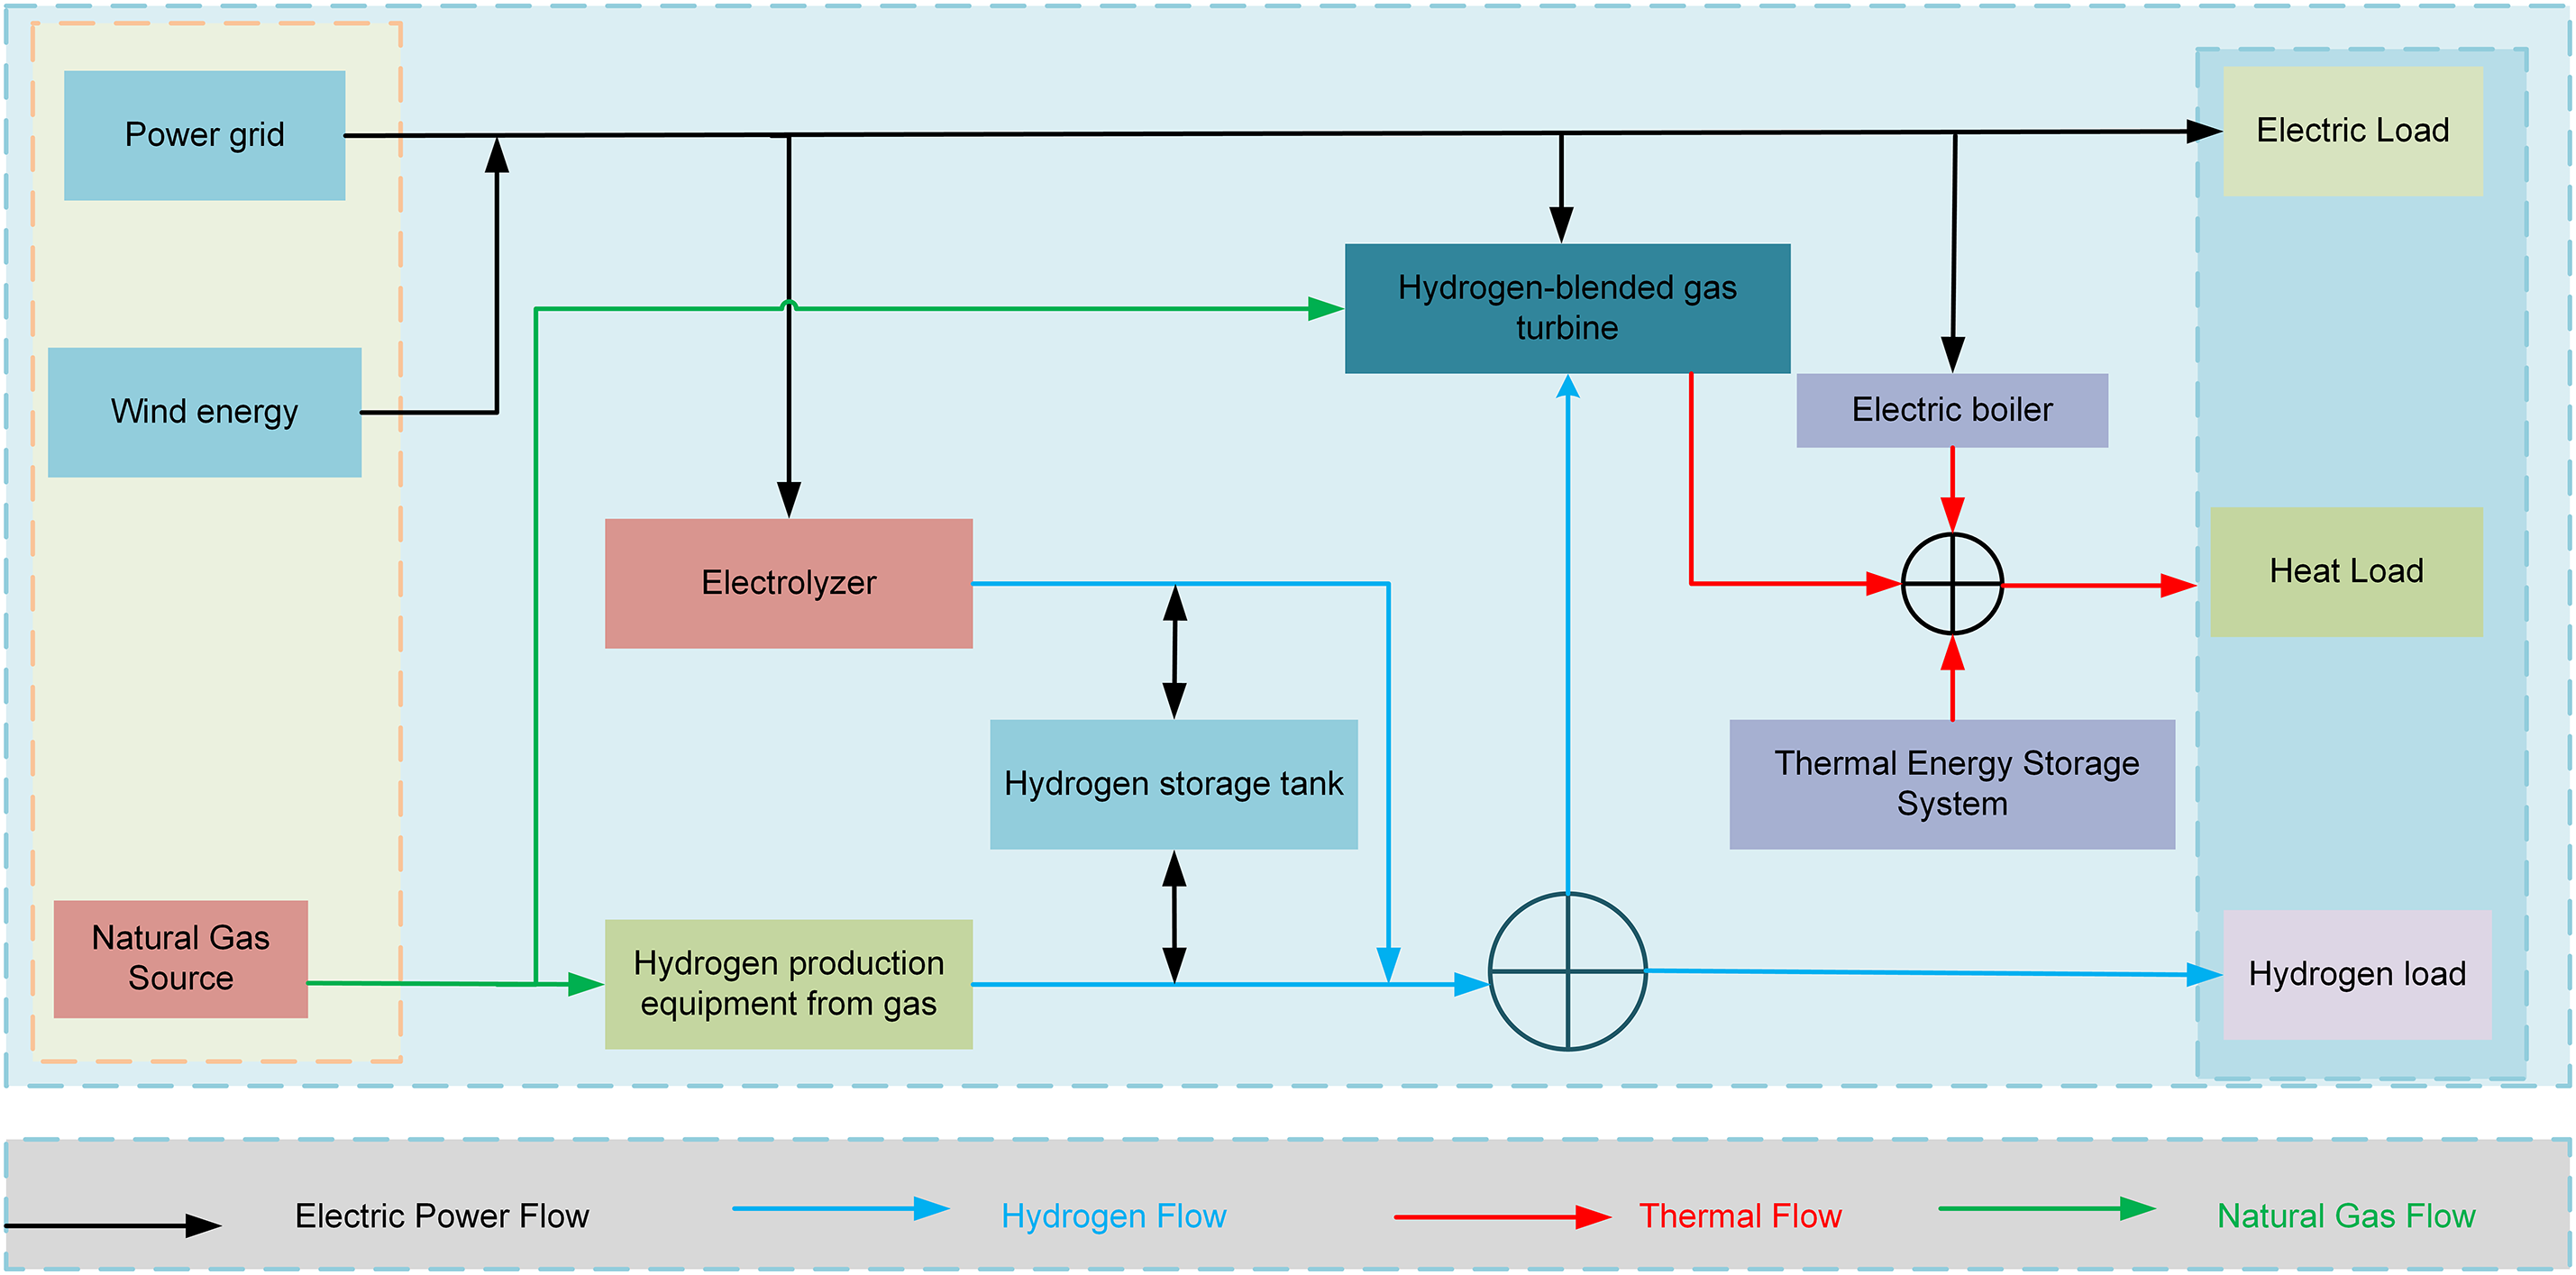
Figure 1: Structure of GBH-IES
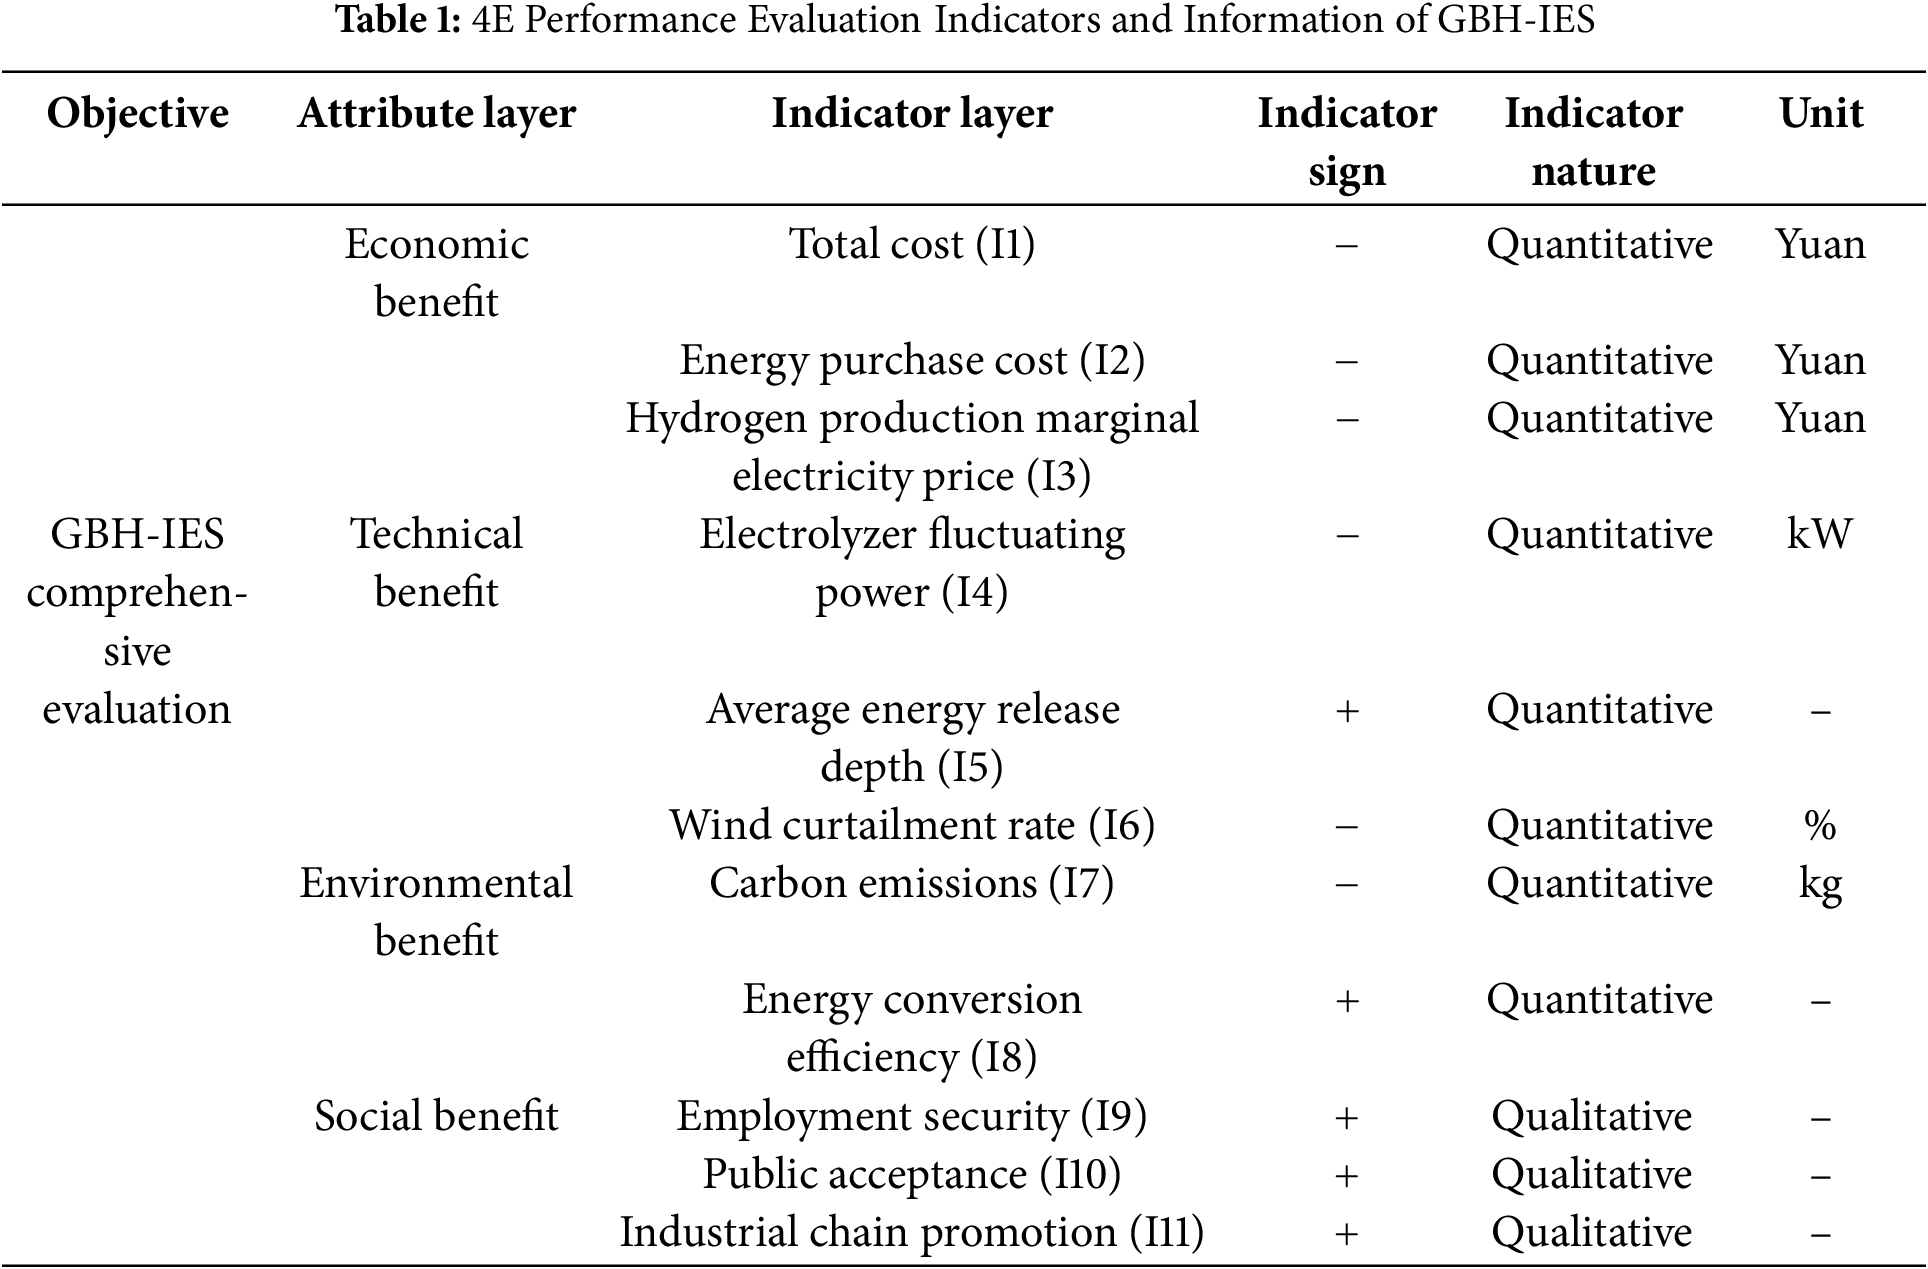
2.2 Analysis of the 4E Indicator Selection for GBH-IES
The GBH-IES exhibits significant 4E characteristics. Compared with traditional green hydrogen energy storage, the system not only possesses features such as cleanliness, economic viability, and high energy utilization efficiency but also offers advantages like multi-energy complementarity, cascaded utilization, strong operational flexibility, and high reliability. The coupling and optimization among energy, economy, environment, and society fully reflect the comprehensive performance of the GBH-IES. Based on the introduction of the GBH-IES system structure, this paper constructs a 4E performance evaluation index system for GBH-IES from four dimensions: economy, technology, environment, and society. The construction of the evaluation index system is based on the principles of systematicness, scientificity, simplicity, and operability. In the economic dimension, this paper selects total cost, energy purchase cost, and marginal hydrogen production electricity price as economic benefits. In the technological dimension, this paper selects the fluctuating power of electrolyzers and the average depth of energy storage release as technological benefits. In the environmental dimension, this paper selects the wind curtailment rate, carbon emissions, and energy conversion efficiency as environmental benefits. In the social dimension, this paper selects employment security, public acceptance, and industrial chain promotion as social benefits. Detailed information of each index is shown in Table 1.
3 Performance Evaluation Model of 4E for GBH-IES
3.1 Framework of the 4E Performance Evaluation Model for GBH-IES
The framework of the 4E performance evaluation model for GBH-IES proposed in this paper is shown in Fig. 2. The model consists of three modules: the fuzzy DEMATEL module, the DEA evaluation module, and the entropy weight TOPSIS method module. In the fuzzy DEMATEL module, the input-output evaluation index system is determined by integrating triangular fuzzy numbers, the CFCS method, and the DEMATEL method. DEMATEL calculates the causality and centrality of each factor through matrix operations, clarifying the interrelationships among factors and their positions in the system, and revealing the interactions among internal elements of the system [32,33]. However, the traditional DEMATEL method is only applicable to the real number domain and is not capable of handling complex fuzzy relationships. To address this, some scholars have extended it to the fuzzy domain, achieving accurate analysis of complex fuzzy relationship evaluation systems [34–36]. Triangular fuzzy numbers effectively solve the problem of fuzzy boundaries by calculating membership degrees, reducing the subjective influence in the weighting of indicators [37–39]. After converting the experts’ linguistic evaluations into numbers, the CFCS method is used for defuzzification, with its centroid-based fuzzy C-means calculation being more accurate and capable of reflecting the true values of the indicators, thus making the evaluation results more scientific and objective. The constructed fuzzy DEMATEL model can scientifically determine the input-output evaluation index system.
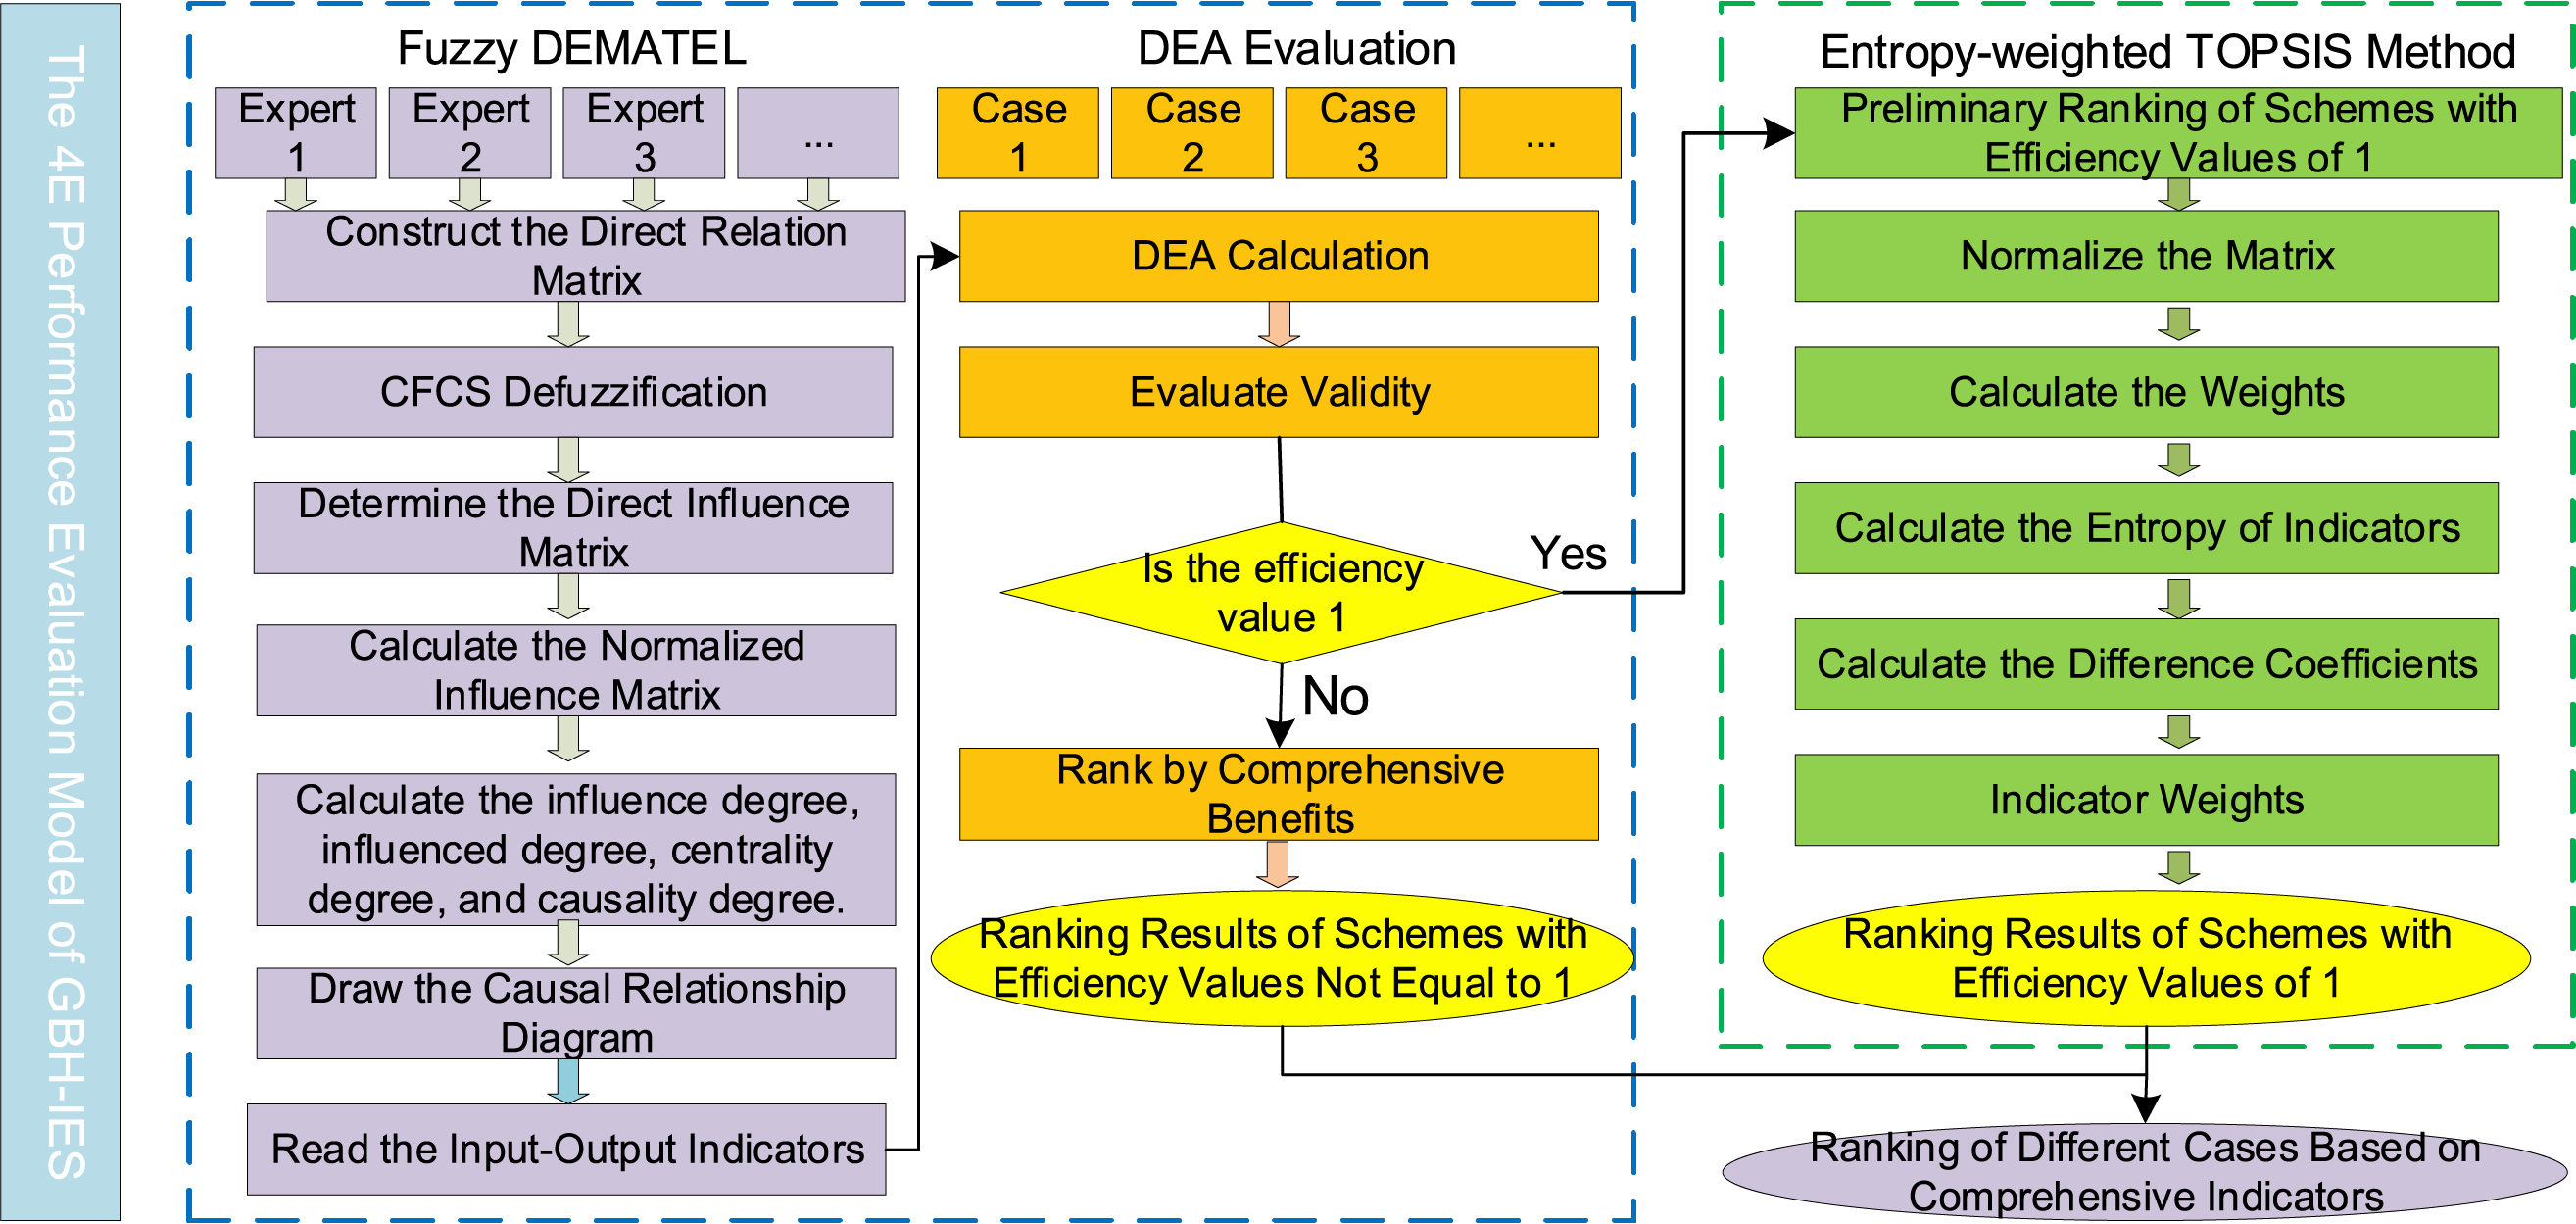
Figure 2: 4E performance evaluation model
In the DEA evaluation module, traditional DEA technology is employed. DEA is a multivariate analysis tool used to assess the relative efficiency of multiple homogeneous decision-making units (DMUs) [40,41]. By inputting the input-output indicators determined by the fuzzy DEMATEL into this module, a more objective reflection of the relative efficiency of each decision-making unit can be achieved. However, the traditional DEA model can only provide efficiency values between 0 and 1, and it is unable to further rank DMUs with an efficiency value of 1, making it difficult to identify the optimal unit. Therefore, we have introduced an entropy weight TOPSIS optimization module.
In the entropy weight TOPSIS module, the entropy weight TOPSIS method is adopted. This method can effectively solve the problem of being unable to further rank when the efficiency value is 1, thereby determining the best decision-making unit. The entropy weight TOPSIS method is a ranking method based on entropy weight and the ideal solution, introducing entropy weight to calculate the weights of each indicator, thus forming a comprehensive evaluation system that takes into account the differences among indicators. It reflects the merits and demerits of each scheme based on the full consideration of indicator differences, making the evaluation results more scientific and objective.
3.2 Description of the Evaluation Methods
Triangular fuzzy numbers effectively address the imprecision of traditional methods when dealing with fuzzy boundaries, reducing the subjectivity in the weighting process of indicators. The CFCS method, through centroid-based fuzzy C-means calculation, compensates for the inaccuracy of traditional defuzzification methods in reflecting the true values of indicators. The DEMATEL method overcomes the limitation of revealing the complex interrelationships within a system through single-factor analysis alone, clarifying the interactions among factors and their positions in the system through matrix operations. The fuzzy DEMATEL model constructed by integrating these three approaches not only makes up for the shortcomings of traditional methods in handling complex fuzzy relationships but also enhances the scientific nature and reliability of the evaluation results.
Step 1: Invite k experts to form an expert evaluation panel, denoted as
In the formula,
Step 2: Defuzzify matrix
In the formula,
Step 3: Calculate the normalized values on the left and right sides, as well as the total normalized value, using the following formula:
Step 4: Calculate the defuzzified values of the evaluations by each expert:
Step 5: Integrate the evaluations of all experts to obtain the defuzzified direct influence matrix:
Step 6: After obtaining the defuzzified direct influence matrices from all experts, proceed with the DEMATEL calculations. First, normalize the influence matrix. The normalization is performed using the row maximum method. Sum each row of the matrix and identify the maximum value among these sums. Divide all elements of the matrix by this maximum value to obtain the normalized influence matrix.
Step 7: Construct the comprehensive influence matrix. The composite system matrix reflects the aggregate effects of the interactions among all elements within the system.
In the formula,
Step 8: Calculate the influence degree, influence-receiving degree, centrality, causality, and weights of each element.
The influence degree refers to the sum of each row in the matrix, representing the total influence of each element on all other elements, denoted as
The influence-receiving degree refers to the sum of each column in the matrix, representing the total influence received by each element from all other elements, denoted as
Centrality indicates the position of a factor in the evaluation system and the magnitude of its role. The centrality of a factor is the sum of its influence degree and influence-receiving degree, denoted as
The causality is obtained by subtracting the influence-receiving degree from the influence degree of a factor, denoted as
by normalizing the centrality, the weight of the indicator can be obtained.
The centrality of an indicator reflects its position and significance within the indicator system, while the causality of an indicator reflects its net impact on the system. A causality greater than zero indicates that the indicator’s influence on other indicators outweighs the influence of other indicators on it, and such an indicator is termed a causal indicator (input indicator). Conversely, a causality less than zero signifies that the indicator’s influence on other indicators is less than the influence of other indicators on it, and this type of indicator is referred to as an effect indicator (output indicator). When the causality equals zero, it means that the indicator’s influence on other indicators is equal to the influence of other indicators on it, suggesting that the indicator could potentially be excluded.
Step 9: Construct the causal diagram. Plot the causality diagram with centrality on the x-axis and causality on the y-axis. Factors above the x-axis are causal factors, while those below are effect factors, thereby identifying the input and output indicators.
The DEA method assesses the DEA efficiency of each decision-making unit (DMU) by analyzing their input-output efficiency. For a multi-input and multi-output indicator system, the CCR (Charnes Cooper Rhodes) model is employed to conduct the system analysis [42]. The CCR model is a DEA efficiency evaluation model based on constant returns to scale.
Assuming there are n DMUs, each with m types of inputs and r types of outputs. The optimization model aimed at maximizing the relative efficiency of the system is as follows [43]:
In the formula:
The optimal solutions obtained from the above model are
(1) When
(2) When
(3) When
3.2.3 Entropy Weight-TOPSIS Model
For the ranking of the results calculated by the above model, the effective decision-making units with an efficiency value of “1” are further ranked to determine the best decision-making unit. The principle is to use the DEA model to measure efficiency, and when the efficiency value is not 1, exclude it from the set of decision-making units. When the efficiency value is 1, the entropy weight TOPSIS method is used for ranking, compensating for the shortcomings of DEA.
Step 1: Arrange the matrix of efficiency values equal to 1 into an n × m matrix:
In the formula, n represents the number of objects, and m represents the number of indicators.
Step 2: Use the range method to normalize and standardize the original matrix in a positive direction, resulting in the standardized matrix
(1) Positive indicators:
(2) Negative indicators:
Step 3: Calculate the proportion
Step 4: Calculate the entropy value
Step 5: Calculate the difference coefficient
Step 6: Calculate the weight
Step 7: Multiply each column of the standardized matrix
Step 8: Determine the positive and negative ideal solutions. The positive ideal solution is composed of the maximum values of each column in the weighted standardized matrix, while the negative ideal solution is composed of the minimum values of each column. The weighted standardized matrix
(1) Positive ideal solution:
(2) Negative ideal solution:
Step 9: Calculate the distances between each object and the positive and negative ideal solutions using the Euclidean distance:
Step 10: Calculate the relative closeness to the negative ideal solution and rank them. The relative closeness ranges from 0 to 1, with a higher value indicating a greater distance from the negative ideal solution, which is better.
Step 11: Integrate the decision-making units with efficiency values not equal to 1 from the DEA model with those ranked by the compensatory model to derive the overall evaluation ranking.
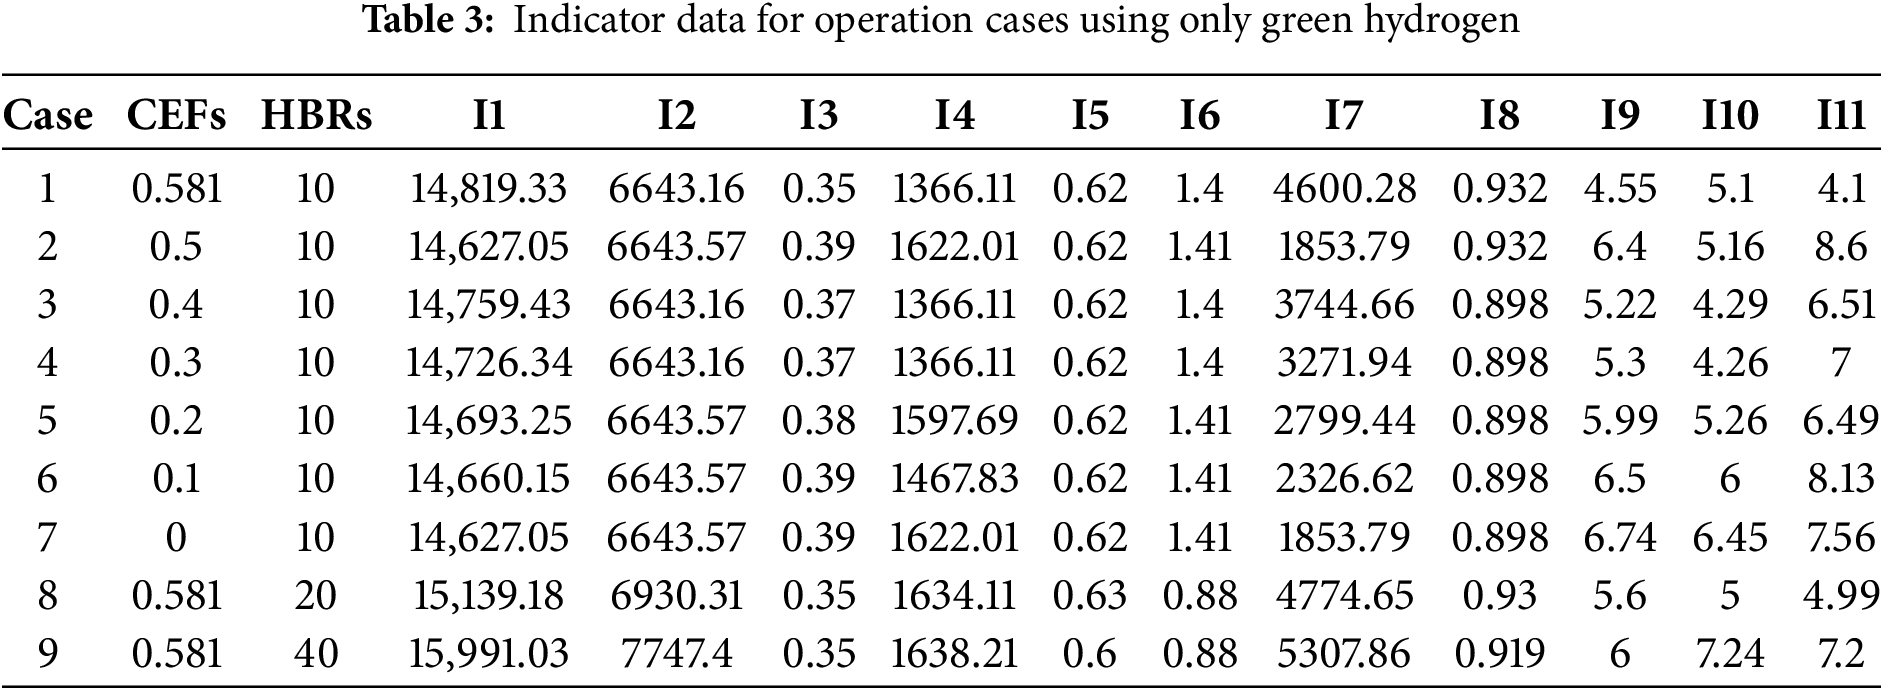
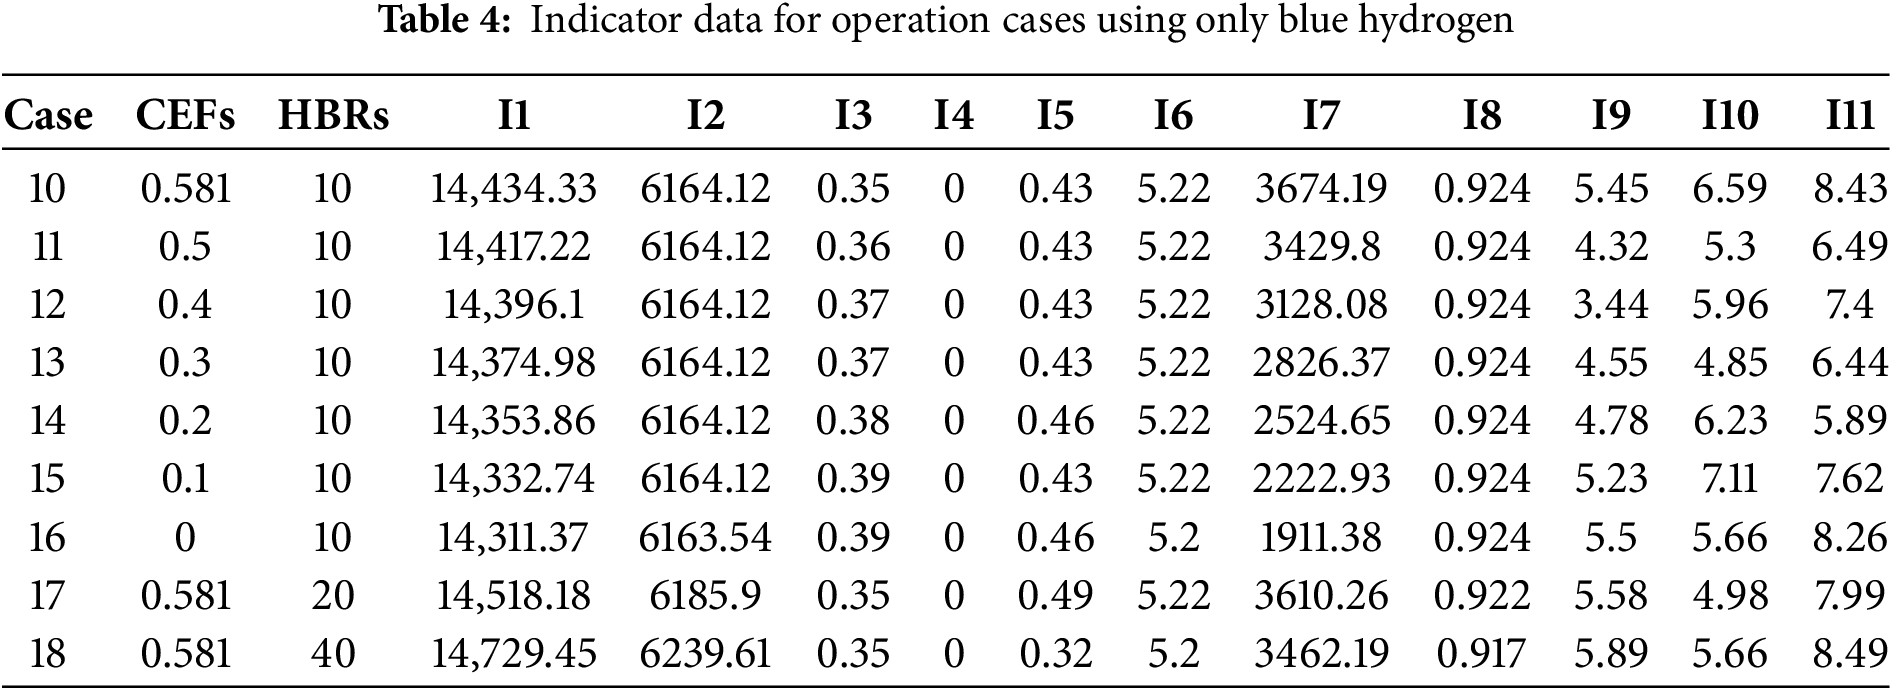
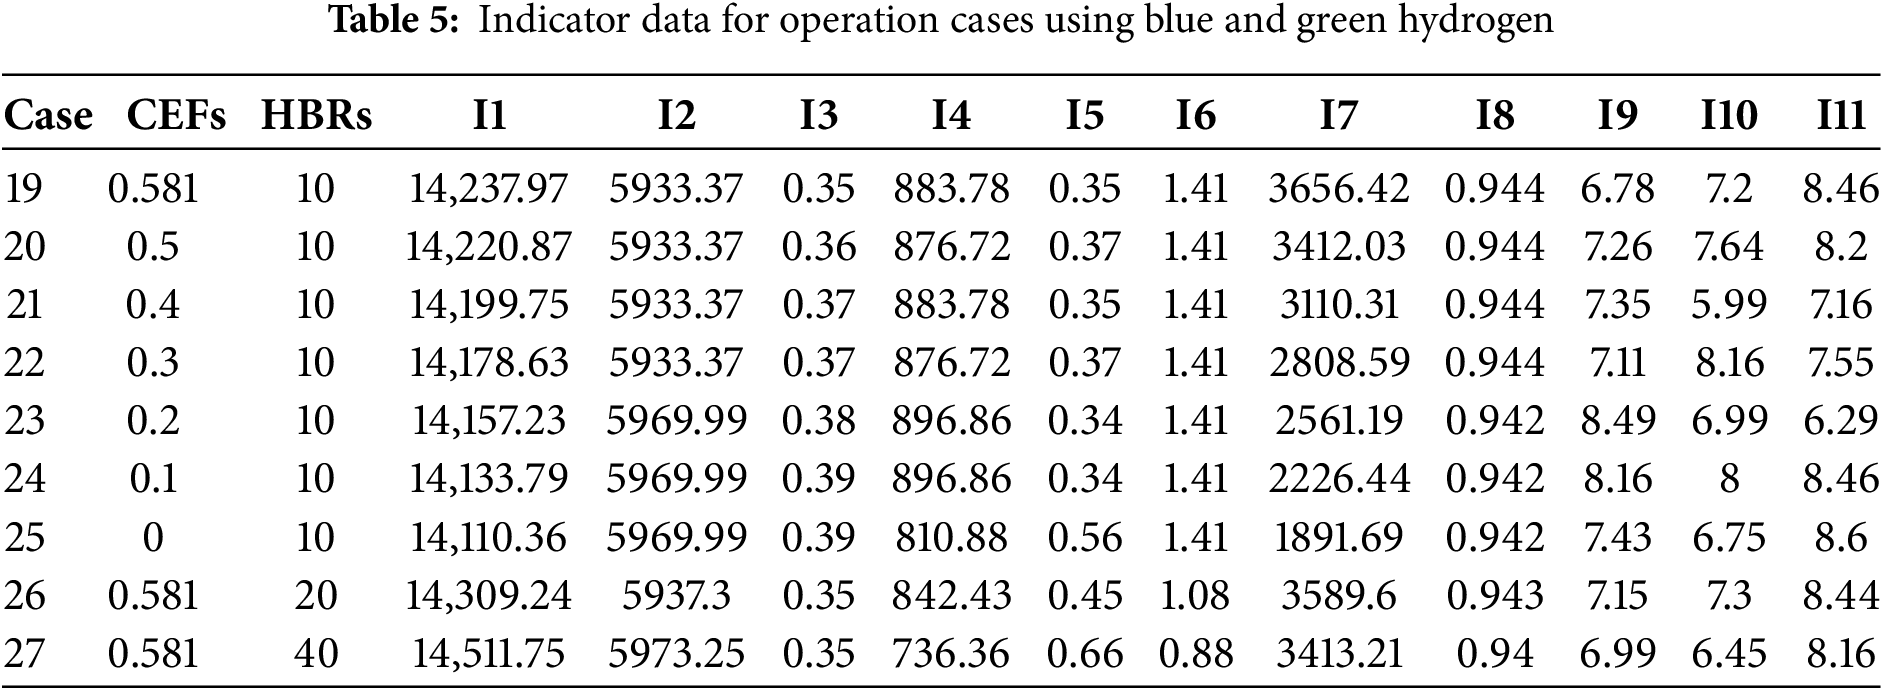
To verify whether the combined use of blue and green hydrogen in the GBH-IES energy storage system yields good economic benefits, this paper comprehensively evaluates nine cases each for green hydrogen only, blue hydrogen only, and the co-operation of blue and green hydrogen under different grid CEFs and gas turbine HBRs. Additionally, the impact of varying grid CEFs and gas turbine HBRs on the energy storage system is analyzed. During the comprehensive evaluation, the first eight indicators (I1–I8) were quantified through high-fidelity simulations executed on the Matlab–CPLEX platform. A mixed-integer linear programming (MILP) formulation was employed to capture the multi-vector coupling among electricity, hydrogen, heat and natural gas, while explicitly incorporating a carbon-trading mechanism and the full set of operational constraints of each unit. The optimisation horizon was set to 24 h, and three strategic scenarios—green hydrogen only, blue hydrogen only, and combined green–blue hydrogen—were systematically investigated under varying grid carbon-emission factors (0–0.581 kg kWh−1) and gas-turbine hydrogen-blend ratios (10%, 20%, 40%). All numerical outputs were extracted from the open data reported in Table 7 of Reference [26], thereby guaranteeing repeatability and authoritative sourcing. The final three indicators were elicited through a two-round Delphi exercise conducted among eight carefully selected experts: three professors, two senior industry engineers, and three practitioners each with more than eight years of direct experience in hydrogen-based energy systems. After receiving an identical briefing document that detailed the scenarios and indicator definitions, the panellists provided anonymous ratings. In the first round, mean scores, standard deviations and coefficients of variation (CV) were calculated and fed back to the group; consensus was pre-defined as CV ≤ 0.20. During the second round, experts were permitted to revise their judgements in light of the aggregated feedback, and iteration continued until every scenario-specific CV for the three indicators had fallen between 0.10 and 0.19. The arithmetic mean of the second-round ratings was then adopted as the definitive indicator value. All data, both simulated and expert-derived, were collated into a single dataset; the resulting operational metrics for green-hydrogen-only, blue-hydrogen-only and combined green–blue-hydrogen deployments are reported in Tables 3–5, respectively.
4.1 Fuzzy DEMATEL Determination of Input-Output Indicator System
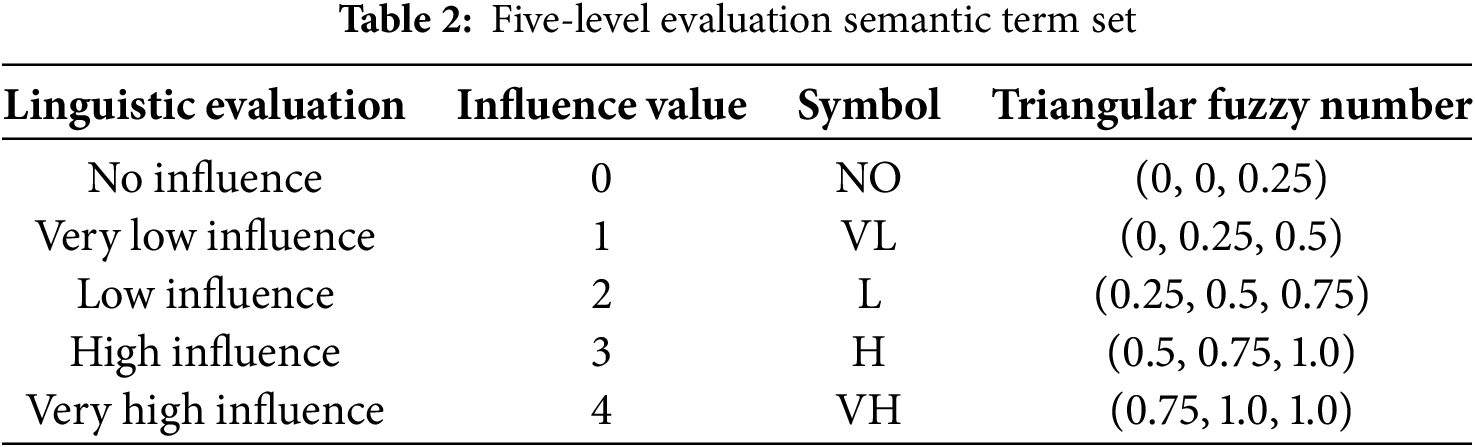
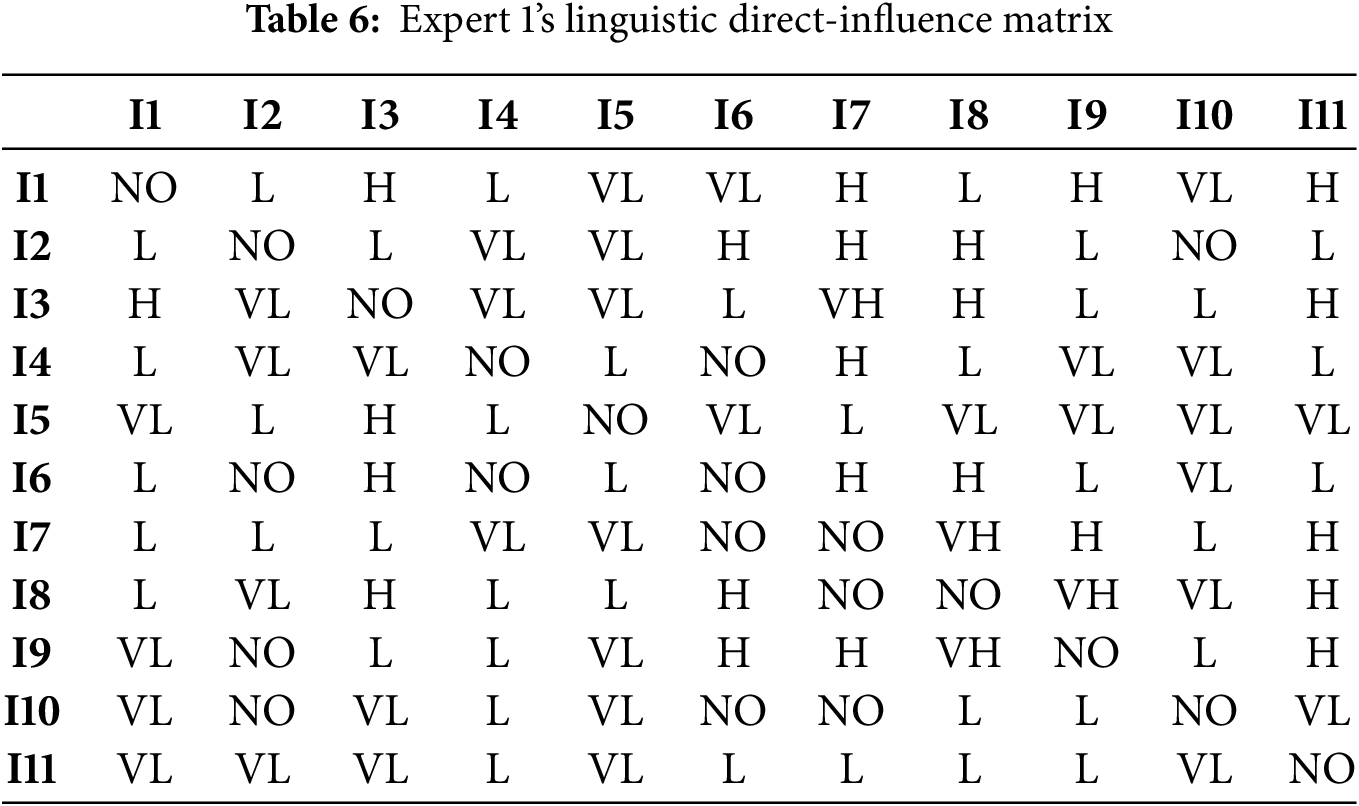
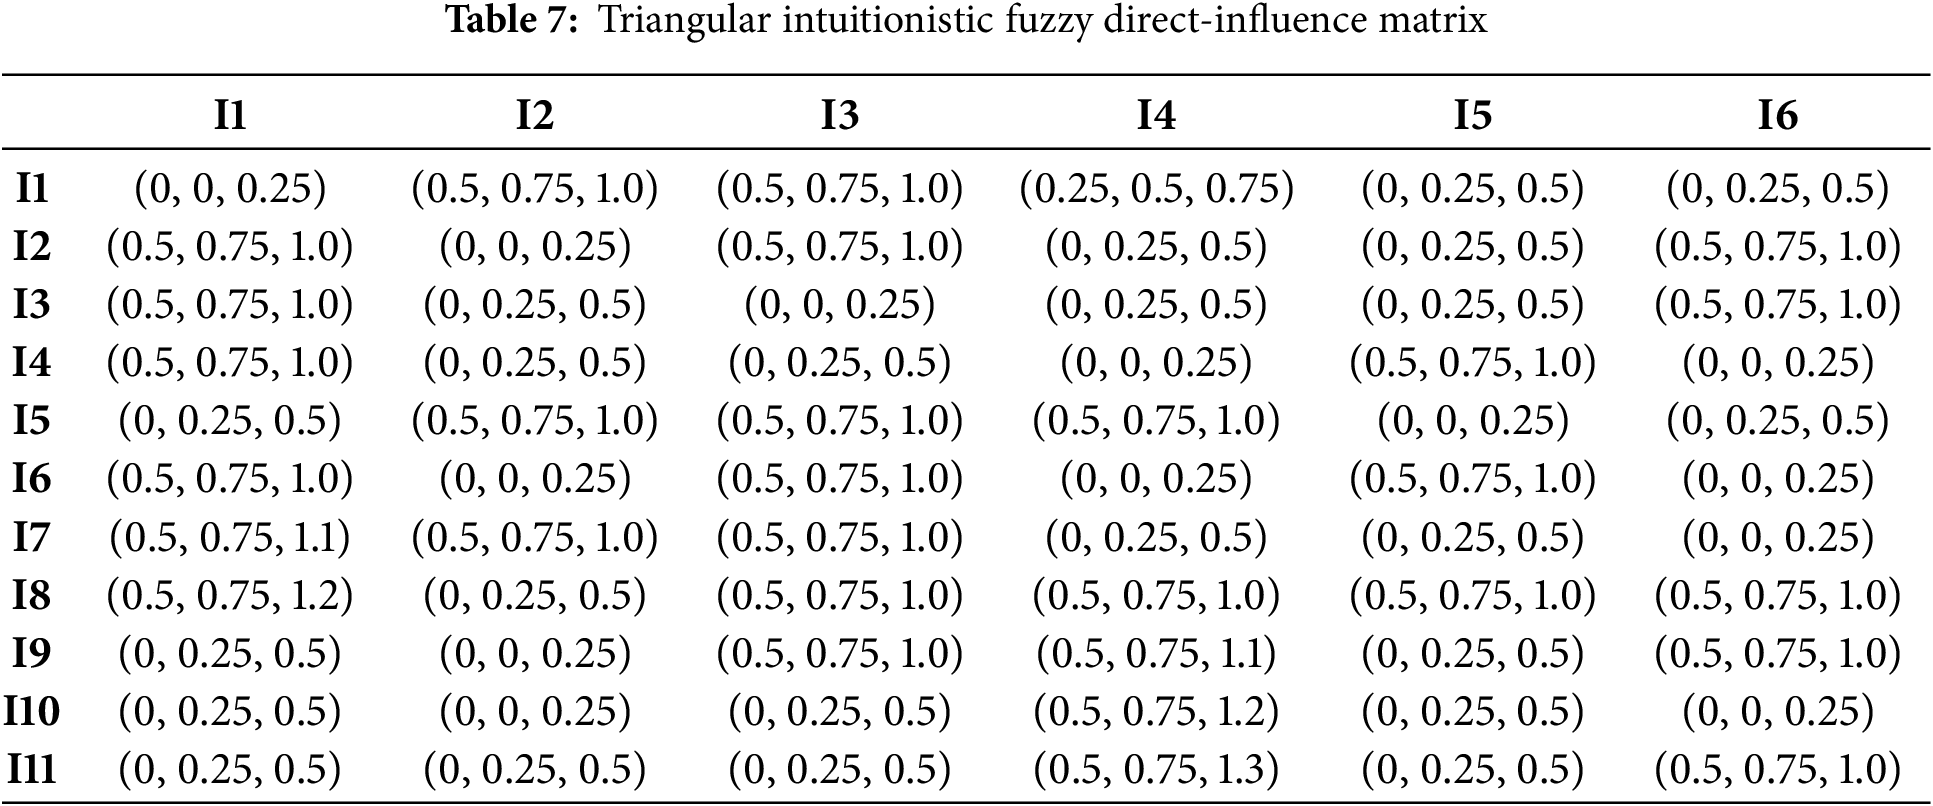
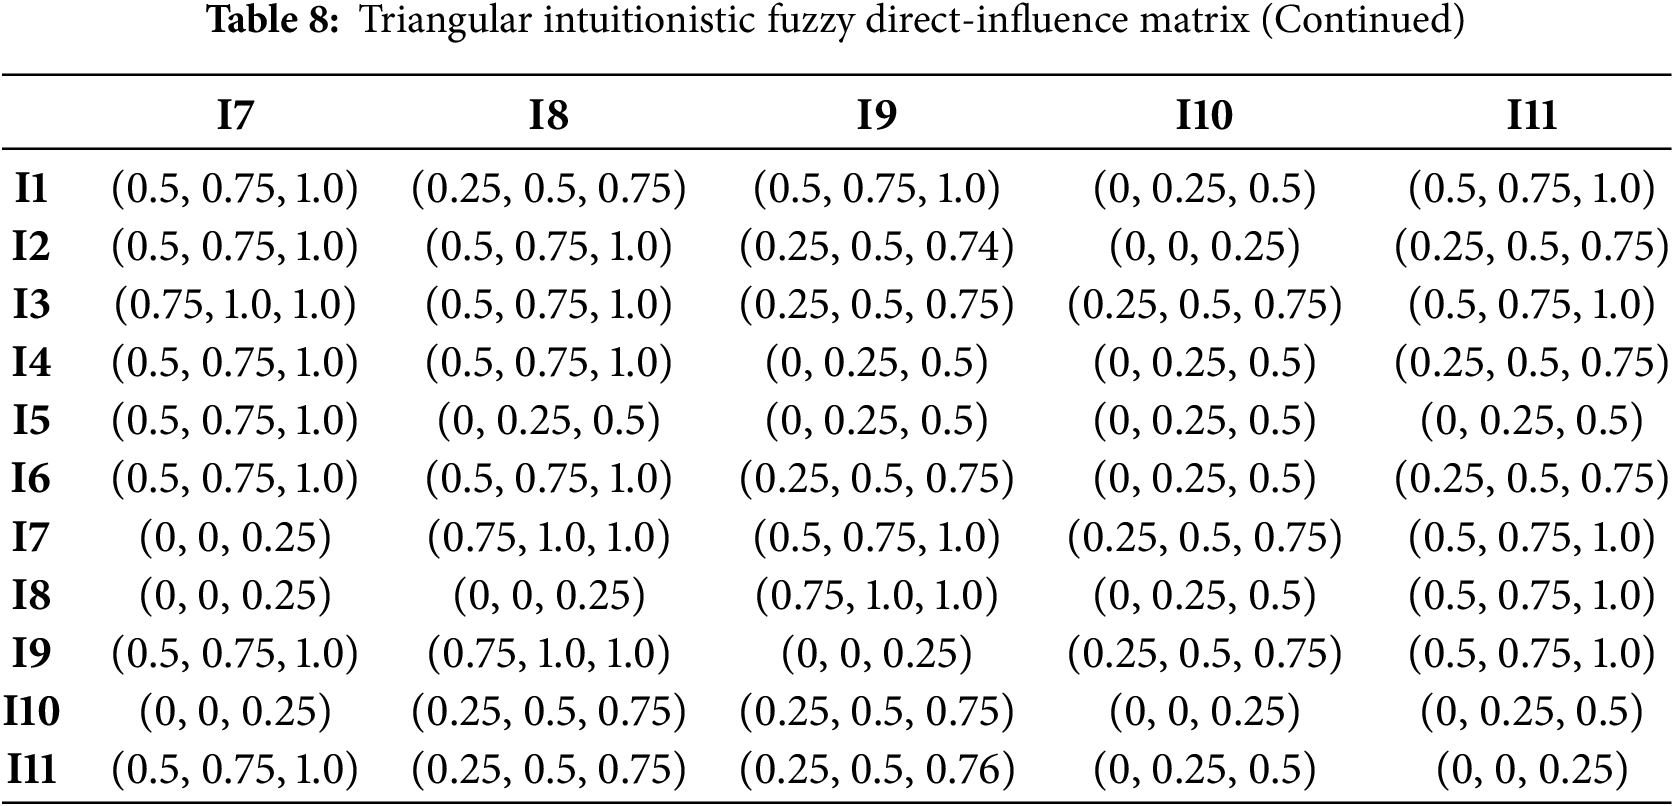
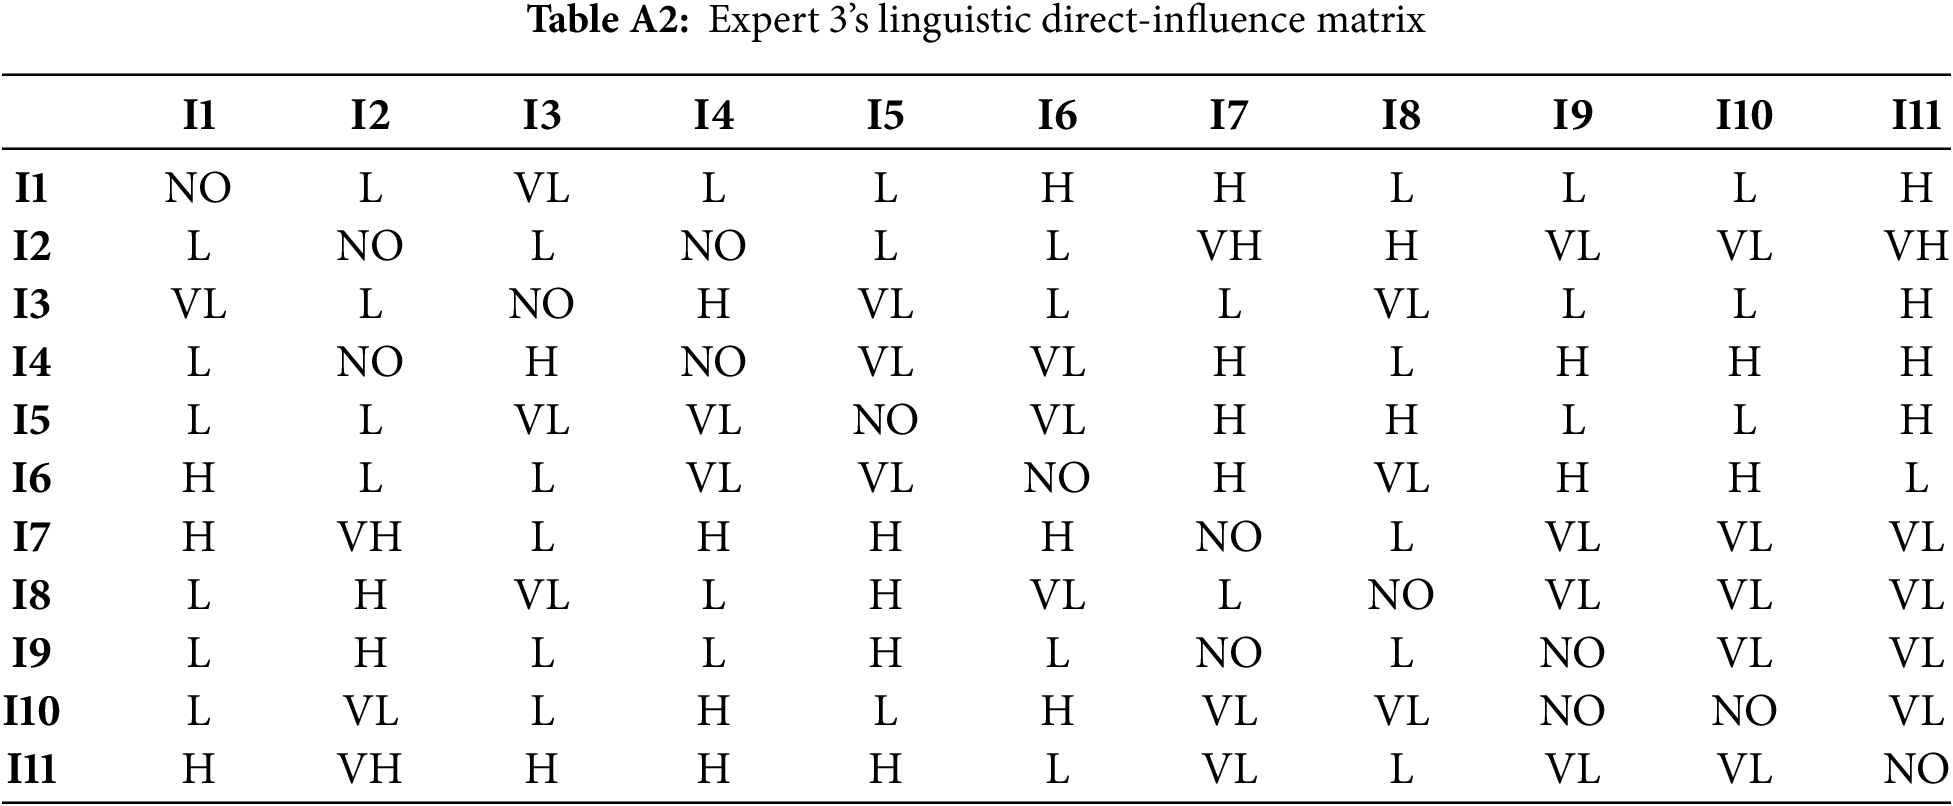
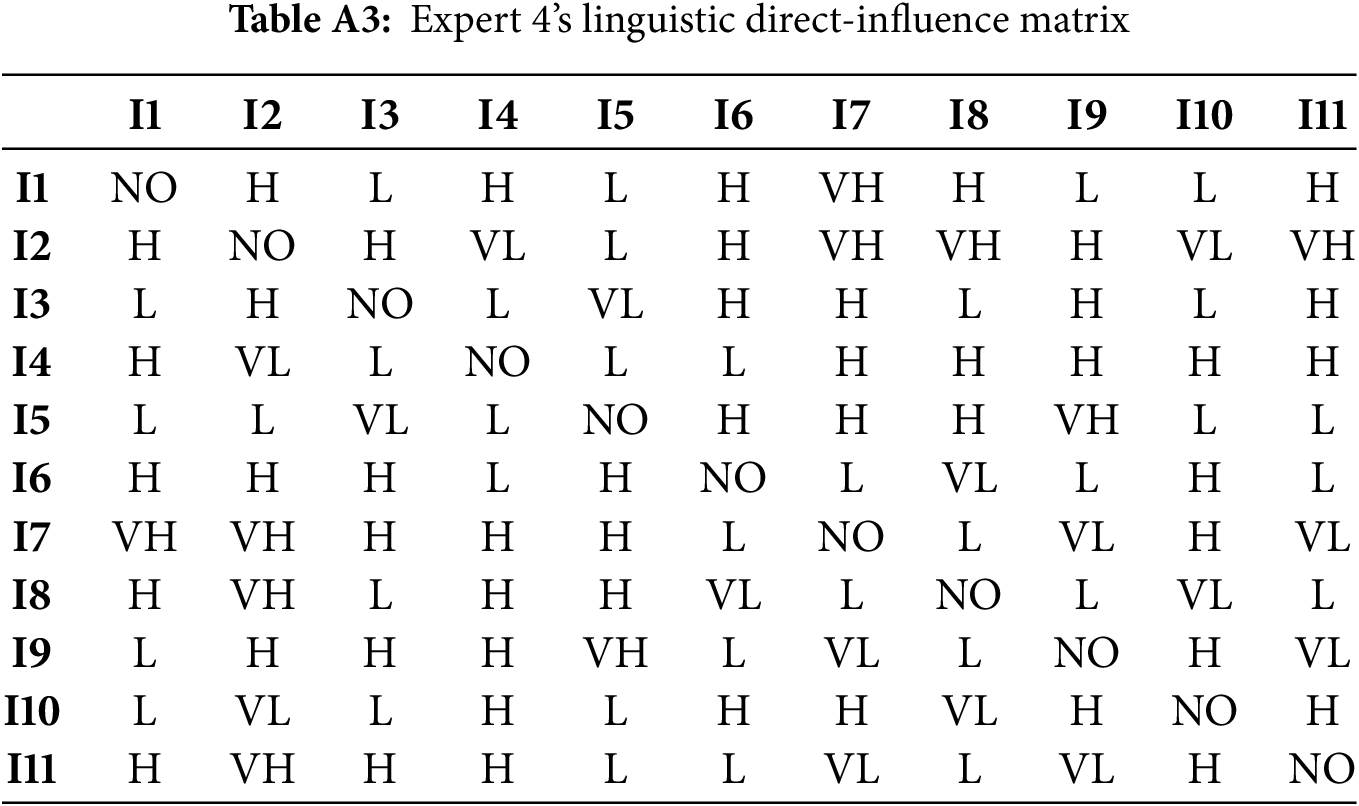
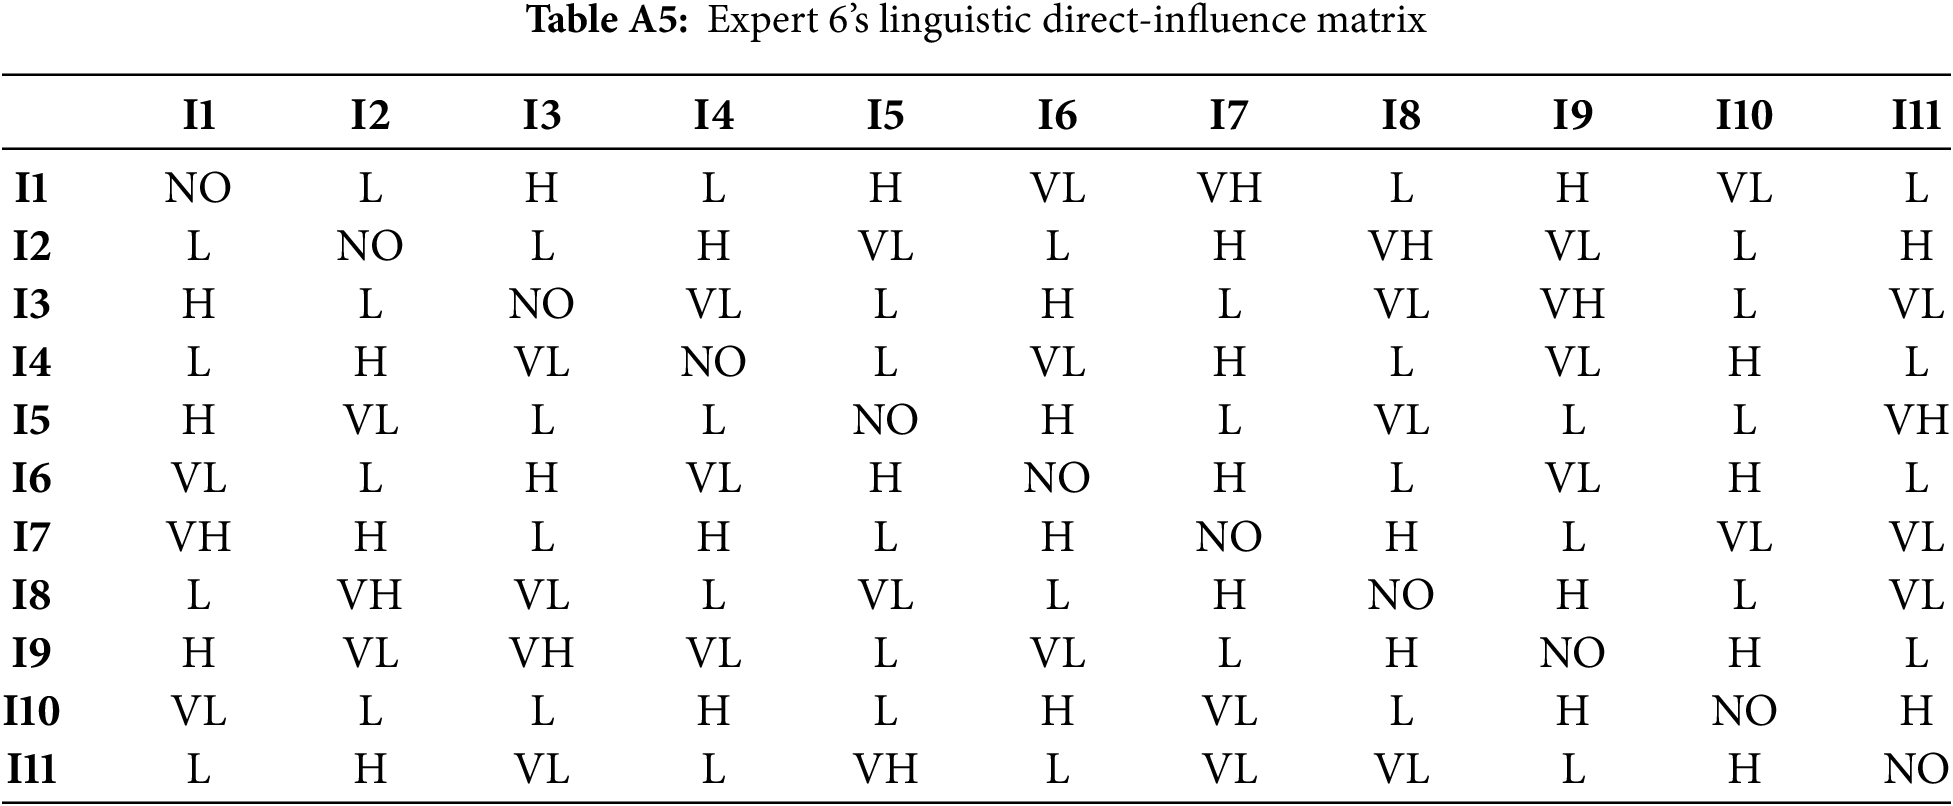
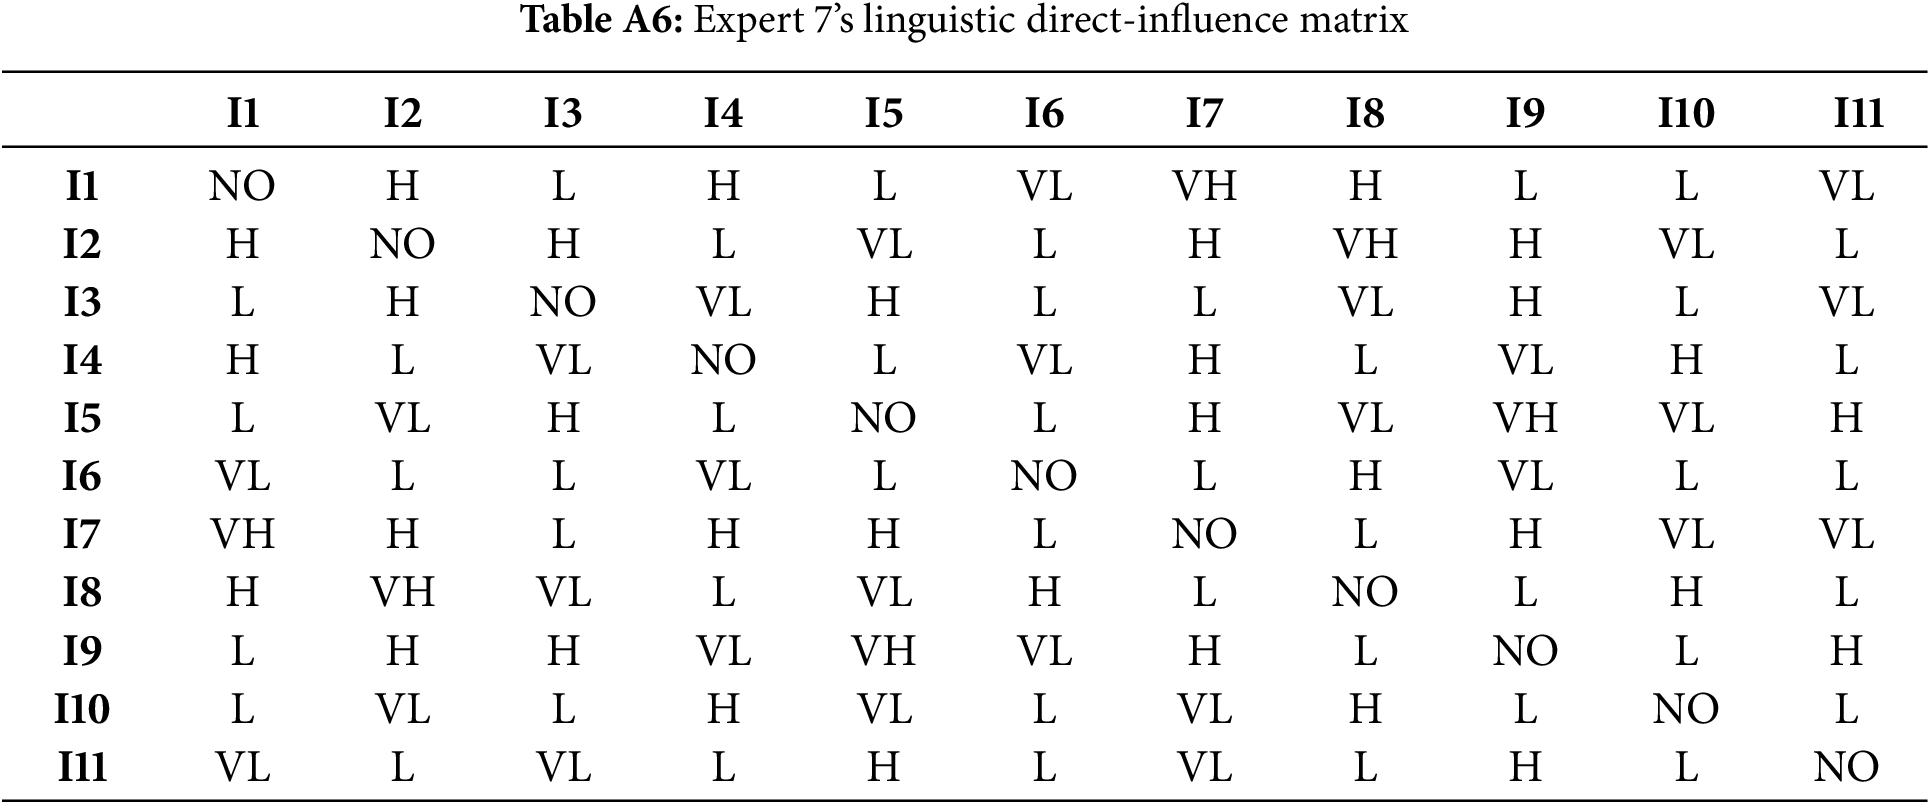
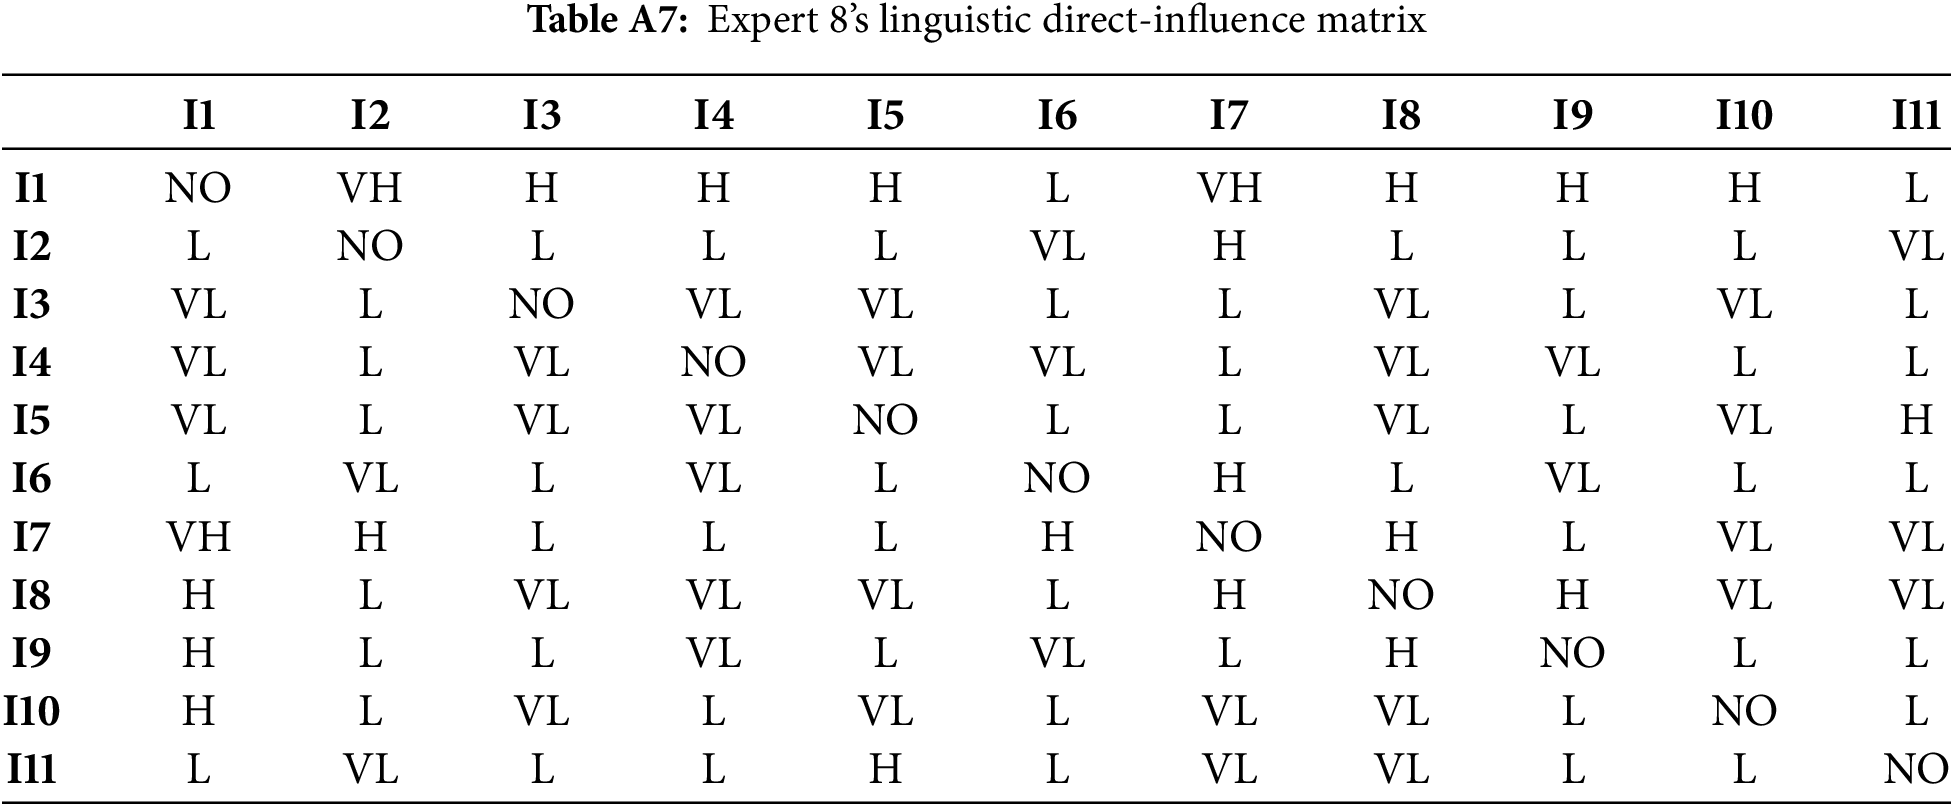
Eight domain experts—three from the National Energy Group, three from universities and two from industry—were invited to perform pairwise comparisons of the indicators under equal weighting. Each expert assigned semantic judgements to every pair, thereby constructing a linguistic direct-influence matrix; these linguistic terms were then converted into triangular intuitionistic fuzzy numbers according to Table 2, yielding an individual triangular intuitionistic fuzzy direct-influence matrix for every expert. Taking Expert 1 as an illustration, the linguistic matrix is presented in Table 6 and its triangular intuitionistic fuzzy counterpart in Tables 7 and 8. The linguistic direct-influence matrices for the remaining seven experts are given in Tables A1–A7 of Appendix A.
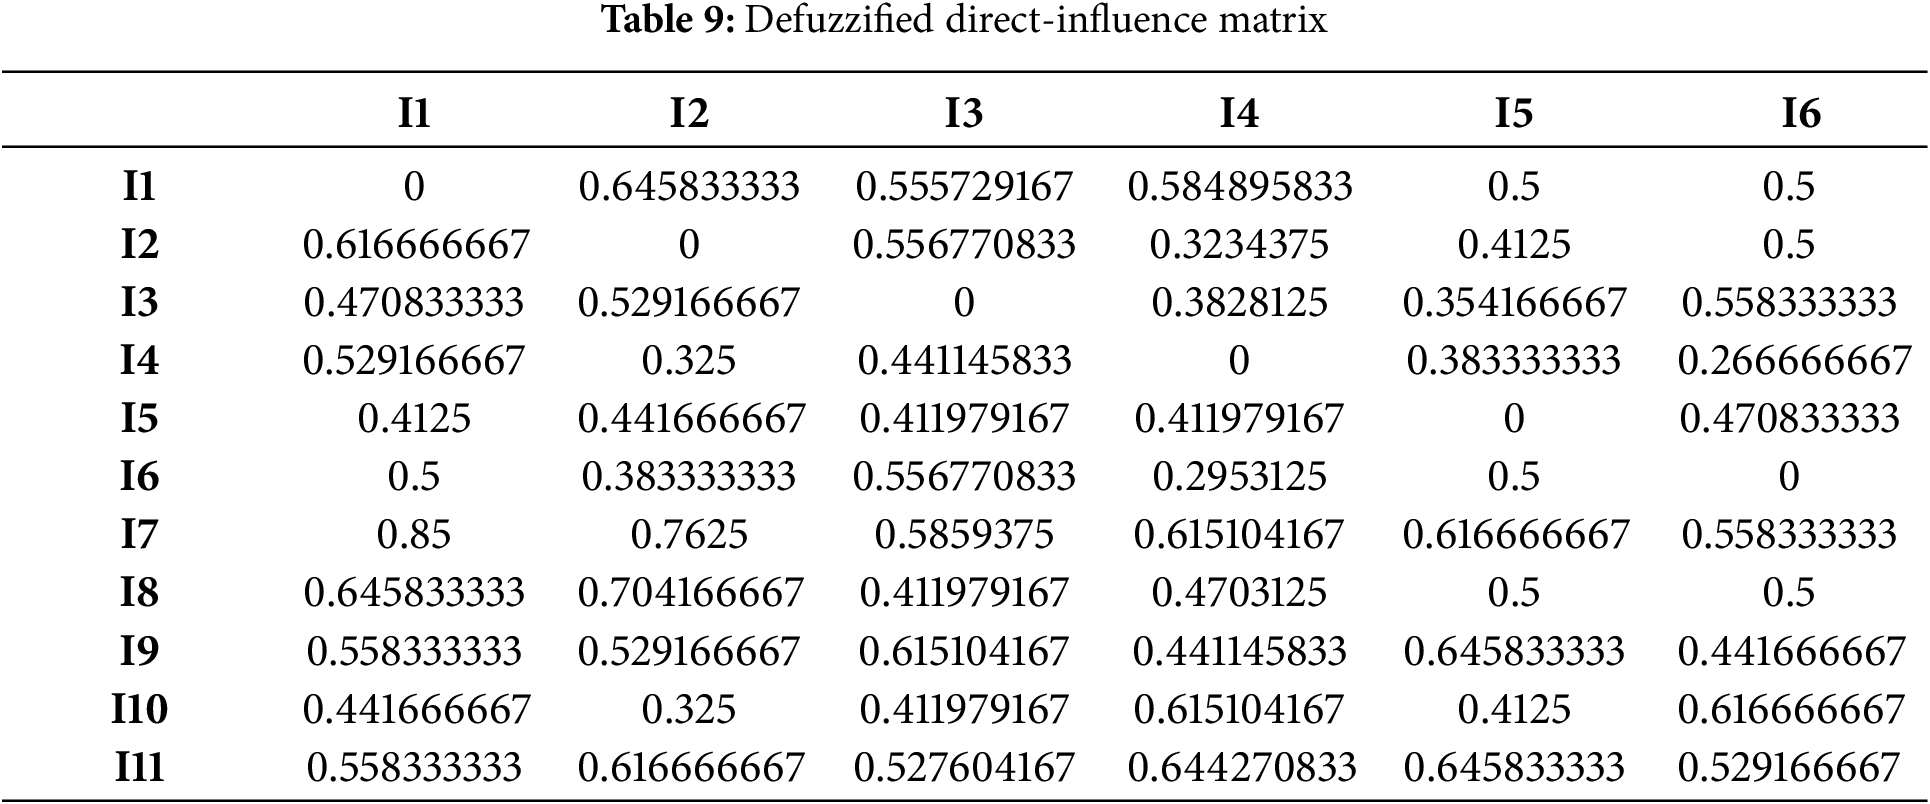
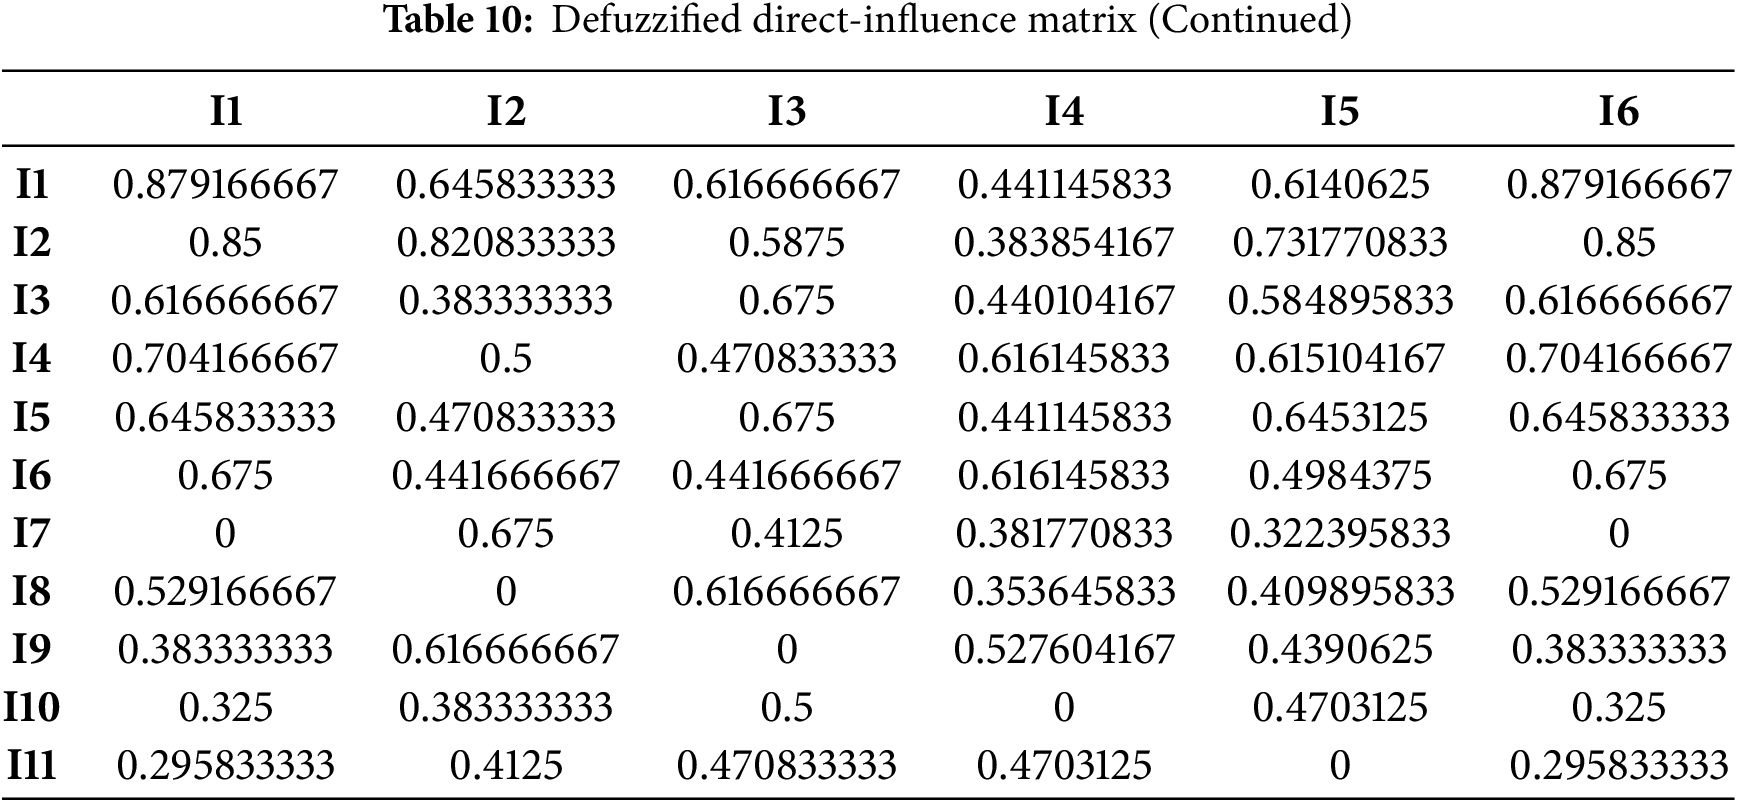
After the above processing had been applied to the opinions of the eight experts, Eqs. (2)–(9) were employed to defuzzify the triangular fuzzy numbers. The resulting matrices, normalised and defuzzified, constitute the direct-influence matrix presented in Tables 9 and 10.
Applying Eqs. (10)–(15), the DEMATEL-derived comprehensive influence matrix was used to quantify each indicator’s degree of influence and degree of being influenced, from which centrality and causality were subsequently derived; the resulting influence and centrality values for the 4E indicators are reported in Table 11.
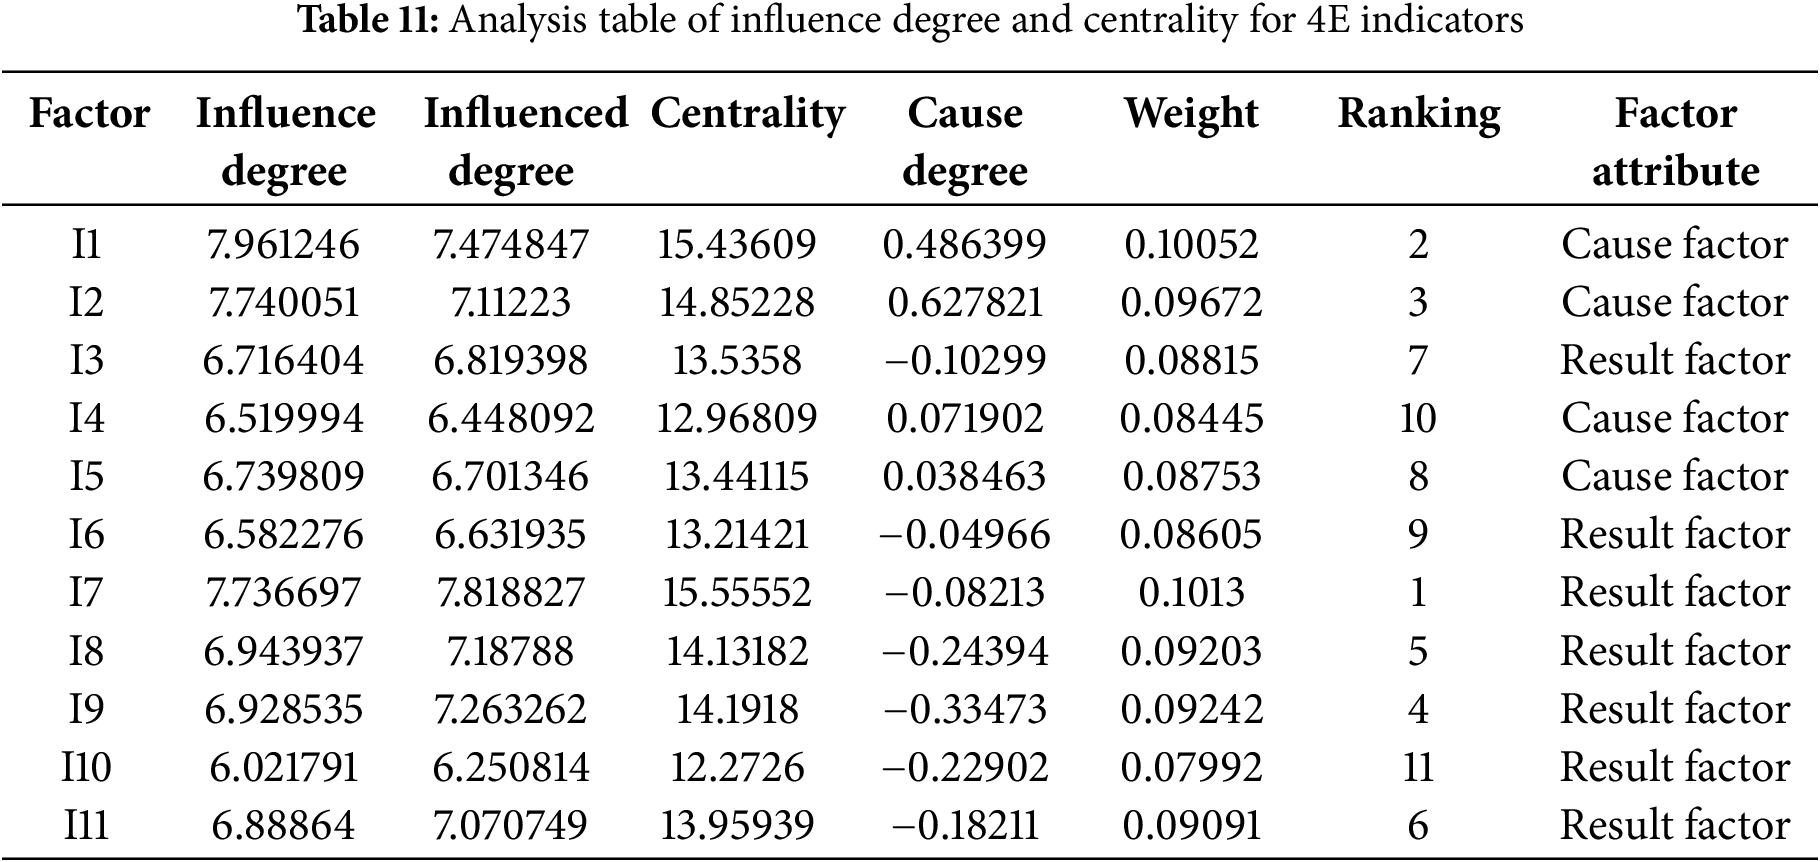
The calculation results of the causality and centrality of all indicators in Table 11 are plotted into a centrality-causality scatter diagram, as shown in Fig. 3.
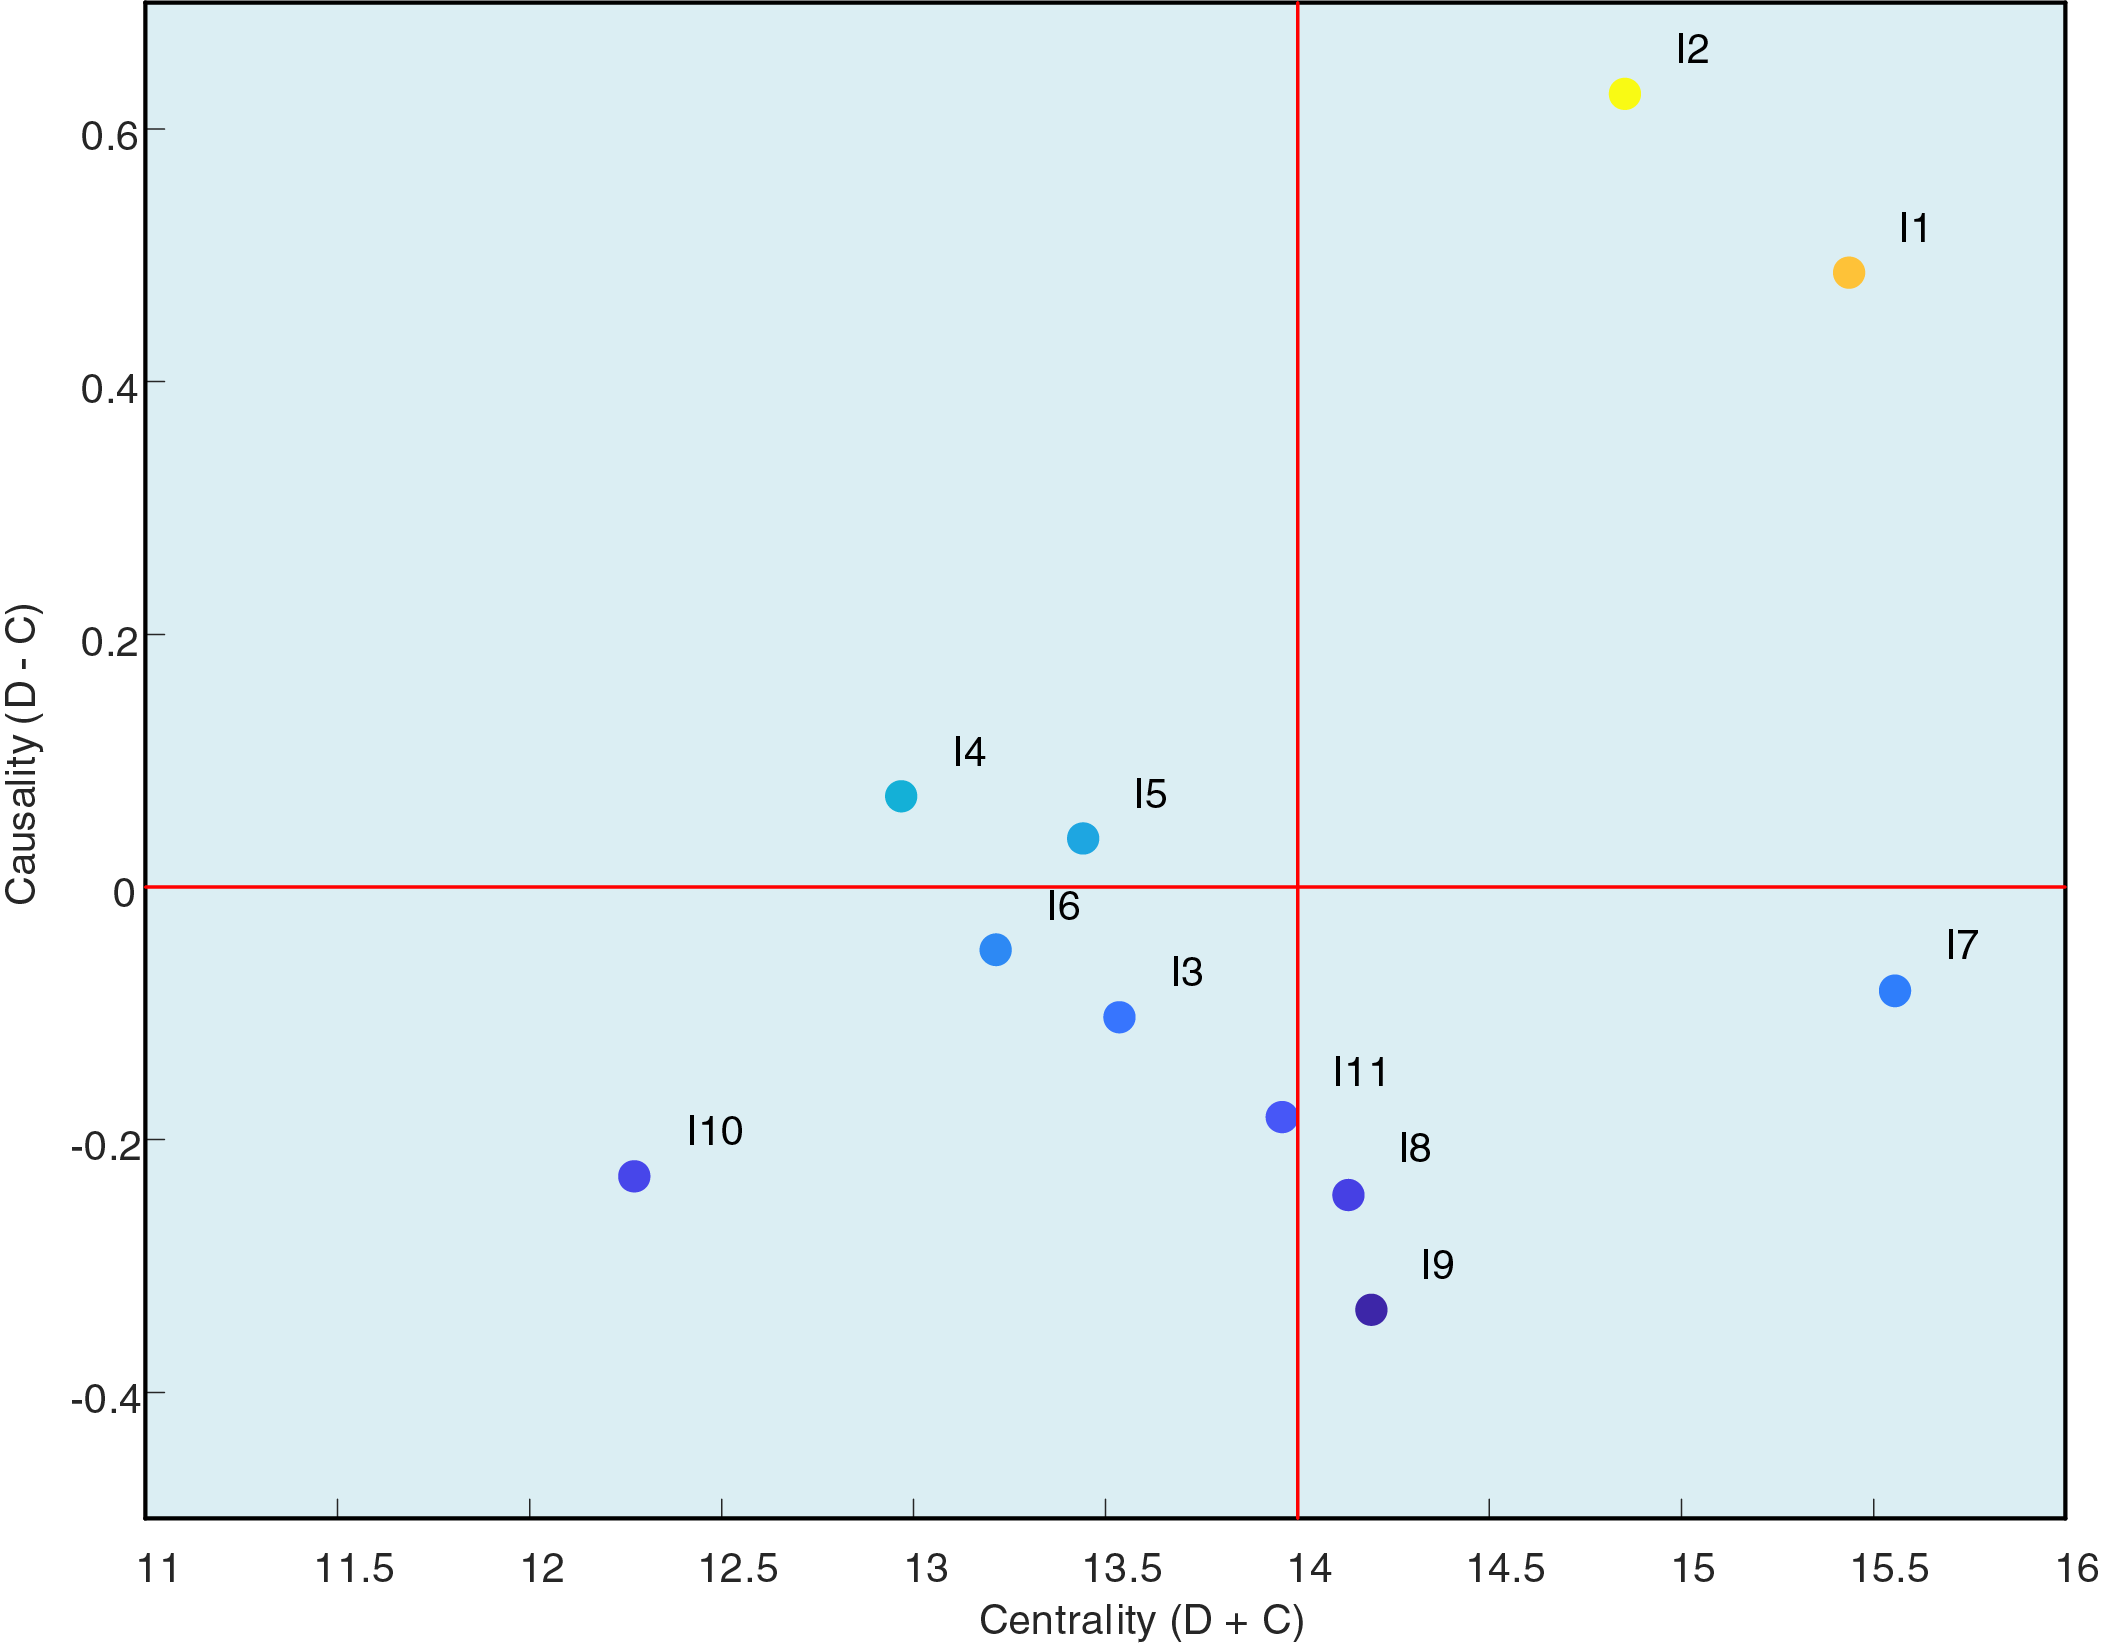
Figure 3: Centrality-causality scatter plot
In Fig. 3, the plane is partitioned into four quadrants by red solid lines intersecting at the origin, with the abscissa denoting centrality (D + C) and the ordinate causality (D − C). The upper-right quadrant (high centrality, positive causality) accommodates high-importance causal factors; the upper-left quadrant (low centrality, positive causality) identifies low-importance causal factors; the lower-left quadrant (low centrality, negative causality) signifies low-importance resultant factors; and the lower-right quadrant (high centrality, negative causality) designates high-importance resultant factors. Indicators I1, I2, I4, and I5 are all situated in the upper-right quadrant, exhibiting centrality values of 15.44, 14.85, 12.97, and 13.44, respectively, and corresponding causality values of 0.49, 0.63, 0.07, and 0.04. Owing to their pronounced centrality and strong driving capacity, these indicators are incorporated into the input indicator set of the GBH-IES hydrogen energy storage system. All remaining indicators are distributed within the two lower quadrants, with causality values consistently below zero, implying a predominant reception of influence; consequently, they are assigned to the output indicator set.
Following the determination of the input-output indicator system by the fuzzy DEMATEL method, the DEA processing and calculations were conducted using the SPSSAU software to comprehensively evaluate the 27 different schemes under varying CEFs and HBRs. The dynamic behavior of the slack variables S+ and S− under different cases is shown in Fig. 4, and the dynamic analysis of the comprehensive benefits under DEA evaluation is illustrated in Fig. 5.
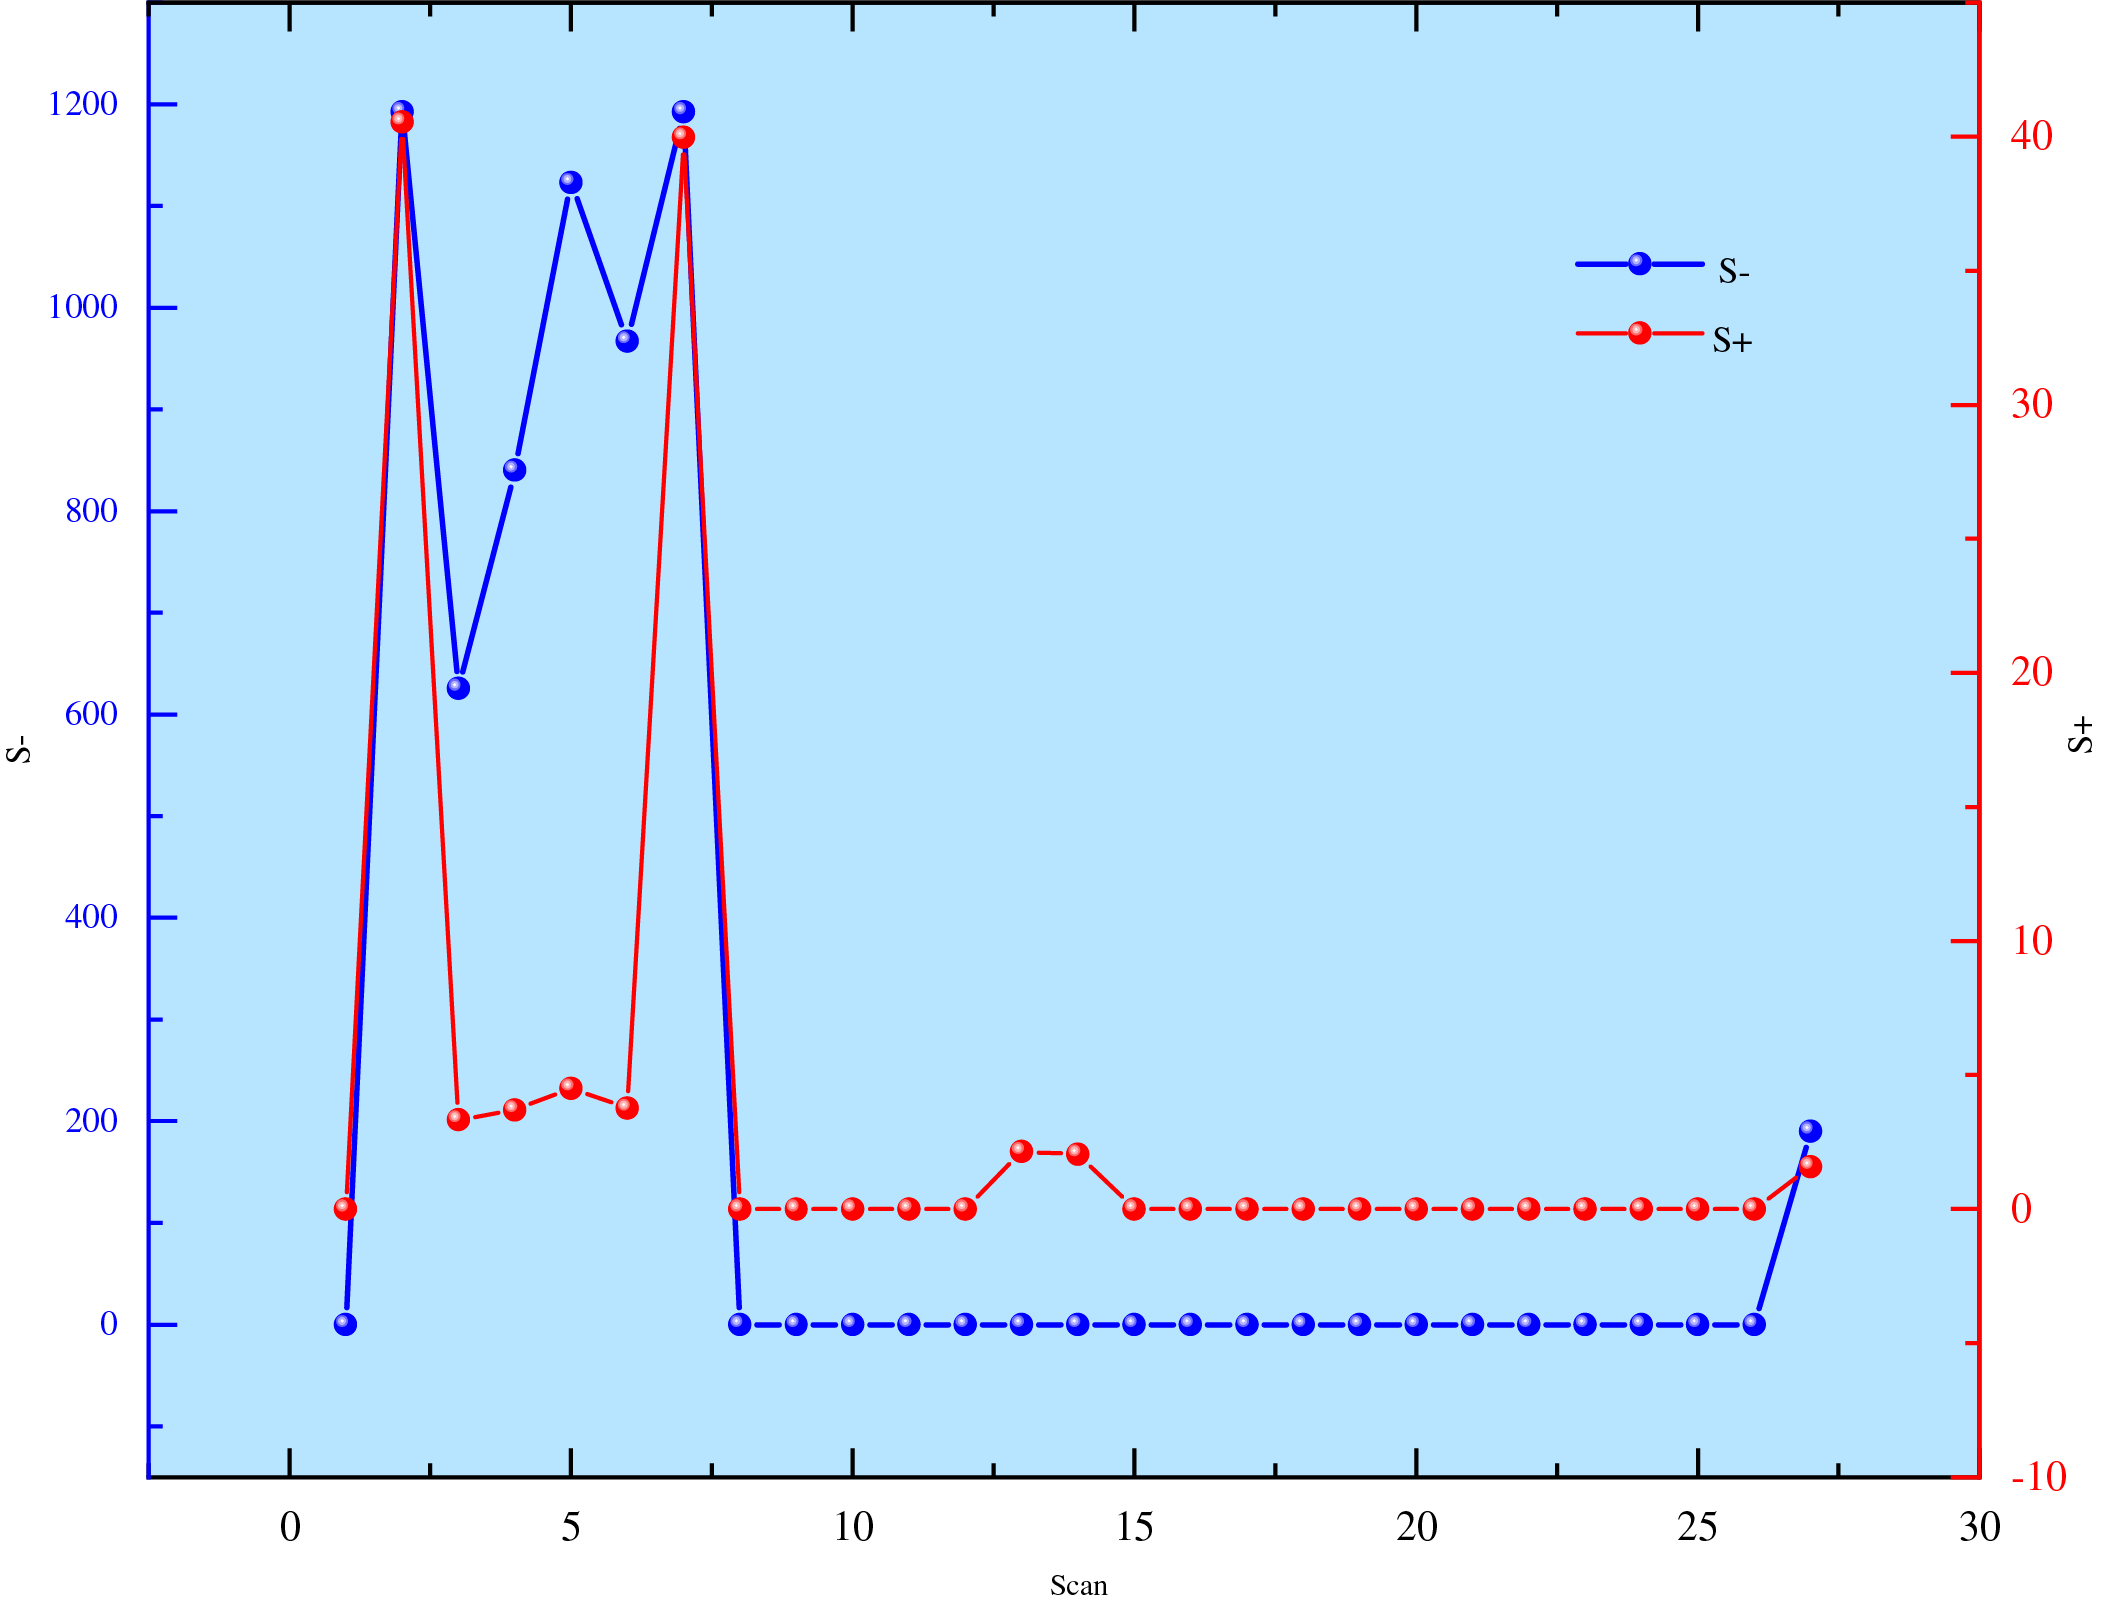
Figure 4: Dynamic behavior of slack variables S+ and S− under different cases
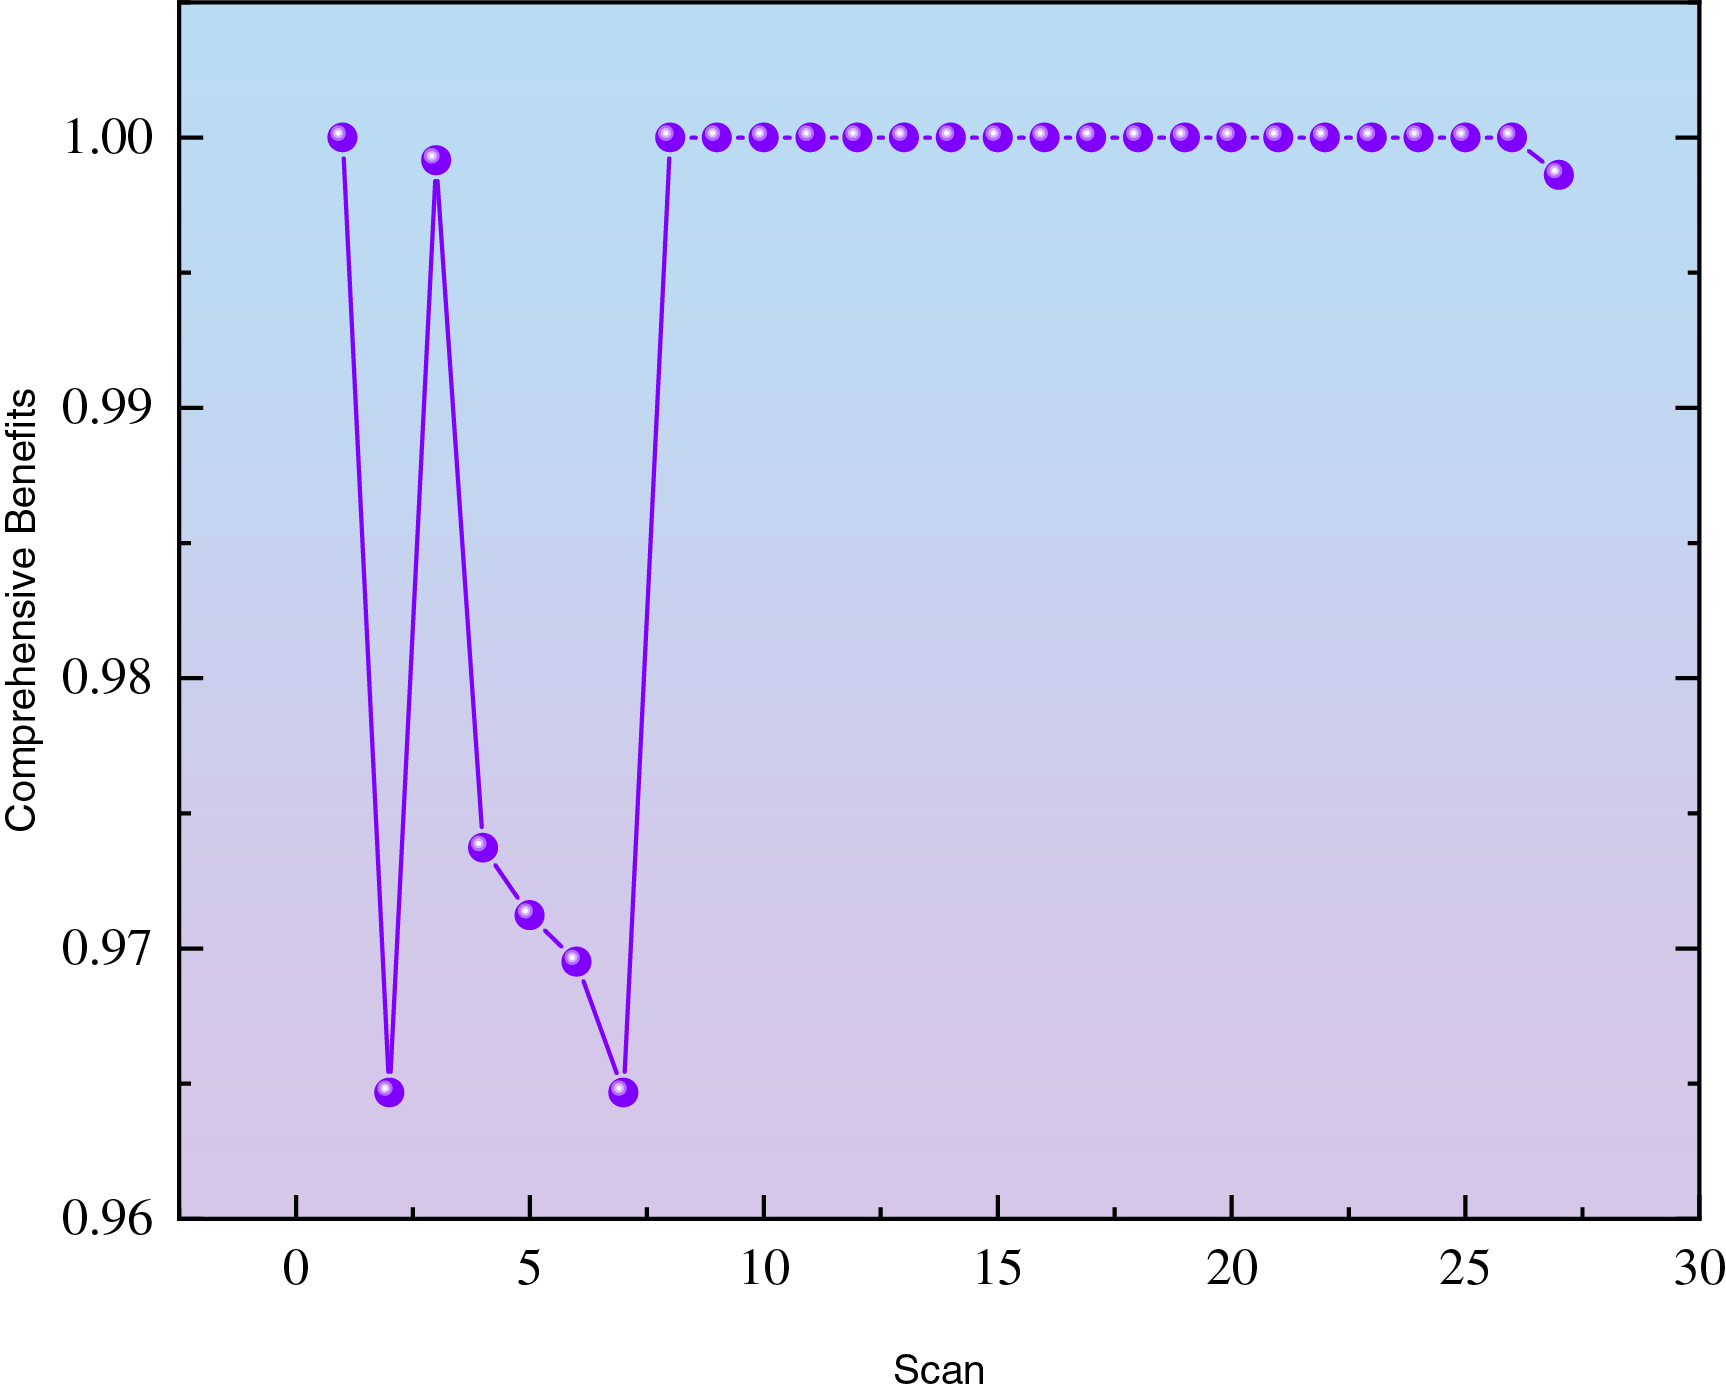
Figure 5: Dynamic analysis of comprehensive benefits under DEA evaluation
Fig. 4 arrays the 27 operating scenarios on the abscissa and presents, on the left ordinate, the input slacks (S−) and, on the right ordinate, the output slacks (S+). Specifically, S− quantifies the redundant input that can still be curtailed under a given output level, whereas S+ measures the unmet output that can yet be expanded under a given input bundle. Fig. 5 retains the identical scenario ordering and plots the DEA aggregate efficiency score on the vertical axis; a score of unity denotes strong DEA efficiency, whereas any value below unity signifies inefficiency. Notably, the magnitude of deviation from unity in Fig. 5 mirrors the slack magnitudes displayed in Fig. 4. Scrutiny of Figs. 4 and 5 reveals that green-hydrogen scenarios 2–7 exhibit abrupt S− surges above 625 accompanied by synchronous S+ fluctuations; these translate into efficiency scores falling within 0.965–0.999 in Fig. 5, unequivocally classifying them as DEA-inefficient. In contrast, blue-hydrogen scenarios 13 and 14 register S− values approaching zero and S+ values barely exceeding 2 in Fig. 4, corresponding to an efficiency score of 1 in Fig. 5; the residual micro-slacks nevertheless intimate a weak-efficient frontier. With the exception of scenario 27, the blue-green co-production pathway yields S− and S+ values that virtually vanish in Fig. 4, and efficiency scores that cling to unity in Fig. 5, thereby attesting to pronounced DEA effectiveness. Collectively, the evidence indicates that the green-hydrogen route still harbours substantial improvement potential, whereas the blue-green hybrid pathway demonstrates considerable developmental promise.
4.3 Results of Entropy Weight-TOPSIS Method
For the DEA strongly efficient cases 1, 8, 9, 10, 11, 12, 13, 14, 15, 16, 17, 18, 19, 20, 21, 22, 23, and 24, which cannot be differentiated in terms of superiority or inferiority, the entropy weight TOPSIS method is employed for ranking. The calculations based on the formulas yield the dynamic changes in the distances to the positive ideal solution (D+), the negative ideal solution (D−), and the relative closeness (C), as shown in Fig. 6. The ranking results for the cases with an efficiency value of 1 under the entropy weight TOPSIS method are illustrated in Fig. 7.
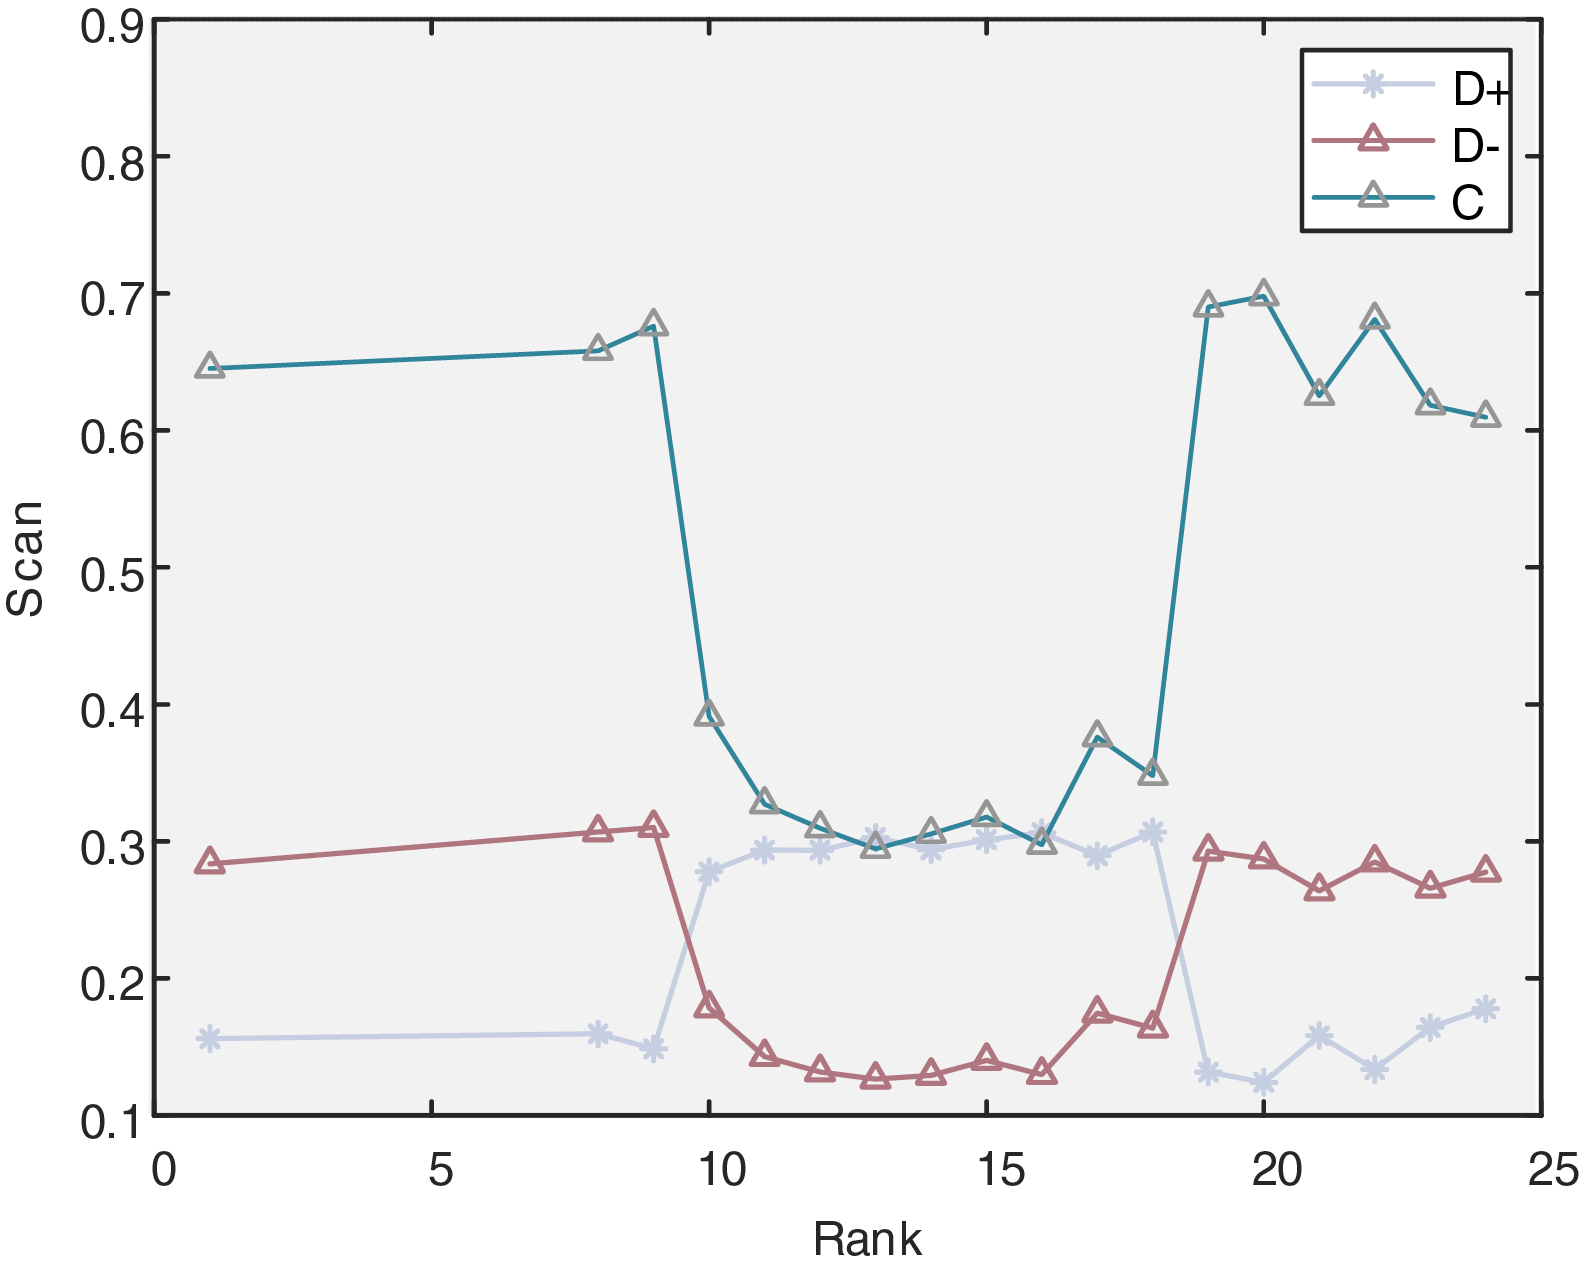
Figure 6: Dynamic changes of D+, D−, and C in the entropy weight-TOPSIS model
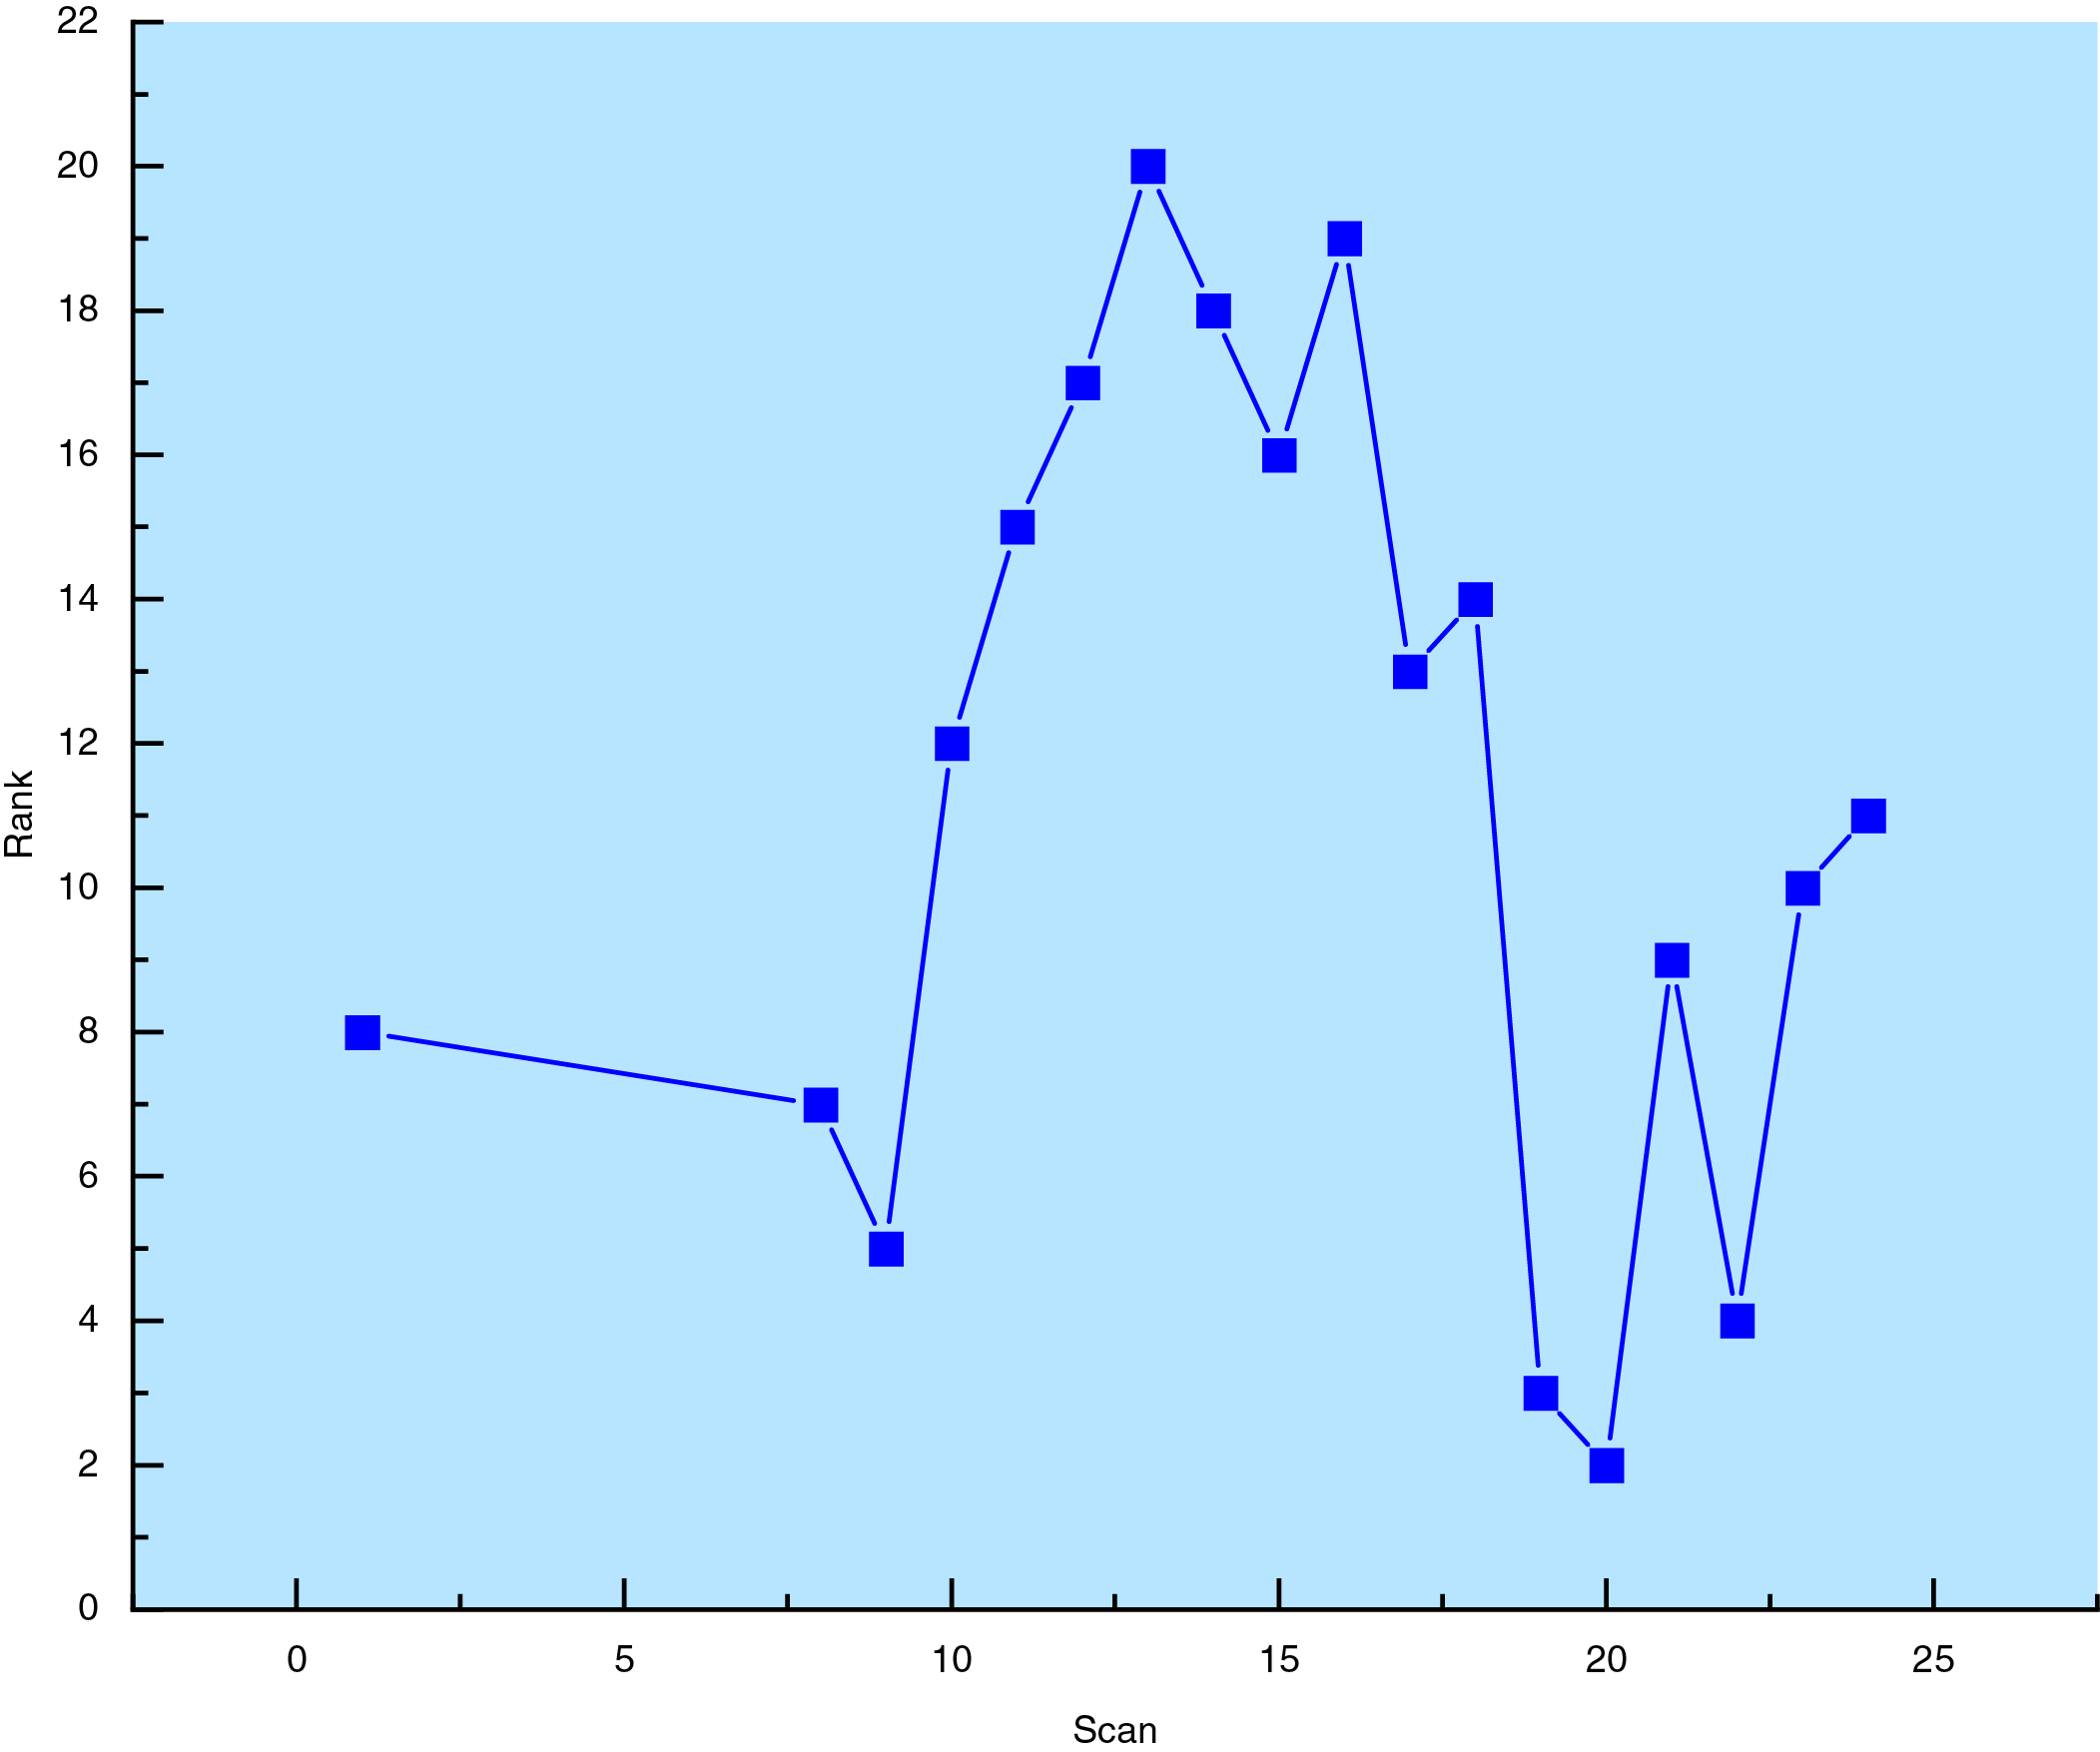
Figure 7: Ranking results for efficiency value of 1 under the entropy weight-TOPSIS method
In Fig. 6, the abscissa lists the indices of DEA-strong-efficient scenarios, while the ordinate displays the dimensionless positive-ideal distance (D+), negative-ideal distance (D−), and relative closeness coefficient (C). Across all scenarios, the trajectories of C and D− exhibit pronounced concordance, yet marked fluctuations emerge in the vicinity of scenarios 10 and 20: D+ ascends sharply before a precipitous decline, whereas C follows an inverse pattern—descending first and then rebounding. These inflections signify a transient intensification of performance disparities among pure-green-hydrogen, pure-blue-hydrogen, and blue-green-hybrid solutions, thereby magnifying their relative merits within these narrow bands. Overall, D+ exerts a marginal influence on scenario ranking, whereas the oscillations of D− and C dominantly govern the stability of the final prioritization. Fig. 7 arrays all 18 DEA-strong-efficient scenarios along the abscissa and presents their entropy-weighted TOPSIS ranks on the ordinate, with rank 1 denoting the highest relative closeness coefficient. Scenarios 26, 1, and 8 occupy the top three positions, whereas scenarios 15 and 16 anchor the bottom, unequivocally demonstrating that, even along the efficient frontier, discernible performance gradients persist. Using the entropy weight TOPSIS method, the DEA strongly efficient cases are ranked from best to worst as follows: case 26, case 1, case 8, case 19, case 20, case 9, case 25, case 22, case 21, case 24, case 23, case 10, case 17, case 18, case 11, case 12, case 16, and case 15.
4.4 Comparison of Traditional DEA and the Evaluation Scheme in This Paper
This study builds upon traditional DEA, addressing the issues of unclear input-output indicators and the inability to rank strongly DEA-efficient cases. To verify the effectiveness of the improvements, a difference analysis was conducted between the case rankings of traditional DEA and those obtained using the MCDM method. The comparison is shown in Tables 12 and 13. The results are also visualized in Fig. 8.
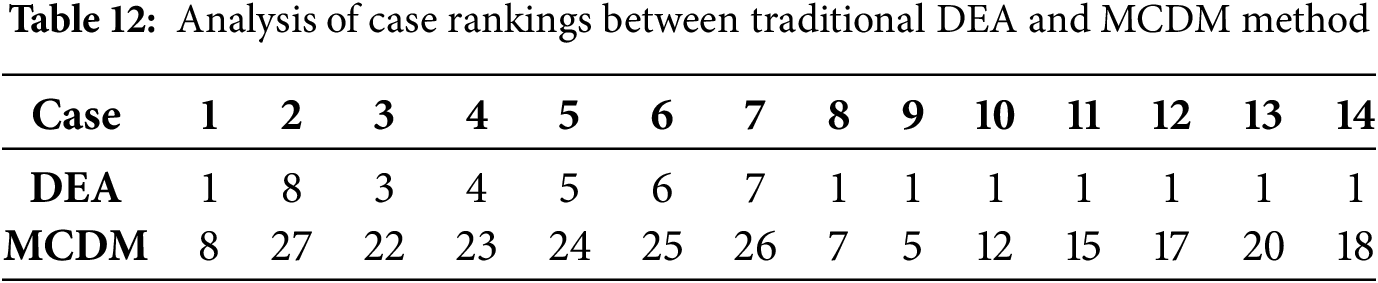

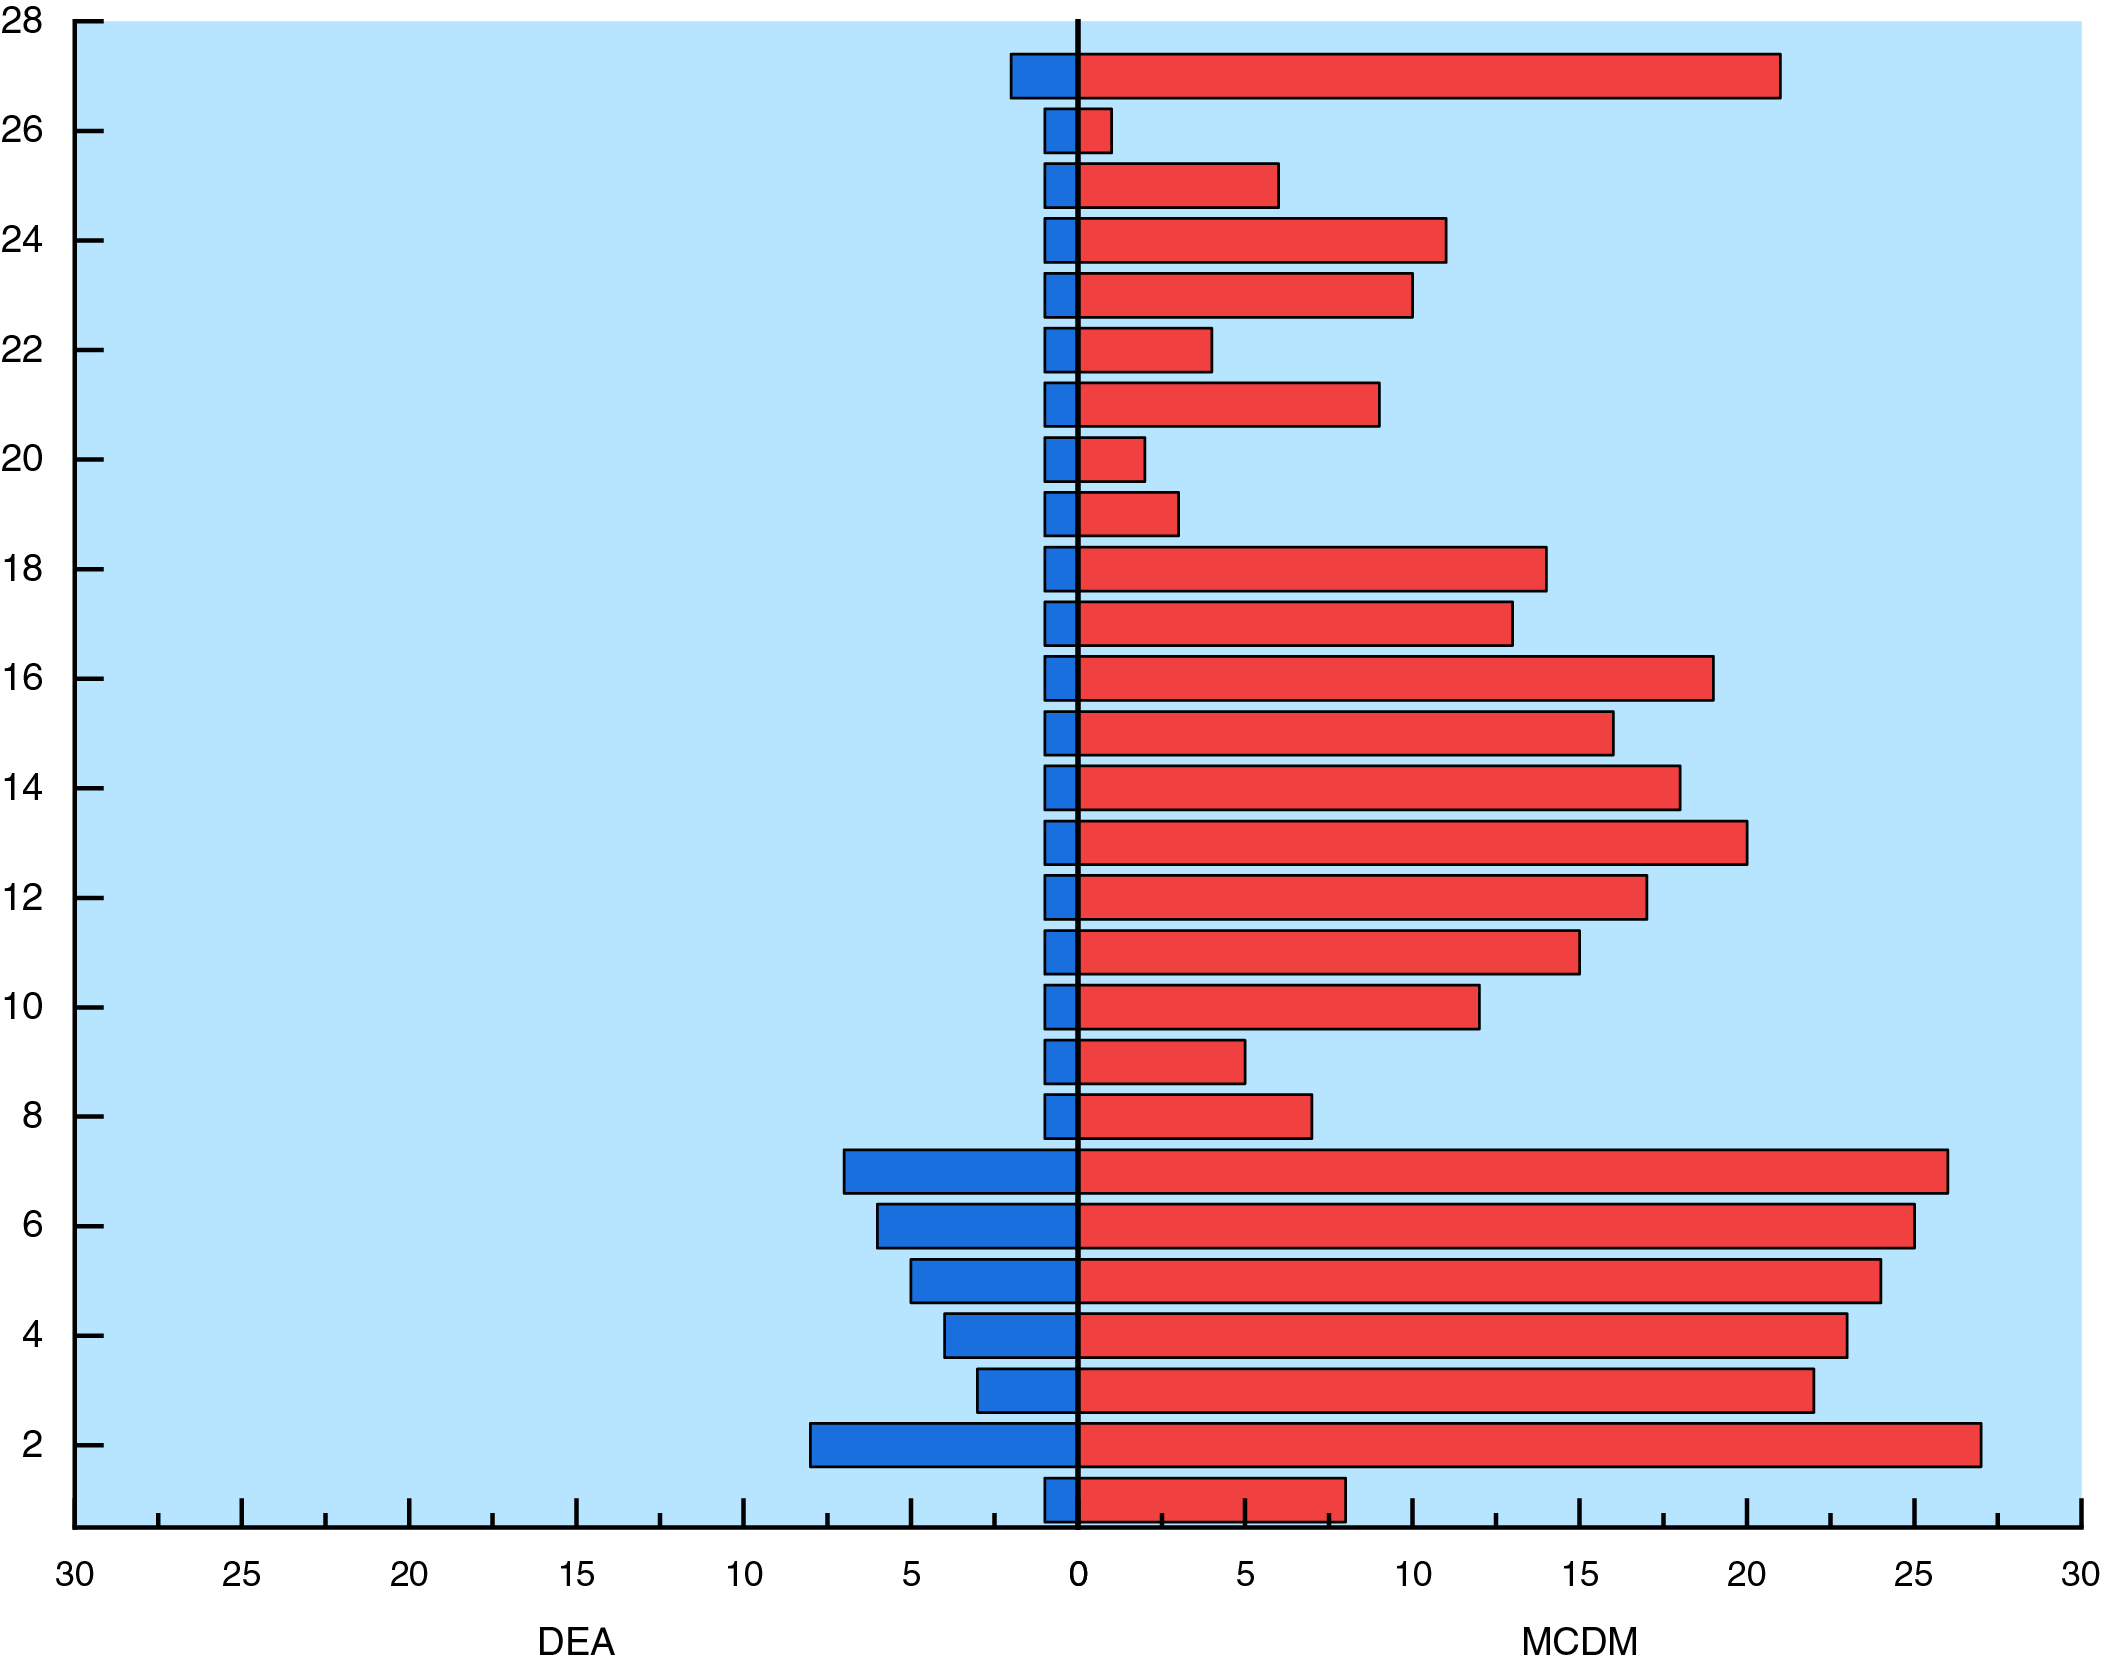
Figure 8: Analysis of differences in case rankings between traditional DEA and MCDM method
Fig. 8 contrasts the ranking outcomes generated by conventional DEA (left panel) with those obtained through the proposed MCDM framework (right panel). Under traditional DEA, all 27 scenarios registering an efficiency score of unity are indistinguishably assigned the first rank, precluding any further discrimination. Conversely, the MCDM approach yields a unique and strictly monotonic ordering, thereby resolving the tie and enabling continuous rank assignment. These findings substantiate that the MCDM methodology markedly outperforms conventional DEA in distinguishing efficient units and in the expeditious transmission of ranking information.
Acknowledging that the grid carbon-emission factor (CEF) and the gas-turbine hydrogen blending ratio (HBR) constitute the most sensitive parameters governing blue–green hydrogen synergies while being subject to pronounced policy and technological uncertainties, an orthogonal experimental design was adopted. Seven uniformly spaced CEF levels—0, 0.1, 0.2, 0.3, 0.4, 0.5 and 0.581 kg kWh−1—were selected to span the full continuum from present high-carbon to prospective zero-carbon electricity mixes. Concurrently, three technically viable HBR levels—10%, 20% and 40%—were specified within the engineering-feasible range of 10%–40%. These combinations yield a concise yet representative set of scenarios that encompass all plausible future power-system decarbonisation pathways while remaining compatible with the anticipated technology-readiness horizon of hydrogen-fired gas turbines over the next 5–10 years. By obviating the 21 exhaustive permutations, the orthogonal matrix retains statistical power and enables a robust assessment of green–blue hydrogen synergy benefits without redundant computation.
Firstly, the ranking of the three types of hydrogen under different grid CEFs was investigated, with a specific analysis of seven cases where the hydrogen blending ratio was 10% and the CEFs were 0, 0.1, 0.2, 0.3, 0.4,0.5, and 0.581, respectively. As shown in Fig. 9, a comparison of the rankings across different cases revealed that the cases involving the co-operation of green and blue hydrogen were ranked higher than those with green or blue hydrogen alone. This indicates that, under the trend of low-carbon power generation, the co-operation of green and blue hydrogen can enable the integrated energy system to achieve higher comprehensive benefits.
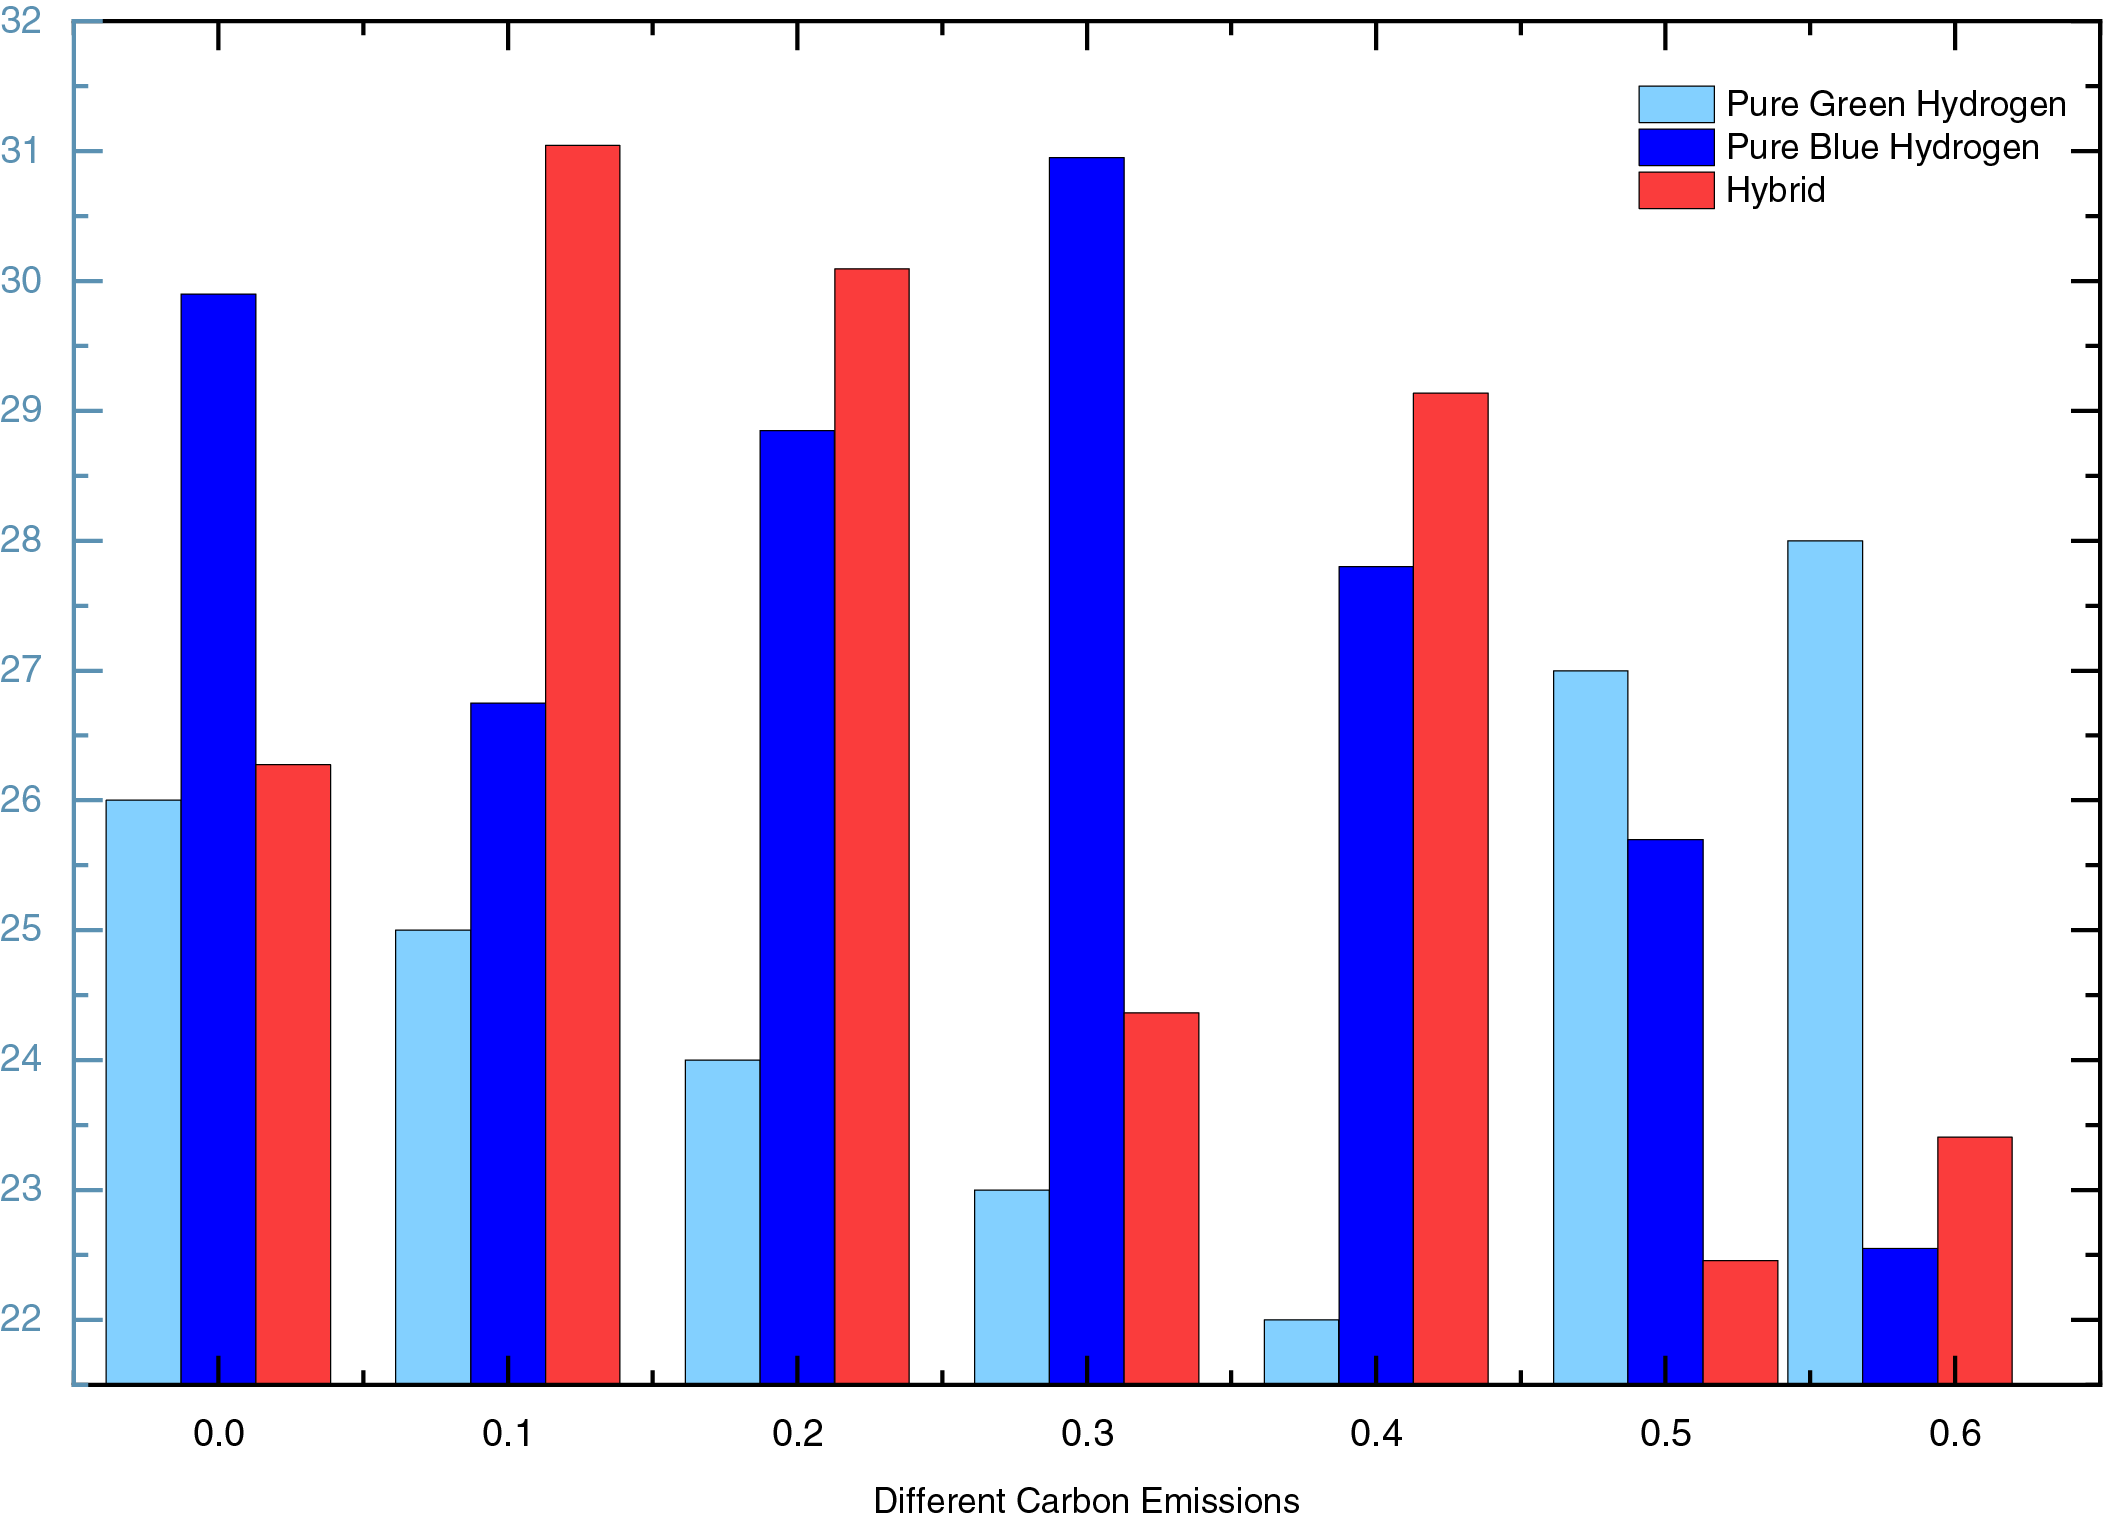
Figure 9: Comparison of MCDM rankings under different CEFs
The ranking of Case 2 is higher than that of Case 1 because the total cost and the average depth of energy storage discharge in Case 1 are always higher. Looking at the data in the table, it can be seen that the ranking of Case 3 drops when the grid carbon emission factor is 0, due to the increase in the average depth of energy storage discharge. This indicates that, compared to blue hydrogen, the use of green hydrogen is not only economically disadvantageous but also leads to greater wear and tear of equipment within the integrated energy system. Although the co-operation of green and blue hydrogen slightly increases the wear and tear of equipment within the system, its comprehensive benefits are always higher.
Secondly, this study examines the ranking of the three types of hydrogen (green hydrogen, blue hydrogen, and the co-operation of green and blue hydrogen) under different HBRs. Specifically, it analyzes three cases where the carbon emission factor is 0.581 and the HBRs are 10%, 20%, and 40%, respectively. As shown in Fig. 10, the rankings of the three cases when the gas turbine operates with different HBRs are as follows: The ranking of Case 1 is always the lowest and decreases further as the hydrogen blending ratio increases. When the hydrogen blending ratio is 10% and 20%, Case 3 has the highest comprehensive benefit; whereas at a 40% hydrogen blending ratio, Case 2 has the highest comprehensive benefit. The reason for this change in ranking is the high cost of electrolysis for green hydrogen, which always results in the highest equipment life consumption in the green hydrogen energy system. Therefore, the comprehensive evaluation value of Case 1 is always the lowest. As the scale of hydrogen energy utilization increases, the disadvantages of Case 1, such as its economic inefficiency and high equipment life consumption, are further exacerbated. Additionally, when the hydrogen blending ratio increases, Case 3 requires an increase in the charging and discharging power of energy storage equipment to meet the greater hydrogen demand, leading to increased life consumption of the energy storage equipment and, consequently, a decrease in comprehensive benefits.
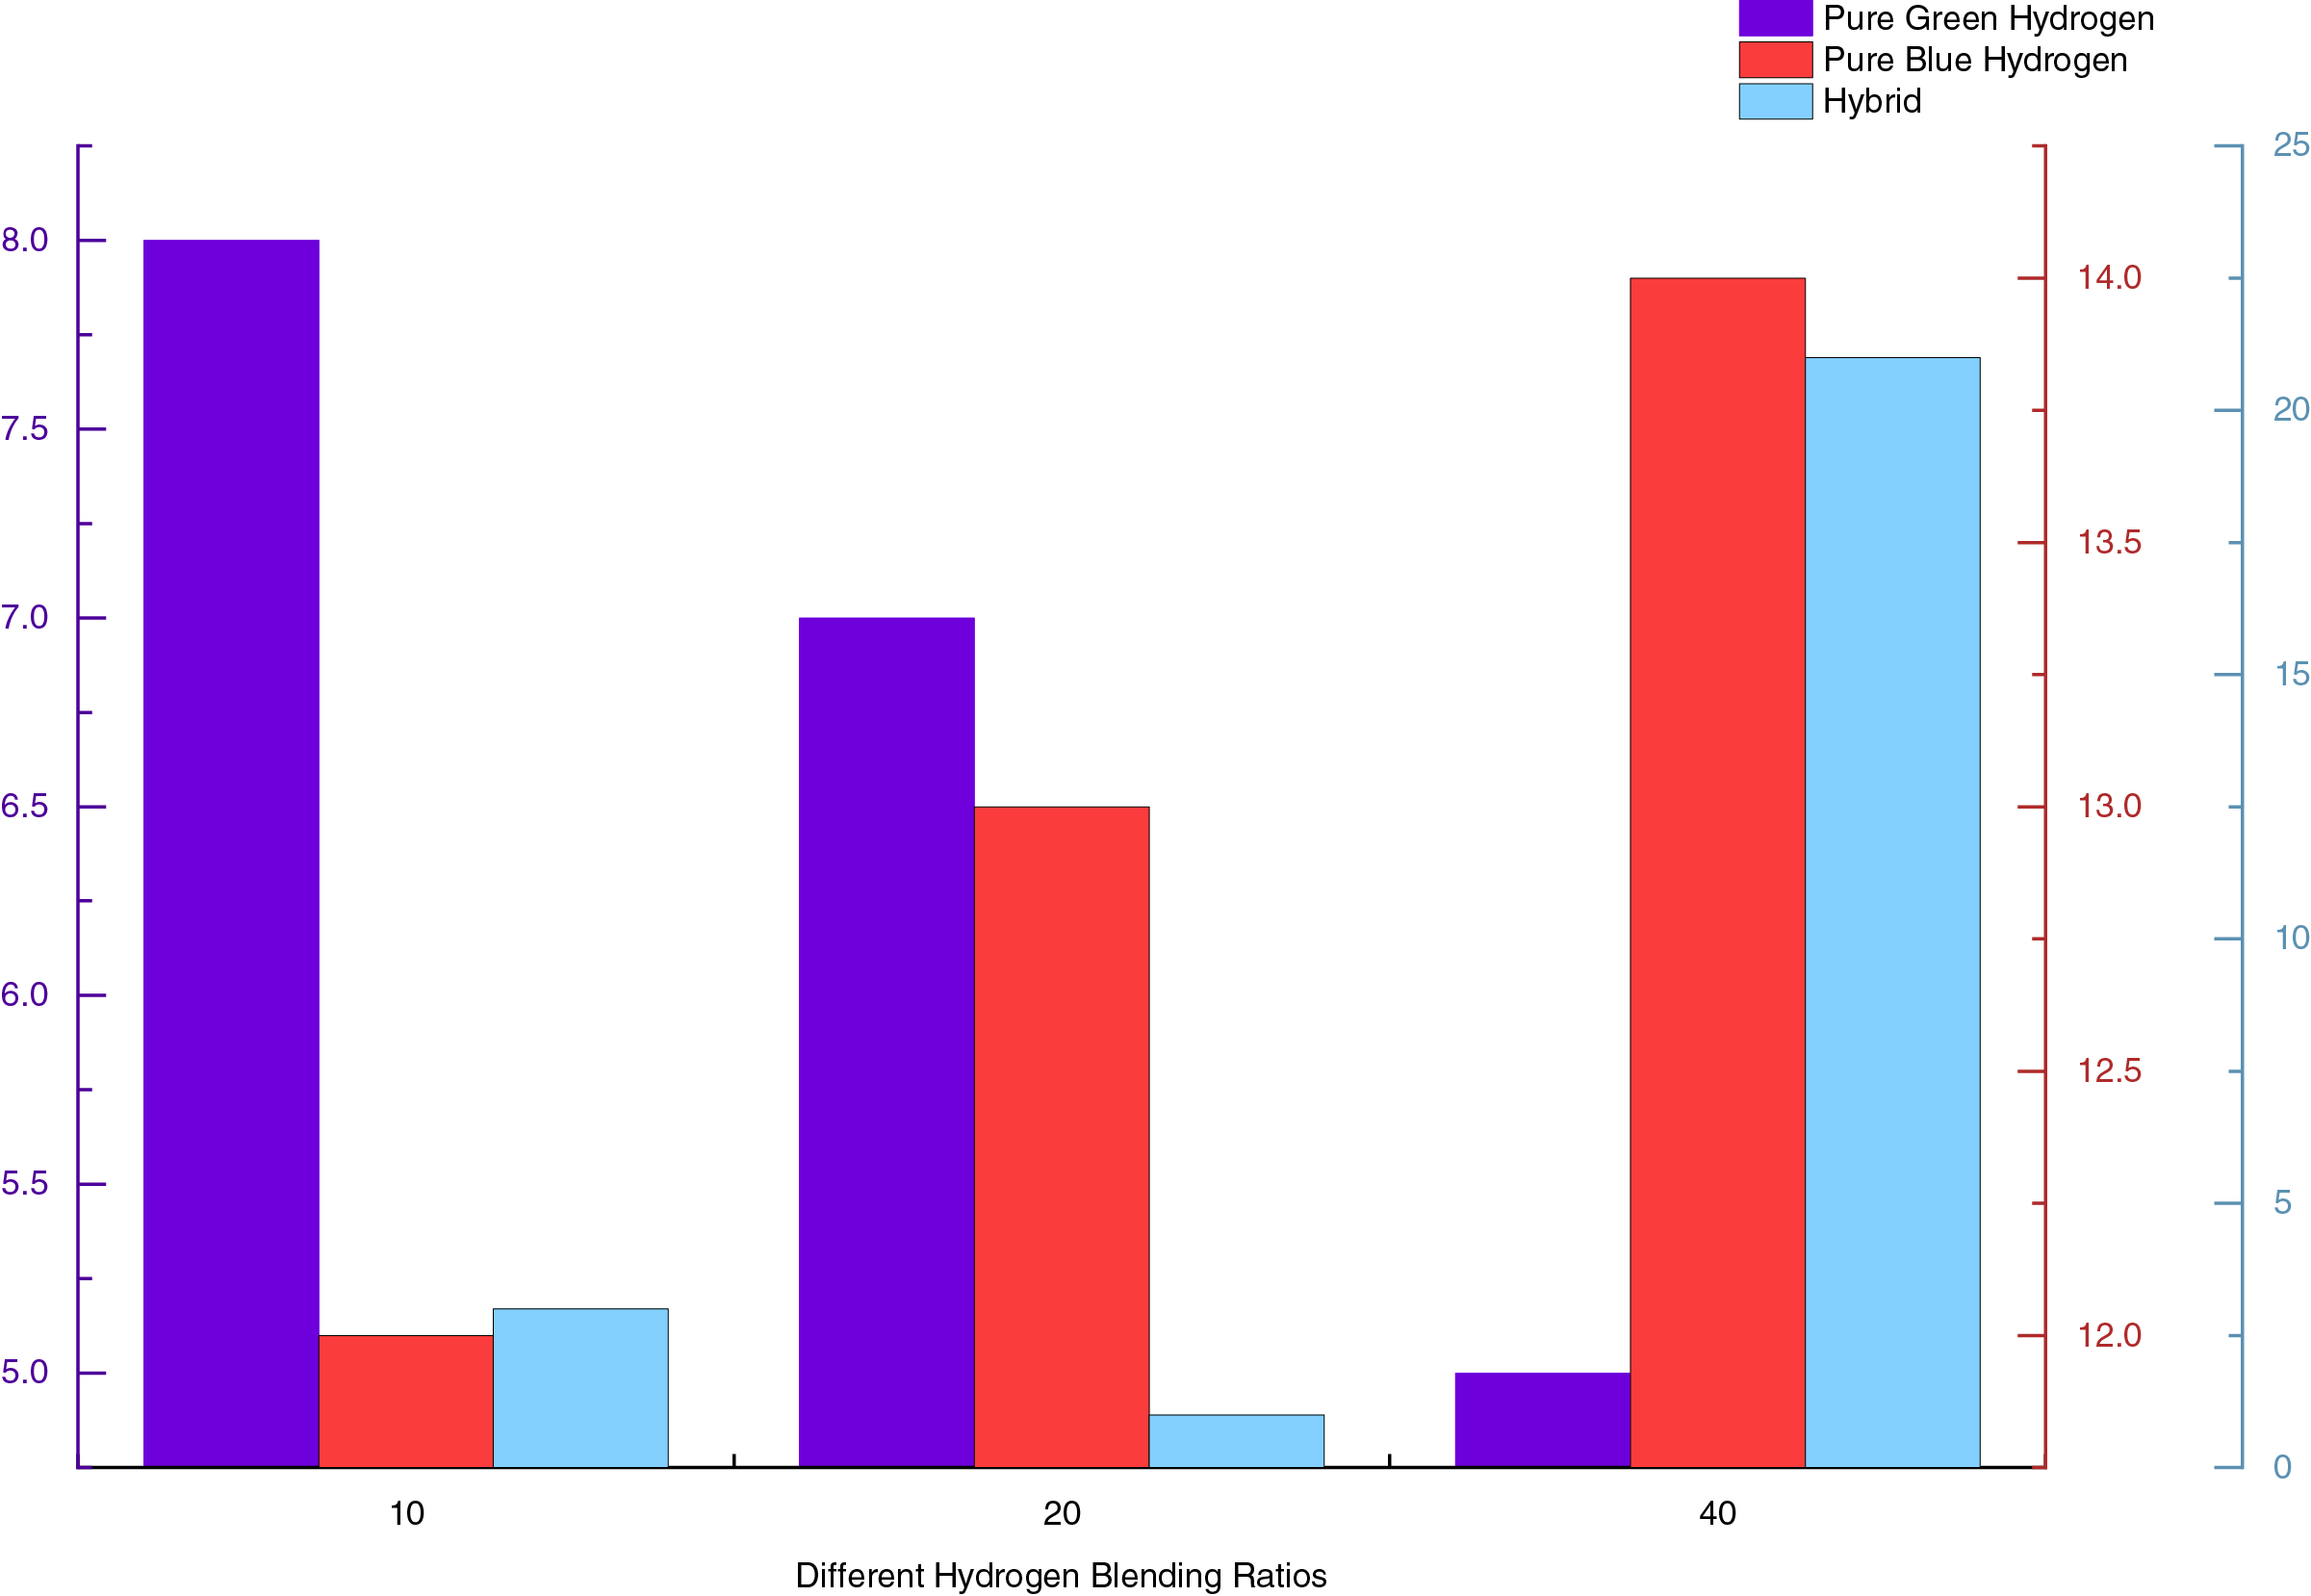
Figure 10: Comparison of MCDM rankings under different HBRs
This study constructs a 4E performance integrated evaluation model for the blue-green hybrid hydrogen energy system (GBH-IES) based on a hybrid multi-criteria decision-making method, systematically assessing the comprehensive benefits under different CEFs and HBRs for three cases: green hydrogen only, blue hydrogen only, and the co-operation of blue and green hydrogen. The main conclusions of the study are as follows:
(1) Sensitivity analysis indicates that, across varying CEFs and HBRs, the integration of blue and green hydrogen consistently outperforms the use of either blue or green hydrogen alone. This suggests that, in the context of low-carbon power generation, the combined utilization of blue and green hydrogen can significantly enhance the overall performance of the integrated energy system. Specifically, the synergistic operation of blue and green hydrogen provides greater economic benefits. Although the degree of equipment wear and tear is slightly higher compared to scenarios involving the use of a single type of hydrogen, the overall benefits remain superior. In real GBH-IES projects the carbon-emission factor and the hydrogen-blend ratio are locked by grid topology, pipeline metallurgy and terminal equipment, so they cannot be tuned as freely as in simulation. Anchored in these stubborn boundary conditions, this study evaluates the integrated benefits of alternative scenarios and thereby steers clear of resource misallocation and stranded costs that would otherwise arise from an ill-chosen transition pathway. The derived benchmarks can be directly translated into quantifiable thresholds for regulators, including upper bounds on the grid carbon-emission factor, tiered subsidies indexed to hydrogen blending ratios, and priority rankings for infrastructure investment, thereby guiding the sector toward a blue–green hydrogen synergy pathway at minimal policy cost.
(2) When the carbon emission factor is 0.581, Case 1 (green hydrogen only) consistently ranks the lowest among the three cases with HBRs of 10%, 20%, and 40%, and its ranking further decreases as the hydrogen blending ratio increases. The comprehensive benefits of Case 3 (co-operation of blue and green hydrogen) are the highest when the hydrogen blending ratio is 10% and 20%, while Case 2 (blue hydrogen only) has the highest comprehensive benefits at a 40% hydrogen blending ratio. The reason for this change in ranking is the high cost of electrolysis for green hydrogen, which always results in the highest equipment life consumption in the green hydrogen energy system. As the scale of hydrogen energy utilization increases, the disadvantages of Case 1, such as its economic inefficiency and high equipment life consumption, are further exacerbated. Additionally, when the hydrogen blending ratio increases, Case 3 requires an increase in the charging and discharging power of energy storage equipment to meet the greater hydrogen demand, leading to increased life consumption of the energy storage equipment and, consequently, a decrease in comprehensive benefits.
(3) The fuzzy DEMATEL method was utilized to quantify the causal relationships between indicators, thereby establishing a scientific input-output evaluation indicator system. The DEA model conducted a preliminary performance assessment of the hydrogen energy storage system, while the entropy weight TOPSIS method addressed the issue of unrankable assessment results by providing further ranking, thereby significantly enhancing the accuracy and reliability of the hydrogen energy storage system evaluation. Compared with the traditional DEA method, the improved method proposed in this paper effectively resolves the issue of being unable to further rank when the efficiency value is 1, thereby significantly improving the scientific nature and practicality of the assessment results. Moreover, the MCDA framework constructed for GBH-IES exhibits broad generality and can be transferred wholesale to offshore wind, biomass and urban power networks. Migration requires only four sequential actions—structural reconfiguration, indicator supplementation, data substitution and decision evaluation—without the need to redevelop the underlying algorithm. When system expansion or temporal refinement induces a sharp escalation in the number of indicators and decision variables, the redundant indicators can first be eliminated via the fuzzy DEMATEL method to achieve substantial dimensionality reduction; the proposed assessment framework can then be invoked directly to complete the subsequent evaluation, thereby guaranteeing computational efficiency in large-scale, high-resolution settings.
(4) Although the proposed 4E performance evaluation model is comprehensive and has been validated through the case study, the detailed rules governing direct participation of retail consumers in the interprovincial spot market remain under formulation, and the quantitative boundaries of policy support and market acceptance have yet to be clarified; consequently, these two dimensions could not be incorporated into the current framework. Future work will integrate these indicators into the evaluation system and will further investigate how the introduction of dynamic carbon pricing, hydrogen incentives, or other policy shifts alters the preferred system configuration.
Acknowledgement: Not applicable.
Funding Statement: This research was jointly funded by two projects: (1) The Key Research and Development Project of Xinjiang Uygur Autonomous Region, with the grant number 2024B04025. (2) The General Program of Natural Science Foundation of Xinjiang Uygur Autonomous Region, with the grant number 2022D01C366. Both of these projects provided financial support for the conduct of this study.
Author Contributions: The authors confirm contribution to the paper as follows: Conceptualization, Xinde Zhang and Zhihui Zhang; Methodology, Xue Zhang; Software, Zhihui Zhang; Validation, Xue Zhang, Jie Chen, and Yuejiao Ming; Formal analysis, Xue Zhang; Investigation, Dewei Zhang; Resources, Xinde Zhang; Data curation, Yuejiao Ming; Writing—original draft preparation, Xue Zhang; Writing—review and editing, Xue Zhang; Visualization, Zhihui Zhang; Supervision, Jie Chen; Project administration, Xinde Zhang; Funding acquisition, Xinde Zhang. All authors reviewed the results and approved the final version of the manuscript.
Availability of Data and Materials: The data that support the findings of this study are available within the article.
Ethics Approval: Not applicable.
Conflicts of Interest: The authors declare no conflicts of interest to report regarding the present study.
Glossary
| GBH-IES | Green and Blue Hydrogen Integrated Energy System |
| 4E Performance | Economy, technology, environment, and social benefits |
| DEMATEL | Decision Making Trial and Evaluation Laboratory |
| DEA | Data Envelopment Analysis |
| TOPSIS | Technique for Order Preference by Similarity to Ideal Solution |
| PV | Photovoltaics |
| CCS | Carbon Capture and Storage |
| HESS | Hybrid Energy Storage System |
| IES | Integrated Energy Systems |
| EH-IES | Electricity-Hydrogen Integrated Energy System |
| BPH-IES | Biomass-Photovoltaic-Hydrogen Integrated Energy System |
| CEF | Carbon Emission Factor |
| HBR | Hydrogen Blending Ratio |
| MCDM | Multi-Criteria Decision-Making |
| CFCS | Centroid Fuzzy C-means |


References
1. Le TT, Sharma P, Bora BJ, Tran VD, Truong TH, Le HC, et al. Fueling the future: a comprehensive review of hydrogen energy systems and their challenges. Int J Hydrogen Energy. 2024;54:791–816. doi:10.1016/j.ijhydene.2023.08.044. [Google Scholar] [CrossRef]
2. El-Adawy M, Dalha IB, Ismael MA, Al-Absi ZA, Nemitallah MA. Review of sustainable hydrogen energy processes: production, storage, transportation, and color-coded classifications. Energy Fuels. 2024;38(23):22686–718. doi:10.1021/acs.energyfuels.4c04317. [Google Scholar] [CrossRef]
3. Kamran M, Turzyński M. Exploring hydrogen energy systems: a comprehensive review of technologies, applications, prevailing trends, and associated challenges. J Energy Storage. 2024;96:112601. doi:10.1016/j.est.2024.112601. [Google Scholar] [CrossRef]
4. Daminelli D, Masotti L, Corigliano S. Renewable hydrogen systems for a sustainable heavy-duty mobility: the Italian case. Renew Energy Focus. 2025;52:100656. doi:10.1016/j.ref.2024.100656. [Google Scholar] [CrossRef]
5. Krishankumar R, Ecer F, Kayapınar Kaya S, Pedrycz W. Hydrogen energy storage technology selection through a cutting-edge probabilistic linguistic decision framework. Renew Energy Focus. 2024;51:100642. doi:10.1016/j.ref.2024.100642. [Google Scholar] [CrossRef]
6. Liu F, Duan J, Wu C, Tian Q. Risk-averse distributed optimization for integrated electricity-gas systems considering uncertainties of Wind-PV and power-to-gas. Renew Energy. 2024;227:120358. doi:10.1016/j.renene.2024.120358. [Google Scholar] [CrossRef]
7. Gong X, Li X, Zhong Z. Strategic bidding of hydrogen-wind-photovoltaic energy system in integrated energy and flexible ramping markets with renewable energy uncertainty. Int J Hydrogen Energy. 2024;80:1406–23. doi:10.1016/j.ijhydene.2024.07.083. [Google Scholar] [CrossRef]
8. Xiao D, Lin Z, Wu Q, Meng A, Yin H, Lin Z. Risk-factor-oriented stochastic dominance approach for industrial integrated energy system operation leveraging physical and financial flexible resources. Appl Energy. 2025;377:124347. doi:10.1016/j.apenergy.2024.124347. [Google Scholar] [CrossRef]
9. Wessel E, Smets R, Delarue E. Risk-aware participation in day-ahead and real-time balancing markets for energy storage systems. Electr Power Syst Res. 2024;235:110741. doi:10.1016/j.epsr.2024.110741. [Google Scholar] [CrossRef]
10. Xiao D, Peng Z, Lin Z, Zhong X, Wei C, Dong Z, et al. Incorporating financial entities into spot electricity market with renewable energy via holistic risk-aware bilevel optimization. Appl Energy. 2025;398:126449. doi:10.1016/j.apenergy.2025.126449. [Google Scholar] [CrossRef]
11. Beraldi P, Khodaparasti S. Designing electricity tariffs in the retail market: a stochastic bi-level approach. Int J Prod Econ. 2023;257:108759. doi:10.1016/j.ijpe.2022.108759. [Google Scholar] [CrossRef]
12. Zhang C, Xie Y, Zhang H, Gu Y, Zhang X. Optimal design and performance assessment for a solar powered electricity, heating and hydrogen integrated energy system. Energy. 2023;262:125453. doi:10.1016/j.energy.2022.125453. [Google Scholar] [CrossRef]
13. Saha P, Akash FA, Shovon SM, Monir MU, Ahmed MT, Khan MFH, et al. Grey, blue, and green hydrogen: a comprehensive review of production methods and prospects for zero-emission energy. Int J Green Energy. 2024;21(6):1383–97. doi:10.1080/15435075.2023.2244583. [Google Scholar] [CrossRef]
14. Liang T, Zhang X, Tan J, Jing Y, Lv L. Deep reinforcement learning-based optimal scheduling of integrated energy systems for electricity, heat, and hydrogen storage. Electr Power Syst Res. 2024;233:110480. doi:10.1016/j.epsr.2024.110480. [Google Scholar] [CrossRef]
15. Wang Y, Shi L, Song M, Jia M, Li B. Evaluating the energy-exergy-economy-environment performance of the biomass-photovoltaic-hydrogen integrated energy system based on hybrid multi-criterion decision-making model. Renew Energy. 2024;224:120220. doi:10.1016/j.renene.2024.120220. [Google Scholar] [CrossRef]
16. Saha S, Kowsar A, Debnath SC, Ahmed K, Alam F. Techno-economic analysis of integrated PV/Biogas/Wind/Hydrogen polygeneration energy systems for green transportation in Bangladesh context. Renew Energy Focus. 2025;54:100707. doi:10.1016/j.ref.2025.100707. [Google Scholar] [CrossRef]
17. Liu L, Qin Z. Low-carbon planning for park-level integrated energy system considering optimal construction time sequence and hydrogen energy facility. Energy Rep. 2023;9:554–66. doi:10.1016/j.egyr.2023.04.208. [Google Scholar] [CrossRef]
18. Zhou D, Yan S, Huang D, Shao T, Xiao W, Hao J, et al. Modeling and simulation of the hydrogen blended gas-electricity integrated energy system and influence analysis of hydrogen blending modes. Energy. 2022;239:121629. doi:10.1016/j.energy.2021.121629. [Google Scholar] [CrossRef]
19. Novotny V. Blue hydrogen can be a source of green energy in the period of decarbonization. Int J Hydrogen Energy. 2023;48(20):7202–18. doi:10.1016/j.ijhydene.2022.11.095. [Google Scholar] [CrossRef]
20. Durakovic G, del Granado PC, Tomasgard A. Are green and blue hydrogen competitive or complementary? Insights from a decarbonized European power system analysis. Energy. 2023;282:128282. doi:10.1016/j.energy.2023.128282. [Google Scholar] [CrossRef]
21. Cavalcante IO, Simão Neto F, da Silva Sousa P, da Silva Aires FI, Dari DN, Chaves de Lima RK, et al. Evolving sustainable energy technologies and assessments through global research networks: advancing the role of blue hydrogen for a cleaner future. RSC Sustainability. 2024;2(2):348–68. doi:10.1039/d3su00309d. [Google Scholar] [CrossRef]
22. Liu X, Zu L, Wei Z, Wang Y, Pan Z, Xiao G, et al. Two-layer optimal scheduling of integrated electric-hydrogen energy system with seasonal energy storage. Int J Hydrogen Energy. 2024;82:1131–45. doi:10.1016/j.ijhydene.2024.07.415. [Google Scholar] [CrossRef]
23. Liu Y, Huang S, Guo L, Li J, Wang Z, Song J, et al. Adaptive time granularity-based coordinated planning method for the electric-hydrogen coupled energy system with hybrid energy storage. Int J Electr Power Energy Syst. 2025;166:110540. doi:10.1016/j.ijepes.2025.110540. [Google Scholar] [CrossRef]
24. Dong H, Shan Z, Zhou J, Xu C, Chen W. Refined modeling and co-optimization of electric-hydrogen-thermal-gas integrated energy system with hybrid energy storage. Appl Energy. 2023;351:121834. doi:10.1016/j.apenergy.2023.121834. [Google Scholar] [CrossRef]
25. Zhou X, Yu N, Wu Z, Maleki A. Energy control and design optimization of a hybrid solar-hydrogen energy storage system using various solar panel technologies. J Energy Storage. 2024;94:112389. doi:10.1016/j.est.2024.112389. [Google Scholar] [CrossRef]
26. Li ZW, Zhao YZ, Wu P. Impact assessment of coordinated optimization of green hydrogen and blue hydrogen on integrated energy system under carbon trading mechanism. Acta Solar Sinica. 2024;45(10):37–47. (In Chinese). doi:10.19912/j.0254-0096.tynxb.2023-0936. [Google Scholar] [CrossRef]
27. Khosravi N, Abdolmohammadi HR. A hierarchical deep learning-based recurrent convolutional neural network for robust voltage and frequency operation management in microgrids. Appl Soft Comput. 2025;170:112645. doi:10.1016/j.asoc.2024.112645. [Google Scholar] [CrossRef]
28. Khosravi N. Enhancing operational efficiency through a control-based approach for hydrogen and battery energy storage systems integration in renewable energy networks. Renew Energy. 2025;248:123132. doi:10.1016/j.renene.2025.123132. [Google Scholar] [CrossRef]
29. Wu M, Wu J, Zhu R, Chen Y, Yin J, Xue Y. Benefit assessment of integrated energy systems considering hydrogen utilization in the context of dual carbon goals. In: 2024 IEEE 2nd International Conference on Power Science and Technology (ICPST); 2024 May 9–11; Dali, China. p. 1765–72. doi:10.1109/ICPST61417.2024.10602470. [Google Scholar] [CrossRef]
30. Zhang Y, Zhao X, Zhao Y, Cui X, Zhang Y, Zhao H. Pre-selection scheme evaluation of hybrid energy storage for distribution network based on utility combination method. J Energy Storage. 2024;88:111497. doi:10.1016/j.est.2024.111497. [Google Scholar] [CrossRef]
31. Tang D, Zheng Z, Guerrero JM. A hybrid multi-criteria dynamic sustainability assessment framework for integrated multi-energy systems incorporating hydrogen at ports. Int J Hydrogen Energy. 2025;99:540–52. doi:10.1016/j.ijhydene.2024.12.075. [Google Scholar] [CrossRef]
32. Li T, Fei L. Exploring obstacles to the use of unmanned aerial vehicles in emergency rescue: a BWM-DEMATEL approach. Technol Soc. 2025;81:102863. doi:10.1016/j.techsoc.2025.102863. [Google Scholar] [CrossRef]
33. Du YW, Shen XL. Large-scale group hierarchical DEMATEL method with automatic consensus reaching. Inf Fusion. 2024;108:102411. doi:10.1016/j.inffus.2024.102411. [Google Scholar] [CrossRef]
34. Nezhad MZ, Nazarian-Jashnabadi J, Rezazadeh J, Mehraeen M, Bagheri R. Assessing dimensions influencing IoT implementation readiness in industries: a fuzzy DEMATEL and fuzzy AHP analysis. J Soft Comput Decis Anal. 2023;1(1):102–23. doi:10.31181/jscda11202312. [Google Scholar] [CrossRef]
35. Feng X, Li E, Li J, Wei C. Critical influencing factors of employees’ green behavior: three-stage hybrid fuzzy DEMATEL-ISM–MICMAC approach. Environ Dev Sustain. 2024;26(7):17783–811. doi:10.1007/s10668-023-03364-0. [Google Scholar] [CrossRef]
36. Mao Q, Chen J, Lv J, Guo M, Xie P. Selection of plastic solid waste treatment technology based on cumulative prospect theory and fuzzy DEMATEL. Environ Sci Pollut Res Int. 2023;30(14):41505–36. doi:10.1007/s11356-022-25004-2. [Google Scholar] [PubMed] [CrossRef]
37. Irfan M, Rauniyar A, Hu J, Singh AK, Chandra SS. Modeling barriers to the adoption of metaverse in the construction industry: an application of fuzzy-DEMATEL approach. Appl Soft Comput. 2024;167:112180. doi:10.1016/j.asoc.2024.112180. [Google Scholar] [CrossRef]
38. Guan X, Yu F, Xu H, Li C, Guan Y. Flood risk assessment of urban metro system using random forest algorithm and triangular fuzzy number based analytical hierarchy process approach. Sustain Cities Soc. 2024;109:105546. doi:10.1016/j.scs.2024.105546. [Google Scholar] [CrossRef]
39. Mandal PK, Thakur M, Mittal G. Credibilistic portfolio optimization with higher-order moments using coherent triangular fuzzy numbers. Appl Soft Comput. 2024;151:111155. doi:10.1016/j.asoc.2023.111155. [Google Scholar] [CrossRef]
40. Xie G, Zhu W, Xiang J, Li T, Wu X, Peng Y, et al. A behavior three-way decision approach under interval-valued triangular fuzzy numbers with application to the selection of additive manufacturing composites. Eng Appl Artif Intell. 2024;137:109214. doi:10.1016/j.engappai.2024.109214. [Google Scholar] [CrossRef]
41. Li J, Wu H, Zhu C, Goh M. Evaluating and analyzing renewable energy performance in OECD countries under uncertainty: a robust DEA approach with common weights. Appl Energy. 2024;375:124115. doi:10.1016/j.apenergy.2024.124115. [Google Scholar] [CrossRef]
42. Mansaray SS, Xu H, Sawaneh IA. Assessing and enhancing operational efficiency in Sierra Leone’s retail banking sector: a comparative analysis using CCR and BCC DEA models. Manag Decis Econ. 2024;45(6):3705–15. doi:10.1002/mde.4225. [Google Scholar] [CrossRef]
43. Qiao JY, Wang DW, Li JH, Wang Y. Evaluation of agricultural machinery cooperative efficiency based on DEA method. J Agric Mech Res. 2025;11:293–300. (In Chinese). [Google Scholar]
Cite This Article
 Copyright © 2026 The Author(s). Published by Tech Science Press.
This work is licensed under a Creative Commons Attribution 4.0 International License , which permits unrestricted use, distribution, and reproduction in any medium, provided the original work is properly cited.
 Downloads
 Citation Tools