
 Submit a Paper
 Propose a Special lssue
 Open Access
ARTICLE
Optimal Operation of Virtual Power Plants Based on Revenue Distribution and Risk Contribution
School of Electrical Engineering, Shenyang Institute of Engineering, Shenyang, 110136, China
* Corresponding Author: Wenyao Sun. Email:
(This article belongs to the Special Issue: Grid Integration of Intermittent Renewable Energy Resources: Technologies, Policies, and Operational Strategies)
Energy Engineering 2026, 123(1), 17 https://doi.org/10.32604/ee.2025.069603
Received 26 June 2025; Accepted 21 August 2025; Issue published 27 December 2025
 View Full Text
 Download PDF
Abstract
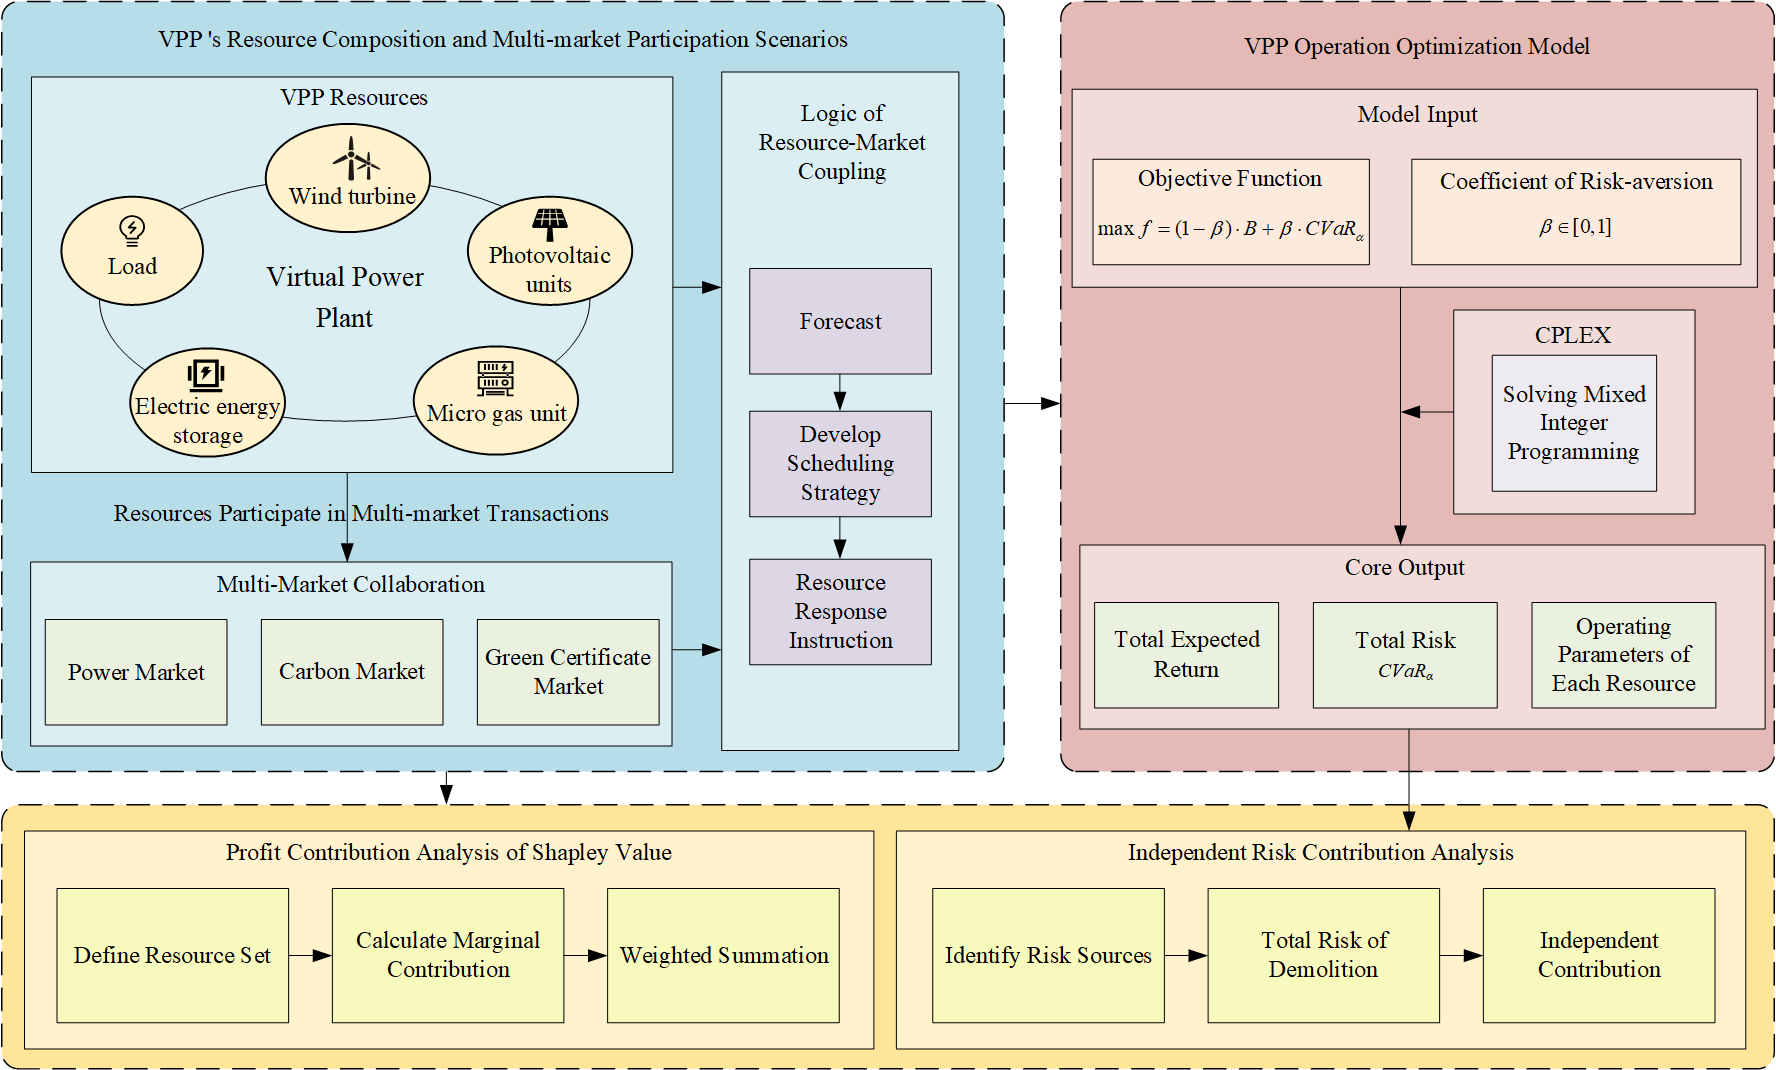
Virtual power plant (VPP) integrates a variety of distributed renewable energy and energy storage to participate in electricity market transactions, promote the consumption of renewable energy, and improve economic efficiency. In this paper, aiming at the uncertainty of distributed wind power and photovoltaic output, considering the coupling relationship between power, carbon trading, and green card market, the optimal operation model and bidding scheme of VPP in spot market, carbon trading market, and green card market are established. On this basis, through the Shapley value and independent risk contribution theory in cooperative game theory, the quantitative analysis of the total income and risk contribution of various distributed resources in the virtual power plant is realized. Moreover, the scheduling strategies of virtual power plants under different risk preferences are systematically compared, and the feasibility and accuracy of the combination of Shapley value and independent risk contribution theory in ensuring fair income distribution and reasonable risk assessment are emphasized. A comprehensive solution for virtual power plants in the multi-market environment is constructed, which integrates operation strategy, income distribution mechanism, and risk control system into a unified analysis framework. Through the simulation of multi-scenario examples, the CPLEX solver in MATLAB software is used to optimize the model. The proposed joint optimization scheme can increase the profit of VPP participating in carbon trading and green certificate market by 29%. The total revenue of distributed resources managed by VPP is 9% higher than that of individual participation.Graphic Abstract
Keywords
To accelerate the improvement of the overall layout of ecological civilization construction and help achieve the strategic goal of “double carbon” the state actively advocates for the low-carbon advancement of clean electric energy. By 2023, it is projected that China’s installed capacity for wind power and PV will exceed × 108 kW [1]. The Virtual Power Plant (VPP) is essential for leveraging multi-energy complementarity, reducing low-carbon emissions, and ensuring clean and efficient operations, which is crucial for the low-carbon transformation of contemporary energy systems [2,3].
Both domestic and international experts have extensively researched the optimal scheduling of VPP. Reference [4] delineates the market kinds in which virtual power plants can engage and the associated methods of participation. VPP may engage in the day-ahead, real-time, and ancillary services markets in compliance with the market access framework. In Reference [5], the VPP is regarded as the price receiver, and the day-ahead bidding strategy of the VPP participating in the energy and reserve markets simultaneously is studied. However, Ref. [6] considers the VPP to be a price influencer. Considering the VPP’s involvement in the distribution market to deliver energy, reserves, frequency modulation, and additional services, a collaborative clearing model for the distribution network is designed, accompanied by a recommended pricing methodology. Reference [7] suggests that establishing a centralized dispatch operation center for the VPP allows distributed power sources to function as a cohesive power generation unit, hence improving the economic efficiency of the VPP in market dispatching. The cited literature exclusively focuses on the optimal scheduling of VPPs in the electricity market, failing to adequately consider the emission reduction effects and benefits of VPPs participating in the carbon trading market and the green certificate market.
The gradual maturity and activity of carbon emissions trading (CET) and green certificate trading (GCT) offer a novel approach to enhancing renewable energy utilization and augmenting the economic advantages of VPP. In Reference [8], carbon trading is introduced into the peer-to-peer (P2P) trading model of multi-VPP, and the “electric carbon reserve” trading of VPP in P2P mode is realized. Reference [9] developed a tiered carbon trading price and realized a VPP low-carbon economic dispatch with power to gas (P2G) and carbon capture. In [10], a method for quantitative allocation of green certificates for frequency modulation ancillary services was designed, and the effects and possible problems brought by the implementation of the compensation method were discussed. Reference [11] constructed an economic dispatch model of a power system with wind power, considering the green power certificate trading system. The above literature only studies CET and GCT separately, neglecting the comprehensive evaluation of the joint emission reduction approach associated with the carbon trading market and the green certificate market.
Given the unpredictability of wind and solar generation in a VPP, assessing the risk associated with the system’s operational processes is essential. In [12], the CVaR theory is utilized to develop a two-stage scheduling model for VPP engagement in the electrical spot market. Reference [13] establishes an optimal scheduling model for power systems that incorporates VPP, utilizing conditional value at risk (CVaR) to minimize operational costs, successfully mitigating system risk.
Since VPP is composed of multiple members, the benefits generated by the optimal operation of VPP need to be reasonably allocated to different members. According to the cooperative game theory, Reference [14] analyzed the cooperation space and fair distribution of interests between VPP and distribution companies with wind, light, and water. Still, it did not involve the profit distribution of VPP members. The literature [15] studied the VPP separate operation and joint operation scheduling models and used the profit distribution model to allocate the results.
The current VPP only considers the optimal scheduling of VPP participating in the electricity market. In order to fully consider the emission reduction effects and benefits of VPP participating in the carbon trading market and the green certificate market, there are few studies on the distribution of benefits between internal resources and the risk contribution of uncertain factors. This paper presents a VPP optimization model that incorporates power, carbon, and green certificate trade. Initially, the electricity-carbon-green certificate trading mechanism analysis reveals the optimal operational mode of the VPP. Subsequently, to maximize VPP revenue, CVaR is employed to assess risks arising from uncertainties, including renewable energy output and electricity prices, leading to the establishment of an optimal operational model for the VPP that incorporates the electricity-carbon-green certificate trading mechanism. Ultimately, utilizing the Shapley value method and independent risk contribution theory, the quantitative analysis of the contributions of various dispersed resources within a VPP to total revenue and risk is conducted, offering guidance for resource allocation in VPP.
In this article, Section 1 highlights VPPs’ role in energy transition amid growing wind/photovoltaic capacity under the “double carbon” goal, notes gaps in multi-market coordination and revenue distribution, and presents the paper’s multi-market integration models. Second, Section 2 describes VPP structure (with distributed energy), uses US PJM rules for day-ahead/real-time markets, explains carbon quota, green certificate mechanisms, and emphasizes optimizing revenue/emissions via energy storage and gas turbine adjustments. Section 3 aims to maximize the weighted sum of expected returns and CVaR, covering return components, costs, and constraints like power balance and output limits. Section 4 applies the Shapley value for distributed resource revenue distribution and quantifies uncertain risks via independent risk contribution theory. Subsequently, Section 5 analyzes bidding strategies, scheduling, profit-risk relations under varying preferences, and discusses resource income/risk contributions. Finally, Section 6 summarizes multi-market integration innovations and validates the study’s theoretical methods.
This paper proposes a VPP ideal structure considering carbon trading, green certificate trading, and real-time unbalanced settlement to participate in the day-ahead market. VPP consists of multiple distributed energy sources, including micro gas turbines, energy storage equipment, wind power, PV generating, and adjustable loads.
VPP aggregates distributed resources into a whole. Because it has the right to schedule internal resources, it can coordinate and optimize various resources and engage in the power market for enhanced profitability. This paper’s power market model pertains to the PJM market regulations in the United States [16], which are categorized into two phases: the day-ahead spot market and the real-time balancing market. As shown in Fig. 1, the timing diagram of VPP’s participation in the electricity market is shown. The day-ahead market realizes clearing before the deadline through electricity declaration, as a transition between the day-ahead and real-time markets, the intraday hourly market (HB) allows VPP to adjust its reporting based on more accurate forecasts per hour, optimizes the intraday balance strategy, and reduces the risk of real-time bias. Finally, the power balance transaction is realized in the real-time balance market.

Figure 1: Organization sequence diagram of the electricity market
This paper adopts the baseline method for carbon emission quota allocation, specifically detailing the carbon emission quota for VPP during the t period as follows:
In the formula, m represents the number of electric generators in the VPP, and Pm denotes the output of the generator set m at time t; η is the VPP unit power emission distribution coefficient, established by the regional grid baseline emission factor’ released by the National Development and Reform Commission [17].
This paper quotes the GCT mechanism founded on the quota system. The quantity and revenue generated from green certifications are as follows [18]:
where: Ggre denotes the number of green certificates involved in the transaction within the system, this Rgre for green card income, $; Pi represents the actual output value of the ith renewable energy apparatus, kW;
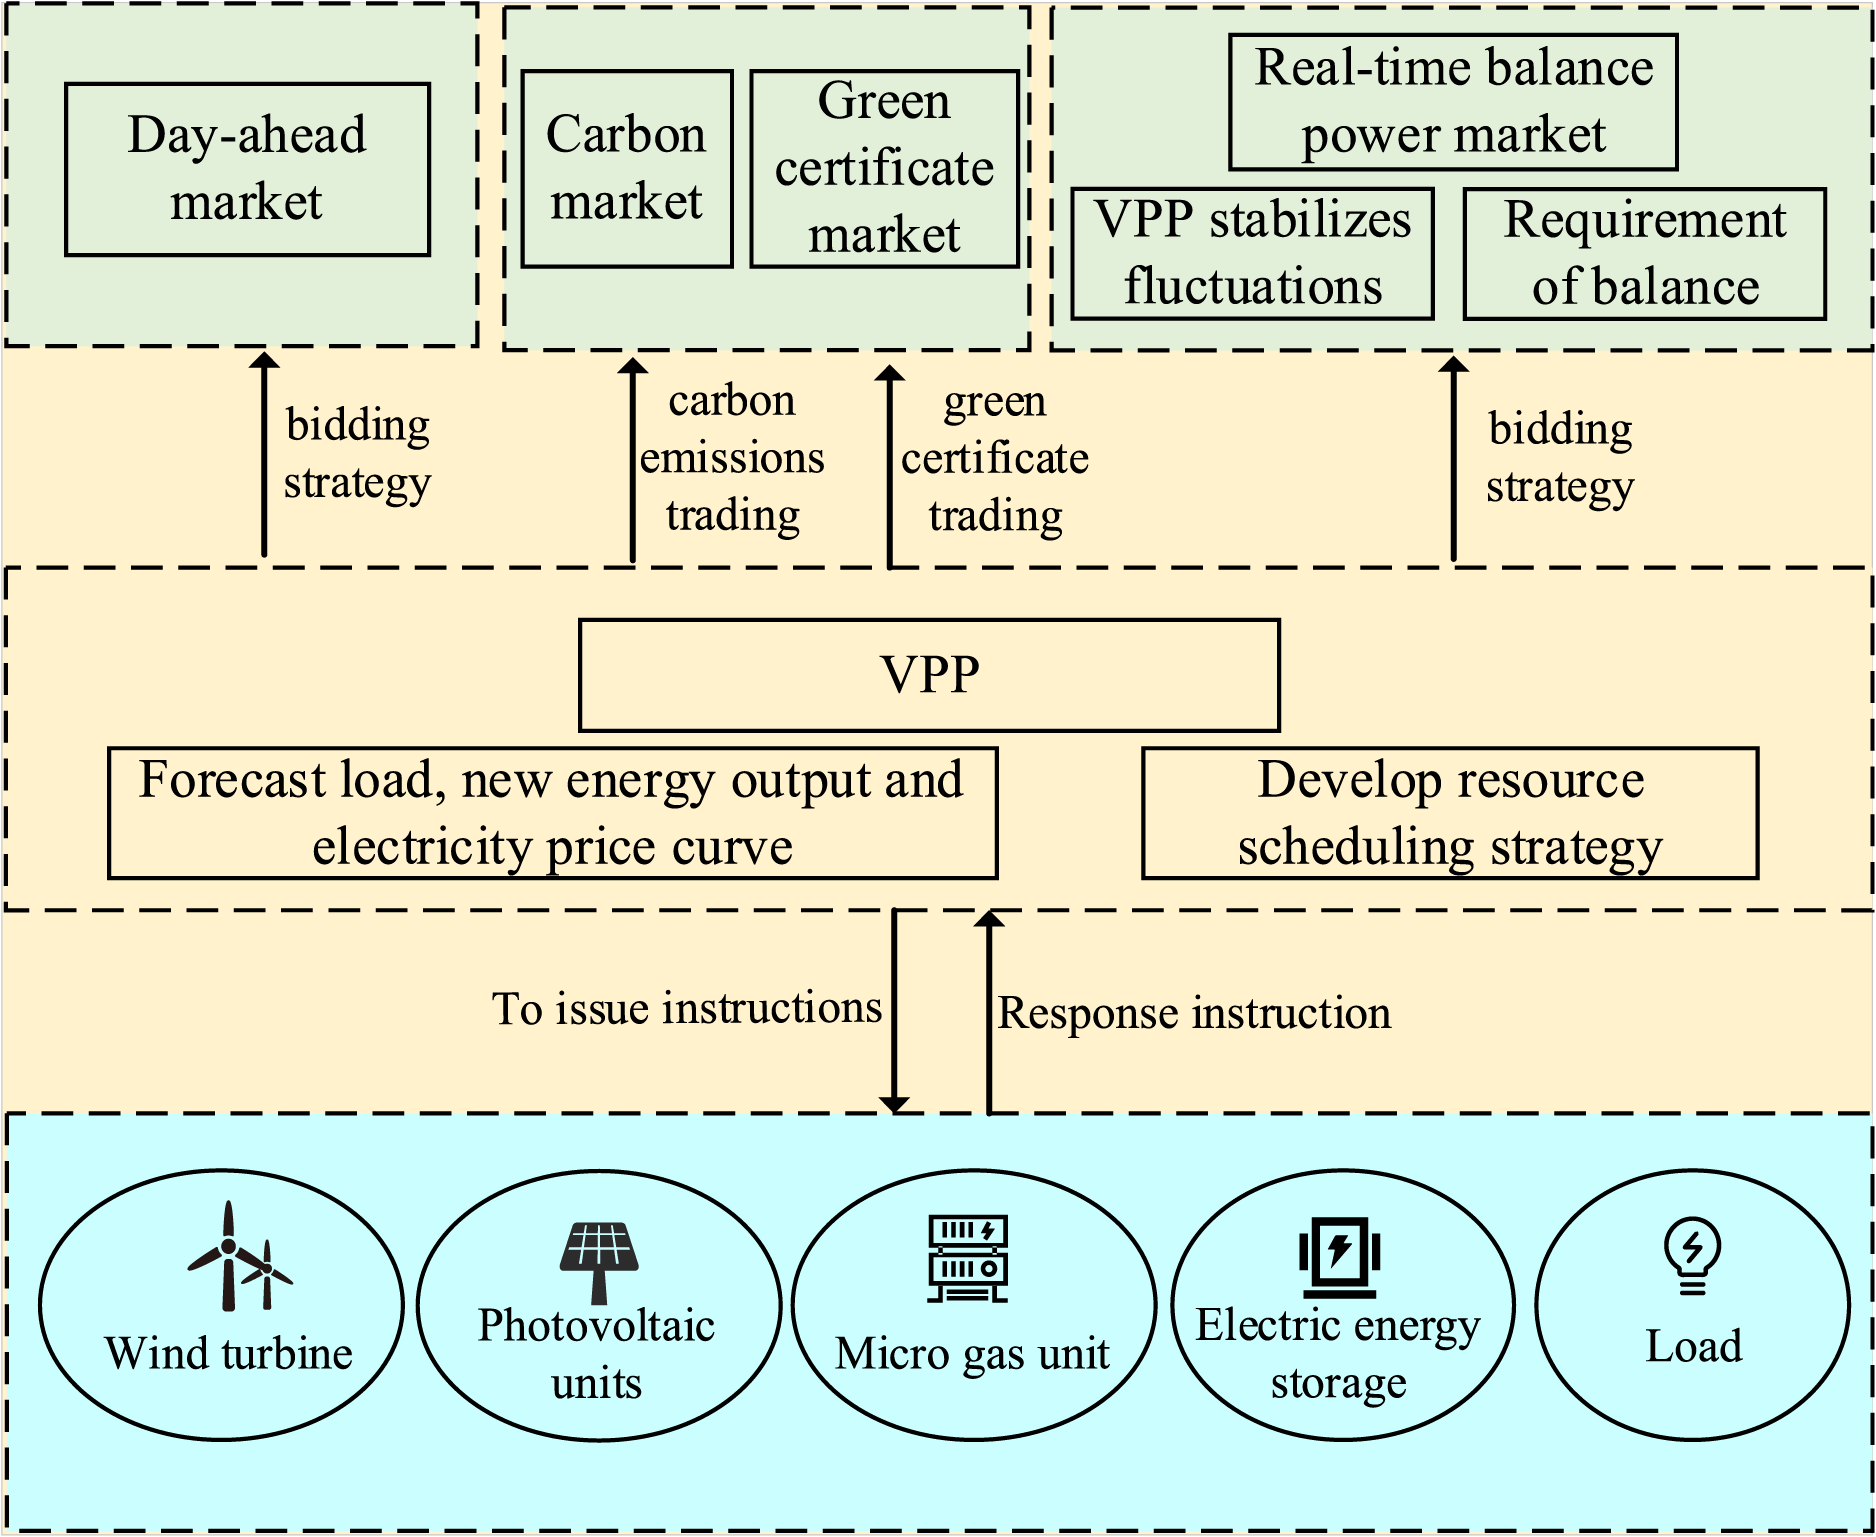
Figure 2: Virtual power plant operation framework
When formulating the day-ahead bidding strategy, it is necessary to consider the balance cost faced by the intra-day balanced operation of the uncertainty of the real-time output of the wind and solar power in the virtual power plant. Therefore, it is necessary to make good use of the adjustment function of its energy storage equipment to minimize the imbalance cost, and at the same time minimize the output of the micro gas turbine to reduce the total carbon emission of the VPP, so as to profit in the carbon trading market. Finally, through the wind power PV as the hub to participate in the green certificate market, when the new energy output in the VPP is surplus, it can not only participate in the electricity market, but also sell the green certificate to the green certificate market for profit.
3 VPP Operation Optimization Model via Revenue Distribution and Risk Contribution
In the day-ahead phase, the VPP autonomously determines its market bidding strategy by forecasting renewable energy generation, load demand, and electricity prices. During the real-time phase, the VPP trades the discrepancy between the declared power and the actual delivered power, owing to the divergence between renewable energy generation and actual load. To prevent investors from exploiting the price disparity between the day-ahead market and the real-time market., the real-time market employs a single price penalty model, which penalizes the sale or purchase of energy in the real-time market.
In order to enhance model comprehension, the subsequent hypotheses are proposed:
1. The VPP engages in the electricity market as a price taker, meaning its bidding way does not influence the day-ahead and real-time market prices.
2. The price volatility of the carbon market is significantly lower than that of the spot market. Thus, the cost of carbon is expected to remain stable.
The objective function of the VPP consists of two elements: expected return and conditional value at risk. The goal function is defined as follows, taking into account the risk preference:
where:
The expression of expected revenue B is as follows:
where:
(1) Day-ahead market returns
In the formula:
(2) Real-time market returns
In the formula:
(3) Renewable energy unit cost
In the formula:
(4) The expense of micro gas turbine
Because the micro gas turbine managed by the VPP is generally small in volume, it is assumed that it operates online throughout the time period, regardless of its start-stop cost, and its operating cost can be measured by a linear function [19]:
In the formula:
(5) Electric energy storage cost
During the charging and discharging process of electric energy storage equipment, the battery will decay, and the cost is related to the amount of charge and discharge of energy storage, which can be approximately measured by a linear function [20]:
In the formula: Ne is the number of electric energy storage managed by the VPP, ci is the depreciation cost coefficient of the ith electric energy storage
Microgas turbines are the primary source of carbon emissions for VPP. The advantages of VPP’s involvement in the carbon trading market are as follows:
In the formula:
The unpredictability of the real-time wind power balancing market will introduce risks to income distribution. This paper utilizes the conditional value at risk (CVaR) method to assess the risk associated with market prices and distributed resources faced by the VPP. The formula is as follows:
In the formula: V is the market returns, VaRα is the value at risk under the confidence level
In order to quantify the impact of uncertainties such as wind power, photovoltaic output and electricity price fluctuations on VPP returns, this paper uses conditional value-at-risk (CVaR) as a risk measurement index. This method is consistent with the research idea based on the improved Harris Hawk optimization algorithm. The operational risk of VPP under different risk aversion coefficients (β) is characterized by CVaR. It is found that when β increases, the tolerance of the system to extreme losses decreases, and the CVaR value increases significantly, and this rule is more obvious in real-time scheduling with a 5-min interval [22]. This paper further integrates CVaR and expected return into an objective function to balance the trade-off between risk and return.
(1) Power balance constraint
(2) Renewable energy unit output constraints
where:
(3) Gas turbine output constraint
Compared with the small-scale scheduling, the gas turbine exhibits a more rapid power response. Hence, the ramp constraint is disregarded, focusing solely on the upper and lower limit constraints.
In the formula:
(4) State of charge constraint of electric energy storage
To extend the operational lifespan of electric energy storage devices, keeping the state of charge within a specified range for each period is essential. Furthermore, to streamline the scheduling for the following day, the energy storage equipment’s state of charge at the end of the day must match its state at the beginning of the day.
In the formula:
(5) Demand response constraints
In the formula:
(6) Market electricity purchase and sale constraints
In the formula:
(7) Green certificate trading price constraints
In the formula:
In view of the fact that the constructed VPP optimal operation model contains linear objective function, linear constraints and some integer decision variables, which belongs to mixed integer linear programming problem and needs to deal with uncertain optimization in multiple scenarios, this paper selects IBM CPLEX solver to solve the model. The solver has powerful ability to solve large-scale linear programming and integer programming. It can efficiently deal with the high-dimensional constraints caused by scene sampling, ensure convergence to the global optimal solution in a reasonable time, and provide reliable computing support for the optimal bidding strategy and scheduling scheme of VPP.
4 Distributed Resource Benefit Analysis Method
The VPP selects to consolidate distributed resources to engage in the operation of the power system for several reasons: Initially, from the viewpoint of the power system, in contrast to the dispersed distributed resources of the distribution network, a substantial polymer can be established to engage in the transactions of the wholesale market and the functioning of the main network. Scheduling enhances the safety and reliability of power system operations. Additionally, by coordinating and optimizing various distributed resources, VPP operators can achieve greater returns than participating independently in the market. From the viewpoint of the VPP, the latter frequently presents greater motivation.
4.1 Analysis of Resource Revenue Contribution Based on Shapley Value
Figures should have relevant legends but should not contain the same information which is already describe The Shapley value method is a common profit distribution method in cooperative game, and is widely used in the field of profit and loss allocation in economics. For a cooperative game alliance composed of n subjects, there are 2n alliance combinations. The Shapley value determines the final income distribution of the subject by calculating the expected value of the marginal income contribution of each subject in all combinations it participates in.
The Shapley value calculation formula corresponding to the distributed resource g in the VPP is as follows [17]:
where: N is the number of distributed resource types in the VPP. In this chapter, it is
4.2 Resource Risk Contribution Analysis Based on Risk Contribution Theory
The risk contribution theory, which is often used to measure risk in economics, includes marginal risk contribution, incremental risk contribution and independent risk contribution [23]. The marginal risk contribution is used to measure the change of the degree of system risk caused by the slight increase of a certain risk factor. The incremental risk contribution is used to measure the change of the degree of system risk caused by the introduction of a new risk factor. The independent risk contribution is used to measure the impact of unrelated risk factors on the overall risk level in the system.
The overall risk level of the VPP is the sum of the risks caused by various risk factors. For the VPP, because the gas turbine and electric energy storage are completely controllable, regardless of their failure, the internal risk sources of the VPP are mainly the uncertainty of the PV unit, the wind turbine, and the user load. In addition, the volatility of the market price will also bring risks to the VPP, so there are four types of risk factors. The overall risk level expression of the VPP is as follows [23]:
In the formula:
The formula for calculating the independent risk contribution of risk factor l is as follows [23]:
where:
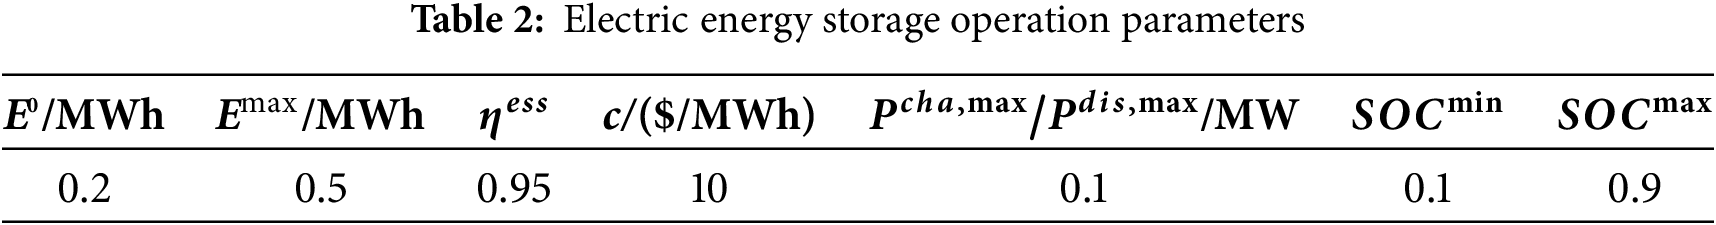
The VPP aggregates various distributed resources, including wind turbines, PV units, micro-gas turbines, electrical energy storage systems, and user loads. The installed capacity of wind turbines and PV units is 2 MW. The new energy output and load prediction curves are shown in Fig. 3. The standard deviations of wind power output, PV output, and load prediction errors are set to 10%, 10%, and 5% of the predicted values, respectively. The scene data is generated by Monte Carlo sampling, and the number of scenes is reduced by Latin hypercube sampling. The day-ahead and real-time power prices are derived from actual data of the PJM electricity market throughout summer, and a typical daily curve is produced using the K-means clustering approach. As shown in Fig. 4, the standard deviations of day-ahead price and real-time electricity price prediction errors are set to 10% and 20% of the predicted values, respectively. The VPP comprises a gas unit and an electric energy storage system, with parameter settings referenced in [19], as illustrated in Tables 1 and 2. The user load may be diminished by 10% of the electrical load during this period, and the internal electricity selling cost of the VPP employs a uniform electricity pricing model established at $90/MWh. The demand response compensation price is set at 20$/MWh. The operational and maintenance cost for wind power and PV units is 5$/MWh, and the confidence level of CVaR is 95%. According to the Shanghai carbon market’s spot trading trend and transaction data in 2020, the benchmark carbon quota price is 40$/t, the green certificate unit price is 60$/t, and the carbon market quota for VPP is 15 t. Each megawatt of power produced by a gas turbine results in 0.76 t of carbon emissions [24].

Figure 3: New energy output and load forecasting curve

Figure 4: Market electricity price forecast curve

5.2 VPP Optimization Strategy Analysis
(1) Bidding strategy analysis of VPP with different risk preferences
According to various risk aversion coefficients, the bidding strategy of the VPP in the day-ahead market is shown in Fig. 5.
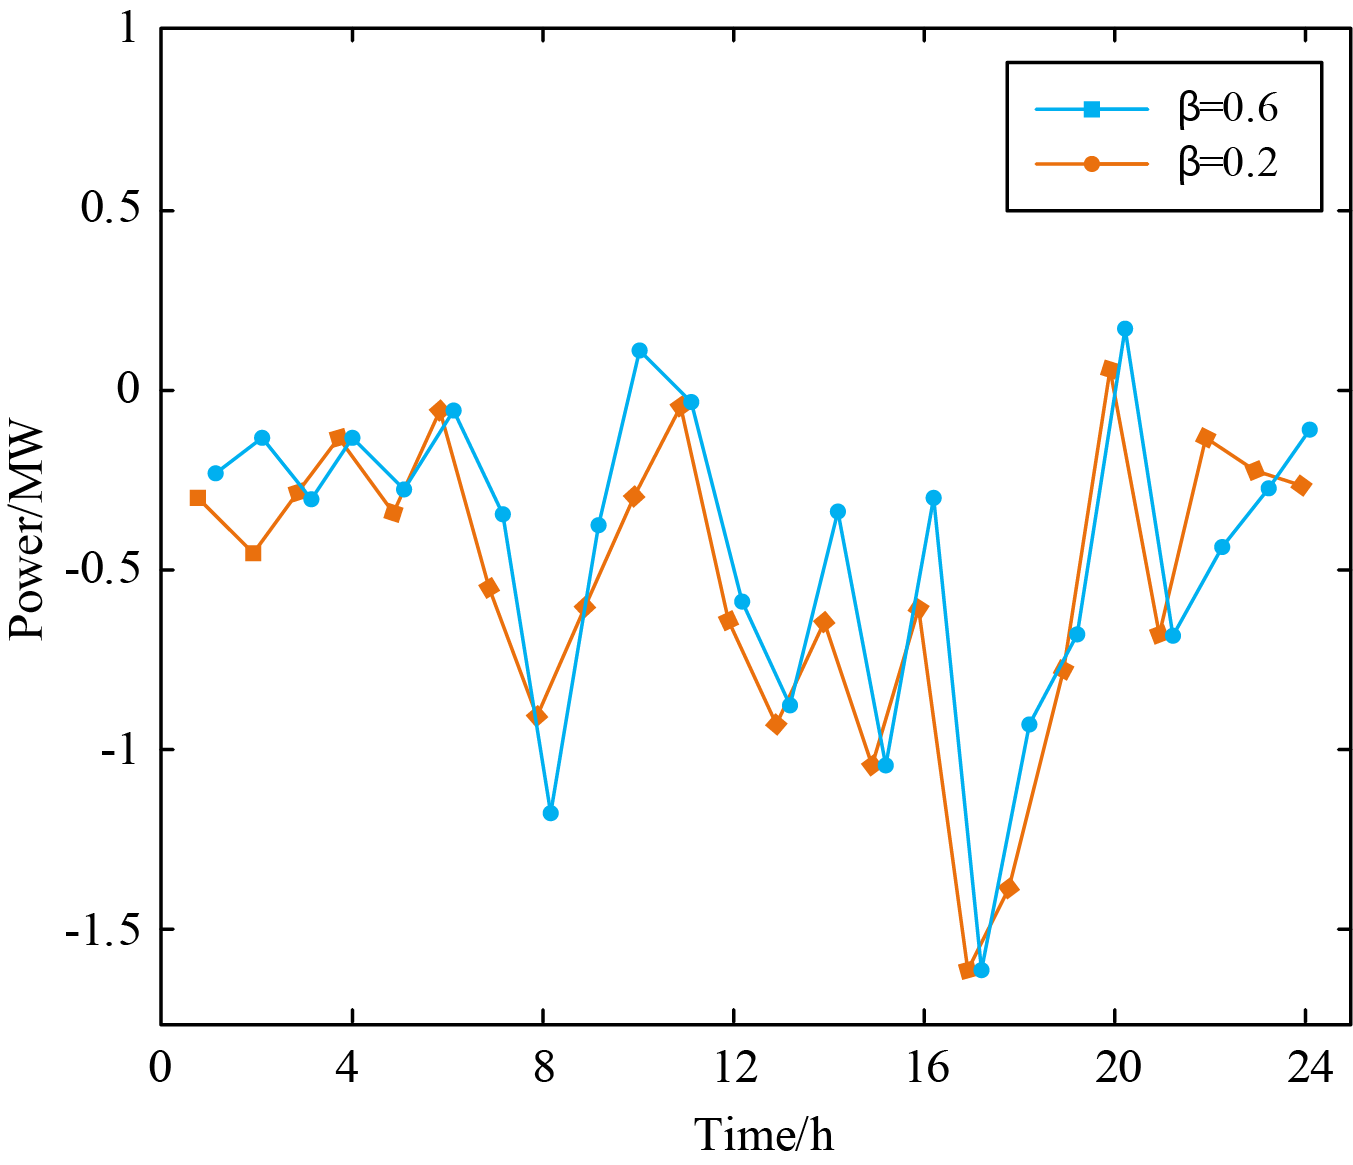
Figure 5: The day-ahead market bidding strategy of VPP under different risk preferences
When β = 0.2, the VPP is classified as risk-seeking, and when β = 0.6, the VPP is classified as risk-averse. The real-time market deviation penalty mechanism established in the study complicates the VPP’s ability to exploit pricing discrepancies between the day-ahead and real-time markets for arbitrage purposes. Therefore, the trading preference of the VPP can be seen from the day-ahead bidding strategy. It can be seen that in most cases, when the output of the VPP is surplus, when β = 0.2, the bidding volume of the VPP in the day-ahead market is higher than that when β = 0.6; when the output of the VPP is scarce, when β = 0.2, the bidding volume of the VPP in the day-ahead market is lower than that when β = 0.6. This is because the risk preference VPP is always optimistic about the market price and the power generation of the renewable energy unit, so it tends to sell as much electricity as possible in the market or buy as little electricity as possible to obtain higher profits.
In contrast, the risk aversion VPP aims to avoid the deviation penalty of the real-time market. Always hold a conservative estimate of its power generation and choose a more secure strategy in the market bidding. For the 10th period, it can be seen from the predicted output curve that the supply and demand within the VPP are almost balanced during the 10th period. For the risk-averse VPP, due to the conservative estimation of the renewable energy output, it is selected to purchase electricity in the day-ahead market to avoid insufficient electricity. At the same time, the risk-preferring VPP chooses to sell electricity in the day-ahead market.
(2) Evaluation of VPP resource optimization scheduling outcomes
Figs. 6–9 illustrate the optimal scheduling outcomes of the Virtual Power Plant (VPP) for β = 0.6 in scenario 1, the optimal scheduling outcomes of the VPP for β = 0.6 in scenario 2, the optimal scheduling outcomes of the VPP for β = 0.2 in scenario 1, and the scheduling of controllable resources within the VPP in the absence of uncertainties. The optimal scheduling strategies of VPPs are contrasted and studied under various risk preferences in conjunction with specific situations.

Figure 6: The optimal scheduling results when β = 0.6 in Scenario 1

Figure 7: The optimal scheduling results when β = 0.6 in Scenario 2
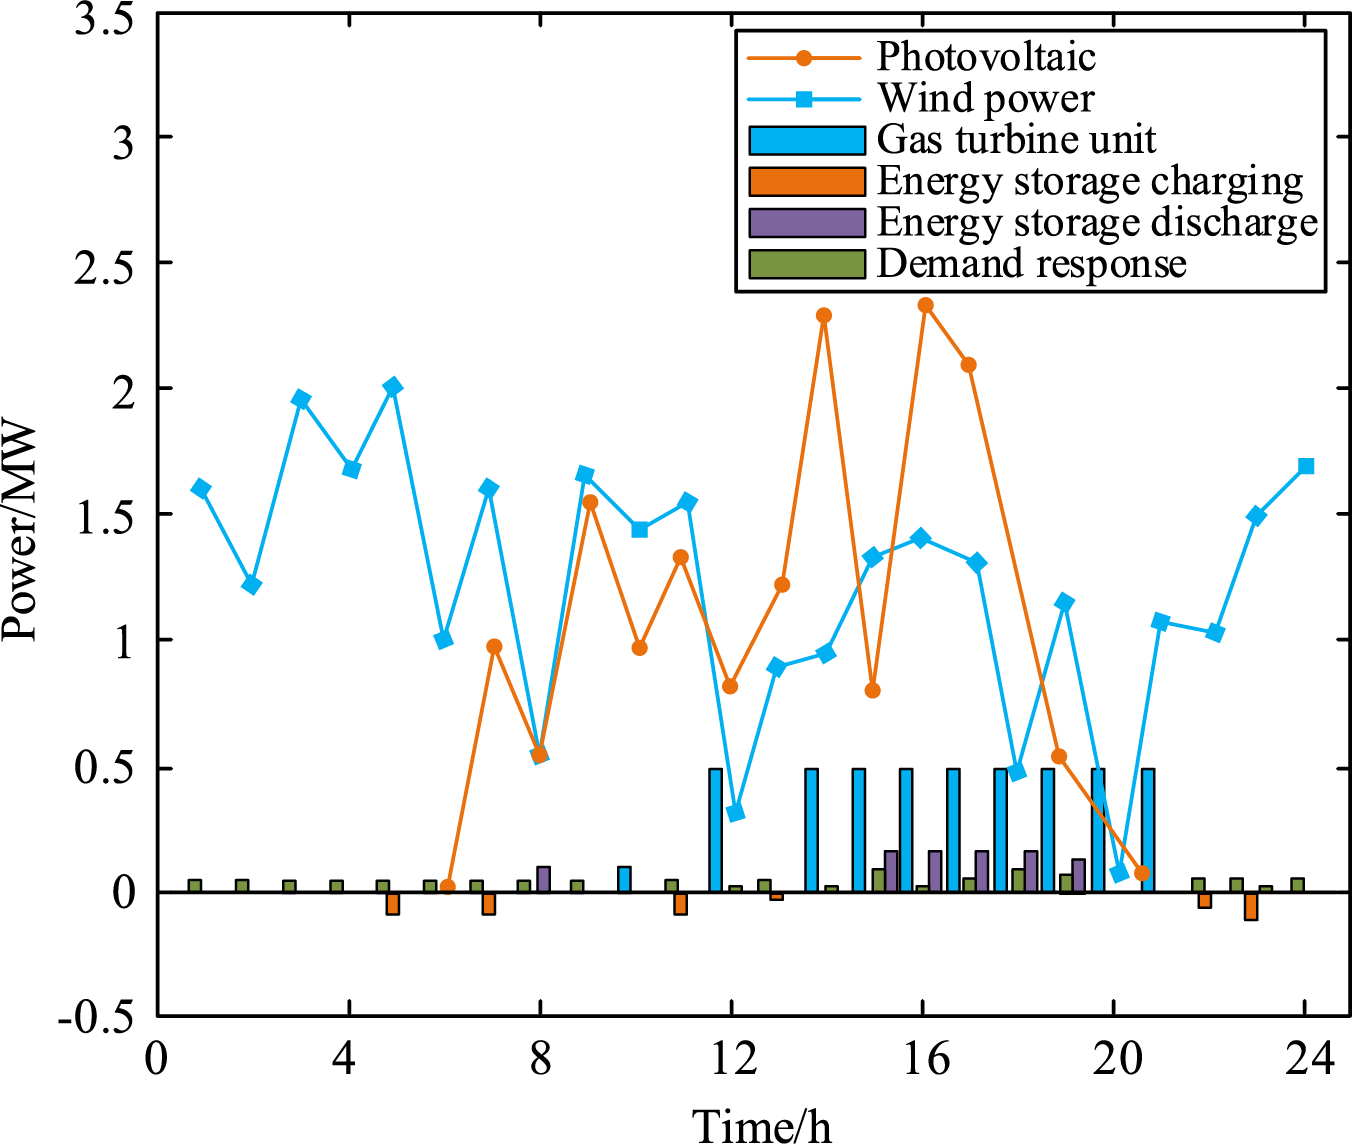
Figure 8: The optimal scheduling results when β = 0.2 in Scenario 1
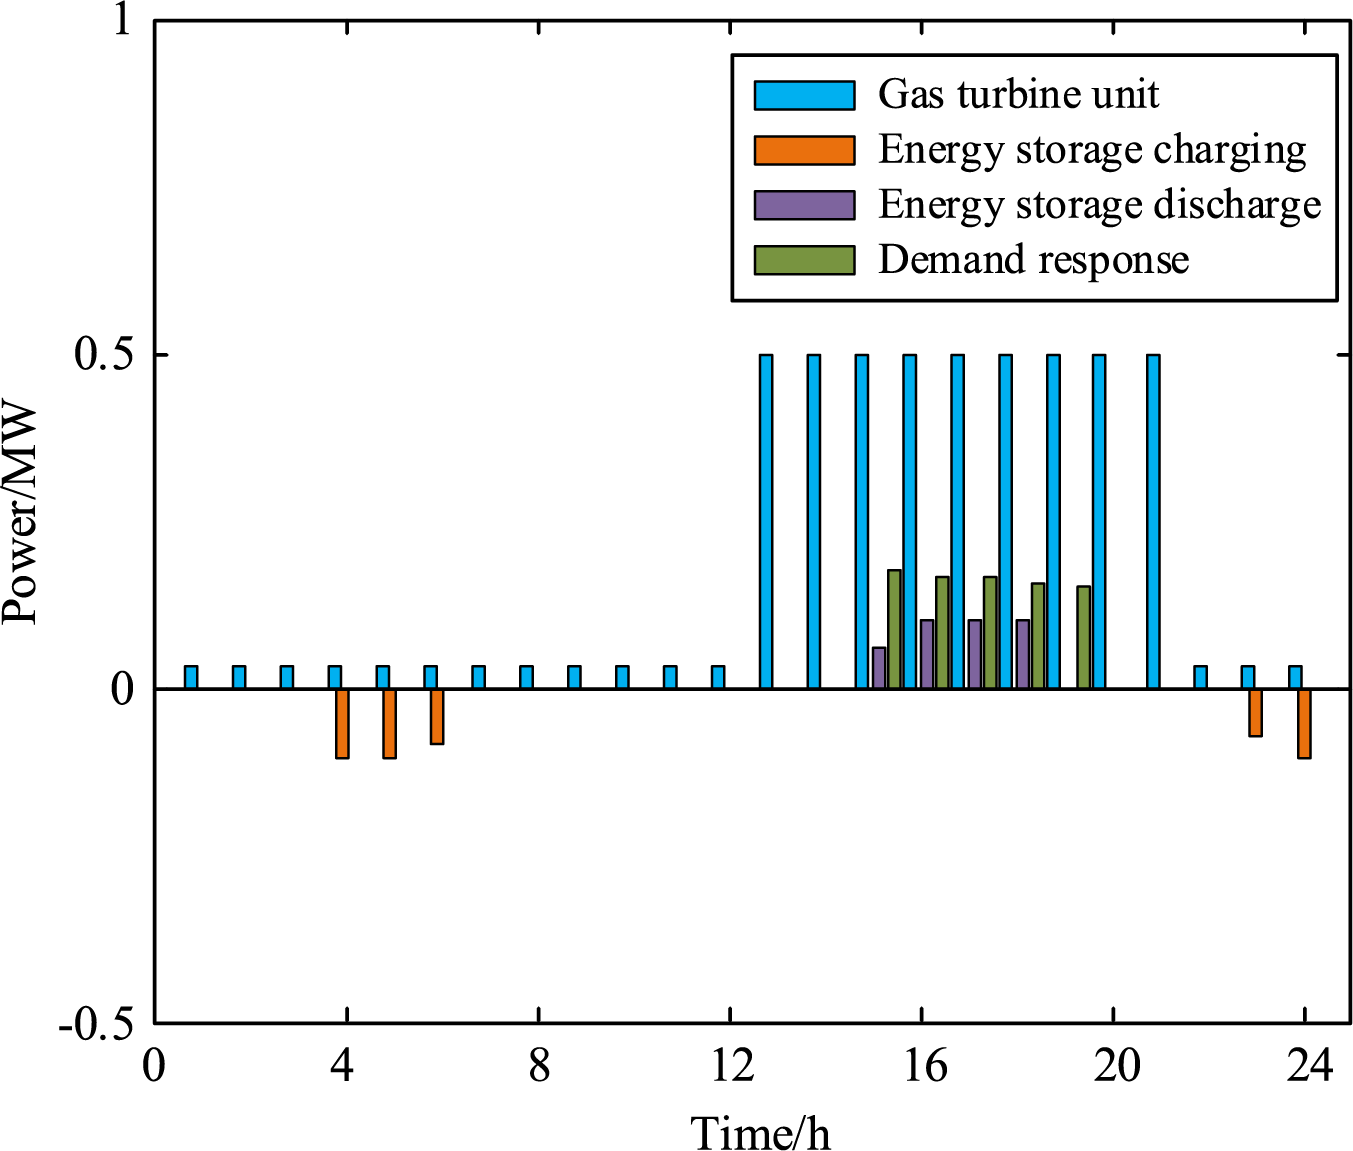
Figure 9: Controllable resource output without uncertain factors
Fig. 9 shows the optimal scheduling of controllable resources in VPPs without uncertainties. It can be seen that the scheduling of controllable resources is mainly related to its marginal cost. The operating cost of gas turbines is relatively high. Therefore, only when the market price is higher than its marginal cost will it choose to sell as much electricity as possible for profit, and the gas turbines will operate at the minimum power in other periods. The depreciation expense of electric energy storage apparatus is comparatively minimal, prompting the VPP to charge during periods of low electricity prices, discharge during high electricity prices, and capitalize on the differential between peak and valley pricing. Since the user’s electricity bill is one of the main income sources of the VPP, the VPP will only carry out demand response to obtain greater benefits when the market price is high. Under the consideration of uncertain factors such as wind and light, the scheduling of controllable resources is not completely linked to electricity price under the premise of following the optimal marginal benefit.
Figs. 6 and 7 compare the scheduling of controllable resources in different scenarios under the same risk aversion coefficient. It can be seen that the gas turbine plays a large role in stabilizing the uncertainty of wind and light to avoid the deviation penalty of the real-time market. For example, in the 23rd period of Fig. 7, the market price is less than the cost of the gas turbine, but due to the large deviation of the wind power output, the gas turbine will still be full to make up for this part of the power shortage. Figs. 6 and 8 compare the scheduling strategies of VPPs with different risk aversion coefficients in the same scenario. It can be seen that the general trend of the scheduling of controllable units is the same, which further shows that under the coordinated optimization operation, the controllable units mainly play a role in stabilizing the fluctuation of new energy. The difference in strategy of VPPs with different risk preferences mainly lies in the bidding strategy of day-ahead and real-time markets.
(3) The profit of VPP under different risk preferences
Fig. 10 shows the effective frontier of VPP technology, and shows the expected return and CVaR of VPP under various risk aversion factors.
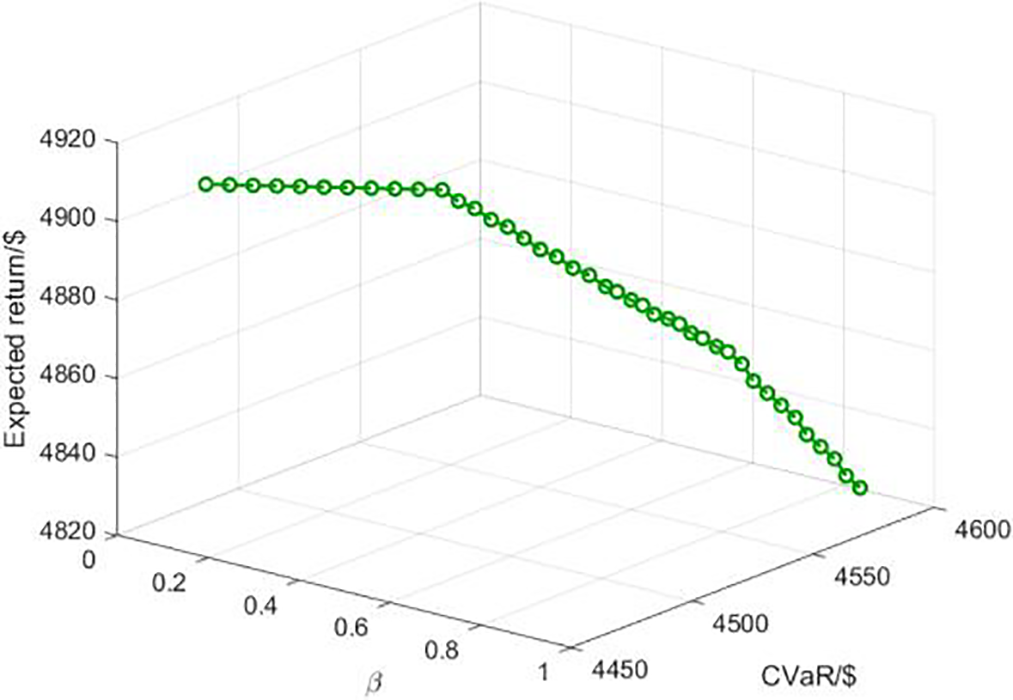
Figure 10: Effective frontier of VPP strategy
It can be seen from Fig. 10 that when the risk aversion coefficient rises, the VPP method becomes more and more conservative, resulting in a gradual decline in expected returns. The CVaR value of VPP increases with the increase of risk aversion coefficient. This is because the CVaR value reflects the expected return of VPP under the worst probability. Therefore, the more conservative the VPP strategy is, the stronger the ability to cope with risks is, and the higher the corresponding CVaR value is. In economics, the effective frontier is the intersection of decision-making combinations that satisfy risk minimization and return maximization. Fig. 10 shows that as the CVaR value increases, the expected return of the VPP gradually decreases, reflecting the principle of high risk and high return.
5.3 Benefits Analysis of Distributed Resources
(1) Revenue contribution analysis of distributed resources
The gas turbine, PV unit, wind turbine, energy storage equipment, and load resources are numbered 1, 2, 3, 4 and 5. When β = 0.5, the expected benefits for the 32 alliance scenarios are shown in Table 3.
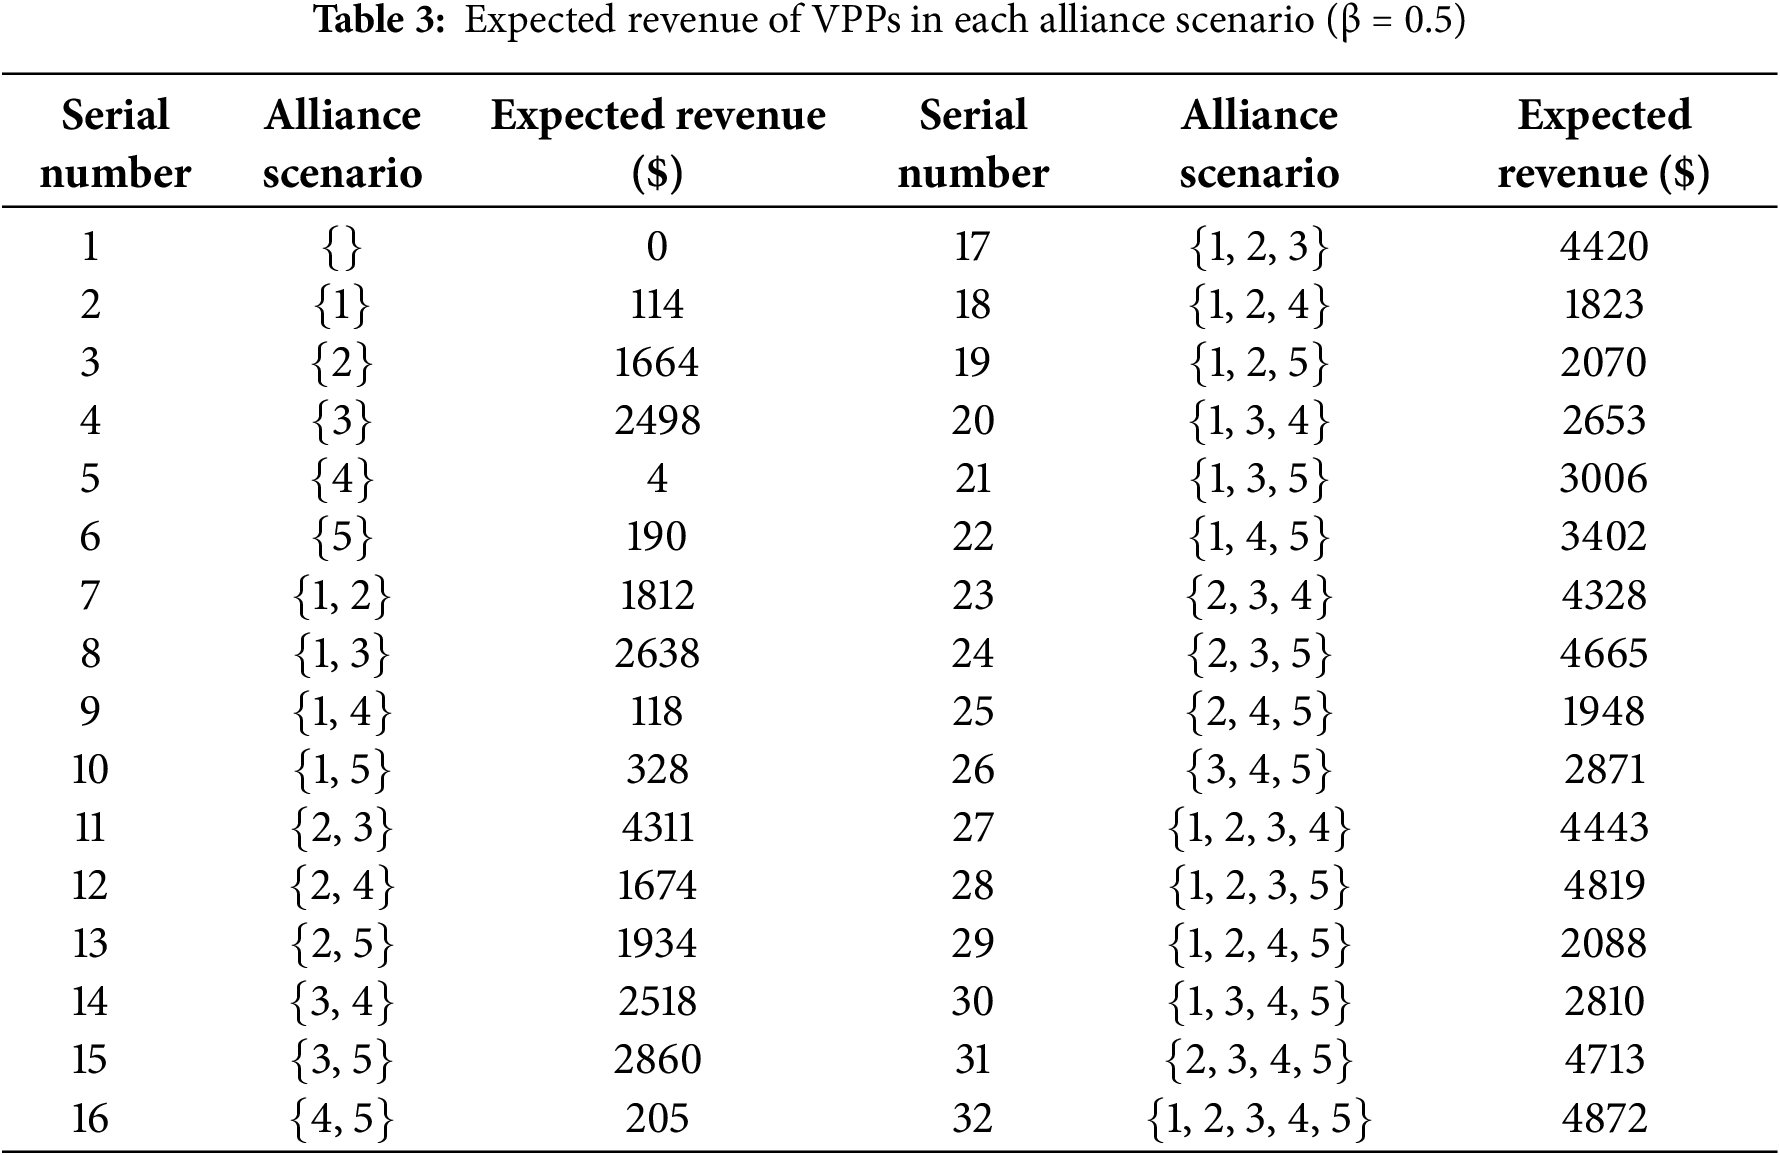
From Table 3, it can be seen that no matter what kind of alliance scenario, the income of the distributed resource portfolio participating in the market is greater than the sum of the income of participating in the market alone. For example, the income of {1, 2} is greater than the sum of {1} and {2}, and the income of {2, 3, 4} is greater than the sum of {2}, {3, 4} and {3}, {2, 4}. Table 4 presents the Shapley value for each dispersed resource, as computed based on Tables 1–3.
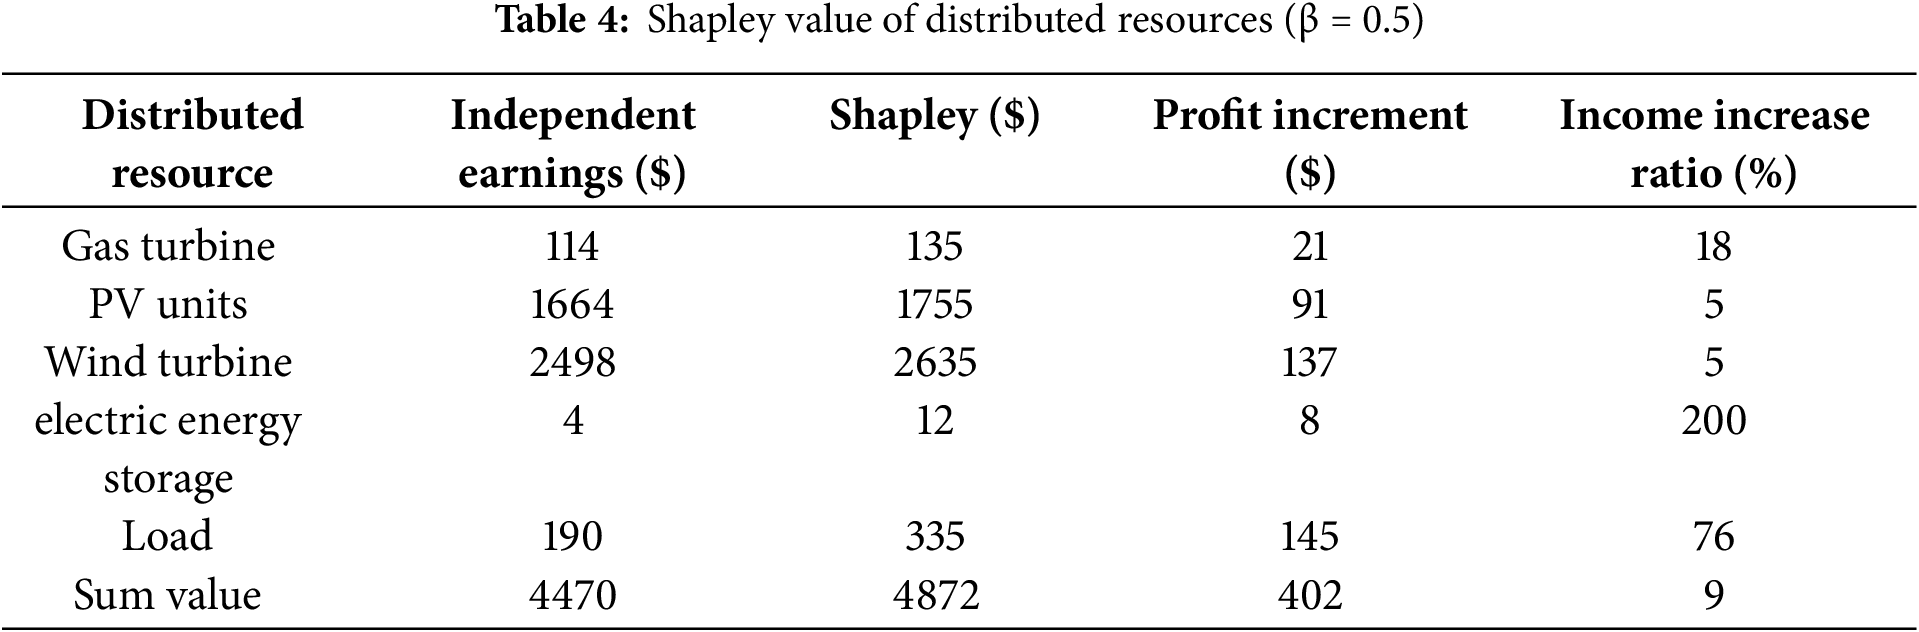
It can be seen from Table 4 that compared with participating in the market alone, the income of each resource under the unified management of VPPs has increased significantly. PV and wind turbines contribute the most to profits due to their low cost and sufficient capacity. The profitability of gas-fired units is low, limited by high marginal costs and small capacity, but technological improvements can increase their contribution. Electric energy storage has the highest proportion of revenue increase because its flexibility enhances the profit contribution. Load revenue has also increased significantly, and economic benefits have been improved through distributed power supply and demand response. In general, the VPP coordinates and optimizes resources, significantly improving overall revenue.
Table 5 presents the VPP income of the VPP, accounting for the carbon-green certificate transaction while excluding the two scenarios. Compared to the VPP, which is solely engaged in the energy market, the revenue of the VPP involved in the carbon trading market and the green certificate market has increased overall, and the carbon emissions of the VPP have been significantly reduced.

Table 6 shows the revenue increment of the VPP aggregated resources participating in the market under different risk aversion coefficients, compared with the distributed resources participating in the market alone. The median value of the table represents the sum of the revenue of each distributed resource participating in the market alone.

Table 6 illustrates that regardless of the risk preference type of the VPP, aggregated resources engaged in the market can achieve significant revenue enhancement. As the risk aversion coefficient rises, the revenue growth of the VPP correspondingly escalates. The more conservative the VPP’s strategy, the more it leverages the complementary attributes of resources to mitigate uncertainty, resulting in a bigger rise in income.
(2) Risk contribution analysis of distributed resources
The risk degree of risk factors is evaluated based on the theory of independent risk contribution. Table 7 is the independent risk contribution of each risk factor calculated based on the conditional value at risk under different risk aversion coefficients.
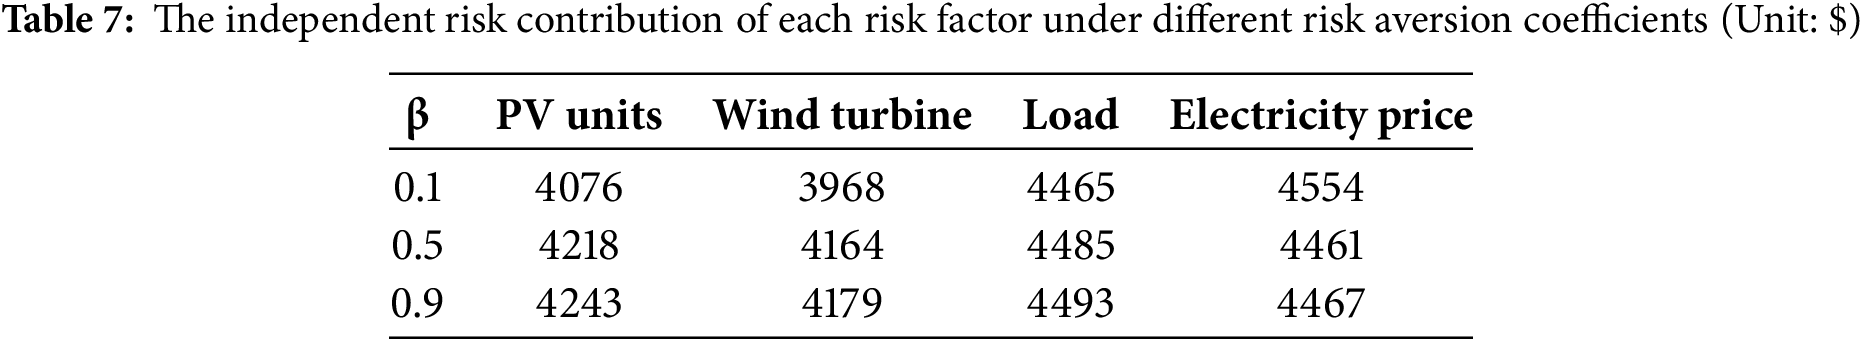
It should be noted that the wind power risk contribution shown in Table 7 is lower than that of photovoltaic, which is due to the large actual error of wind power in this experiment. As described in the parameter setting of Section 5.1, although the standard deviation of the prediction error of wind power and photovoltaic output is set to 10% of the predicted value, in the process of generating the scene by Monte Carlo sampling and reducing the dimension by Latin hypercube sampling, the wind power output is affected by the sudden change of meteorological factors such as wind speed and wind direction. The degree of actual fluctuation is significantly higher than that of photovoltaic (photovoltaic is relatively stable under clear sky conditions). Even if the nominal standard deviation of the two is the same, the actual error range of wind power in the generated scene is still larger.
Because of their controllable output, gas turbines and electric energy storage equipment are not considered risk factors. The risk associated with VPP market participation mostly arises from the unpredictability of PV units, wind turbines, load, and power prices. The independent risk contribution represents the CVR value of the VPP participating in the market when only the uncertainty of the resource is considered. The lower the independent risk contribution is, the greater the risk of the risk factor is. From Table 7, it can be seen that in the vertical comparison, with the increase of risk aversion coefficient, the bidding strategy of VPP tends to be conservative, the independent risk contribution of each risk factor gradually increases, and the risk degree gradually decreases. Although the electricity price fluctuates greatly, the independent risk contribution changes little under different risk aversion coefficients, which proves that the punishment mechanism of the real-time market effectively reduces the trading volume of the real-time market and avoids the VPP to use the price difference between the two markets to arbitrage to a certain extent. The independent risk contribution degree of each risk factor is compared horizontally. Regardless of the
Analyze in conjunction with Tables 4 and 7. Wind turbines are the largest source of revenue for VPPs but are also the largest source of risk, followed by PV units. Gas turbines have relatively low returns due to their high marginal costs, but their output is controllable and suitable for strategically conservative VPPs. Although the electric energy storage equipment is completely controllable, its income contribution is very low. Configuring the VPP alone is not recommended. It can only exert its advantages of smoothing fluctuations and bringing incremental profits when it is in coordination with the new energy unit. In general, new energy units have high risk and high-income characteristics. VPPs can maximize their benefits only when matched with controllable resources such as gas units and energy storage. On the load side, the user load can generally be predicted more accurately through historical data, so the risk contribution of load resources is low. However, due to its demand-side attributes, it can obtain greater benefits only when the VPP is equipped with a power supply.
The main research results of this paper are reflected in the fifth chapter. Firstly, the optimal operation model of virtual power plant (VPP) in the electricity spot market, carbon trading market and green certificate market is constructed. The model takes the expected return and conditional value-at-risk (CVaR) as the objective function, and considers the uncertainty factors such as wind power, photovoltaic output and electricity price. It can provide the optimal bidding strategy for VPP and effectively balance the benefits and risks. Secondly, through the Shapley value and independent risk contribution theory in collaborative game theory, the contribution and risk of distributed resources (such as photovoltaic, wind turbine, gas turbine, energy storage and load) in VPP to total income are quantitatively analyzed, and the role of different resources in income distribution and risk-taking is clarified. For example, photovoltaic and wind turbine are the main sources of income, and energy storage has the highest proportion of income increase, while wind turbine and photovoltaic are also the main sources of risk. Furthermore, the effectiveness of the model is verified by a case study. The results show that when VPP integrates distributed resources to participate in multi-market transactions, the revenue is significantly higher than the sum of the resources participating in the market alone, and participating in carbon trading and green certificate market can increase VPP revenue by 29%, while reducing carbon emissions ; under different risk preferences (reflected by risk aversion coefficient β), there are differences in the bidding strategy and revenue performance of VPP. The higher the degree of risk aversion, the more conservative the strategy, the higher the CVaR value and the lower the expected return, which reflects the trade-off between risk and return. In summary, this study not only provides quantitative tools and strategic guidance for VPP’s operational decision-making, but also constructs an integrated framework for efficient utilization of distributed energy and low-carbon transformation from the dimensions of resource integration, market coordination, risk management and control, which is of great practical significance for promoting the clean and intelligent upgrading of energy system.
This study conducts a comprehensive assessment of the optimization potential of incorporating virtual power plants into the electricity market operation system. This research uniquely integrates the collaborative operation analysis of the electricity spot market, carbon trading market and green certificate market, providing new insights into the utilization of distributed energy to address the dual demands of renewable energy consumption and low-carbon emission reduction in the energy system. Compared with previous studies, this research effectively Bridges the gap between single-market dispatching and multi-market collaborative optimization. The results show that the virtual power plant maximizes profits in multiple markets by integrating decentralized resources, and the VPP participating in the carbon trading and green certificate market increases by 29% compared with the VPP participating in the electricity market only. The total revenue of distributed resources managed by VPP is 9% higher than that of individual participation. Under different risk aversion coefficients, the revenue increment of VPP aggregated resources relative to distributed resources participating alone increases with the increase of risk aversion coefficient, from the increment when β = 0.1 to the increment when β = 0.9. Therefore, this study has more application value.
In addition, this study systematically compared the dispatching strategies of virtual power plants under different risk preferences, emphasizing the enhanced feasibility and accuracy of the method combining Shapley values with the independent risk contribution theory in ensuring fair revenue distribution and reasonable risk assessment.
Ultimately, the novelty of this research lies in its comprehensive approach to the operation, revenue distribution and risk control of virtual power plants in a multi-market environment, and it proposes an expandable and optimized operation model that can be applied to similar energy systems, making it better utilized by the world.
Acknowledgement: We are extremely grateful for the support and assistance from Shenyang Institute of Engineering, and also thank our teachers for their generous help. We express our deep thanks here.
Funding Statement: This research was funded by the Department of Education of Liaoning Province and was supported by the Basic Scientific Research Project of the Department of Education of Liaoning Province (Grant No. LJ222411632051) and (Grant No. LJKQZ2021085), Natural Science Foundation Project of Liaoning Province (Grant No. 2022-BS-222).
Author Contributions: The authors confirm contribution to the paper as follows: Conceptualization, Heping Qi, Wenyao Sun and Yi Zhao; methodology, Heping Qi and Yi Zhao; software, Heping Qi, Wenyao Sun and Xiaoyi Qian; validation, Xiaoyi Qian and Xingyu Jiang; analysis and interpretation of results, Heping Qi, Yi Zhao and Xingyu Jiang. All authors reviewed the results and approved the final version of the manuscript.
Availability of Data and Materials: The data that support the findings of this study are available from the corresponding author, Wenyao Sun, upon reasonable request.
Ethics Approval: Not applicable.
Conflicts of Interest: The authors declare no conflicts of interest to report regarding the present study.
Nomenclature
| VPP | Virtual Power Plant |
| PV | Photovoltaic |
| CET | Carbon Emissions Trading |
| GCT | Green Certificate Trading |
| P2P | Peer-to-Peer |
| P2G | Power to Gas |
| CVaR | Conditional Value at Risk |
| PJM | Pennsylvania-New Jersey-Maryland |
| HB | Hourly Market |
| CPLEX | Combinatorial Problem LEXicographer |
| Carbon Emission Quota for VPP | |
| Risk Aversion Coefficient | |
| Cost Coefficient of Gas Unit | |
| Minimum Power of Gas Turbine | |
| Maximum Power of Gas Turbines | |
| Factors Affecting the Charging and Discharging Efficiency of Energy Storage Devices | |
| Standard Price of Micro Gas Turbines | |
| Maximum Threshold of Charging Power of Energy Storage Device | |
| Maximum Threshold of Discharge Power of Energy Storage Device | |
| Lower Limit of Charge Degree of Energy Storage Device | |
| Upper Limit of Charge Degree of Energy Storage Device |
References
1. Xi J. Speech by president Xi Jinping at the Climate Ambition Summit. China Environ Monit. 2020;7(12):8–9. (In Chinese). [Google Scholar]
2. Liu X. Research on optimal dispatch method of virtual power plant considering various energy complementary and energy low carbonization. Int J Electr Power Energy Syst. 2022;136(1):107670. doi:10.1016/j.ijepes.2021.107670. [Google Scholar] [CrossRef]
3. Jin W, Wang P, Yuan J. Key role and optimization dispatch research of technical virtual power plants in the new energy era. Energies. 2024;17(22):5796. doi:10.3390/en17225796. [Google Scholar] [CrossRef]
4. Zhang G, Jiang C, Wang X. Comprehensive review on structure and operation of virtual power plant in electrical system. IET Gener Trans Dist. 2019;13(2):145–56. doi:10.1049/iet-gtd.2018.5880. [Google Scholar] [CrossRef]
5. Zeng Z, Sun Q, Zhao W, Bai Y, Deng S, Guo J. Joint optimized operation of electricity spot and reserve markets considering bidding strategies for virtual power plants. IEEE Access. 2024;12(5):166114–25. doi:10.1109/ACCESS.2024.3494759. [Google Scholar] [CrossRef]
6. Wang J, Xu J, Wang J, Ke D, Yao L, Zhou Y, et al. Two-stage distributionally robust offering and pricing strategy for a price-maker virtual power plant. Appl Energy. 2024;363(6):123005. doi:10.1016/j.apenergy.2024.123005. [Google Scholar] [CrossRef]
7. Ullah Z, Mokryani G, Campean F, Hu YF. Comprehensive review of VPPs planning, operation and scheduling considering the uncertainties related to renewable energy sources. IET Energy Syst Integr. 2019;1(3):147–57. doi:10.1049/iet-esi.2018.0041. [Google Scholar] [CrossRef]
8. Song Z, Xu Y, Yang L, Sun H. Carbon-aware peer-to-peer joint energy and reserve trading market for prosumers in distribution networks. IEEE Internet Things J. 2024;11(14):24467–82. doi:10.1109/JIOT.2024.3367361. [Google Scholar] [CrossRef]
9. Xie T, Wang Q, Zhang G, Zhang K, Li H. Low-carbon economic dispatch of virtual power plant considering hydrogen energy storage and tiered carbon trading in multiple scenarios. Processes. 2024;12(1):90. doi:10.3390/pr12010090. [Google Scholar] [CrossRef]
10. Wang C, Jiang Y, Guo H, Bai K, Zhang X, Wang A. A joint clearing model for the participation of renewable energy and energy storage in the frequency modulation ancillary service market considering performance differences. Front Energy Res. 2023;11:1332041. doi:10.3389/fenrg.2023.1332041. [Google Scholar] [CrossRef]
11. Tong X, Zhao S, Chen H, Wang X, Liu W, Sun Y, et al. Optimal dispatch of a multi-energy complementary system containing energy storage considering the trading of carbon emission and green certificate in China. Energy. 2025;314:134215. doi:10.1016/j.energy.2024.134215. [Google Scholar] [CrossRef]
12. Gao R, Guo H, Zhang R, Mao T, Xu Q, Zhou B, et al. A two-stage dispatch mechanism for virtual power plant utilizing the CVaR theory in the electricity spot market. Energies. 2019;12(17):3402. doi:10.3390/en12173402. [Google Scholar] [CrossRef]
13. Toubeau JF, Nguyen TH, Khaloie H, Wang Y, Vallée F. Forecast-driven stochastic scheduling of a virtual power plant in energy and reserve markets. IEEE Syst J. 2022;16(4):5212–23. doi:10.1109/JSYST.2021.3114445. [Google Scholar] [CrossRef]
14. Wang Y, Zhang M, Ao J, Wang Z, Dong H, Zeng M. Profit allocation strategy of virtual power plant based on multi-objective optimization in electricity market. Sustainability. 2022;14(10):6229. doi:10.3390/su14106229. [Google Scholar] [CrossRef]
15. Tan ZF, Li HH, Ju LW, Tan QK. Joint scheduling optimization of virtual power plants and equitable profit distribution using shapely value theory. Math Probl Eng. 2018;2018(1):3810492. doi:10.1155/2018/3810492. [Google Scholar] [CrossRef]
16. Zhang Y, Anvari-Moghaddam A, Peyghami S, Blaabjerg F. Novel frequency regulation scenarios generation method serving for battery energy storage system participating in PJM market. Energies. 2024;17(14):3479. doi:10.3390/en17143479. [Google Scholar] [CrossRef]
17. Zhang S, Pang L, Li Y, Chen Y, Li K, Zheng M. Green-fitting scheduling equilibrium model of virtual power plant based on cooperative game with improved shapley value under new-type power system. Int J Electr Power Energy Syst. 2025;168(18):110704. doi:10.1016/j.ijepes.2025.110704. [Google Scholar] [CrossRef]
18. Dabbagh SR, Sheikh-El-Eslami MK. Risk assessment of virtual power plants offering in energy and reserve markets. IEEE Trans Power Syst. 2016;31(5):3572–82. doi:10.1109/TPWRS.2015.2493182. [Google Scholar] [CrossRef]
19. Aoun A, Adda M, Ilinca A, Ghandour M, Ibrahim H. Optimizing virtual power plant management: a novel MILP algorithm to minimize levelized cost of energy, technical losses, and greenhouse gas emissions. Energies. 2024;17(16):4075. doi:10.3390/en17164075. [Google Scholar] [CrossRef]
20. Kim H, Lee J, Bahrami S, Wong VWS. Direct energy trading of microgrids in distribution energy market. IEEE Trans Power Syst. 2020;35(1):639–51. doi:10.1109/TPWRS.2019.2926305. [Google Scholar] [CrossRef]
21. Wu C, Lin S, Xia C, Guan L. Distributed optimal scheduling of microgrid group based on model predictive control. Power Grid Technol. 2020;44(2):530–8. (In Chinese). doi:10.13335/j.1000-3673.pst.2019.0772. [Google Scholar] [CrossRef]
22. Pandey AK, Jadoun VK. Real-time and day-ahead risk averse multi-objective operational scheduling of virtual power plant using modified Harris Hawk’s optimization. Electr Power Syst Res. 2023;220(16):109285. doi:10.1016/j.epsr.2023.109285. [Google Scholar] [CrossRef]
23. Peng C, He Y, Gu H, Lai K, Zhou X, Luo H, et al. Dominance constraints for risk control of a VPP’s optimal bidding strategy. IEEE Access. 2024;12:59122–33. doi:10.1109/ACCESS.2024.3392487. [Google Scholar] [CrossRef]
24. Egware HO, Kwasi-Effah CC. A novel empirical model for predicting the carbon dioxide emission of a gas turbine power plant. Heliyon. 2023;9(3):e14645. doi:10.1016/j.heliyon.2023.e14645. [Google Scholar] [PubMed] [CrossRef]
Cite This Article
 Copyright © 2026 The Author(s). Published by Tech Science Press.
This work is licensed under a Creative Commons Attribution 4.0 International License , which permits unrestricted use, distribution, and reproduction in any medium, provided the original work is properly cited.
 Downloads
 Citation Tools