
 Submit a Paper
 Propose a Special lssue
 Open Access
ARTICLE
Equivalent Modeling with Passive Filter Parameter Clustering for Photovoltaic Power Stations Based on a Particle Swarm Optimization K-Means Algorithm
1 State Key Laboratory of HVDC, Electric Power Research Institute of China Southern Power Grid Company, Guangzhou, 510663, China
2 Guangdong Provincial Key Laboratory of Intelligent Operation and Control for New Energy Power System, Guangzhou, 510663, China
3 Electric Power Science Research Institute of Yunnan Power Grid Co., Ltd., Kunming, 650217, China
* Corresponding Author: Binjiang Hu. Email:
(This article belongs to the Special Issue: Integration of Renewable Energies with the Grid: An Integrated Study of Solar, Wind, Storage, Electric Vehicles, PV and Wind Materials and AI-Driven Technologies)
Energy Engineering 2026, 123(1), 20 https://doi.org/10.32604/ee.2025.069777
Received 30 June 2025; Accepted 27 August 2025; Issue published 27 December 2025
 View Full Text
 Download PDF
Abstract
This paper proposes an equivalent modeling method for photovoltaic (PV) power stations via a particle swarm optimization (PSO) K-means clustering (KMC) algorithm with passive filter parameter clustering to address the complexities, simulation time cost and convergence problems of detailed PV power station models. First, the amplitude–frequency curves of different filter parameters are analyzed. Based on the results, a grouping parameter set for characterizing the external filter characteristics is established. These parameters are further defined as clustering parameters. A single PV inverter model is then established as a prerequisite foundation. The proposed equivalent method combines the global search capability of PSO with the rapid convergence of KMC, effectively overcoming the tendency of KMC to become trapped in local optima. This approach enhances both clustering accuracy and numerical stability when determining equivalence for PV inverter units. Using the proposed clustering method, both a detailed PV power station model and an equivalent model are developed and compared. Simulation and hardware-in-loop (HIL) results based on the equivalent model verify that the equivalent method accurately represents the dynamic characteristics of PV power stations and adapts well to different operating conditions. The proposed equivalent modeling method provides an effective analysis tool for future renewable energy integration research.Keywords
Climate change and global energy demands are motivating the establishment of a series of green, ecological, sustainable, carbon emission-reduced and reliable energy sources [1–4]. The development of photovoltaic (PV) power generation is currently in a rapid growth period [5]. With increasing global demand for clean energy, the worldwide installed capacity of PV power generation continues to rise, with an annual installed global capacity of approximately 375 GW. However, with the expanded scales of PV power stations, the challenges in their grid integration have become increasingly prominent. Highly complex, detailed PV power station modeling has led to problems in grid integration analysis systems, such as long simulation times and difficulties in achieving convergence. Therefore, an equivalent modeling method is particularly important since it can reduce the modeling dimensions of PV generation systems. It will provide an effective tool for grid analysis, optimize grid operation strategies, and improve the stability and reliability of the future grid with high proportions of renewable energy [6,7]. Benefiting from equivalent modeling techniques, several studies indicate that collaborative design of equivalent modeling and scheduling algorithms can significantly improve the prediction accuracy and control efficiency in distributed renewable energy integration applications [8,9].
The development of equivalent modeling research on PV power stations has gone through multiple stages. The initial research focuses mainly on stand-alone equivalent models, which are suitable for small-scale PV power stations because of their simplicity [10]. However, these clustering methods are limited by high simulation errors and overlook variations across photovoltaic power stations and inverters. The multi-machine equivalent model can reduce the error by using the clustering method to improve accuracy [11]. Earlier multi-machine equivalence studies in [12,13] mostly used meteorological parameters as core grouping indicators. However, these multi-machine equivalent models cannot fully reflect the dynamic characteristics. The output characteristics of PV generation depend to a large extent on inverter parameters and control. Therefore, other studies like [14] have used inverter parameters and dynamic response characteristics as grouping indicators. In [15], the impulse–response feature distance of an inverter controller is utilized to group PV units more scientifically. In [16,17], the inverter features determined by distances weighted by parameter sensitivity are used as a central clustering index. In [18], the transfer function of a PV grid integration inverter is combined with control parameters to construct an equivalent cluster characteristic. In [19], an infinite busbar-based effective impedance clustering method is proposed for inverters; moreover, an aggregate dynamic model is established for each cluster to retain the structure and order of the state space model of each inverter. In [11], the dynamic interconnection point voltage and effective admittance matrix are selected as the clustering indicators and weighted; an aggregate model of the distributed PV system based on the interconnection point voltage and inverter type is proposed, and the equivalent power characteristics before and after aggregation are achieved. However, differences in the dynamic behaviors among individual PV units caused by the passive filter parameters of inverters are neglected. To fill this research gap, a set of clustering indicators, including filter characteristics, is established in this paper.
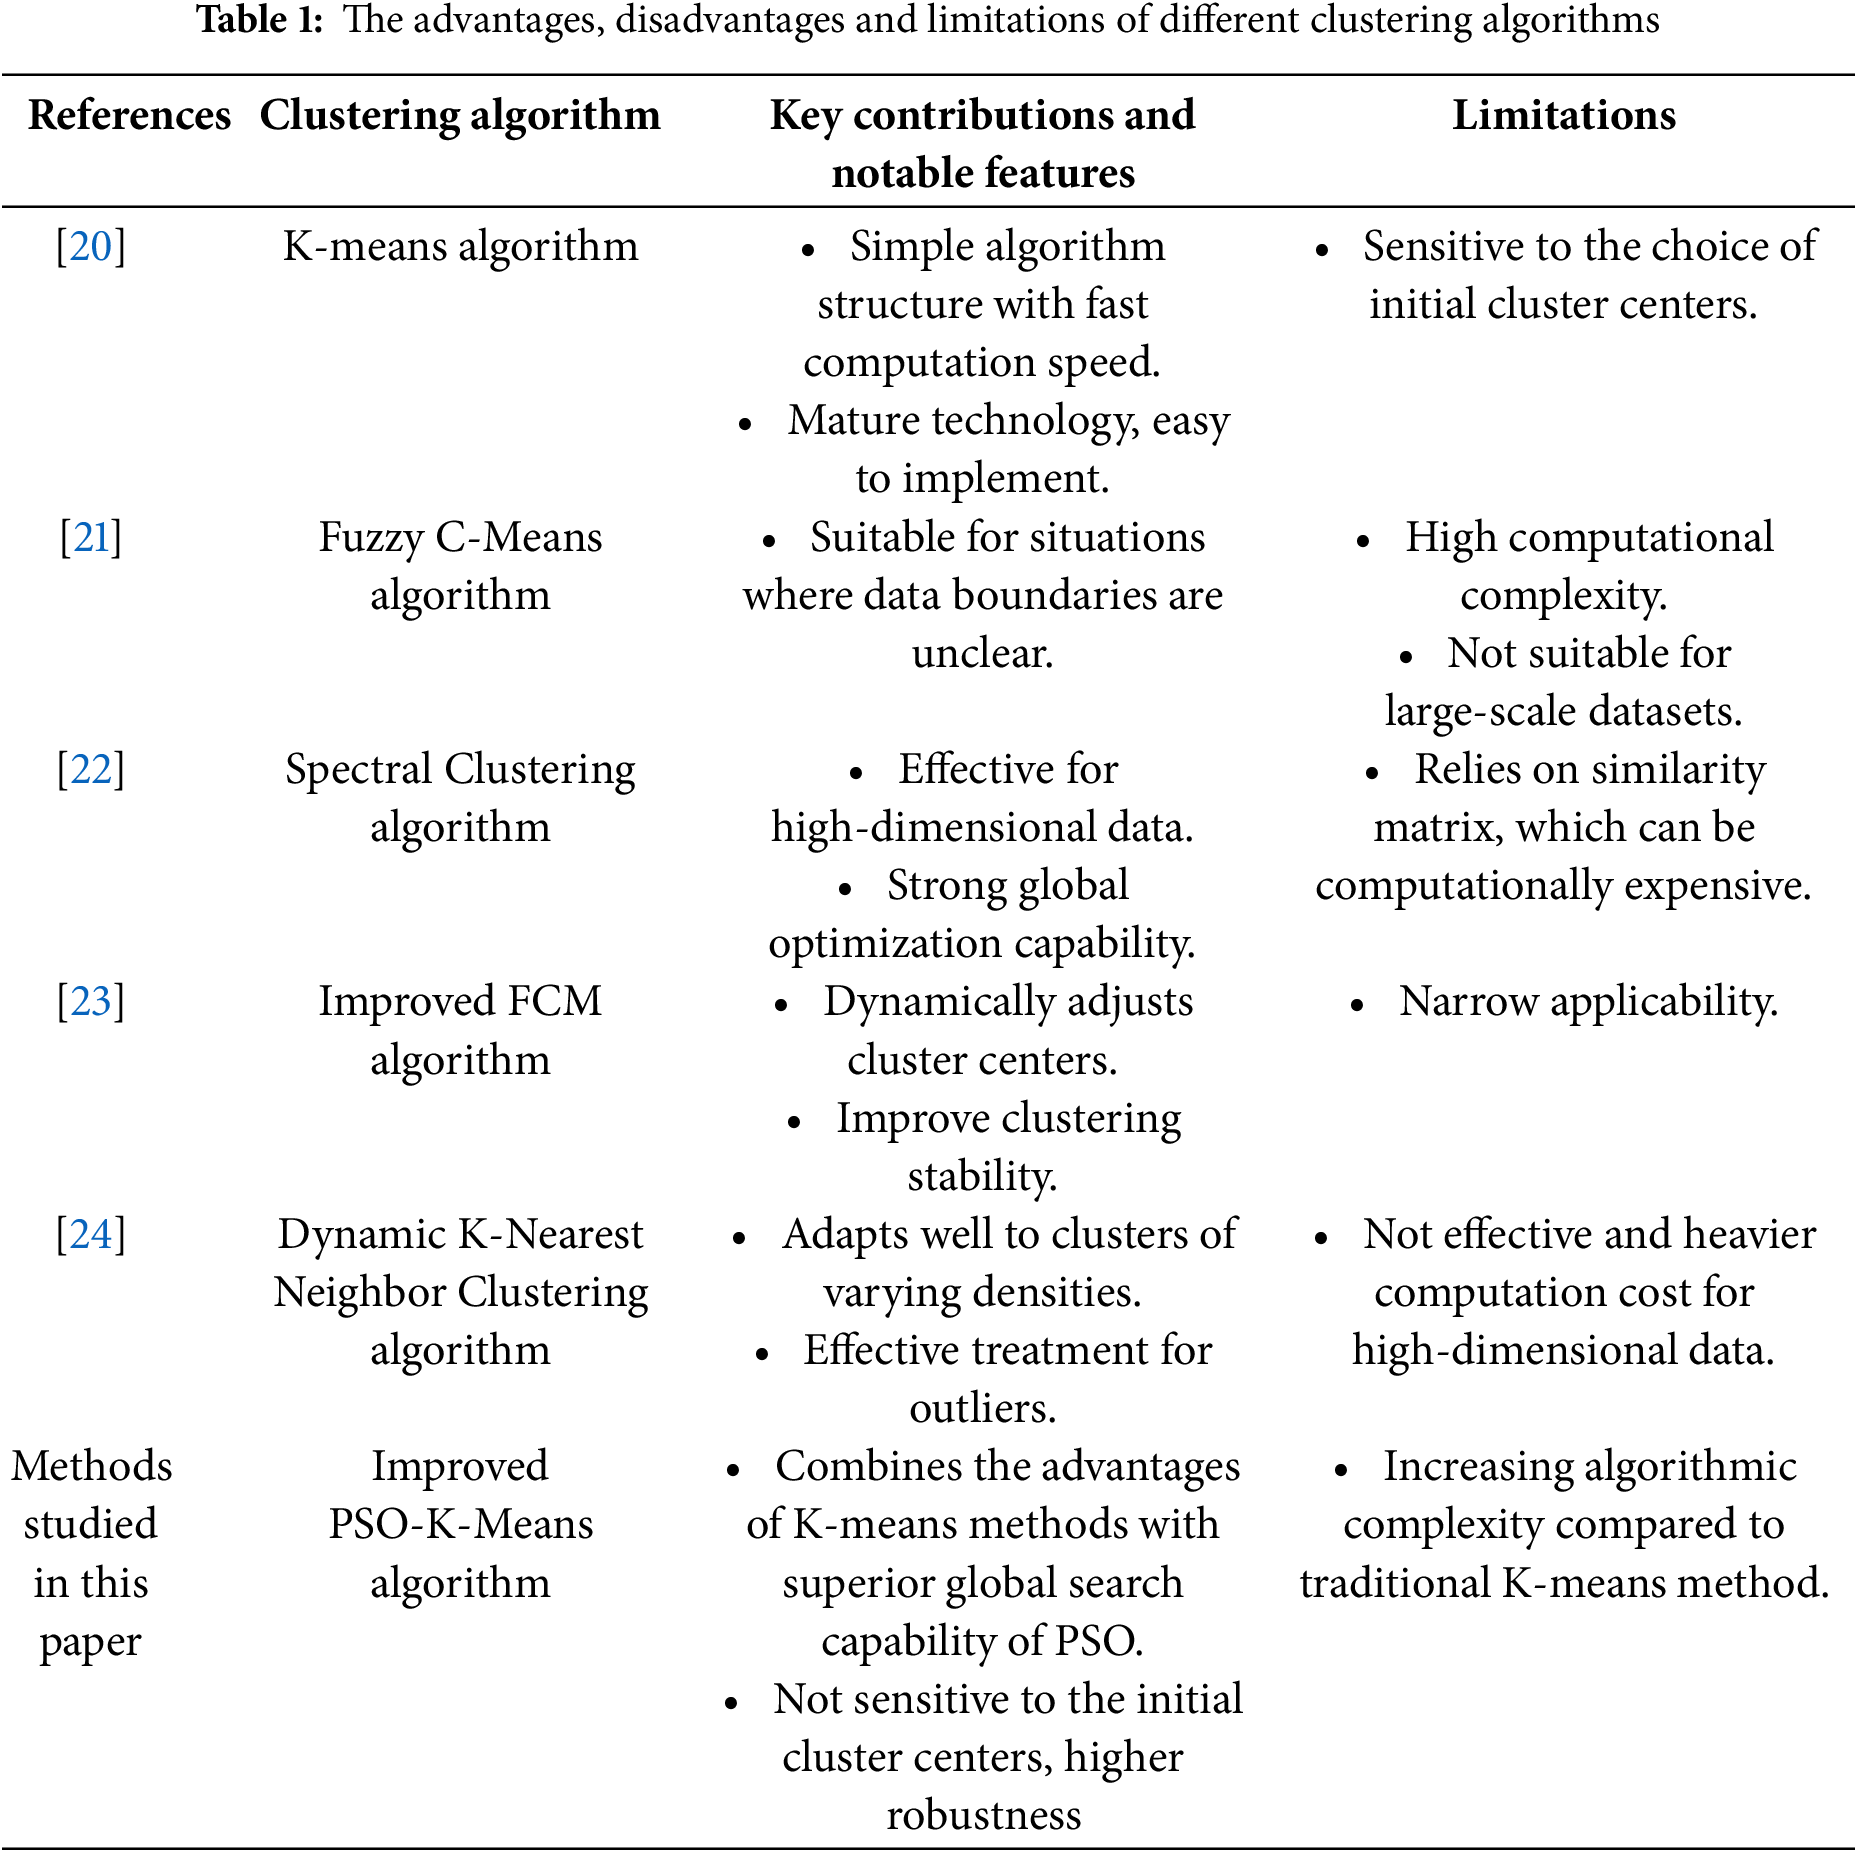
Once the clustering index is determined, the objects with similar characteristics can be grouped into one class via a clustering algorithm for the purpose of obtaining a simplified equivalent model that maintains the key dynamic characteristics with reduced computational complexity and acceptable tolerance. Widely used clustering algorithms include K-means clustering (KMC) [20], fuzzy clustering [21], and spectral clustering [22]. These algorithms can effectively process multi-dimensional data and perform clustering by measuring the feature distance between data points. However, traditional clustering algorithms are easily affected by the data type, isolated data points, and edge data points, which lead to the clustering results converging to local optima easily. To overcome the shortcomings of traditional clustering algorithms, researchers have developed a variety of improved algorithms, such as improved fuzzy C-means (FCM) clustering [18] and dynamic K-nearest neighbor clustering [23]. These algorithms are more efficient and accurate when processing large-scale new energy power station data and can effectively avoid falling into a local optimum. In Literature [24], a real-time distributed clustering algorithm is proposed that meets the energy capacity requirements of a large virtual power station by automatically adjusting the clustering algorithm parameters. The advantages, disadvantages and limitations of different clustering algorithms are summarized and listed in Table 1. In [25], an aggregate dynamic clustered model is introduced by employing Hamilton’s coherency algorithm to group solar PV power stations with similar dynamic features, followed by parameter aggregation for each group of solar PV power stations. Reference [26] proposes a stable-membership-based auto-tuning multi-peak clustering algorithm (SMMP) based on stable membership degrees, which achieves non-iterative complex shape clustering through boundary connection measures and automatically determines the optimal number of clusters. However, its density-driven subcluster generation mechanism is difficult to map to filter physical parameters, and the prototype centers lack circuit characteristic interpretability, making it difficult to apply in photovoltaic power station modelling.
A PV inverter is usually composed of a voltage source inverter circuit and a passive filter. The passive filter is usually structured as a single L, LCL, or LLCL configuration. These circuits have their own advantages. Currently, the LCL structure is commonly used in industry [27]. However, previous multi-machine equivalent studies have paid less attention to the effect of passive filters in a PV inverter on the equivalent model. Therefore, the modeling results are inaccurate. The design method of an LCL filter is complicated and the parameters can be different. If the LCL filter parameters are included in the clustering algorithm during the modeling process, the determination of cluster centers could be inaccurate, thus the modeling accuracy could be affected. To solve this problem, the clustering algorithm needs to be improved. When optimizing clustering methods, the advantages of the PSO algorithm can be embedded into the K-means clustering process to overcome the initial point selection issue. The particle swarm optimization (PSO) algorithm was first proposed by James Kennedy and Russell Eberhart [28,29]. It is believed to be one evolutionary computation technology that treats the habitat as the possible solution locations in the problem space. Through cooperation and information sharing among the particles, the historical optimal locations of both individual particles and the group influence the movement of the particles, which is helpful for finding the optimization in a complex solution space. The authors Ahmadyfard and Modares are the first two researchers to propose a PSO- and KMC-based clustering algorithm [30]. In the initial stage of the optimization process, the PSO algorithm is used for global search, and the KMC algorithm is used to converge to the optimal solution faster when approaching the global optimum. In [31], an improved clustering algorithm that combines PSO with KMC is proposed, which dynamically adjusts weights through global search and local optimization to avoid premature convergence, eliminate dependence on the initial center, and achieve a globally optimal clustering result. Reference [32] proposes a hybrid PSO-KMC algorithm, which uses the Gaussian distribution estimation method to assist PSO in updating population information and uses Lévy flight to escape the local optimum. For another aspect, accurate data processing is also critical for power management and metering of photovoltaic systems.
To address issues such as local optima and slow convergence within the clustering process of equivalent modeling, this paper modifies the K-means algorithm via particle swarm optimization to construct an equivalent model for PV power stations. Moreover, during the modeling process, the characteristics of the passive filters embedded in the PV inverters are thoroughly considered for the first time to make the clustering results more accurate than those of the traditional algorithm. In the proposed method, the parameter set used to characterize the external characteristics of the filters is defined and included in the equivalent grouping index, and PSO and KMC are combined to reduce the number of iterations, accelerate the convergence speed, and process larger-scale data more efficiently. The main contributions of this paper are listed as below: (1). A PV power station equivalent modeling method based on the PSO-K-Means algorithm is proposed, which improves the clustering accuracy and robustness. (2) In equivalent modeling, inverter filter parameters are introduced as clustering indicators to make clustering more scientific in order to improve the accuracy and reliability of the equivalent model. (3) Through executing detailed modeling and simulation analysis, the applicability of the proposed method under different working conditions is demonstrated and verified.
The main contribution of this paper is to establish an accurate multi-machine equivalent model for PV stations. The model construction is based on the PSO-K-Means clustering algorithm and equivalent calculation definitions depicted in Section 4. The rest of this paper is organized as follows. In Section 2, the basic architecture of the PV power station is introduced. In Section 3, the principle and control of the grid-tied PV inverter circuit are introduced. In Section 4, the clustering indicators and equivalent modeling method are constructed. In Section 5, a calculation example is given, and a simulation validation is performed. Section 6 finally presents the conclusions of this paper.
2 Structural Description of the PV Station
The basic architecture and electrical collection system of the PV power station studied in this paper are shown in Fig. 1, which is composed of 40 groups of PV generation units. Taking the #01 PV generation unit as an example, this unit has a rated capacity of 500 kW and is composed of a PV array and a PV inverter. The PV array is composed of several PV cells connected in series and parallel to increase the output power. After DC–AC conversion through the inverter, the electric energy generated by the PV array is connected to the low voltage side (380 V) of the transformer, whose rated capacity is 500 kVA and then connected to a 35 kV collector line. The collector lines are of different lengths and have different impedances. To ensure the accuracy of analysis results, the impedance of the collector line cannot be ignored in this study and is equivalent to a resistance–inductance circuit. Each collector line is connected with eight PV generation units and the power station has five collector lines with the same structure. The voltage is stepped up at the point of common coupling (PCC) by the main transformer of power station. Meanwhile, the current is injected into the upper-level 110 kV grid. In addition, there are a small number of station electrical loads and reactive power compensation devices in the PV the power station.
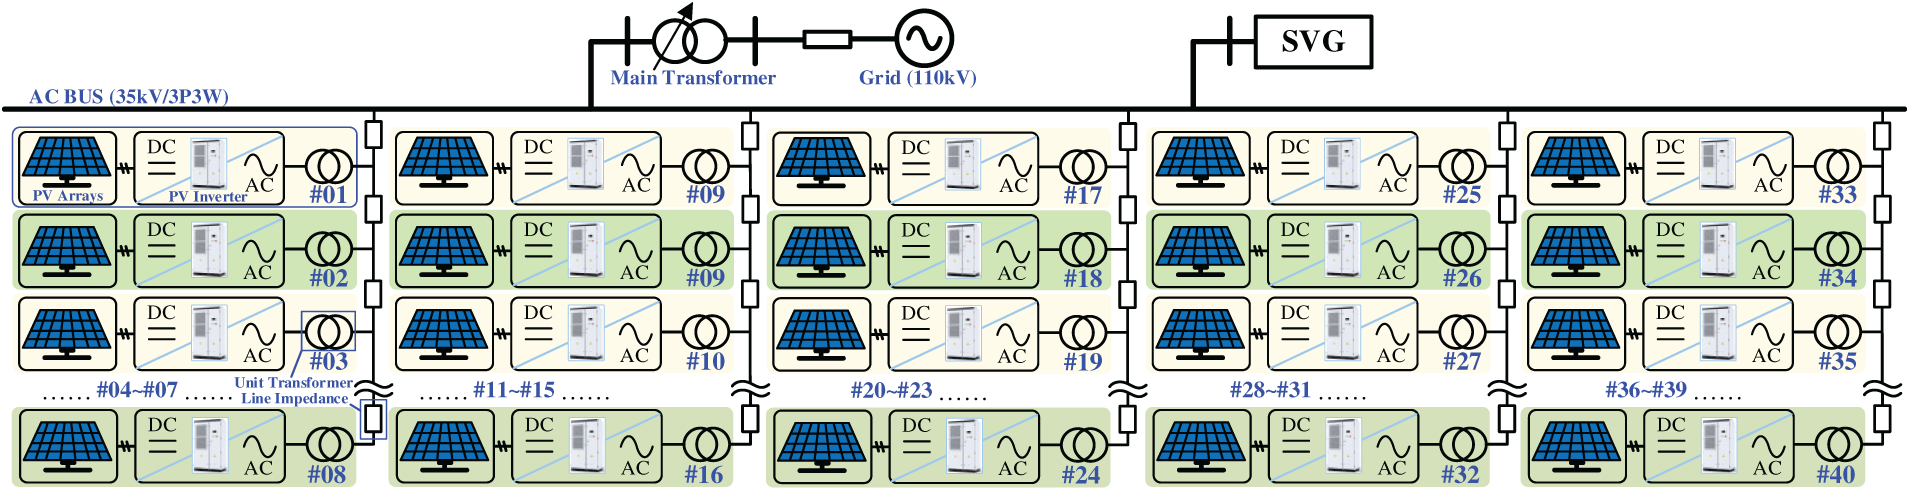
Figure 1: Fundamental topology and configuration of the PV station
3 Basic Component Modeling of the PV Station
The mechanistic model of PV cells involves semiconductor physics theories and can accurately describe the relationships of photo-generated current, dark current, and diode current with light intensity, temperature and other factors. However, the mechanism model is too complicated to be solved. Therefore, this paper uses an engineering practical model [33] to describe the volt–current characteristics. On the other hand, a single PV cell usually has a small capacity. In order to achieve high power ratings, several PV cells need to be connected in series and parallel to form a PV array. After an appropriate scale-up, the PV cell model can be used to characterize the output feature of the PV array.
Fig. 2 depicts a typical voltage–current characteristic curve of PV array. Under constant illumination, the output voltage UPV of the PV array decreases with increasing output current IPV. Under rated operating point, the array’s output voltage when the load is open-circuit is denoted as Uoc, and the array output current when the load is short-circuited is denoted as Isc. Regardless of whether the load is open or short-circuit, the output power of the array is equal to zero. Therefore, there must be a maximum power point (MPP). Under the rated operating point, the specific expression of the voltage–current characteristics of the PV array with Ns in series and Np in parallel (Ns and Np refer to the number of PV cell units connected in series and in parallel in the PV array, respectively) is as follows:
where the expressions for the coefficients C1 and C2 are:
where Im represents the MPP current and Um represents the MPP voltage. When illumination intensity and temperature change, Im, Um and Uoc also change, thus forming multiple sets of curves with similar shapes but different values from the rated curve. Therefore, the parameters need to be adjusted according to environmental conditions, such as illumination and temperature. The corresponding calculation formulas are as follows:
where coefficients a, b and c are the corresponding correction factors for the PV array, and Sr and Tr represent the light intensity and temperature corresponding to the rated working conditions of the PV array, respectively.
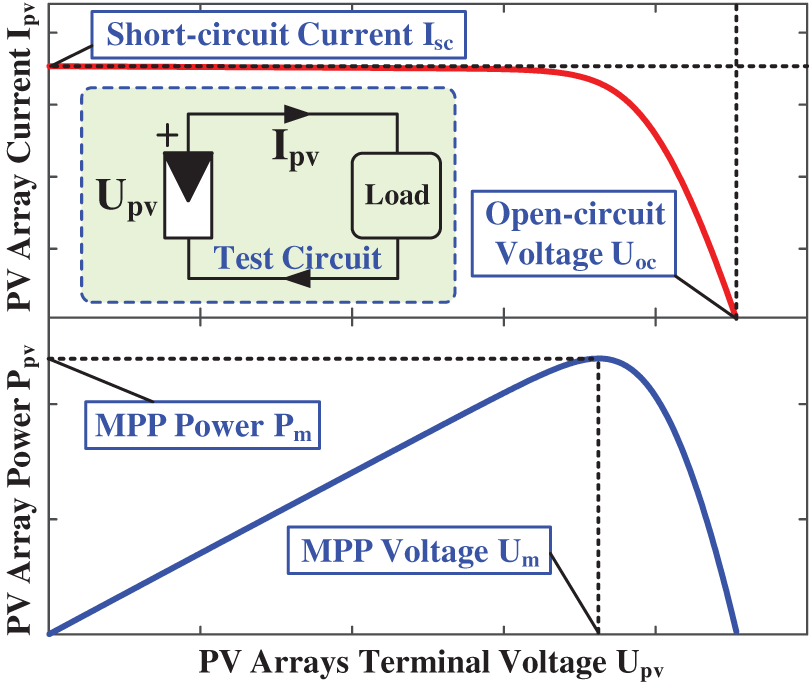
Figure 2: Typical output characteristics of PV arrays under-rated circumstances
3.2 Control Loop and Average Modeling of the Grid-Tied PV Inverter
The PV inverter serves as a critical component within photovoltaic power generation systems. It facilitates the transformation of DC electricity generated by photovoltaic modules into AC power that complies with grid code requirements for grid-connected operation. Also, it is the implementation carrier of the MPPT algorithm, and its control determines the output power quality and operational stability of the PV generation system. In this study, the main circuit of the PV inverter mainly includes a three-phase two-level voltage source converter (VSC) and an LCL filter. The former is responsible for realizing the DC–AC conversion of electric energy, and the latter is responsible for filtering out the switching frequency harmonics generated by the converter circuit. The PV inverter control strategy adopts dual closed-loop DC control based on the voltage outer loop and the current inner loop. The voltage Upv* calculated by the MPP tracking (MPPT) control strategy in the outer voltage loop is used as the DC-side voltage reference value. The DC bus voltage is sampled in real time, and the negative feedback control is realized through a proportional–integral regulator. The current inner loop is implemented in the dq rotating coordinate system. The output of the voltage outer loop regulator is used as the d-axis current reference value. The reactive power is regulated by the q-axis current, which is usually set to zero to ensure operation with a unit power factor. When a voltage sag occurs, the low-voltage ride-through (LVRT) module takes effect so that the angle θ required for the rotational transformation is obtained from a typical three-phase digital phase-locked loop. Since the d-axis is oriented in the direction of the grid voltage vector, ugq can be considered to be precisely equal to zero. In summary, the overall circuit and control block diagram of a grid-tied PV inverter are shown in Fig. 3.
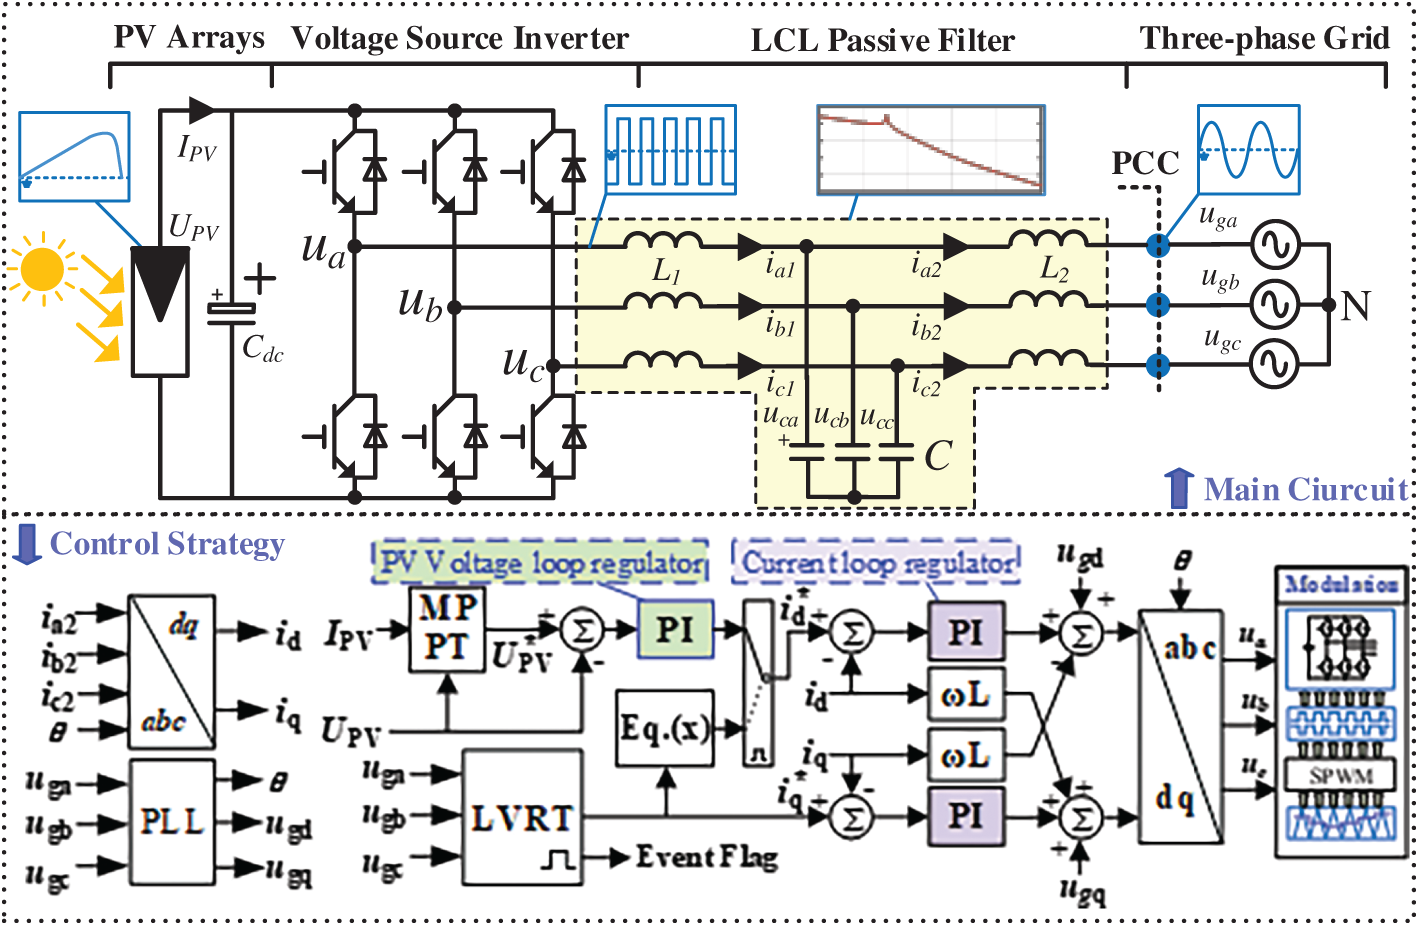
Figure 3: Block diagram of the grid-tied PV inverter
In the diagram, the proportional–integral regulators of the voltage loop and the current loop are the control cores. The transfer function and output of the voltage loop PI regulator can be expressed as
Similarly, the transfer function expressions for the current loop PI regulator and the output dq-axis voltage of control strategy are as follows:
kp1, ki1, kp2, and ki2 represent the proportional and integral coefficients of the corresponding regulators; they have a great influence on the external characteristics of the PV generation system and are considered in the clustering process in this study. On the other hand, the implementation of a comprehensive switching model that accounts for the transient behavior of semiconductor devices in computational modeling and simulation methodologies may result in a substantial escalation of computational demands, thereby rendering the simulation execution speed insufficient to adhere to the specified performance benchmarks. Therefore, a grid-tied PV inverter is often simplified to an average model. To achieve this goal, the output of the VSC can be equivalent to three controlled voltage sources, and the terminal voltages of the controlled voltage sources (i.e., ua, ub, and uc in Fig. 4) are controlled by the control strategy described in Fig. 3. Evidently, the grid side power Pac is equal to
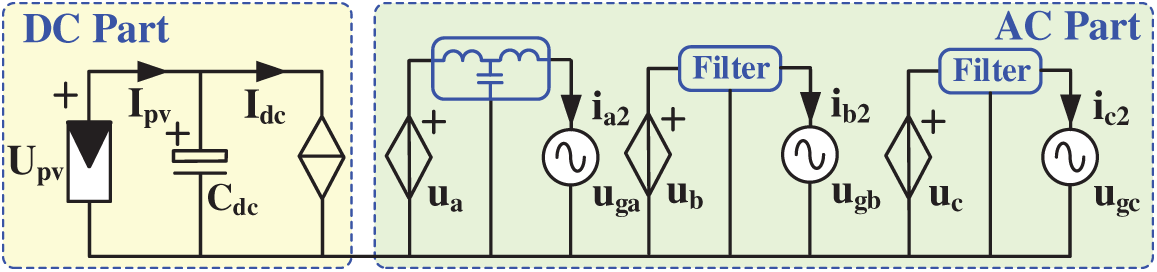
Figure 4: Average model of a single PV inverter
Then, the DC side power Pdc is equal to the AC side Pac by neglecting losses. For the DC side of the PV inverter, the capacitor Cdc is directly connected to the PV array, and its voltage is equal to Upv, allowing the controlled current source current Idc to be equal to the following equation:
Based on Eq. (7), the connection between the AC side and the DC side can be established by connecting the PV array and the controlled current source in parallel to Cdc. The average model used in this paper is shown in Fig. 4. This average model can describe the static/dynamic characteristics for a single PV inverter below the Nyquist frequency by ignoring only the higher-order harmonics introduced by PWM modulation. This simplification can greatly improve its simulation speed.
3.3 Passive Filter Characteristics Analysis
The circuit structure and filtering principles for the passive filter used in the PV inverter are shown in Fig. 5. This filter is a typical third-order filter. Each phase is composed of two inductors and one capacitor. The inductor can block the higher-order harmonics generated by power semiconductor switches in the VSC. Moreover, the capacitor can act as a bypass so that the high-frequency current ripples can flow through the low impedance branch back to the neutral point and cancel each other out. On the other hand, to prevent abnormal amplification or even the instability of harmonics caused by the series resonance between the inductor and capacitor, a damping resistor is usually inserted in the capacitor branch. Although the damping resistor can suppress the resonance, it could also cause extra loss. Therefore, the value of the damping resistor is generally low to ensure the efficiency of the whole system.
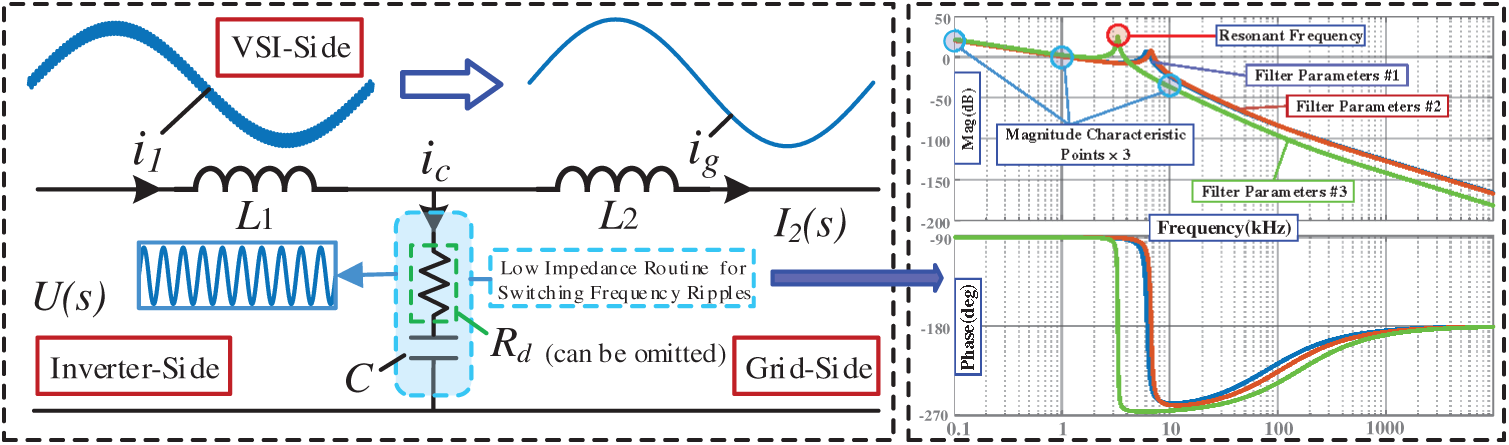
Figure 5: Filtering principle and bode diagram of passive filters equipped with PV inverters
To quantitatively analyze the filtering effect of the LCL filter, the transfer function I2(s)/U(s) of the grid-side current to the VSC’s output voltage is obtained using the Laplace transform, and its expression is as follows:
Based on Eq. (8) and typical parameters of the filter, a frequency sweep by setting s = jω is performed to obtain its Bode plot from I2 (jω) to U(jω) as shown in Fig. 5, which confirms that the filter has a better rejection ratio in the high-frequency band. Literature [34] introduces an engineering design method of LCL filters, determining parameters such as cut-off frequency, damping, and harmonic attenuation based on grid voltage quality requirements and inverter switching frequency. Assume that there are three different sets of passive filter parameters as follows: (#1) L1 = 100 µH; L2 = 50 µH; C = 20 µF; (#2) L1 = 75 µH; L2 = 75 µH; C = 15 µF; and (#3) L1 = 100 µH; L2 = 30 µH; C = 100 µF. A comparison of the amplitude–frequency curves of the grid-side current vs. the inverter-side voltage under two different sets of parameters (#1 and #3) reveals that different filter parameters strongly influence the amplitude–frequency characteristics. However, similar filtering characteristics can be obtained with different parameters. The #1 and #2 curves are compared as an example. Although the parameters are quite different, the filtering effects obtained by the two curves are actually similar. In general, owing to the overlapping roles of the inductor and the capacitor, there is a certain degree of freedom in the adjustment of parameters, and the design criteria are changeable. As a result, there are large differences among PV inverters from different manufacturers. Therefore, in the subsequent clustering algorithm, it is not advisable to group based only on parameters such as L1, L2, and C. It is better to perform clustering based on the amplitude–frequency characteristics of the filters. To achieve this goal, three typical values are selected to describe the filtering characteristics, and the selected frequencies are 100 Hz, 1 and 10 kHz. In addition, Eq. (8) shows that there is a pair of conjugate poles near the imaginary axis in the transfer function G0, which represent the inherent resonant nature of the LCL filter and generate a resonant peak in the Bode plot. Apparently, the position of the resonant peak also affects the overall filter characteristics. The resonant frequency of the LCL filter can be calculated according to the following equation:
3.4 Maximum Power Point Tracking Strategy
As mentioned in the previous section, the output of the PV array varies greatly under different output voltages and currents, showing nonlinear characteristics, and the volt–ampere characteristic curve is also related to the illumination intensity and temperature. To improve the efficiency of solar energy conversion and utilization, the MPPT control strategy needs to be introduced to keep the PV array operating at the MPP [35]. In this study, MPPT control of a PV array is realized on the basis of an improved observation method with variable step size disturbance. The basic principle is as follows: A small disturbance is applied to the output voltage of the PV array, and the variation in the output power is observed. If the output power at time t increases compared to the value at time t − 1, the direction of the disturbance is correct, and the disturbance continues to be applied in this direction with step size Ust. If the output power at time t decreases compared to the value at time t − 1, then the direction of the disturbance should be changed. Repeating this process continuously can make the output voltage of the PV array gradually approach the voltage corresponding to the MPP. In this process, the disturbance step size can be reasonably corrected based on the differences between the power and voltage at time t and time t − 1. When the current operating point is far from the MPP, a large step size is used for fast approximation. When the current operating point is close to the MPP, the disturbance step size is reduced to improve tracking accuracy and reduce chattering. In summary, Fig. 6 shows the specific process of the MPPT algorithm:
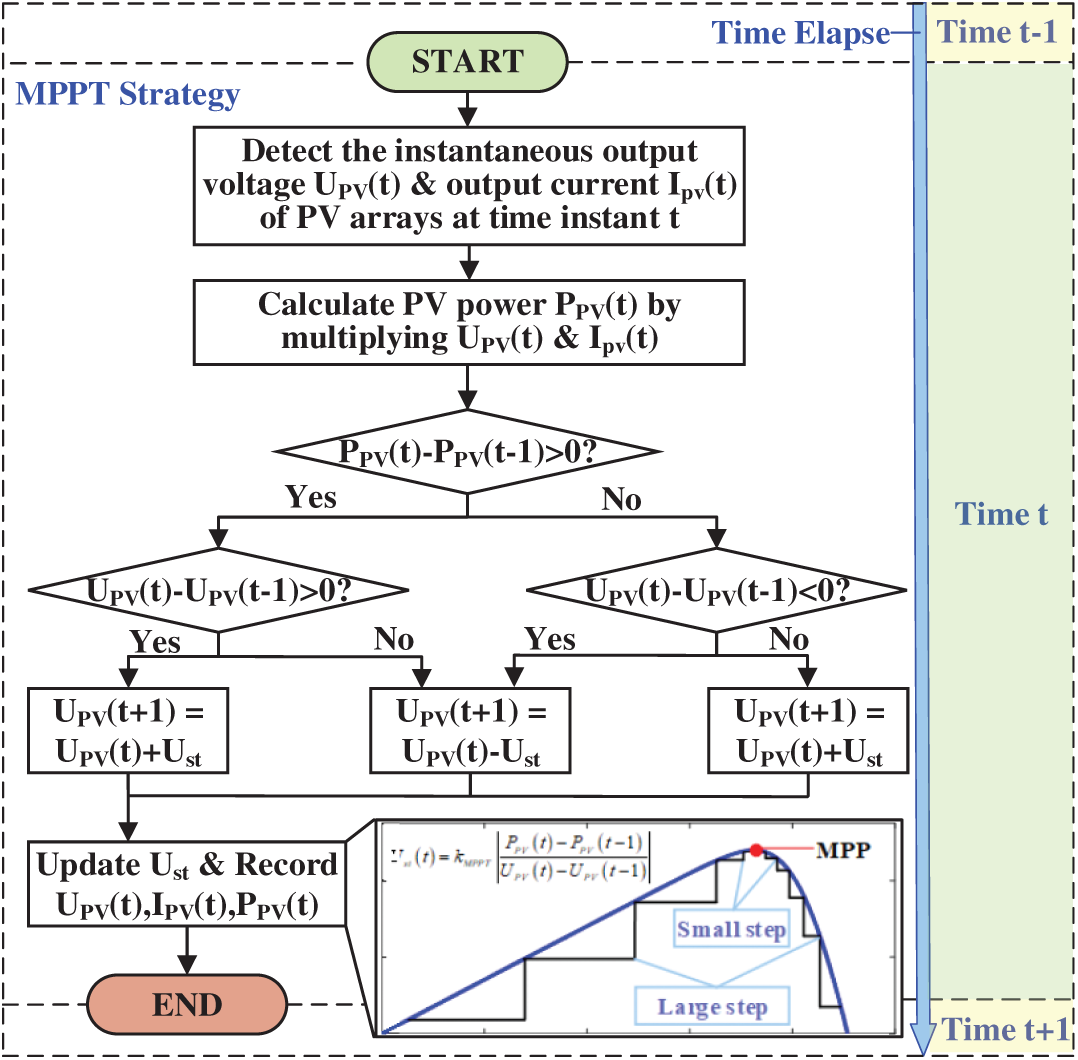
Figure 6: Flowchart of maximum power point tracking strategy
Where the dynamically adjustable disturbance step size Ust can be obtained according to the following equation:
where kMPPT represents an adjustable control coefficient to adjust the sensitivity of the algorithm. The DC voltage reference Upv* calculated via the MPPT algorithm is subsequently sent to the input of the DC voltage outer loop shown in Fig. 3. After dual closed-loop control, the actual output voltage of the PV array can be kept equal to the MPP voltage, so as to achieve the maximum power output of the PV array.
3.5 Low-Voltage Ride-through Strategy with Reactive Power Adjustment
As the crucial power generation equipment in a PV power station, the PV inverter should keep connecting to the grid when the grid voltage drops and generate reactive power to provide voltage support for the power system. This function is implemented by the LVRT module shown in Fig. 7. Under normal operation, the PV inverter adopts the dual closed-loop control strategy of the voltage outer loop and the current inner loop. At this time, id* is obtained from the output of the voltage loop, and iq* is usually set to zero to ensure the unit power factor operation of the PV inverter. When a short circuit fault occurs on the grid side, resulting in a large drop in the voltage at the PCC, the LVRT module could play a role and trigger the event flag to force the PV inverter to switch into LVRT mode. To determine whether a voltage sag occurs, the complex vector Ug can be defined as
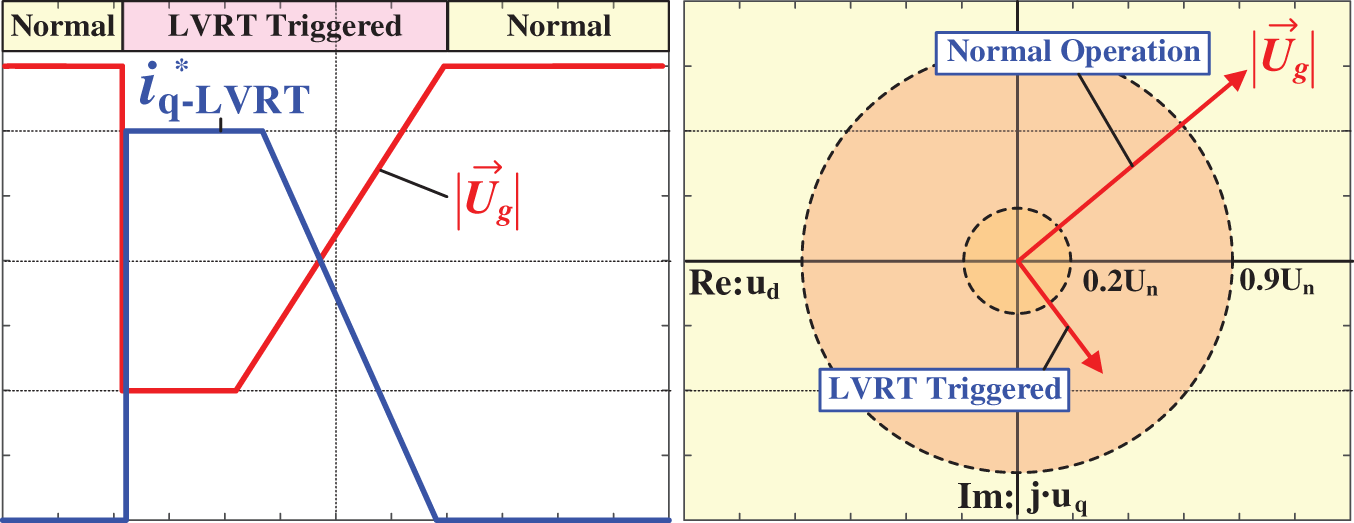
Figure 7: Criteria for voltage sag judgment and operating principle of PV inverters during low-voltage ride-through events
According to the invariant inner product feature under different coordinate systems, the mathematical relationships between the Ug modulus and uga, ugb and ugc can be further derived, and the modulus of this complex vector can characterize the comprehensive sag of the three-phase voltage. Generally, the trigger threshold can be set at 90% of the rated voltage. |Ug| < 0.9 Un indicates the occurrence of an LVRT event. At this moment, the PV inverter enters LVRT operating condition, and the given iq* is no longer zero. Meanwhile, the given id* is no longer sourced from the output of the voltage loop. The corresponding LVRT control strategy is provided by the following equations:
where kq1 and kq2 are adjustable coefficients. In summary, as shown in Fig. 7, when a typical voltage sags under this control strategy, the reactive current of the PV inverter follows the blue curve in Fig. 7 to assist the recovery of the grid voltage.
4 Equivalent Modeling and Analysis of the PV Power Station
4.1 Analysis of Clustering Indicators
The selection methodology for characteristic parameters entails a comprehensive and meticulous analysis of the operational characteristics of the PV power station. This aims to screen out the key parameters that exert a substantial influence on the dynamic behavior of the power station. These parameters often include, but are not limited to, PV inverter control parameters, PV array output characteristics, voltage and current response characteristics and power fluctuation characteristics. Therefore, this paper selects the DC side capacitance Cdc, the inverter side filter inductances L1 and L2, the proportional gain Kp and the integration coefficient Ki of the voltage outer loop PI regulator as the key indicators for cluster analysis. These parameters exert a significant impact on the dynamic behavior of the PV system. Firstly, the DC-side capacitance Cdc directly affects the stability of the DC voltage and the overall dynamic response of the inverter. It effectively characterizes the stability performance of the PV system when responding to external power disturbances. Secondly, the inductance parameters L1 and L2 have a great impact on the current response characteristics and harmonic suppression capability, and their inclusion in the cluster analysis helps capture the power quality characteristics of the system. Furthermore, the power control strategy implemented in PV systems significantly influences their operational characteristics, particularly with the respect to the determination of control parameters for the voltage outer-loop PI controller. This parameter selection process should be systematically incorporated into clustering analysis parameters to ensure optimal system configuration and performance. By combining these key parameters, cluster analysis can more accurately reflect the dynamic behavior of the PV power station under different operating conditions, thereby improving the accuracy and reliability of the equivalent model. The clustering set K0 is defined by the following equation:
In addition, as established in Section 3.3, the amplitude–frequency curve of the grid side current vs. the inverter side voltage is comprehensively affected by the filter parameters L1, L2 and C. According to the filter parameters, the attenuation ratio at different frequencies can be obtained. Combined with the resonant frequency, this paper defines the set K1 for characterizing the external characteristics of the filter, and K1 is included as the grouping index.
In summary, the clustering indexes used in this paper can be defined as:
4.2 Principle of the PSO-Based KMC Algorithm
In the clustering process of equivalent modeling, the selection of a clustering algorithm has a great impact on the accuracy and rationality of the model. The commonly used clustering methods include the KMC and FCM algorithms. KMC is a distance relationship-based clustering method that assigns data points to the nearest cluster center through iteration. KMC usually converges quickly. It is simple to implement and is suitable for processing datasets with simple structures as reported in [36]. However, KMC is sensitive to the initial center point and easily becomes trapped in a locally optimal solution. Therefore, repeated executions or a combination of optimization methods are usually required to improve the stability. To address this shortcoming, this paper uses the PSO-based KMC algorithm (PSO-K-means) to improve the clustering result. Assuming that an existing one-dimensional n-point dataset S = {S1, S2, …, Sn}, the number of clusters is k, the number of particles is m, the number of PSO iterations is denoted as t, and the clustering steps of PSO–K-means can be expressed as follows:
(1) Initialize the particle parameters ω, c1 and c2; define the upper and lower limits Vmax and Vmin of the initialized particle speed on the basis of the data difference; initialize the upper and lower limits Xmax and Xmin of the particle position according to the maximum and minimum values of the data.
(2) The n data points in S are randomly divided into k clusters, and the mean of each cluster is calculated to generate particles; this process is looped m times to initialize m particles, and each particle contains k cluster centers. The i-th particle is represented as Xi(0) = [Xi1(0), Xi2(0), …, Xik(0)]. The speed and position update rule is as follows:
(3) Fitness quantifies the internal coherence within a particle, where a lower fitness value indicates superior clustering performance in the optimization process. The position of the initial fitness is the individual extremum of the particle, and the smallest fitness among the m particles corresponds to a global extremum G. The fitness formula and the calculation formula of the fitness J(Xi) are defined as follows:
where Cij is the j-th cluster in the i-th particle.
(4) The speed and position of the particles are updated according to Eq. (4), with their upper and lower limits.
(5) According to the nearest neighbor principle, the data are reclassified into clusters near Xi, the new mean is calculated, and the particles are updated.
(6) Repeat step 3) to update the fitness of the i-th particle according to the fitness formula. If the fitness decreases, update Xi(t + 1) and G.
(7) Steps 4, 5, and 6 are repeated until the maximum PSO iterations are reached or the global extremum no longer changes, and the loop stops.
(8) The
(9) Calculate the mean of each cluster, update the new cluster center, and then divide the data into clusters according to the nearest neighbor principle.
(10) When the cluster centers no longer change or the maximum number of iterations is reached, the final clustering result is obtained. In summary, the relevant process is summarized in Fig. 8.
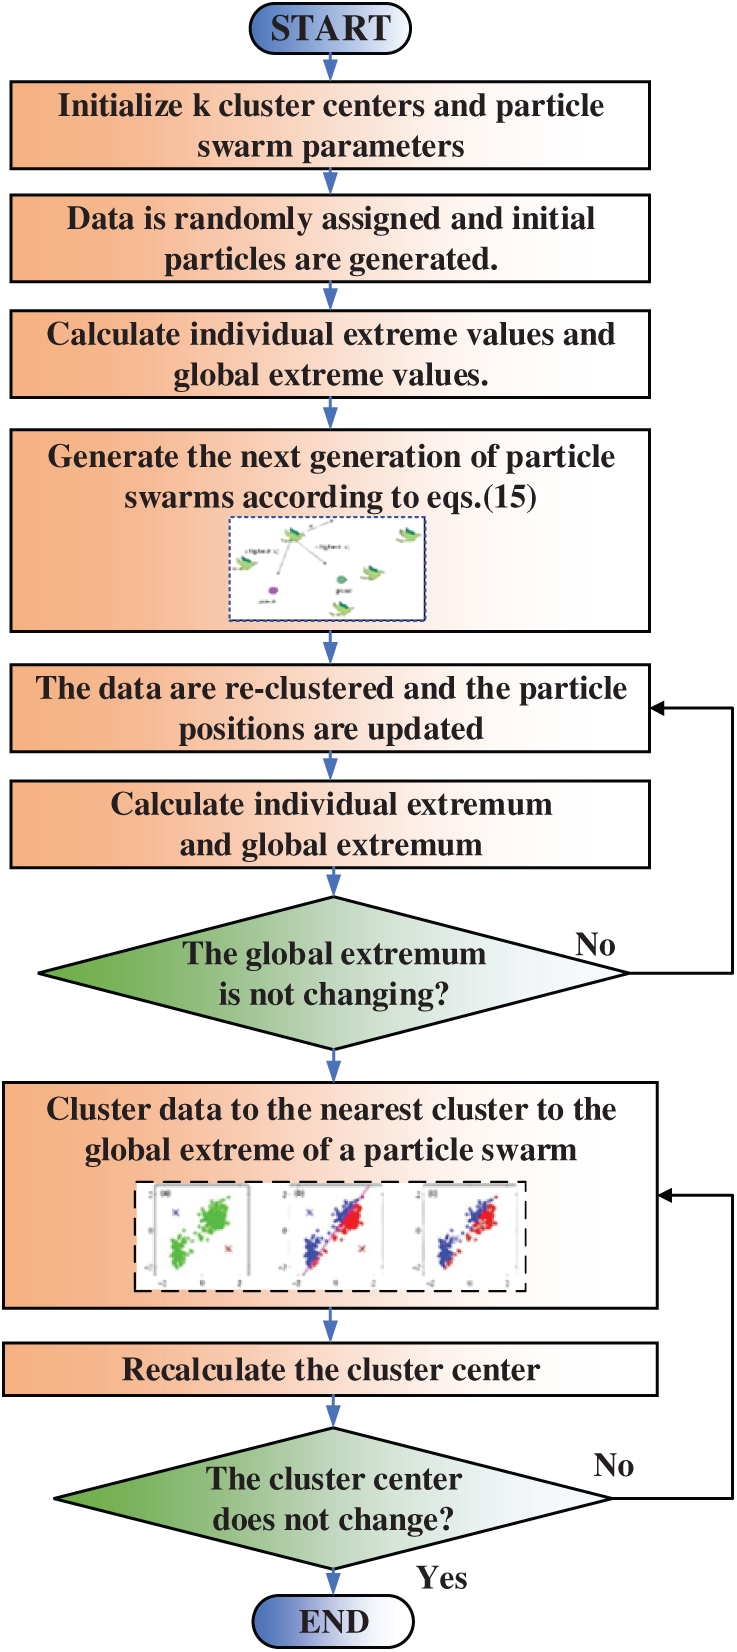
Figure 8: Flowchart of the PSO-K-means algorithm
Fig. 9 compares the clustering effects calculated via the K-means algorithm (in Fig. 9a) and the PSO–K-means algorithm (in Fig. 9b) obtained from the public Iris dataset for an identical set of typical data. Fig. 9a shows that the K-means algorithm divides the data into two clusters, but there is a certain degree of overlap at the cluster boundary, which fails to reflect the real distribution of the data well. In contrast, the PSO–K-means algorithm in Fig. 9b divides the data into three clusters by introducing the PSO algorithm, the distribution of the clusters is more uniform while the boundary is clearer and the location of the cluster center is more reasonable. This comparison fully confirms the superiority of the PSO–K-means algorithm in optimizing cluster centers and processing complex data distributions and can significantly improve the clustering result to avoid the former misleading results.
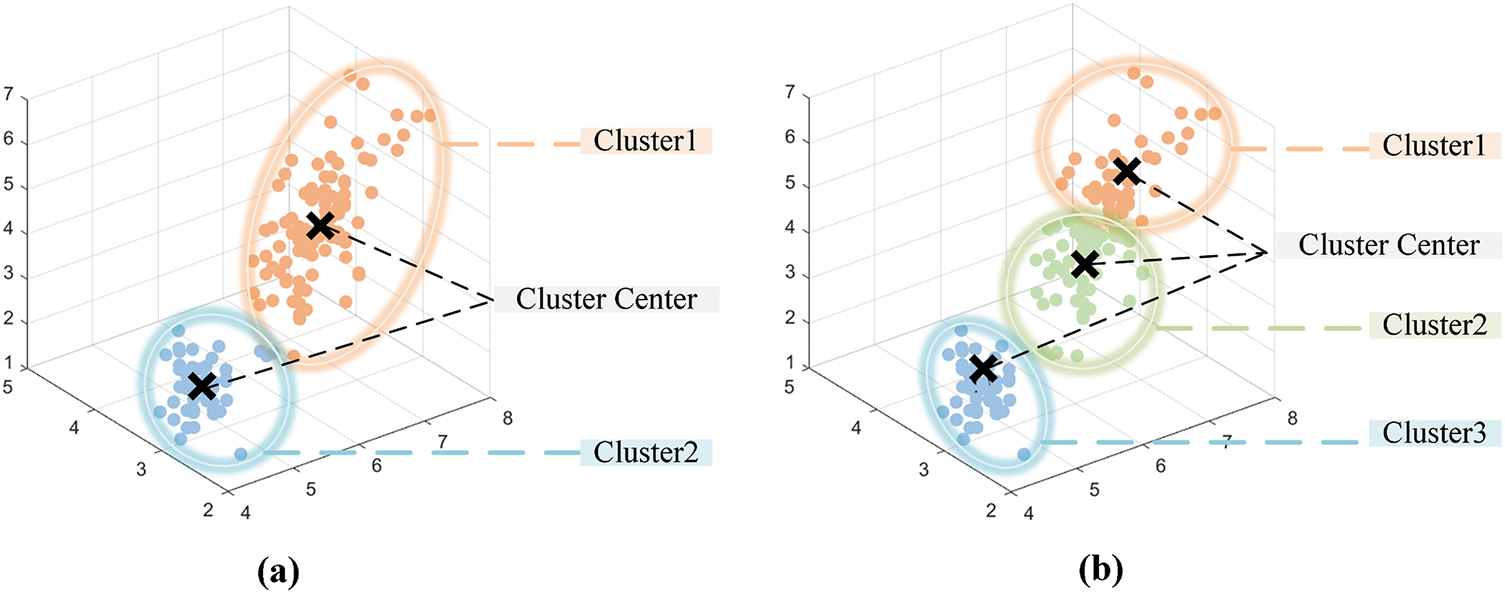
Figure 9: (a) Schematic diagram of the clustering results of the K-means algorithm; (b) Schematic diagram of the clustering results of the PSO-K-means algorithm
4.3 Equivalence Calculation Principle
(1) Equivalence of the PV array parameters: The general principle of equivalent modeling of a PV power station is to keep the output voltage and total power of the equivalent model equal to those of the detailed model. When λ PV generation units are equalized, the output current of the PV array needs to be λ times the original value. That is, the number of parallel-connected cells of the equivalent PV array becomes λ times the original number, whereas the number of series cells remains the same. Nseq and Npeq are the numbers of cells connected in series and parallel to the array in the equivalent model, respectively. Ns and Np represent the number of cells connected in series and parallel to each set of PV arrays in the detailed model, respectively. The specific expressions are as follows:
(2) Equivalence of the PV inverter parameters: To ensure that the dynamic characteristic of the PV inverter remains identical, according to the control equation of the inverter, the parameters of the DC side capacitor, the AC side filter parameters and the control parameters after the equivalence need to satisfy the following expressions:
where Cdceq represents the DC bus capacitance of PV generation unit after being equivalent; Cdc represents the DC bus capacitance of the PV generation unit as the cluster center; Leq represents the filter inductance of the PV generation unit after equivalence; L represents the filter inductance of the PV generation unit as the cluster center; Ceq represents the filter capacitance of the PV generation unit after equivalence; C represents the filter capacitor of the PV generation unit as the cluster center; Kp1eq is the proportional coefficient e of the outer voltage control loop after equivalence; Kp1 is the proportional coefficient of the outer voltage loop of the PV generation unit at the cluster center; Ki1eq is the integral coefficient of the outer voltage control loop after equivalence; Ki1 is the integral coefficient of the outer control voltage loop of the PV generation unit at the cluster center; Kp2eq is the proportional coefficient of the inner current control loop after equivalence; Kp2 is the proportional coefficient of the inner current control loop of the PV generation unit in the cluster center; Ki2eq is the integral coefficient of the inner current control loop after equivalence; Ki2 is the integral coefficient of the inner current control loop of the PV generation unit in the cluster center.
(3) Transformer parameter equivalence: based on the principle that the output power of the transformer remains identical, the total power loss of the equivalent model must be equal to that of the detailed model, thus deducing that the capacity of the equivalent transformer should be the sum of the capacities of all the unit transformers. The capacity of the equivalent unit inverter is the sum of the capacities of all the unit transformers. That is,
where STeq is the capacity of the equivalent unit transformer and ST is the capacity of the single unit transformer. In contrast, the conversion of transformer impedance is:
(4) Equivalence of the collector line: The basic structure of a PV power station can be divided into radial and trunk line types. The structural characteristic of the radial PV grid-connected architecture manifests in the exclusive interconnection of power generation units to grid integration nodes via dedicated collector feeders. This topological configuration features a streamlined arrangement while permitting direct lumped parameter equivalence analysis of system components. In the trunk line type topology, each PV generation unit is connected to the right-side of the previous generation unit in turn through the line impedance. Since the structure is relatively complicated, the topology structure needs to be transformed before the collector line parameters are equated. Fig. 10 shows the overall process of the equivalent calculation.
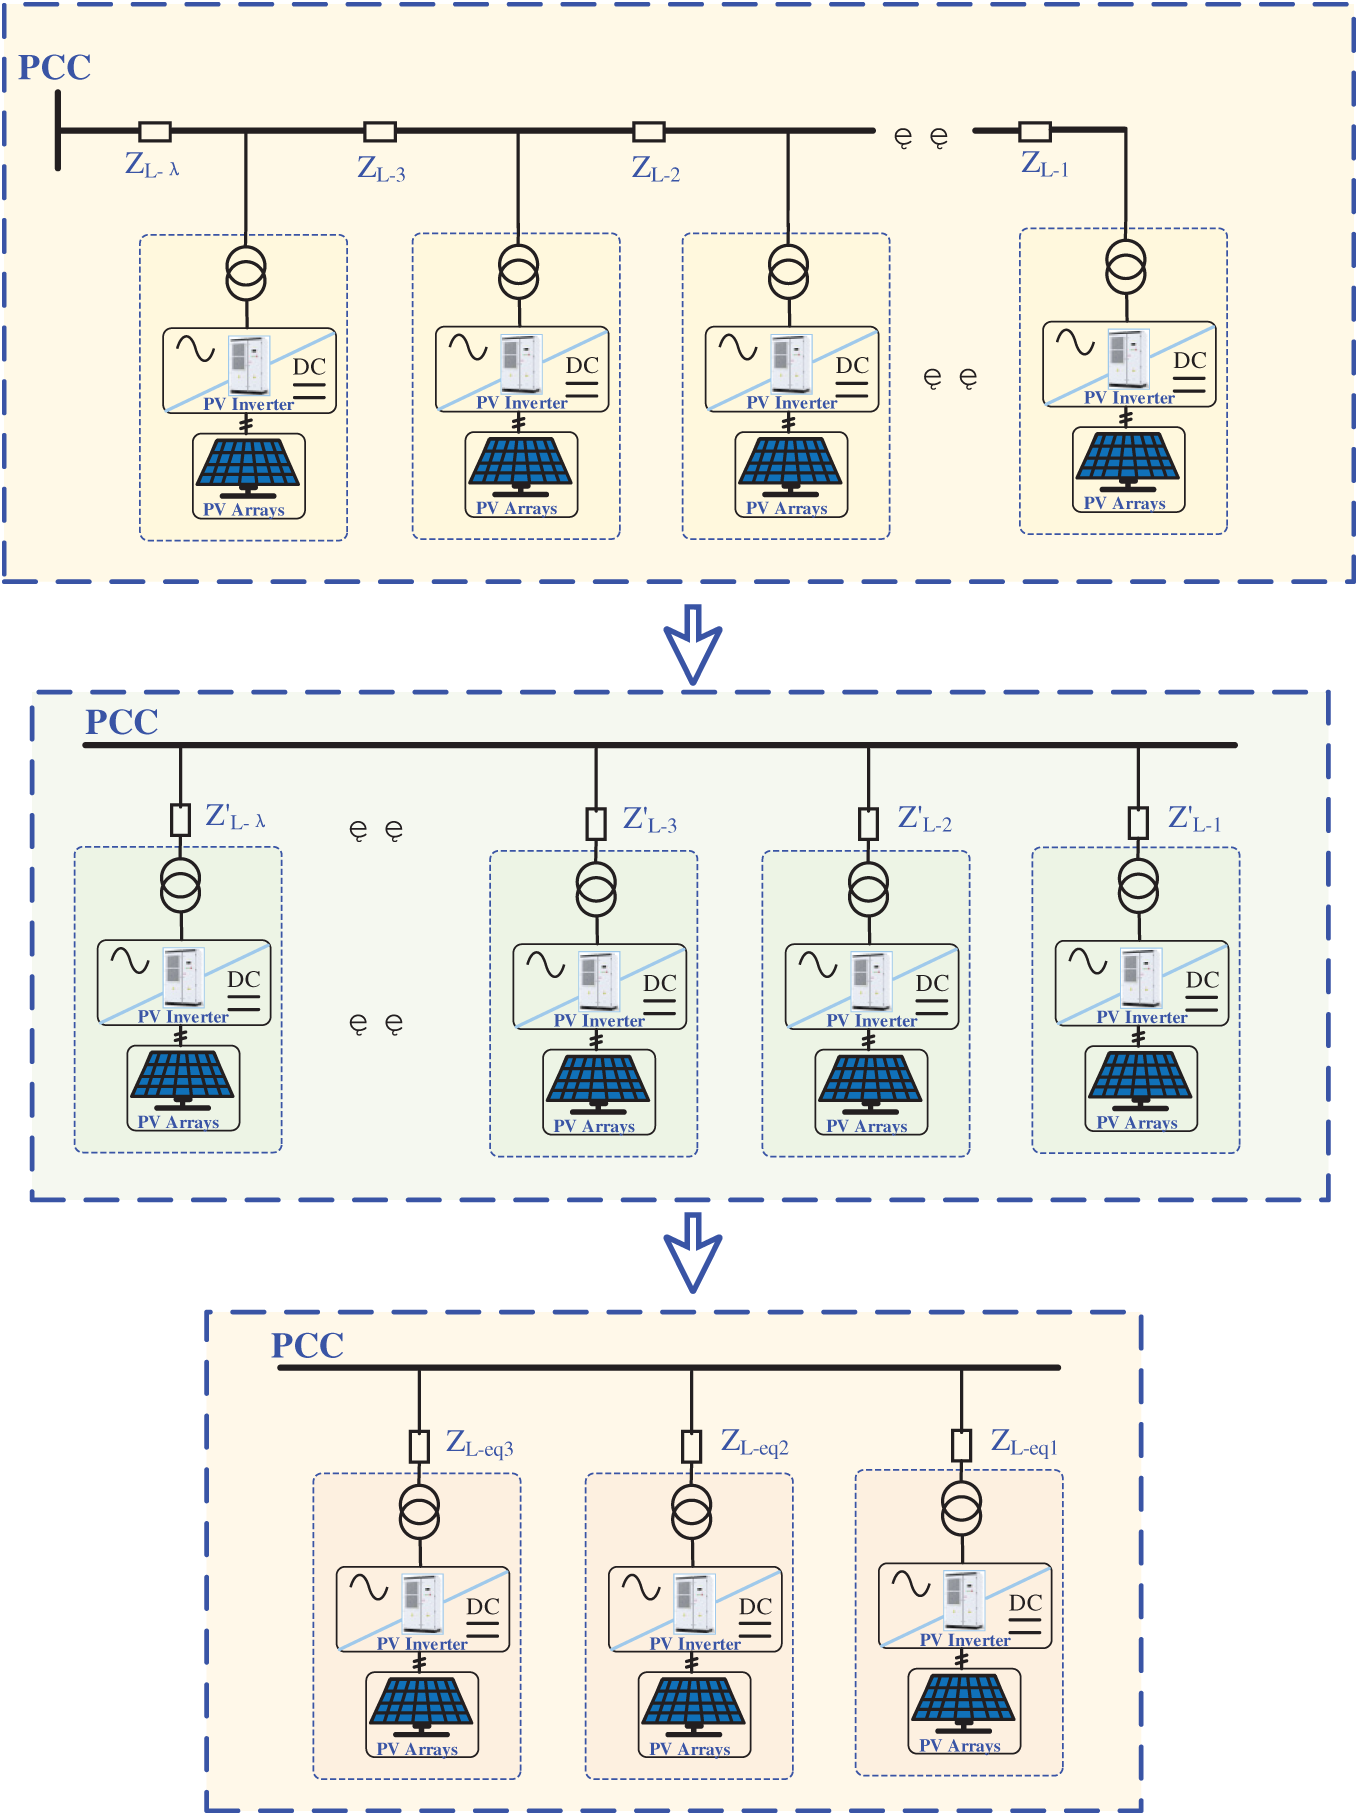
Figure 10: Schematic diagram of the equivalent process of collector line impedance
To simplify various grid structures, the collector lines are usually converted to a simple and radial topology in equivalent modeling. When multiple trunk lines cross, the grid structure must first be converted to a pure parallel structure, and then the equivalent impedance should be calculated based on the summation principle of the loss of each branch. Under the premise of maintaining the same impedance loss before and after equivalence, the equivalent impedance of the trunk line collector line is used to obtain the equivalent impedance of the corresponding radial structure, as shown in Eq. (22):
where ZL_i represents the main impedance; ZL_j represents the radial impedance; Pk represents the active power flowing through impedance ZL_j. After all the trunk line impedances are converted to radial impedances via Eq. (22), they are then equivalent using the power loss method. Using PL_i to represent the active power flowing through impedance ZL_i, the expression of the equivalent impedance ZL_eq of the collector line within the equivalent model is as follows:
5 Numerical Example Validation and Result Analysis
5.1 Validation of the Single-Machine Average Model
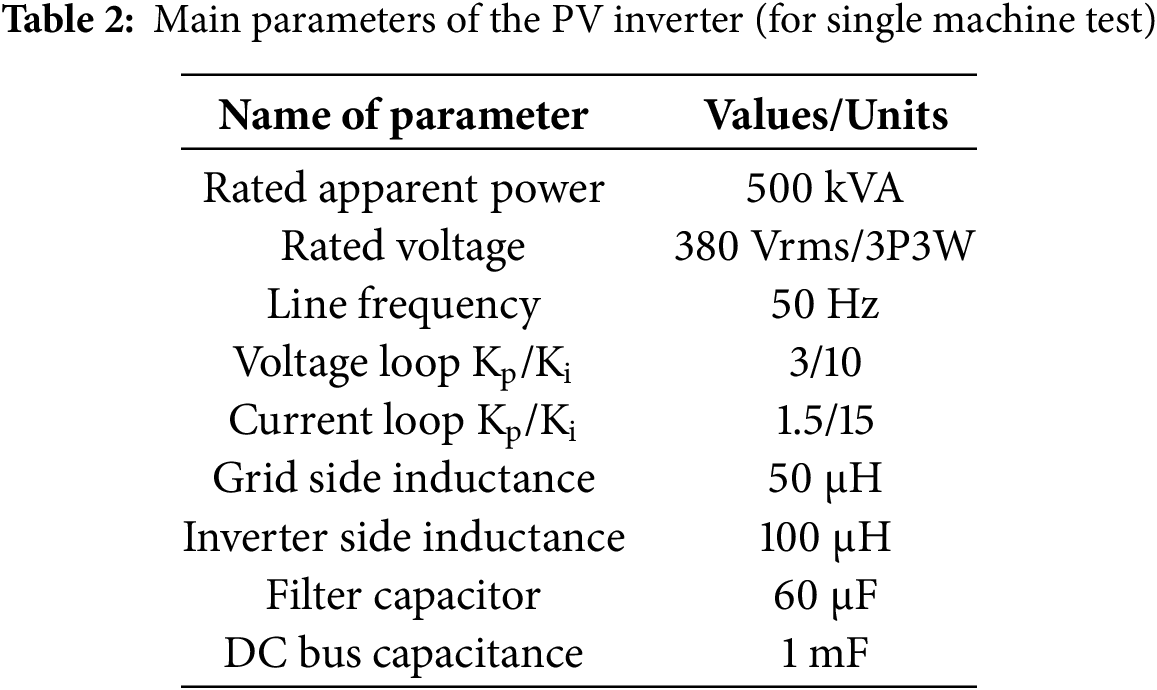
First, the single-unit average model shown in Fig. 4 is verified to ensure the consistency of the simplified model with the detailed model of the PV inverter. Based on the main circuit and control parameters described in Table 2, the detailed switching model for a single PV inverter is established and compared with the corresponding average model.
A steady-state test is carried out when the photovoltaic inverter operates at rated power, and the power factor is set to 1.0. To achieve unit power factor operation, iq* is set to zero. The active power is equal to the apparent power. The grid-side voltage and current waveform of the photovoltaic inverter under this condition is shown as follows:
From top-side to bottom-side, Fig. 11 shows the grid-side voltage, grid-side current and inverter-waveforms obtained by the average model and the detailed switching model, respectively. A comparison of the simulation results of the detailed model and the average model reveals that the results are consistent, and the current is sinusoidal and maintains the same frequency and phase as the grid voltage. The average model ignores only a small amount of ripple components generated by the switching process of the photovoltaic inverter, and mainly exists in the inverter side current which impacts less on the grid current. Similarly, if the power factor of the PV inverter is set to 0.8 whose apparent power is 500 kVA, the corresponding active power and reactive power are 400 kW and 300 kVar, respectively. Therefore, id* and iq* are set to 857 A and 643 A, respectively, and the waveform at this time is shown in Fig. 11b. It can be seen that the staggered phase angle between the grid voltage and current is approximately 36°, which corresponds exactly to the power factor 0.8, indicating that the closed-loop control strategy has achieved the expected effect. In conclusion, the average model can correctly describe the current and output active/reactive power characteristics of the photovoltaic inverter during steady-state conditions.
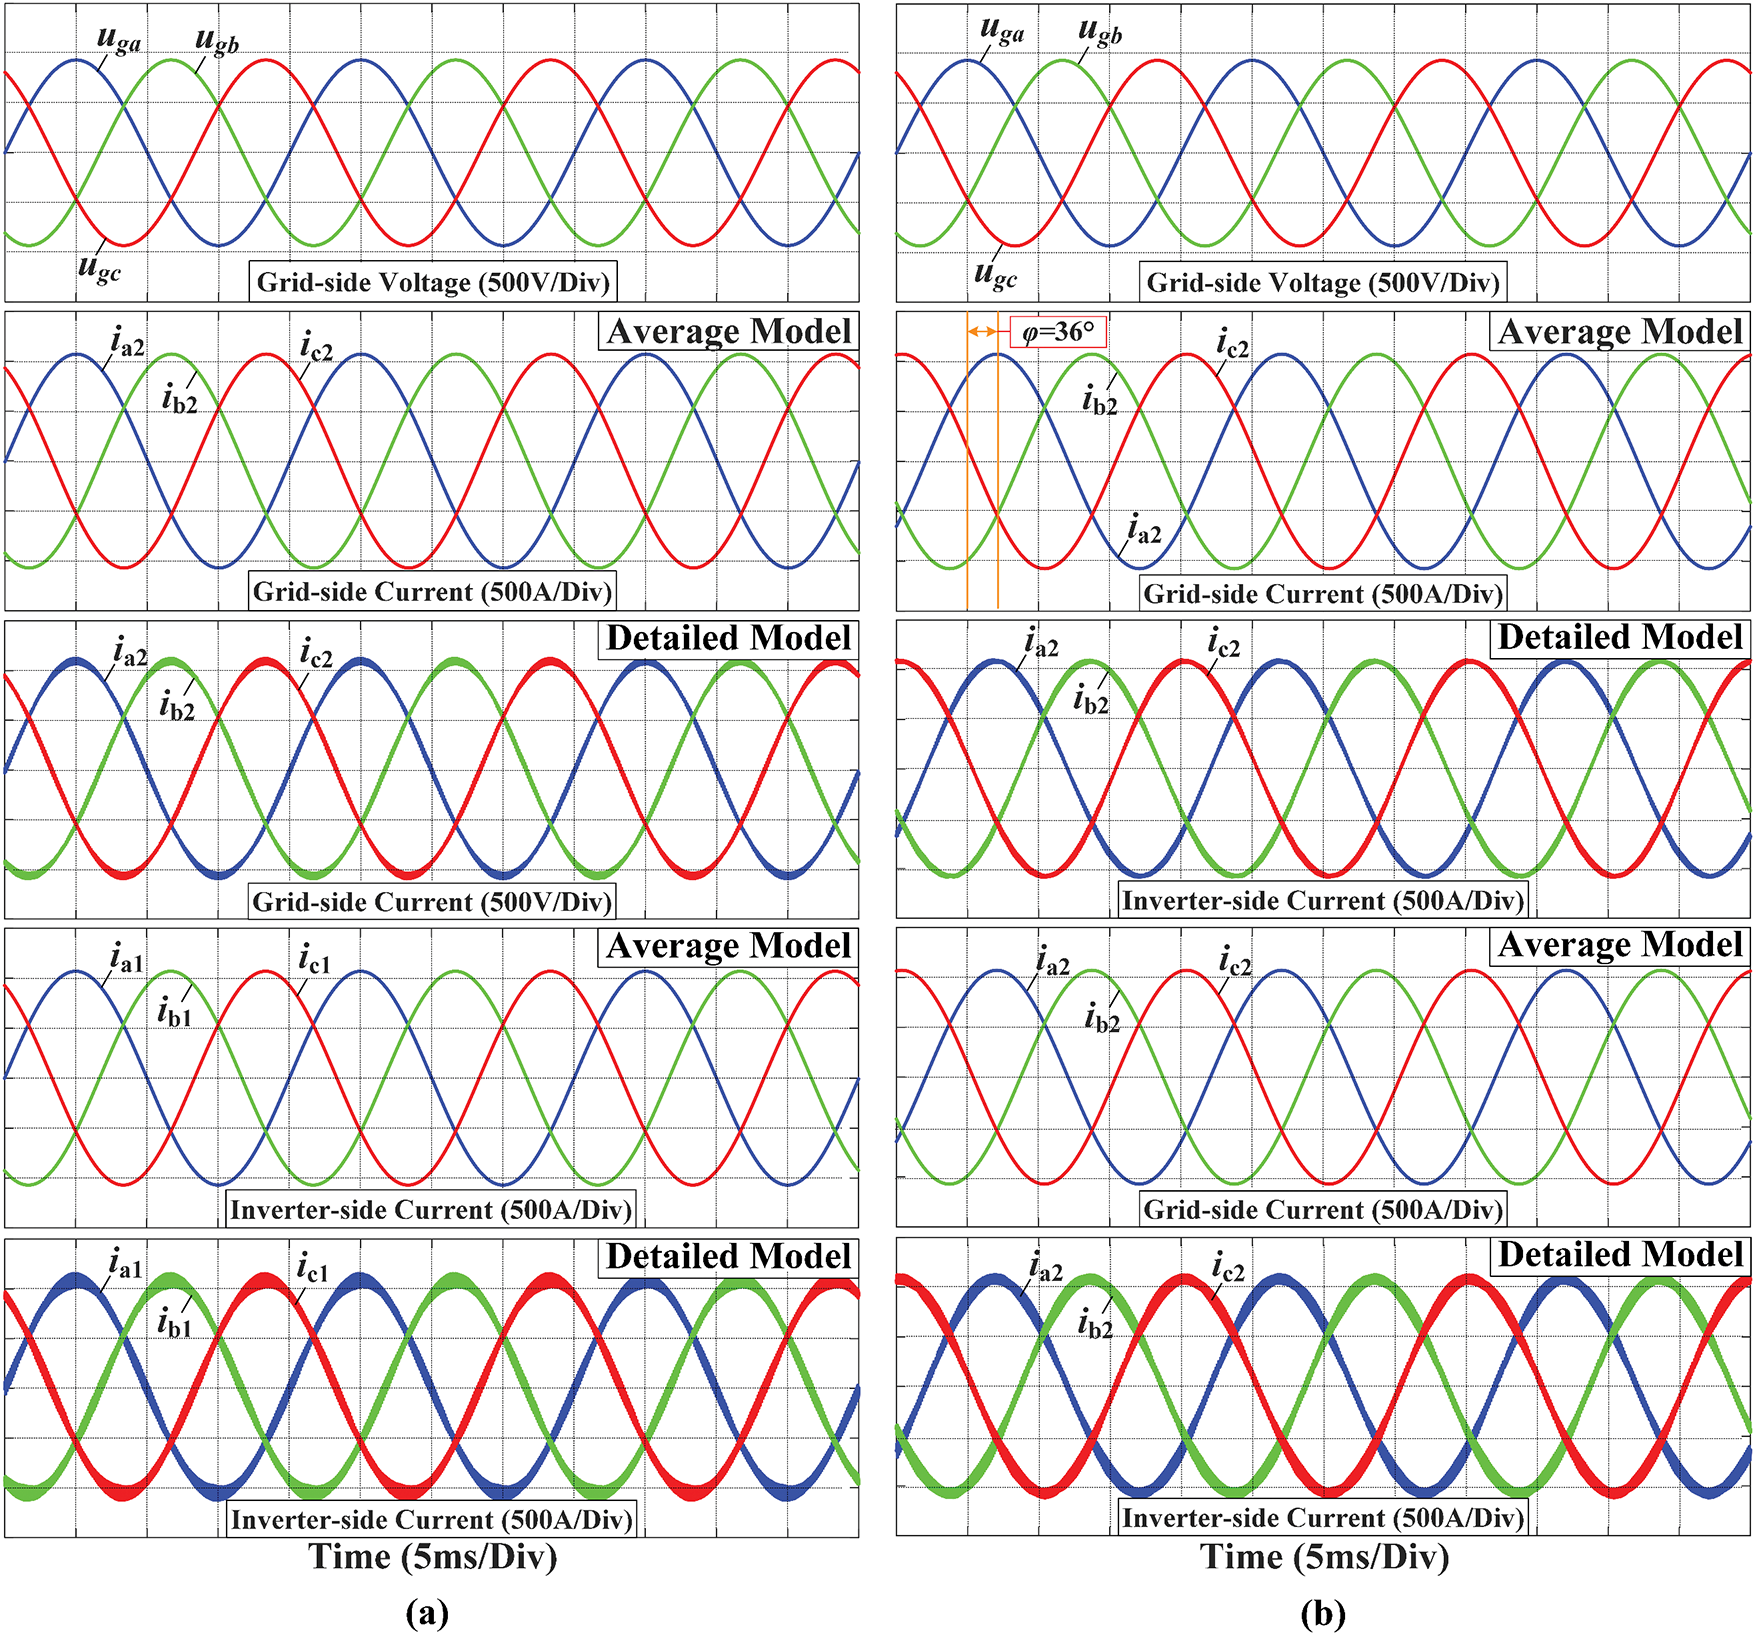
Figure 11: Single-machine model verification—comparison of average model and detailed model (steady-state waveform) (a) Steady-state waveform at rated power when PF = 1.0 (b) Steady-state waveform at rated power when PF = 0.8
On this basis, the consistency of the dynamic characteristics of the average model for the PV inverter is also verified. Firstly, the MPPT control loop is disconnected to verify the effect of the voltage and current loop control, and the solar radiation is kept at the rated value of 1000 W/m2. Upv* is manually set from 850 to 680 V step by step. The simulation results in Fig. 12a show that the DC voltage of the photovoltaic array can follow the reference value correctly. The results of the detailed switching model are consistent with the average model. Then MPPT control is enabled and the solar radiation is artificially changed between 400 and 1200 W/m2. It can be seen that the MPPT algorithm is always effective, and the practical photovoltaic panel operating point can accurately follow the MPP point. At the same time, it should be pointed out that in the Time Interval A and B, the solar radiation is different but the output power is equal because the output power of the photovoltaic array has exceeded the upper power limit of the inverter, so the voltage loop saturation takes effect, and the output current is limited. During the remainder of the time, the output power follows the solar radiation.
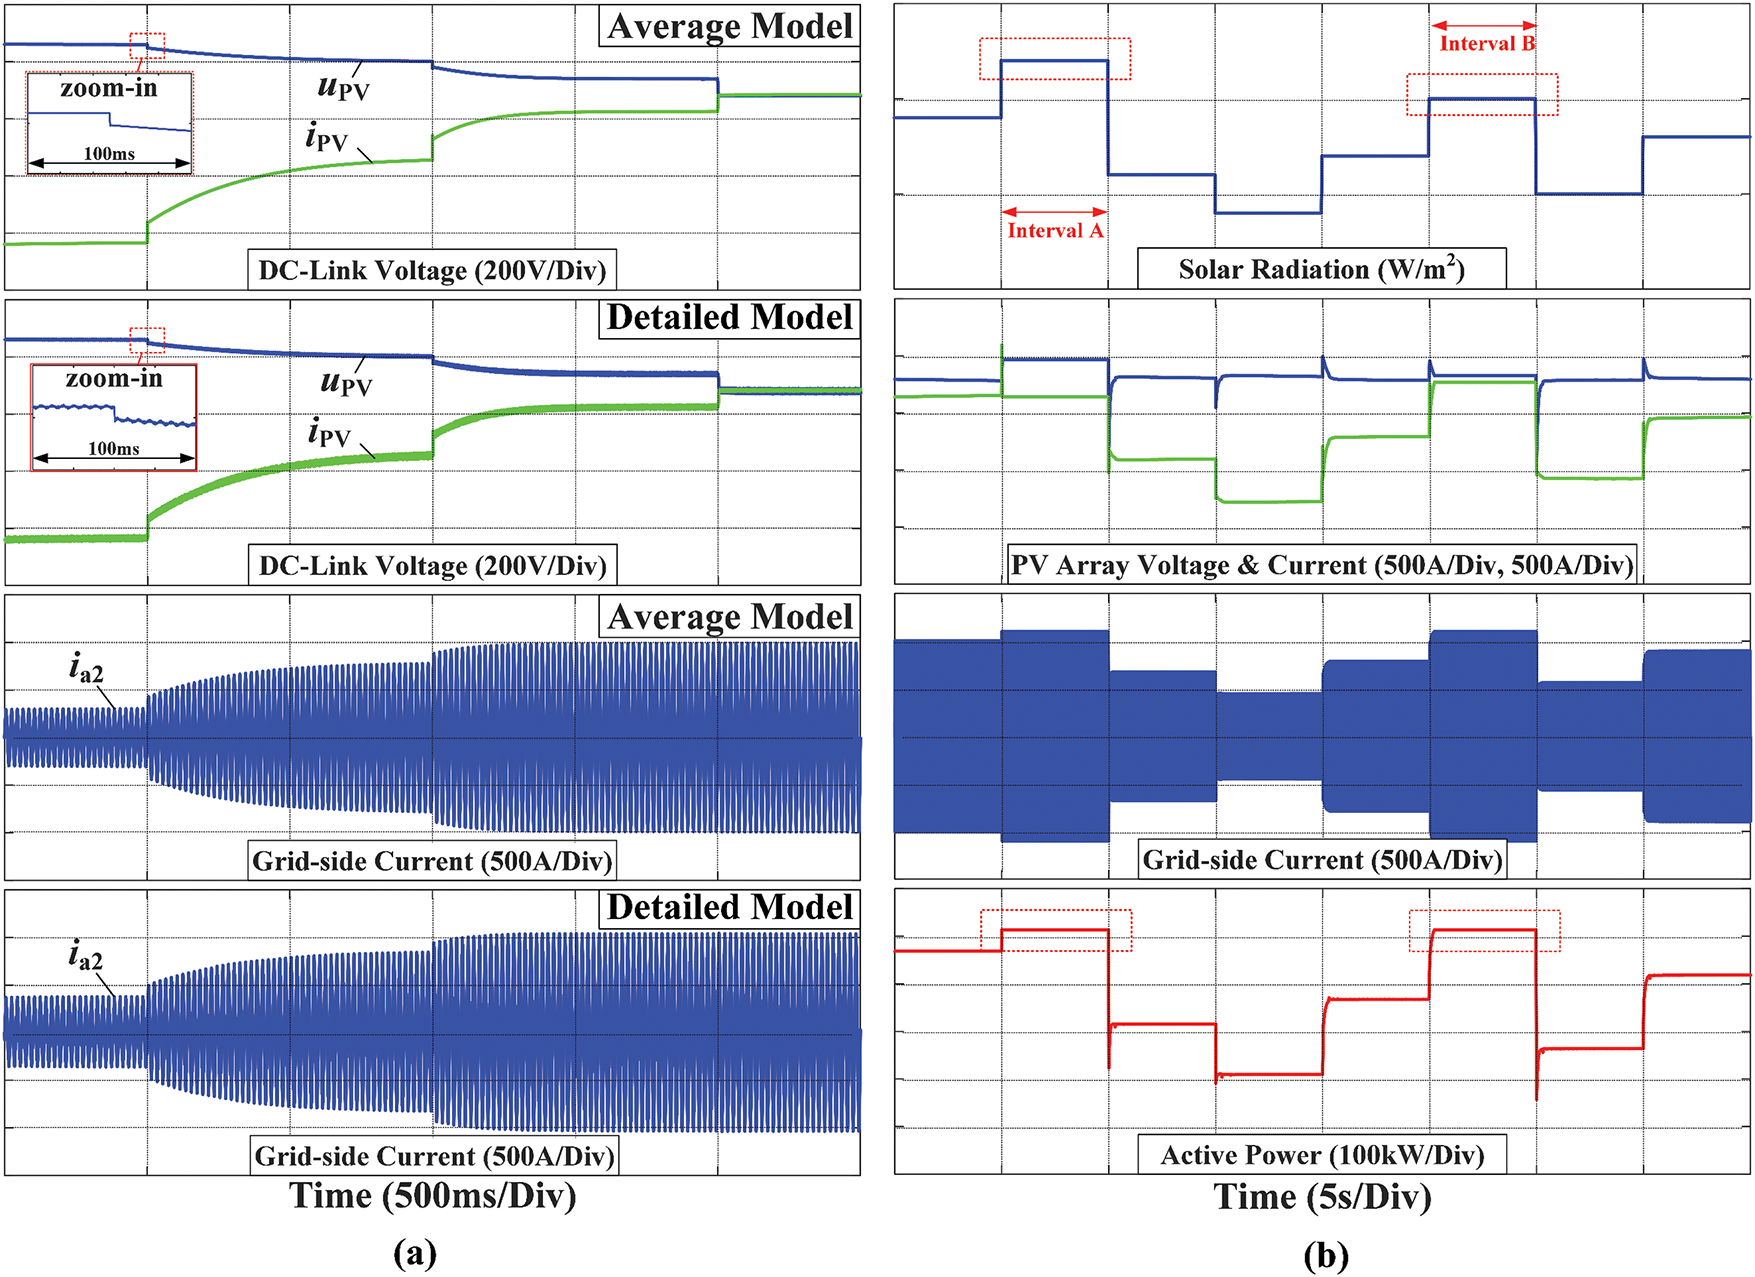
Figure 12: Dynamic characteristics and MPPT strategy verification (a) Dynamic response of PV inverter when MPPT control loop is disabled (b) Dynamic response of PV inverter when MPPT control loop is enabled
5.2 Multi-Machine Clustering Computation for PV Power Stations
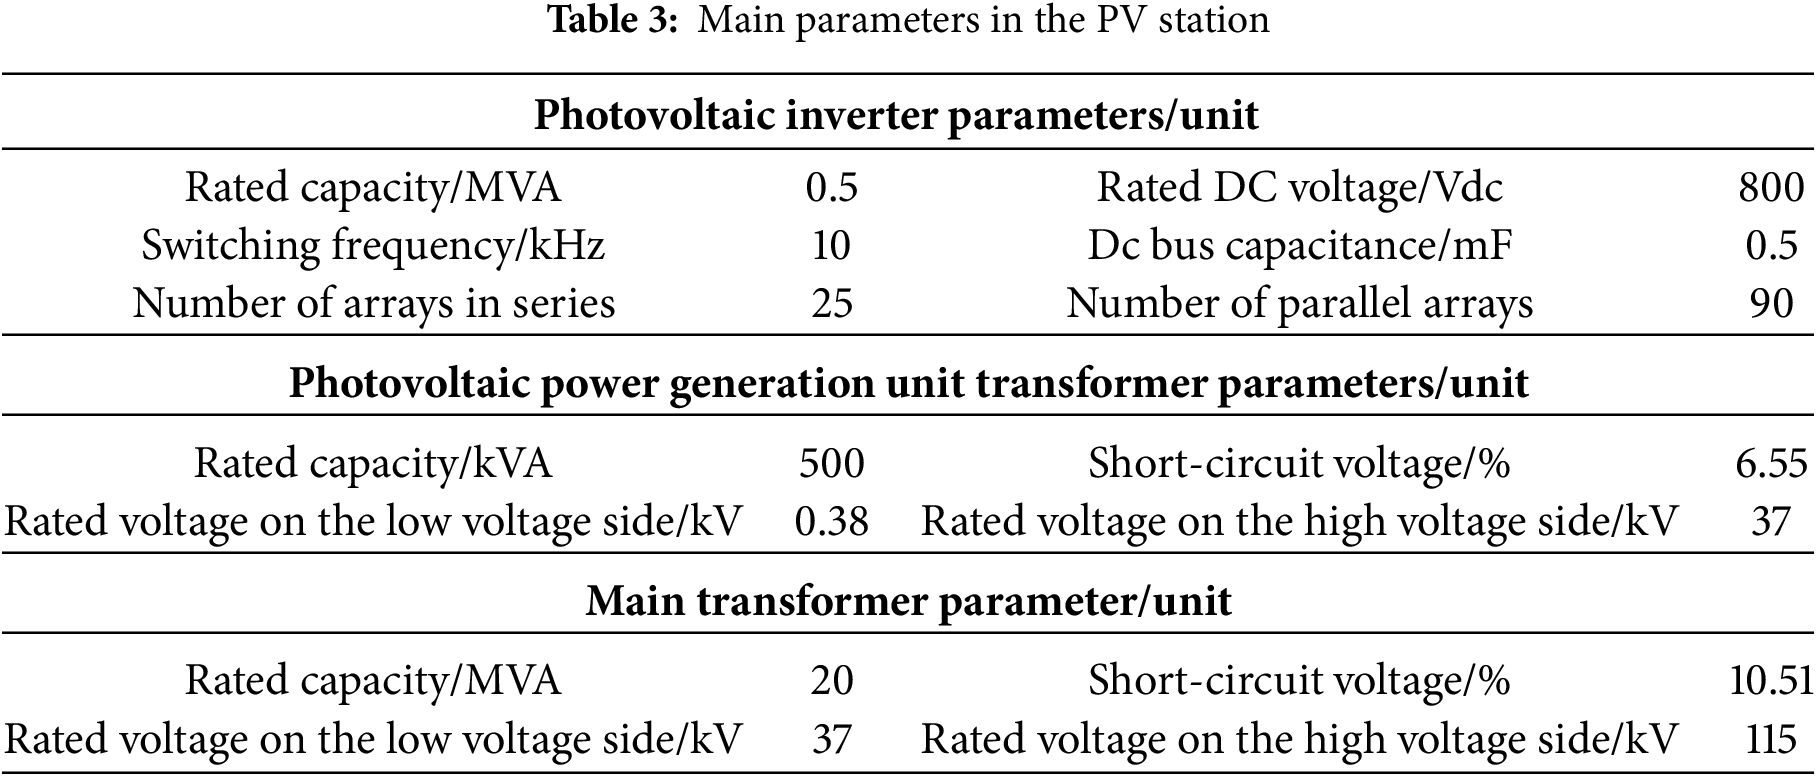
The topology of the PV station in this paper has been described in Section 2, and the main parameters are shown in Table 3:
Based on the proposed clustering indicators, the PSO-K-means clustering algorithm is implemented on the datasets of PV stations, and the clustering results are shown in Fig. 13:
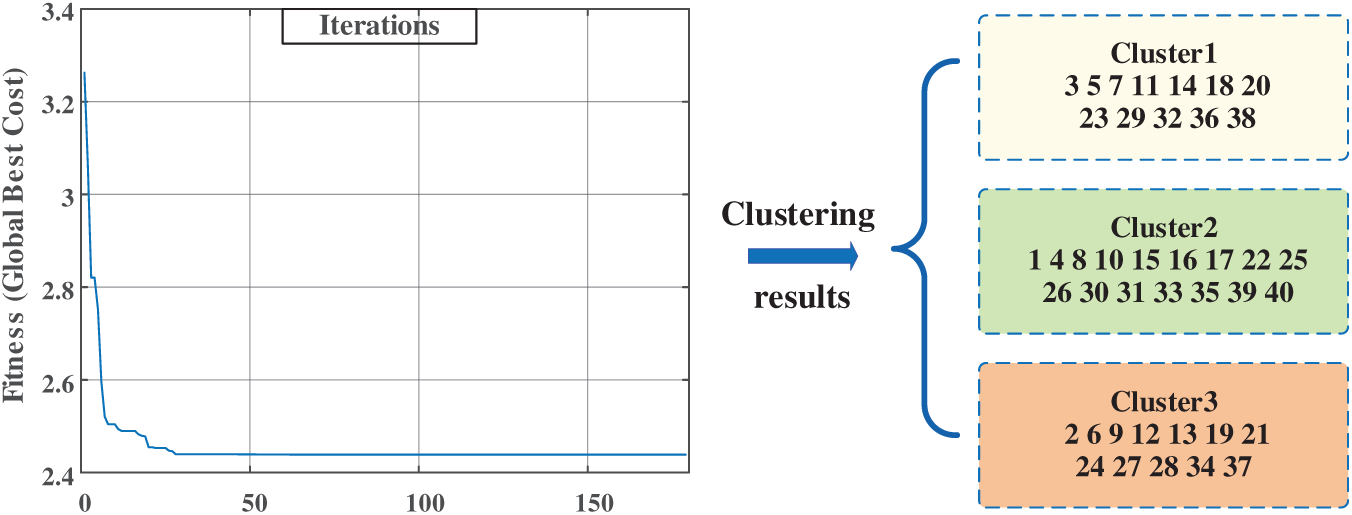
Figure 13: Relation between the fitness of the PSO-K-means clustering algorithm and the number of iterations and the grouping results output by the clustering algorithm
The brief equivalence process is shown in Fig. 14. Compared with the conventional K-means algorithm, the PSO-K-means clustering algorithm requires fewer iterations. For the PV power station dataset in this paper, the number of iterations of PSO-K-means is 28, whereas that of the traditional K-means algorithm is 87. The primary reason is that the K-means algorithm randomly selects the initial cluster center, which can lead to more iterations or fall into local optima at all probabilities. PSO integration addresses the sensitivity to initial cluster centers in three ways: reducing misclassification errors by optimizing centroid placement, improving cluster compactness through swarm intelligence, and accelerating convergence via parallel search. These enhancements collectively improve scalability for large datasets.
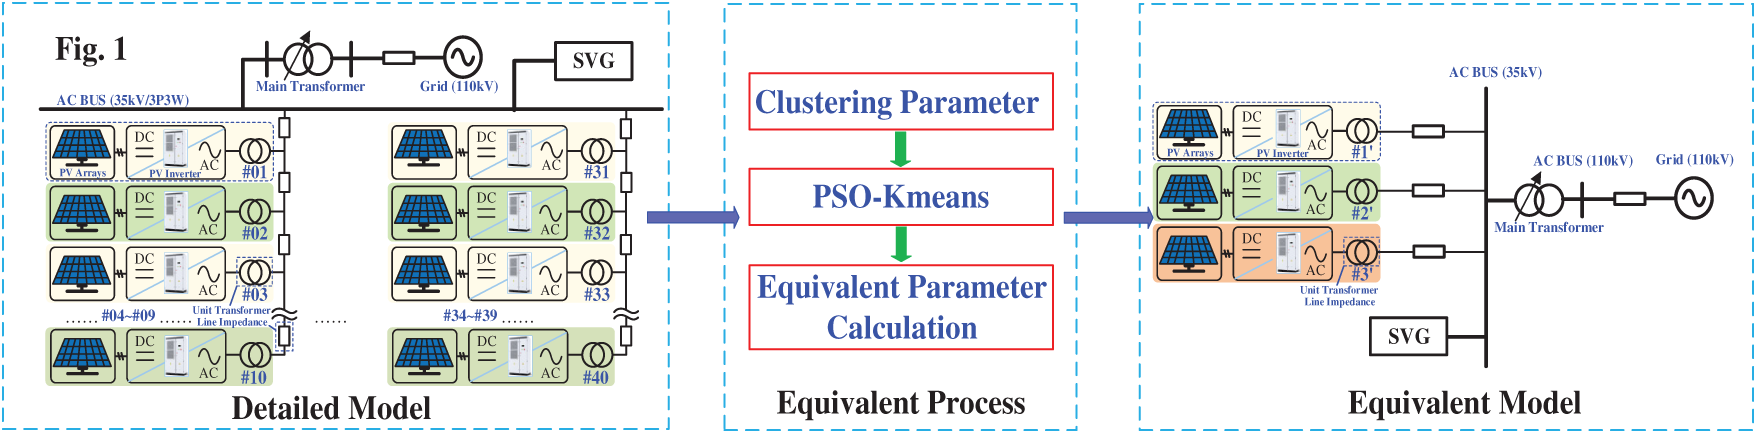
Figure 14: Equivalent model of PV station after clustering
5.3 Simulation Results and Analysis of the Aggregate Equivalent Model
A change in solar radiation causes dynamic changes in the operating state of a PV generation system. Therefore, an adaptation analysis under changing solar radiation is an important step in evaluating the effectiveness of the equivalence method. First, the simulations of the equivalent model and the detailed model are verified under different operating conditions, and the comparative analysis is carried out.
Four case studies involving solar radiation change are conducted to evaluate the effectiveness of the proposed dynamic equivalent model (represented by “Pro.”) against a conventional single equivalent model (represented by “Sin.”) and the detailed model of the solar power plant (represented by Det.). The case studies are listed as follows:
• Case study 1: The solar radiation starts dropping from 750 to 550 W/m2 at 5 s, which lasts for 25 s and recovers to the initial value (Fig. 15).
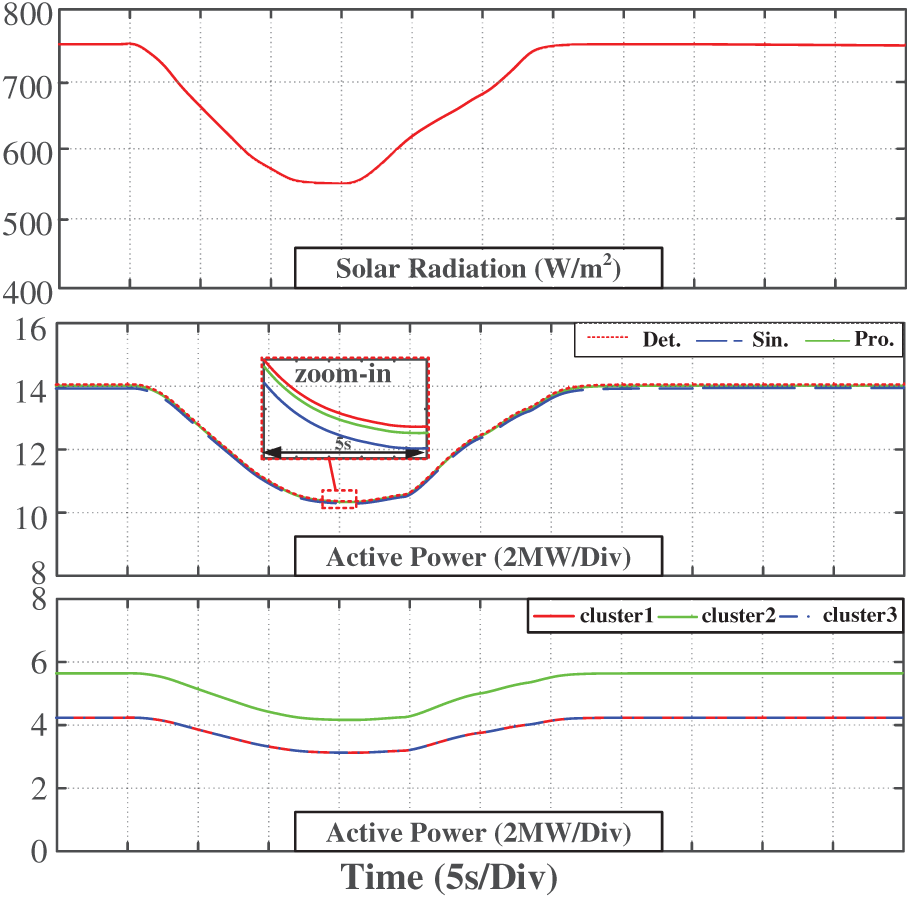
Figure 15: Equivalent model verification when light rises at high power
• Case study 2: The solar radiation starts rising from 750 to 900 W/m2 at 5 s, which lasts for 25 s and recovers to the initial value (Fig. 16).
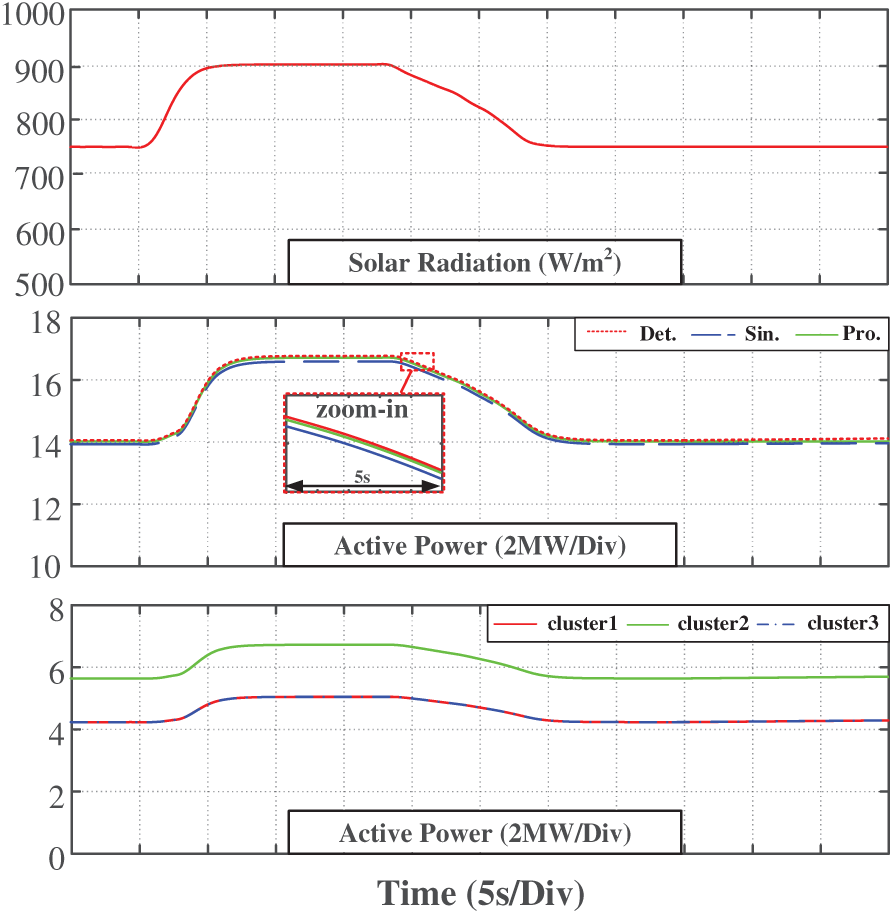
Figure 16: Equivalent model verification when illumination drops at high power
• Case study 3: The solar radiation starts dropping from 450 to 250 W/m2 at 5 s, which lasts for 25 s and recovers to the initial value (Fig. 17).
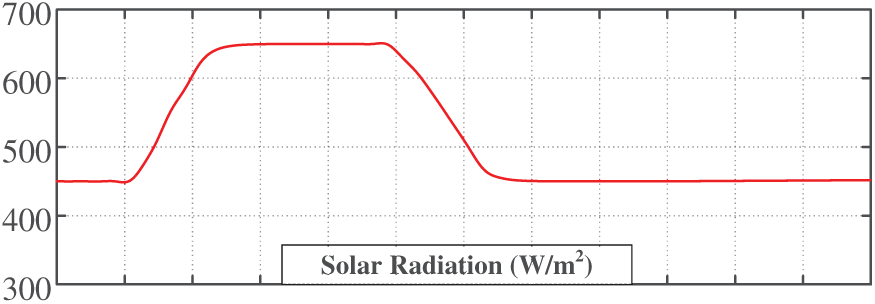
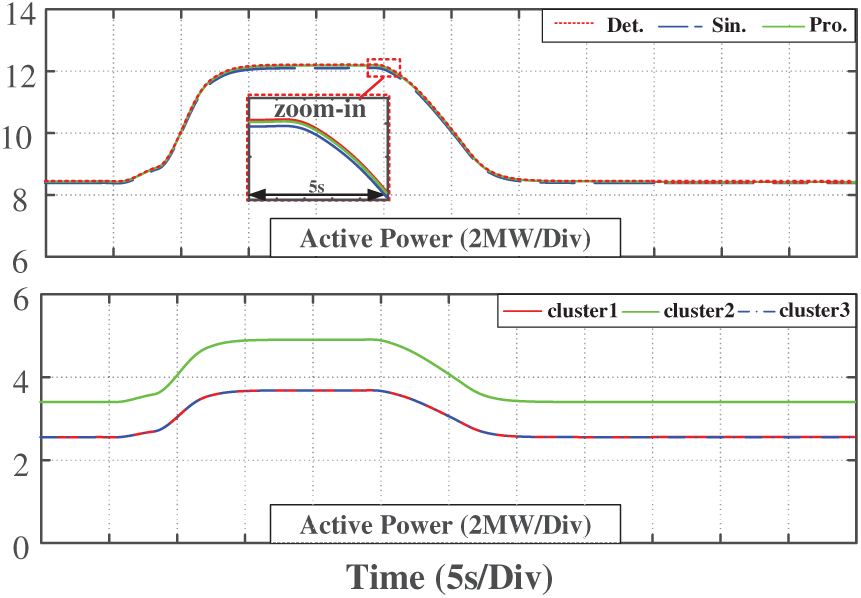
Figure 17: Equivalent model verification when light rises at low power
• Case study 4: The solar radiation starts rising from 450 to 650 W/m2 at 5 s, which lasts for 25 s and recovers to the initial value (Fig. 18).
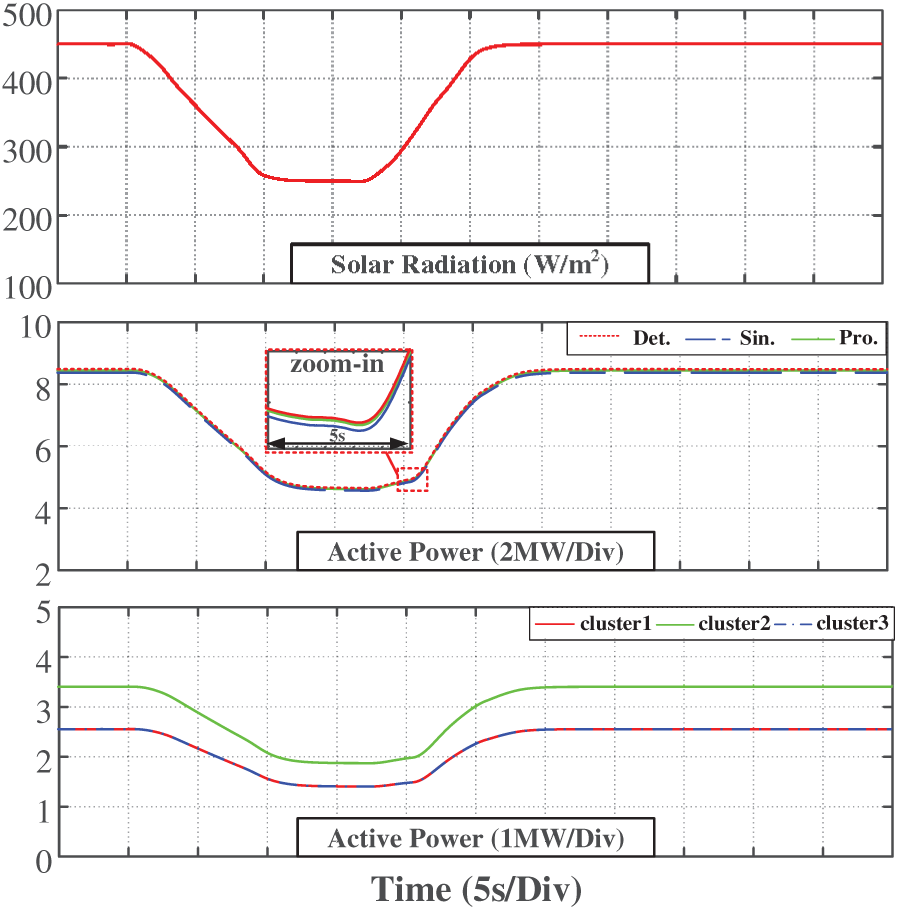
Figure 18: Equivalent model verification when light drops at low power
The simulation results indicate that when the solar radiation is constant (before 5 s), the active power outputs of the detailed model and the equivalent model are consistent. This shows that the proposed dynamic equivalent model accurately reflects the power characteristics of the system in a steady state. During the dynamic process, it can be seen that the power output error of the proposed dynamic equivalent model in this paper is small after the change in solar radiation. This demonstrates that the proposed equivalent model is effective not only in steady-state operation but also maintains its accuracy under dynamic solar radiation conditions, which fully proves the reliability and adaptability of the equivalent modeling method.
In the case of the grid voltage drop, a crucial requirement for PV power stations is the ability to maintain grid connection during the low-voltage period and quickly switch back to normal operation after voltage recovery to achieve low-voltage ride-through.
Two case studies involving voltage sag are conducted to evaluate the effectiveness of the proposed dynamic equivalent model (Pro.) in comparison with a conventional single equivalent model (Sin.) and the detailed model of the solar power plant (Det.). The case studies are listed as follows:
• Case study 5: The voltage decreases by 50% in 5 s, increases after 1 s, and returns to steady state in 8 s (Fig. 19).
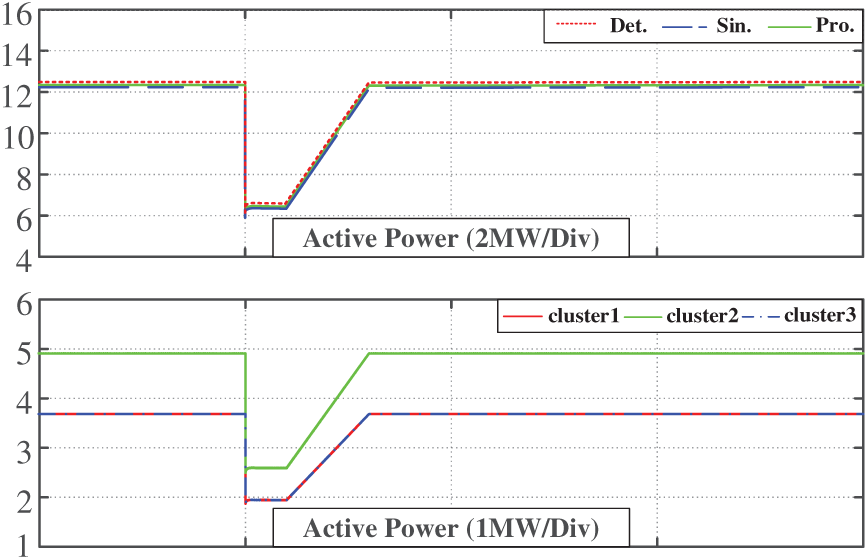
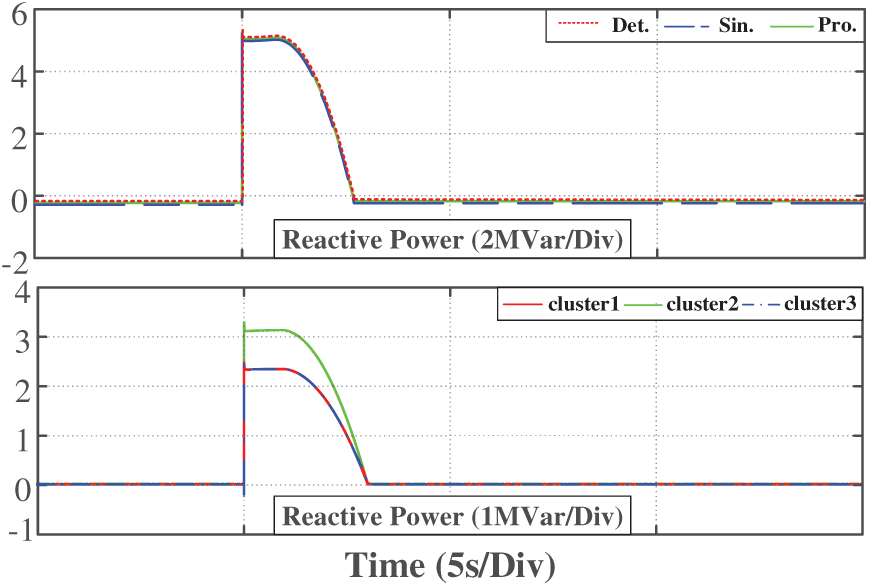
Figure 19: Equivalent model verification when the voltage drops by 50%
• Case study 6: The voltage decreases approximately 75% in 5 s, increases after 1 s, and returns to steady state in 8 s (Fig. 20).
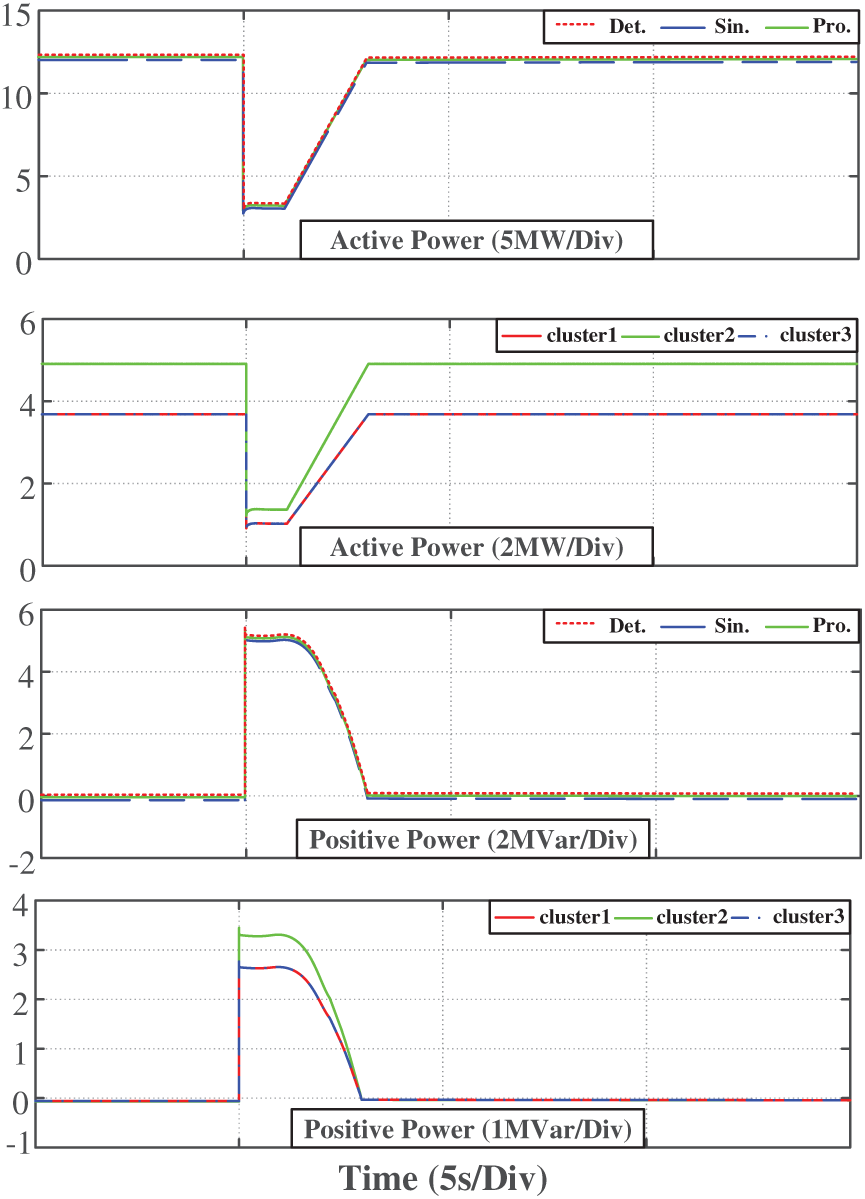
Figure 20: Equivalent model verification when the voltage drops by approximately 75%
The simulation results show that the proposed equivalent model accurately reflects the dynamic response of the system when a voltage drop causes a drastic change in the power system. Furthermore, the error of the simulation results between the equivalent model and the detailed model is small. During a voltage drop, the equivalent model demonstrates a superior ability of low voltage ride through and can recover to normal operation within a short time. This demonstrates that the equivalent modeling method is highly adaptable and can effectively reflect the transient characteristics of PV power stations under the condition of grid voltage drop.
Finally, a comparative qualitative analysis is carried out by calculating the root mean square error for the two equivalent methods under different conditions. Based on the results listed in Table 4, the proposed equivalent model is proven to be more accurate in its steady-state, dynamic, and transient characteristics. A mean-square error analysis of the active power curves from the detailed, single equivalent, and proposed equivalent models shows that the proposed multi-machine equivalent model has smaller power output errors, yielding higher accuracy and reliability across different operating conditions. Fig. 21 shows that a bar chart with error bars has been added to illustrate the variability observed across multiple simulation runs, further confirming the robustness of the proposed method. Furthermore, the consistently low errors observed in these tests indirectly verify the robustness of the clustering parameter settings. Since these parameters are determined through a combination of engineering experience and PSO-based optimization, their stability has been implicitly validated, a full-scale sensitivity analysis is therefore beyond the scope of this work. Compared to the single-machine equivalent model, the proposed multi-machine equivalent model can reflect the dynamic behavior of photovoltaic power stations more accurately, and is simpler and less complex than the detailed model, which can meet the further modeling and calculation demands of large-scale PV power stations in the future.
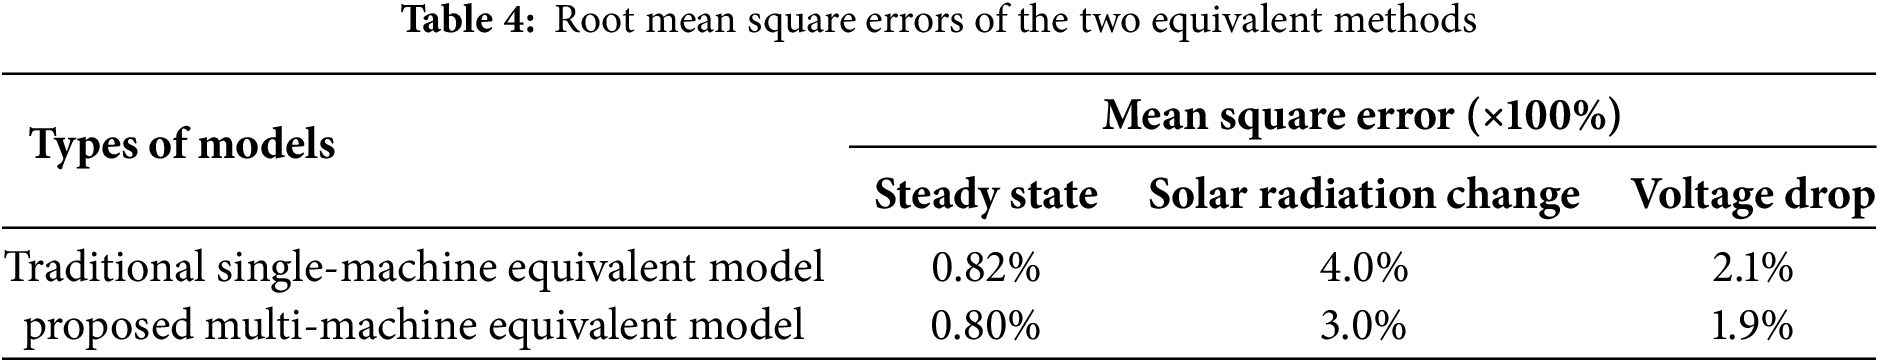
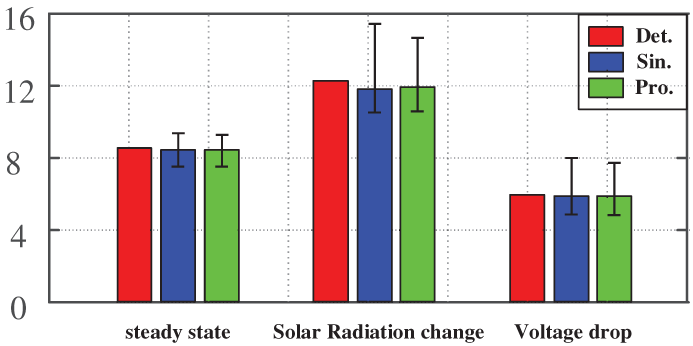
Figure 21: Error bars of the two equivalent methods
5.4 Hardware-in-the-Loop (HIL) Simulation Results
Furthermore, a hardware-in-the-loop simulation based on RT-LAB is conducted to verify the correctness and feasibility of the multi-machine equivalent model obtained in Section 5.2. Fig. 22 shows the steady-state results with a unit power factor. The voltage and current waveforms verify that the equivalent model can operate correctly. The amplitude and phase angle are consistent with the theoretically calculated values. Similarly, Fig. 23 shows the steady state results when the power factor equals 0.8, where the current phase lags approximately 35° with reference to the voltage signals. In this case, the PV station generates reactive power in this case, which verifies that the multi-machine model has a certain reactive power regulation ability.
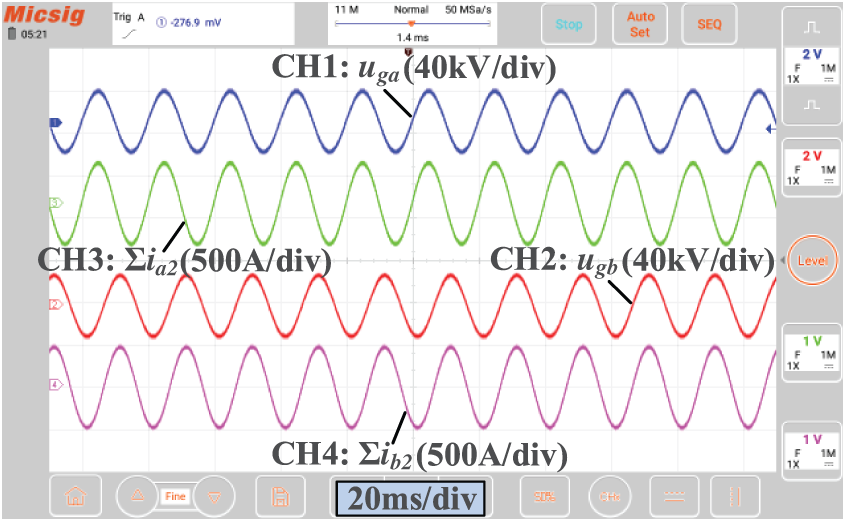
Figure 22: Output voltage and current waveforms of the multi-machine model with unity power factor in steady state
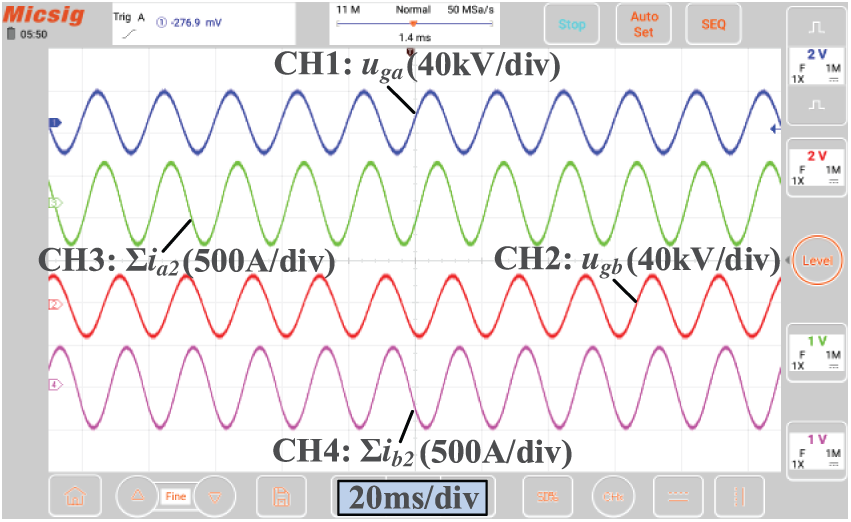
Figure 23: Output voltage and current waveforms of the multi-machine model with a power factor of 0.8 in steady state
Then the dynamic response results of the multi-machine model are tested and recorded by an oscilloscope. Fig. 24 shows the corresponding waveforms when the illumination intensity changes. It can be seen that the output current and active power of the multi-machine model change synchronously, reflecting the characteristics of an actual PV system. The multi-machine model is also applicable to dynamic behavior analysis. Fig. 25 shows the simulation results when a grid voltage drop occurs. It can be observed that the multi-machine model can quickly respond to grid disturbances during the LVRT process. The reactive power support capability is activated immediately when a voltage sag occurs which aims to improve the grid-side voltage stability.
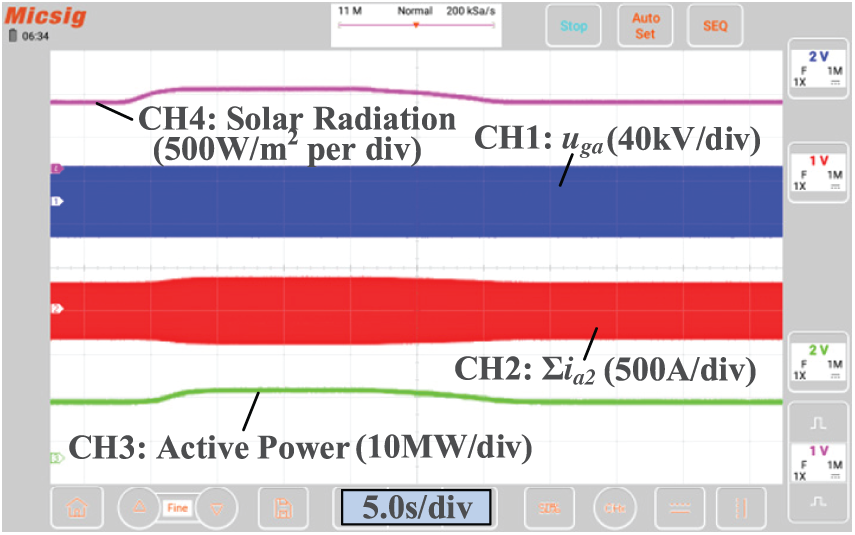
Figure 24: Validation of the multi-machine model when illumination intensity changes
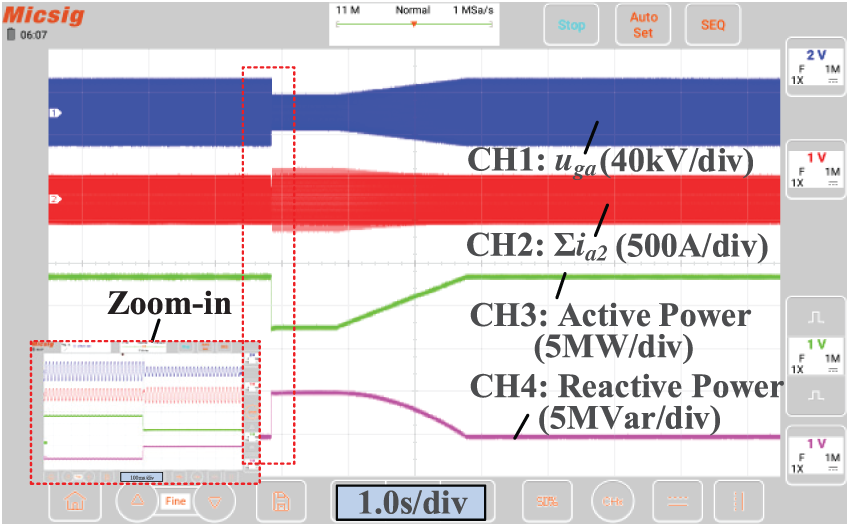
Figure 25: Validation of the multi-machine model during LVRT
This paper addresses the equivalent modeling problem for PV power stations and proposes a particle swarm optimized k-means algorithm-based equivalent modeling method that considers passive filter parameter clustering for PV power stations. First, the effects of various inductance and capacitance parameters on the external characteristics of the filter are analyzed and included in the clustering index. A detailed mathematical model of the PV power station is subsequently constructed by applying the average modeling method to PV arrays. On this basis, the clustering algorithm for PV power stations is optimized. By introducing PSO, the clustering effect of the algorithm is better than that of the traditional K-means algorithm, its iteration speed is faster, and it can better capture the dynamic characteristics of the PV system. Finally, the accuracy and efficiency of the proposed equivalent method are verified by comparing the simulation results of the single-machine and multi-machine equivalent models. Numerical examples show that, under different working conditions, the mean squared error of the simulation results based on the PSO–K-means multi-machine equivalent model is smaller than that of the detailed model. This confirms that the proposed method can effectively improve the accuracy and reliability of the equivalent modeling of the PV power station.
Acknowledgement: The authors sincerely thank State Key Laboratory of HVDC for providing the necessary resources, facilities, and collaborative environment that enabled the completion of this study.
Funding Statement: This project is supported by the Research Project of China Southern Power Grid (No. 056200KK52222031).
Author Contributions: The authors confirm their contributions to the paper as follows: Study conception and design: Binjiang Hu, Yihua Zhu; Data collection: Binjiang Hu, Liang Tu, Zun Ma; Analysis and interpretation of results: Xian Meng; Draft manuscript preparation: Binjiang Hu, Kewei Xu. All authors reviewed the results and approved the final version of the manuscript.
Availability of Data and Materials: The dataset generated and analyzed during the current study is available from the corresponding author upon reasonable request.
Ethics Approval: Not applicable.
Conflicts of Interest: The authors declare no conflicts of interest to report regarding the present study.
References
1. Olabi AG, Ali Abdelkareem M. Renewable energy and climate change. Renew Sustain Energy Rev. 2022;158:112111. doi:10.1016/j.rser.2022.112111. [Google Scholar] [CrossRef]
2. Moosavian SF, Noorollahi Y, Shoaei M. Renewable energy resources utilization planning for sustainable energy system development on a stand-alone island. J Clean Prod. 2024;439(4):140892. doi:10.1016/j.jclepro.2024.140892. [Google Scholar] [CrossRef]
3. Jariwala AM, Dash SK, Sahu UK, Chudjuarjeen S. Design and dynamic emulation of hybrid solar-wind-wave energy converter (SWWEC) for efficient power generation. Sci Rep. 2024;14(1):22721. doi:10.1038/s41598-024-72827-9. [Google Scholar] [PubMed] [CrossRef]
4. Gao N, Wang L, Wu W, Zhu L, Sang S, Li R. Impedance modelling and stability improvement for high frequency isolated power conversion system based on dual active bridge. J Energy Storage. 2024;102(1):114119. doi:10.1016/j.est.2024.114119. [Google Scholar] [CrossRef]
5. Karimzada O, De Donato G. Design and verification of a GaN-based, single stage, grid-connected three-phase PV inverter. IEEE Trans Power Electron. 2025;40(4):5496–504. doi:10.1109/TPEL.2024.3511270. [Google Scholar] [CrossRef]
6. Han P, Lin Z, Wang L, Fan G, Zhang X. A survey on equivalence modeling for large-scale photovoltaic power plants. Energies. 2018;11(6):1463. doi:10.3390/en11061463. [Google Scholar] [CrossRef]
7. Martínez-Lavín M, Villena-Ruiz R, Honrubia-Escribano A, Hernández JC, Gómez-Lázaro E. Proposal for an aggregated solar PV power plant simulation model for grid code compliance. Electr Power Syst Res. 2022;213(1):108676. doi:10.1016/j.epsr.2022.108676. [Google Scholar] [CrossRef]
8. Chamandoust H, Derakhshan G, Hakimi SM, Bahramara S. Tri-objective optimal scheduling of smart energy hub system with schedulable loads. J Clean Prod. 2019;236(4):117584. doi:10.1016/j.jclepro.2019.07.059. [Google Scholar] [CrossRef]
9. Chamandoust H, Derakhshan G, Hakimi SM, Bahramara S. Tri-objective scheduling of residential smart electrical distribution grids with optimal joint of responsive loads with renewable energy sources. J Energy Storage. 2020;27:101112. doi:10.1016/j.est.2019.101112. [Google Scholar] [CrossRef]
10. Mishra A, Mir AS, Padhy NP. Dynamic aggregate equivalent modeling of solar parks considering irradiation levels and fault scenarios. IEEE Trans Ind Appl. 2024;60(5):7291–302. doi:10.1109/TIA.2024.3425576. [Google Scholar] [CrossRef]
11. Zhang Z, Liao S, Sun Y, Xu J, Ke D, Wang B, et al. Unified dynamic equivalent model for distributed photovoltaic generation systems with different fault-ride-through strategies. IEEE Trans Sustain Energy. 2023;14(4):2062–78. doi:10.1109/TSTE.2023.3288564. [Google Scholar] [CrossRef]
12. Wang P, Zhang Z, Chen C, Huang Q, Dai N, Lee WJ. Multistage parameter identification featured generic wind farm dynamic equivalent modeling. IEEE Trans Ind Appl. 2023;59(6):7475–83. doi:10.1109/TIA.2023.3307656. [Google Scholar] [CrossRef]
13. Yin Z, Wang X, Wang P, Li H, Jiang F, Chen M. Aggregation modeling and equivalence of large-scale photovoltaic and energy storage combined power generation system. In: 2023 Panda Forum on Power and Energy (PandaFPE); 2023 Apr 27–30; Chengdu, China. IEEE; 2023. p. 1982–8. doi:10.1109/PandaFPE57779.2023.10140596. [Google Scholar] [CrossRef]
14. Liu S, Zhang H, Zhang P, Li Z, Wang Z. Equivalent model of photovoltaic power station considering different generation units’ fault current contributions. Energies. 2022;15(1):229. doi:10.3390/en15010229. [Google Scholar] [CrossRef]
15. Ma Z, Zheng J, Zhu S, Wei L, Shen X, Wang Z, et al. Online clustering modeling of photovoltaic power plant with LVRT control function. In: 2016 IEEE International Conference on Power System Technology (POWERCON); 2016 Sep 28–Oct 1; Wollongong, NSW, Australia. IEEE; 2016. p. 1–6. doi:10.1109/POWERCON.2016.7753851. [Google Scholar] [CrossRef]
16. Li CL, Wang J, Yang LB. Equivalent modeling research and application of typical grid connected photovoltaic power station. Electr Power Constr. 2015;36(8):114–21. (In Chinese). [Google Scholar]
17. Zheng J, Ma Z, Wang Z, Wang X, Zhu S, Wei L. Feature distance based online cluster modeling of LVRT controlled PV power plants. Electr Power Syst Res. 2018;154(5):223–33. doi:10.1016/j.epsr.2017.08.028. [Google Scholar] [CrossRef]
18. Wu H, Zhang J, Luo C, Xu B. Equivalent modeling of photovoltaic power station based on canopy-FCM clustering algorithm. IEEE Access. 2019;7:102911–20. doi:10.1109/access.2019.2931444. [Google Scholar] [CrossRef]
19. Purba V, Johnson BB, Jafarpour S, Bullo F, Dhople SV. Dynamic aggregation of grid-tied three-phase inverters. IEEE Trans Power Syst. 2020;35(2):1520–30. doi:10.1109/TPWRS.2019.2942292. [Google Scholar] [CrossRef]
20. Chen Z, Ren B, Xu J, Wang K, Li G, Li Q. Generalized composite load aggregation considering different distributed PV systems based on improved K-means algorithm. In: 2022 Power System and Green Energy Conference (PSGEC); 2022 Aug 25–27; Shanghai, China. IEEE; 2022. p. 296–301. doi:10.1109/PSGEC54663.2022.9880982. [Google Scholar] [CrossRef]
21. Zou J, Peng C, Xu H, Yan Y. A fuzzy clustering algorithm-based dynamic equivalent modeling method for wind farm with DFIG. IEEE Trans Energy Convers. 2015;30(4):1329–37. doi:10.1109/TEC.2015.2431258. [Google Scholar] [CrossRef]
22. Miraftabzadeh SM, Colombo CG, Longo M, Foiadelli F. K-means and alternative clustering methods in modern power systems. IEEE Access. 2023;11:119596–633. doi:10.1109/access.2023.3327640. [Google Scholar] [CrossRef]
23. Li P, Gu W, Wang L, Xu B, Wu M, Shen W. Dynamic equivalent modeling of two-staged photovoltaic power station clusters based on dynamic affinity propagation clustering algorithm. Int J Electr Power Energy Syst. 2018;95:463–75. doi:10.1016/j.ijepes.2017.08.038. [Google Scholar] [CrossRef]
24. Zhang R, Hredzak B. Distributed dynamic clustering algorithm for formation of heterogeneous virtual power plants based on power requirements. IEEE Trans Smart Grid. 2021;12(1):192–204. doi:10.1109/TSG.2020.3020163. [Google Scholar] [CrossRef]
25. Zha X, Liao S, Huang M, Yang Z, Sun J. Dynamic aggregation modeling of grid-connected inverters using hamilton’s-action-based coherent equivalence. IEEE Trans Ind Electron. 2019;66(8):6437–48. doi:10.1109/TIE.2019.2891439. [Google Scholar] [CrossRef]
26. Guan J, Li S, He X, Zhu J, Chen J, Si P. SMMP: a stable-membership-based auto-tuning multi-peak clustering algorithm. IEEE Trans Pattern Anal Mach Intell. 2023;45(5):6307–19. doi:10.1109/tpami.2022.3213574. [Google Scholar] [PubMed] [CrossRef]
27. Mondal B, Arun Karuppaswamy B. A non-iterative design method for output LCL filter with RC damping in grid-connected inverters. IEEE Trans Ind Electron. 2024;71(12):15768–79. doi:10.1109/TIE.2024.3387080. [Google Scholar] [CrossRef]
28. Kennedy J, Eberhart R. Particle swarm optimization. In: Proceedings of ICNN'95 - International Conference on Neural Networks; 1995 Nov 27–Dec 1; Perth, WA, Australia. IEEE; 2002. p. 1942–8. doi:10.1109/ICNN.1995.488968. [Google Scholar] [CrossRef]
29. Eberhart R, Kennedy J. A new optimizer using particle swarm theory. In: MHS'95. Proceedings of the Sixth International Symposium on Micro Machine and Human Science; 1995 Oct 4–6; Nagoya, Japan. IEEE; 1995. p. 39–43. doi:10.1109/MHS.1995.494215. [Google Scholar] [CrossRef]
30. Ahmadyfard A, Modares H. Combining PSO and k-means to enhance data clustering. In: 2008 International Symposium on Telecommunications; 2008 Aug 27–28; Tehran, Iran. IEEE; 2008. p. 688–91. doi:10.1109/ISTEL.2008.4651388. [Google Scholar] [CrossRef]
31. Tan L. A clustering K-means algorithm based on improved PSO algorithm. In: 2015 Fifth International Conference on Communication Systems and Network Technologies; 2015 Apr 4–6; Gwalior, India. IEEE; 2015. p. 940–4. doi:10.1109/CSNT.2015.223. [Google Scholar] [CrossRef]
32. Gao H, Li Y, Kabalyants P, Xu H, Martínez-Béjar R. A novel hybrid PSO-K-means clustering algorithm using Gaussian estimation of distribution method and lévy flight. IEEE Access. 2020;8:122848–63. doi:10.1109/access.2020.3007498. [Google Scholar] [CrossRef]
33. Abe CF, Faggianelli GA, Batista Dias J, Notton G. Using on-site measurements to identify and adjust PV single-diode model parameters for real operating conditions. J Energy Eng. 2023;149(1):04022043. doi:10.1061/(asce)ey.1943-7897.0000873. [Google Scholar] [CrossRef]
34. Sen S, Yenduri K, Sensarma P. Step-by-step design and control of LCL filter based three phase grid-connected inverter. In: 2014 IEEE International Conference on Industrial Technology (ICIT); 2014 Feb 26–Mar 1; Busan, Republic of Korea. IEEE; 2014. p. 503–8. doi:10.1109/ICIT.2014.6894991. [Google Scholar] [CrossRef]
35. Vinnikov D, Chub A, Kosenko R, Sidorov V, Lindvest A. Implementation of global maximum power point tracking in photovoltaic microconverters: a survey of challenges and opportunities. IEEE J Emerg Sel Top Power Electron. 2023;11(2):2259–80. doi:10.1109/JESTPE.2021.3137521. [Google Scholar] [CrossRef]
36. Zhang QH, Zhang QH, Shen ZY. Planar array subarray division method in microwave wireless power transmission based on PSO&K-means algorithm. IEEE Open J Anntenas Propag. 2023;4:520–7. [Google Scholar]
Cite This Article
 Copyright © 2026 The Author(s). Published by Tech Science Press.
This work is licensed under a Creative Commons Attribution 4.0 International License , which permits unrestricted use, distribution, and reproduction in any medium, provided the original work is properly cited.
 Downloads
 Citation Tools