
 Submit a Paper
 Propose a Special lssue
 Open Access
ARTICLE
A New Approach for Evaluating and Optimizing Hydraulic Fracturing in Coalbed Methane Reservoirs
1 China United Coalbed Methane National Engineering Research Center Co. Ltd., Beijing, 100095, China
2 School of Petroleum Engineering, Yangtze University, Wuhan, 430100, China
3 PetroChinaCoalbed Methane Company Limited, Beijing, 100028, China
* Corresponding Author: Kai Shen. Email:
Energy Engineering 2026, 123(1), 19 https://doi.org/10.32604/ee.2025.070360
Received 14 July 2025; Accepted 29 August 2025; Issue published 27 December 2025
 View Full Text
 Download PDF
Abstract
In the development of coalbed methane (CBM) reservoirs using multistage fractured horizontal wells, there often exist areas that are either repeatedly stimulated or completely unstimulated between fracturing stages, leading to suboptimal reservoir performance. Currently, there is no well-established method for accurately evaluating the effectiveness of such stimulation. This study introduces, for the first time, the concept of the Fracture Network Bridging Coefficient (FNBC) as a novel metric to assess stimulation performance. By quantitatively coupling the proportions of unstimulated and overstimulated volumes, the FNBC effectively characterizes the connectivity and efficiency of the fracture network. A background grid calibration method is developed to quantify the stage-controlled volume, effectively stimulated volume, unstimulated volume, and repeatedly stimulated volume among different stages of horizontal wells. Furthermore, an optimization model is constructed by taking the FNBC as the objective function and the fracturing injection rate and fluid volume as optimization variables. The Simultaneous Perturbation Stochastic Approximation (SPSA) algorithm is employed to iteratively perturb and optimize these variables, progressively improving the FNBC until the optimal displacement rate and fluid volume corresponding to the maximum FNBC are obtained. Field application in a typical CBM multistage fractured horizontal well in China demonstrates that the FNBC increased from 0.358 to 0.539 (a 50.6% improvement), with the injection rate rising from 16 m3/min to 24 m3/min and the average fluid volume per stage increasing from 2490 m3 to 3192 m3, significantly enhancing the stimulation effectiveness. This research provides theoretical support for designing high-efficiency stimulation strategies in unconventional reservoirs under dynamic limits.Keywords
Coalbed methane (CBM) is a significant unconventional natural gas resource that has garnered increasing attention as an alternative energy source, particularly with the global transition toward cleaner energy options [1,2]. CBM extraction, once limited to shallow reservoirs, has gradually extended into deeper, more challenging formations. These deeper reservoirs pose a host of geological and engineering challenges, including low permeability, high in-situ stresses, complex fracture networks, and unfavorable geological conditions [3]. As a result, the need for advanced and efficient reservoir stimulation techniques, particularly hydraulic fracturing, has become a pivotal aspect of optimizing CBM recovery. However, in deeper CBM reservoirs, the effectiveness of hydraulic fracturing is often hindered by factors such as the high stress environment, poor fracture conductivity, and limited fracture propagation, which complicate the optimization process [4].
The effective evaluation of fracture network development and stimulation results is critical to understanding reservoir behavior and guiding optimization efforts. Accurate assessments of fracture effectiveness, such as fracture connectivity, conductivity, and stimulated reservoir volume (SRV) [5], are essential for improving recovery and operational efficiency; however, conventional evaluation techniques (e.g., production-based methods and pressure-transient analysis) often struggle in deep CBM settings with limited data and complex fluid structure interactions [6]. Although microseismic stimulated reservoir volume (SRV) is widely used, it is a geometric surrogate constructed from microseismic event clouds and can include non-flowing volumes [7]; as such, SRV may not reflect the portion of the reservoir that contributes to production. In addition, uncertainties in event locations and assumptions used to bound microseismic clouds can inflate SRV and even double-count overlapping regions, limiting SRV’s reliability as a stand-alone performance indicator [8]. To evaluate what matters for flow, we adopt an Effective Stimulated Reservoir Volume (ESRV)-based perspective and focus on the effective seepage region—the subset of the stimulated rock that contributes to production—consistent with recent ESRV literature [9].
Complementing these field-based evaluations, a substantial body of fracture-propagation simulation studies provides the mechanistic context for stimulation design. Starting from pseudo-3D (P3D) fracture models [10], prior work established viscosity- vs. toughness-dominated regimes and showed that stress contrast, elastic layering, and leak-off jointly govern height containment and lateral extension—findings especially relevant to deep CBM where strong anisotropy often limits vertical growth. Building on this continuum baseline, fully coupled FEM with cohesive/traction–separation laws resolves initiation and tip advance across bedding and cleat sets, capturing rate/viscosity effects, pressure-dependent leak-off, and poroelastic stress reorientation that can suppress or enable branching under high in-situ stresses [11]. Discrete-fracture modeling (DFM) then makes individual discontinuities explicit, allowing network growth rules to quantify stress-shadow interactions, coalescence, and percolation thresholds that control effective drainage and post-frac connectivity in heterogeneous coal [12]. Finally, XFEM enriches the displacement field to nucleate, kink, and merge multiple cracks without remeshing, efficiently representing cleat-guided branching, contact/closure, and aperture degradation (e.g., under adsorption-induced swelling), thereby linking propagation pathways to flow capacity more directly [13]. However, most implementations still idealize fractures as simple straight (bi-wing) planes rather than explicit, complex multi-branching networks, thereby limiting their ability to assess connectivity-driven performance.
Beyond conventional water-based hydraulic fracturing, several waterless or low-water stimulation routes have been proposed with a stronger environmental profile. Liquid-nitrogen (LN2) cryogenic fracturing relies on large thermal gradients and shock to initiate and extend microcracks; OpenCV-based image analysis at the sample scale quantifies total crack area (TCA), total number of cracks (TNC), crack density (CD), and length statistics, showing that TCA generally increases with longer freezing times, whereas CD rises markedly after multiple freeze–thaw cycles [14,15]. Another anhydrous/low-water option is CO2-based stimulation (supercritical CO2 and CO2-foam), which can mitigate water sensitivity, improve fracture complexity and flowback, and potentially synergize with ECBM; however, its phase behavior and foam stability are temperature–pressure dependent, and issues such as proppant transport, coal swelling due to CO2 adsorption, corrosion, and safety management must be considered [16]. By contrast, in deep CBM settings with high in-situ stresses and strong heterogeneity, conventional water-based treatments tend to generate relatively simple geometries while imposing water-use and flowback burden.
To address these limitations, advanced evaluation and optimization methods that incorporate integrated multi-disciplinary data are required. These methods should account for the dynamic nature of CBM reservoirs, including time-varying production and pressure responses, as well as the multi-scale behavior of fracture networks. Several approaches have been proposed to improve the assessment of fracture networks and stimulation effects in CBM reservoirs. For example, Zhang et al. [17] introduced a method for quantifying fracture network effectiveness by analyzing production decline curves in conjunction with fracturing pressure data, which provides insights into fracture conductivity and connectivity. Moreover, field-based techniques such as microseismic monitoring and tracer tests have been used to enhance the understanding of fracture geometry and network connectivity in CBM reservoirs [18].
Despite the advancements in these evaluation techniques, several challenges persist. These include difficulties in capturing the multi-scale, anisotropic, and time-varying behavior of fracture networks, which are critical for understanding the performance of deep CBM reservoirs over time [19]. Furthermore, the incorporation of geomechanical and petrophysical properties into the evaluation models is still under development [20].
To address these limitations, this study introduces a novel Fracture Network Bridging Coefficient (FNBC), designed to overcome the shortcomings of traditional evaluation methods by evaluating how effectively stimulated regions are hydraulically connected into percolating flow pathways and by quantifying the flow-effective stimulated volume (ESRV) to guide optimization. FNBC is a quantitative metric that integrates fracture propagation geometry, effective drainage area, and the degree of connectivity between the fracture network and the reservoir matrix. By explicitly quantifying the “bridging” effect between fractures and the underlying reservoir, this new indicator provides a more comprehensive assessment of stimulation effectiveness. Coupled with advanced numerical simulations, parameter sensitivity analysis, and real-time field data, the FNBC framework aims to deliver a more accurate and integrated methodology for evaluating and optimizing fracture networks in deep coalbed methane reservoirs. This approach is expected to provide a more reliable tool for guiding fracturing design, improving fracture propagation, and ultimately enhancing the recovery of deep and complex coalbed methane reservoirs.
2 Evaluating and Optimizing Approach for Hydraulic Fracturing
During the fracturing development of deep coalbed methane (CBM), the stimulated regions can be classified into four types [21]: (1) Natural fracture network-dominated zones, (2) Hydraulic fracture network-dominated zones, (3) Uncontrolled zones by either natural or hydraulic fractures, (4) Overlapping control zones between natural and hydraulic fractures. For clarity, the areas controlled by natural or hydraulic fracture networks are collectively termed the Effective Stimulated Reservoir Volume (ESRV). The overlapping regions between natural-artificial fractures or adjacent stage/cluster artificial fractures are defined as overstimulated reservoir volume. The total volume influenced by horizontal well fracturing is referred to as the well-controlled reservoir volume, while unmodified regions are categorized as unstimulated reservoir volume, as shown in Fig. 1.
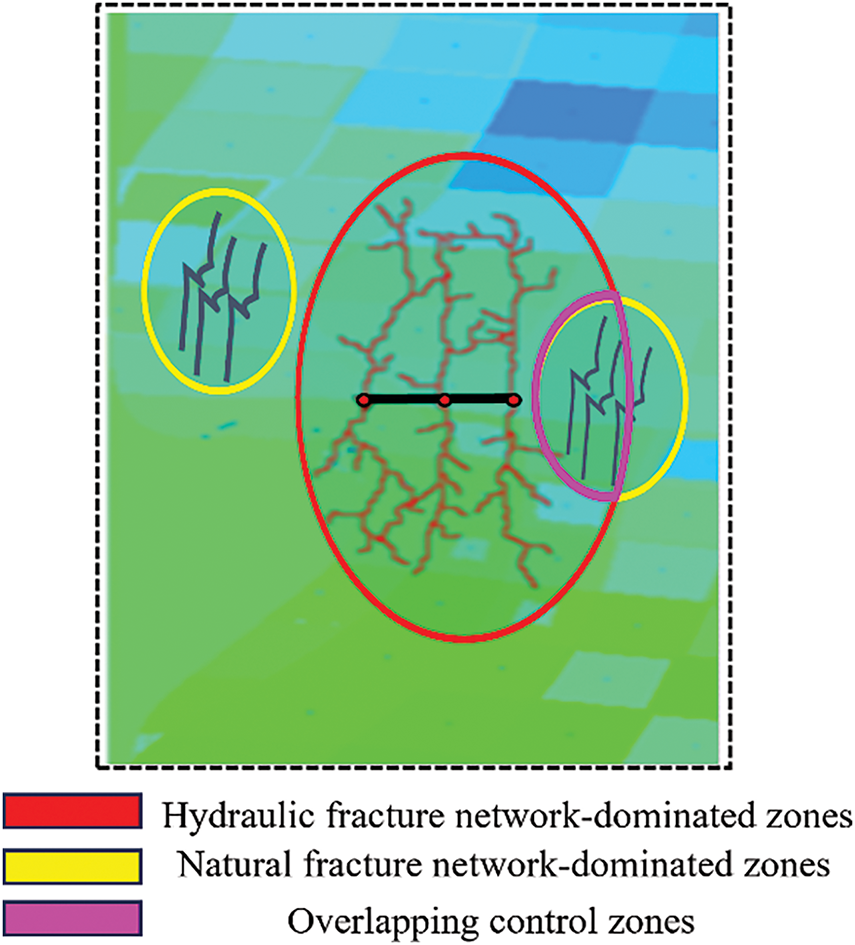
Figure 1: Reservoir four types of stimulated region in CBM reservoirs
2.1 Calculation Model of Fracture Network Bridging Coefficient
To quantitatively characterize the objective of minimizing both the unstimulated reservoir volume and the overstimulated reservoir volume, an FNBC is defined. The calculation formula is as follows:
where M is the dimensionless FNBC. Vr is the overstimulated reservoir volume in the unit of m3; Vu is the unstimulated reservoir volume in the unit of m3; Vc is the well-controlled reservoir volume in the unit of m3.
The FNBC depends on the morphological distribution of the fracture network, as shown in Fig. 2. Since the interference of hydraulic fractures and natural fractures in different stages, the effective stimulated volume and overstimulated reservoir volume influence each other. It is tough to calculate the FNBC. In this paper, the background grid is introduced, and the complex fracture network geometry into the background grid. Different kinds of volume have different values. Thus, four kinds of volume can be calculated.
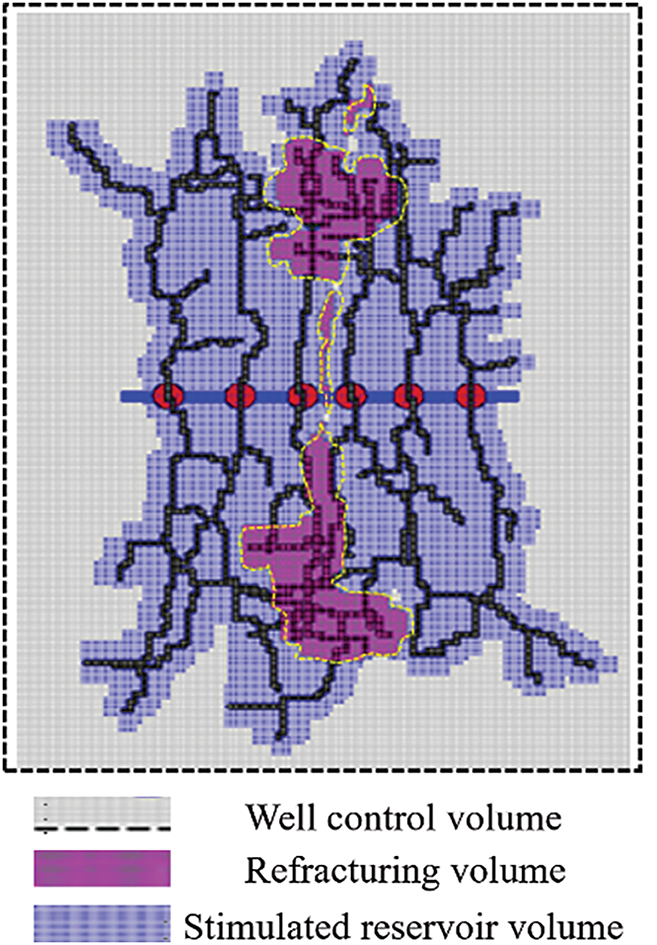
Figure 2: Reservoir stimulated volume distribution in CBM reservoirs
(1) Well-controlled reservoir volume
Well-controlled reservoir volume refers to the reservoir volume within the control range of the horizontal well. It can be calculated as:
where Nx is the grid number in the x-direction of the model. Ny is the grid number in the y-direction of the model. dx is the grid size in the x-direction of the model in units of m. dy is the grid size in the y-direction of the model in units of m. dz is the grid size in the z-direction of the model in units of m.
(2) Natural fracture network control volume
First, set all the background grid properties to 0, and then set the background property of the grid where the natural fracture network is located to 1 (as shown in Fig. 3). Therefore, the natural fracture network control volume can be calculated as:
where

Figure 3: Nature fracture characterization based on the background grid
(3) Stimulated reservoir volume
The reservoir has been fractured, and the fracture propagation simulation method simulates the distribution geometry of the hydraulic fracture network. The reservoir stimulated volume is determined by the background grid method. If the original attribute value of the hydraulic fracture network distribution grid is 0, there was no natural fracture distribution in the area. This area is the hydraulic fracturing-stimulated area. Then, the grid attribute value is set to 1. If the original attribute value of the hydraulic fracture distribution grid is 1, there were natural fractures or hydraulic fractures in the area. This area is refracturing, and the background attribute is set to 2. The background attribute of the unfractured area by natural fracture and hydraulic fracture is set to 0, as shown in Fig. 4.
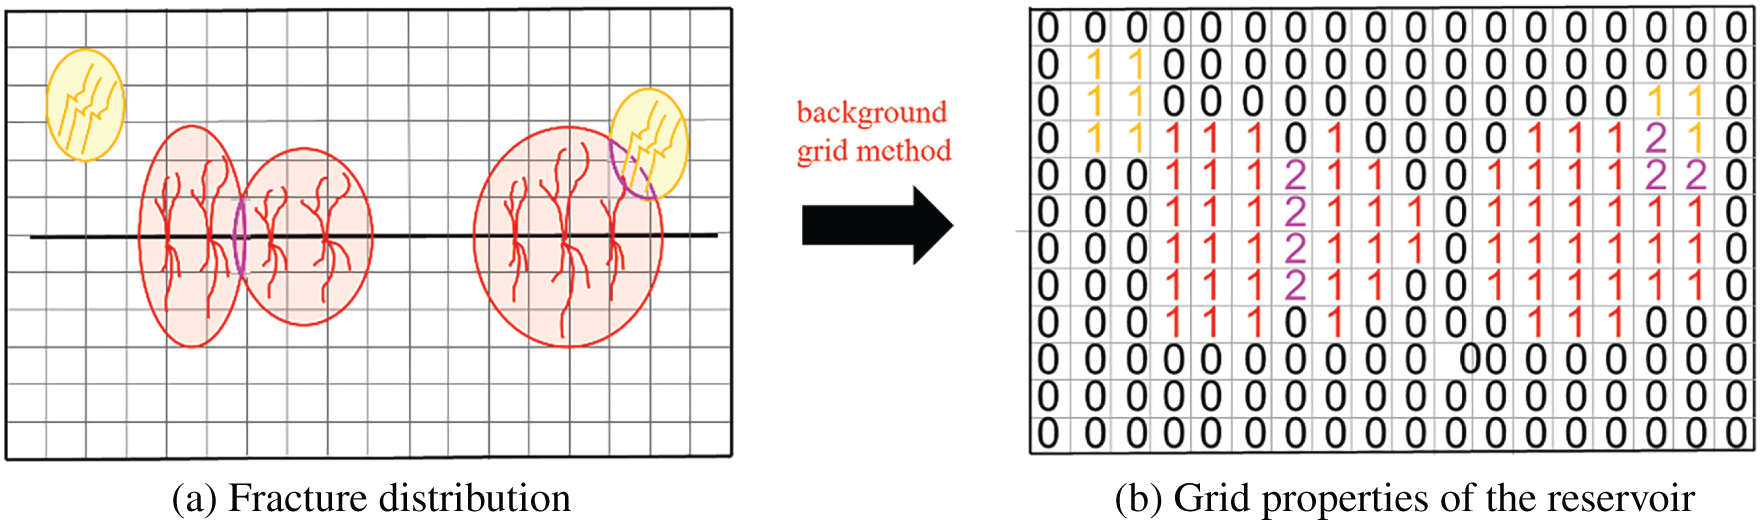
Figure 4: Fractured reservoir characterization based on background grid
The stimulated reservoir volume and overstimulated reservoir volume can be calculated based on the background grid distribution. Meanwhile, the stimulated reservoir volume can be calculated as:
where
Similarly, the overstimulated reservoir volume can be calculated as:
where
(4) Unstimulated reservoir volume
The unstimulated reservoir volume in the reservoir can be defined as:
where
The FNBC is calculated by unstimulated reservoir volume, well-controlled reservoir volume, and stimulated reservoir volume. The FNBC is the function of the distribution of the natural fracture network and the hydraulic fracture network. The hydraulic fracture network is determined by the displacement rate and fluid volume during hydraulic fracturing. The equation is as follows:
where Dn represents the geometry of the natural fracture network, Da represents the geometry of the hydraulic fracture network; P is the displacement rate in the unit of m3/min, and L is the liquid volume in the unit of m3.
2.2 Optimization Model of Fracture Network Bridging Coefficient
Building upon existing fracture network inversion methods [22], this study integrates reservoir geological parameters (e.g., lithology distribution) and rock mechanical properties (e.g., Young’s modulus, Poisson’s ratio) as fixed inputs. By adjusting engineering-controllable variables, including perforation locations, stage number, injection rate, and fluid volume, the spatial distribution of complex fracture networks can be simulated. Subsequent application of the proposed FNBC calculation method enables quantitative evaluation of key parameters: unstimulated reservoir volume, overstimulated reservoir volume, and FNBC.
The optimization workflow employs Simultaneous Perturbation Stochastic Approximation (SPSA) to maximize FNBC through injection rate and fluid volume adjustments, implemented through six systematic steps (see Fig. 5, Optimization flow chart):

Figure 5: Optimization flow chart
Step 1: Model Initialization. Input fracture positions, numbers, initial injection rates, and fluid volumes to establish a fracture propagation simulation model for deep CBM reservoirs.
Step 2: Baseline Simulation. Execute fracture propagation simulation using established methods [23], compute initial FNBC M0.
Step 3: Parameter Perturbation. Calculate perturbation gradients via the SPSA algorithm, update injection rate (
Step 4: Iterative Simulation. Re-run fracture propagation simulation with updated parameters, derive new fracture network bridging coefficient M.
Step 5: Convergence Check. If M > M0, then retain
Step 6: Termination Criteria. Output optimal parameters when either: FNCC plateaus (ΔM < 1% over 5 iterations) or the Maximum iteration count (e.g., 50 cycles) is reached.
3.1 Conceptual Model Validation
To validate the proposed method, a CBM reservoir model (542 m × 368 m) was established. The permeability and porosity distributions are illustrated in Figs. 6 and 7, respectively. A horizontal well was positioned at the model center with two initial fracture stages. The operational parameters were set at a 15 m3/min injection rate and 1650 m3 fluid volume per stage. Fracture propagation was simulated using the method proposed by Sheng et al. [24]. The different region volume was calculated by the proposed model in this work, which generated complex fracture networks with overstimulated reservoir volumes. The key reservoir and fluid properties were shown in Table 1, and gas–water relative permeability curves are shown in Fig. 8.
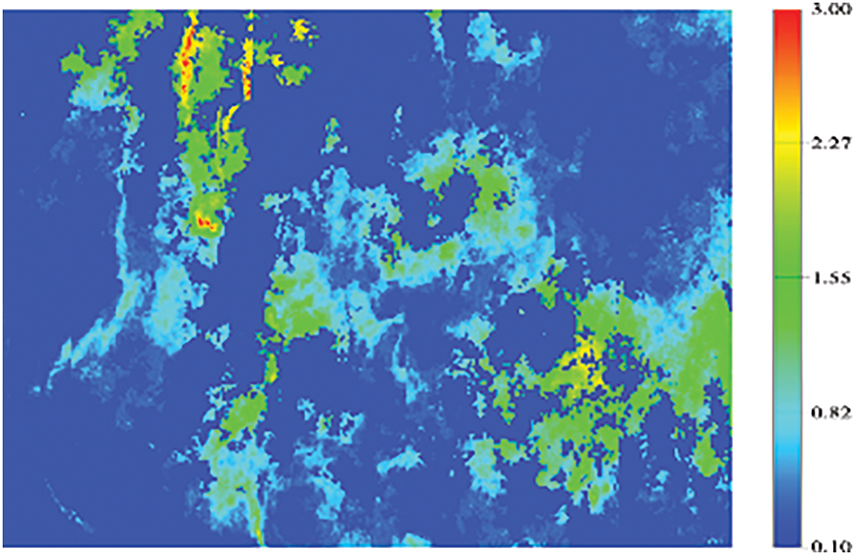
Figure 6: The permeability distribution
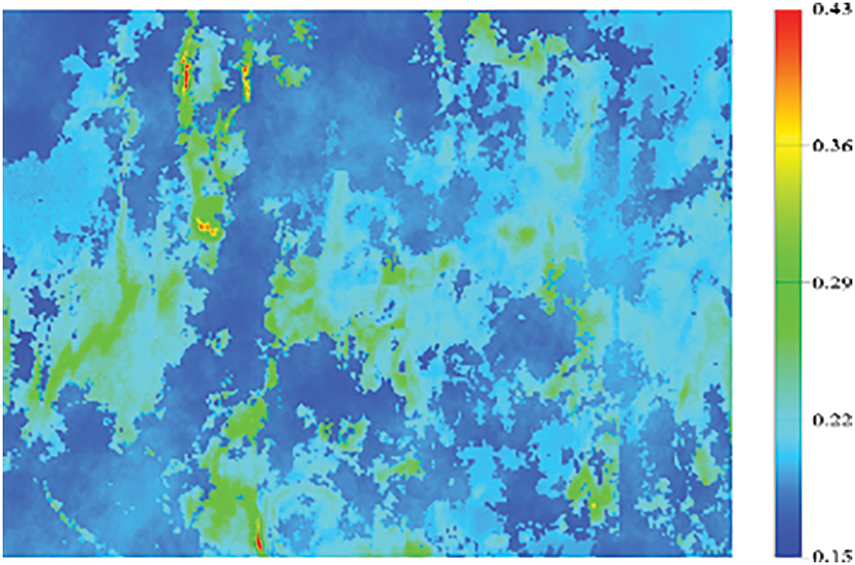
Figure 7: The porosity distribution

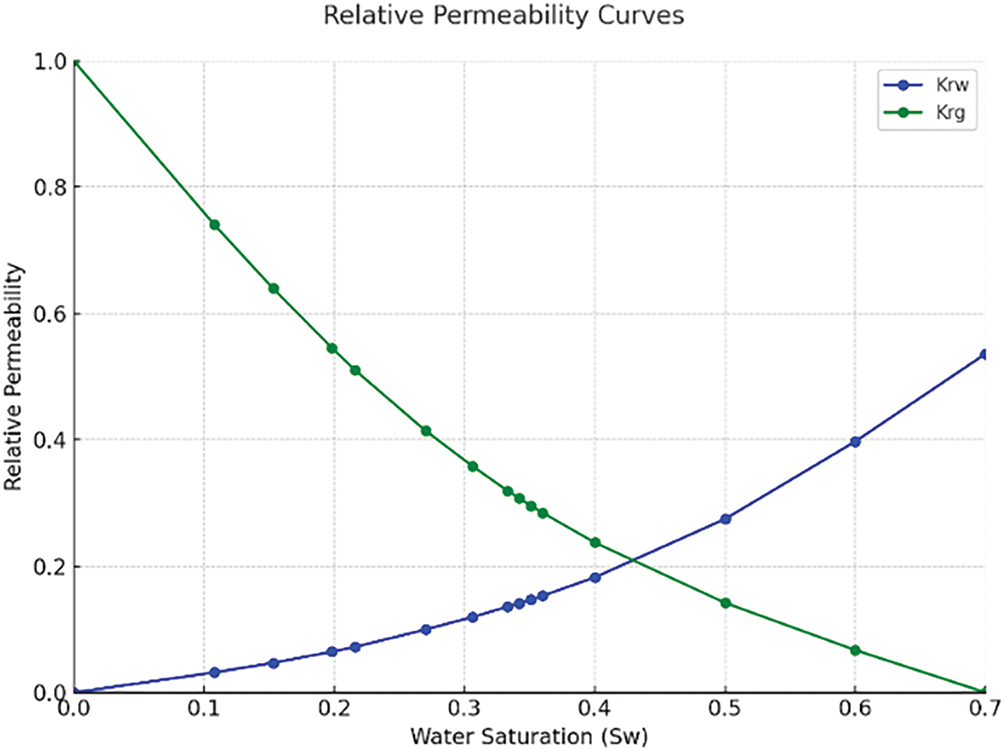
Figure 8: Relative permeability curves
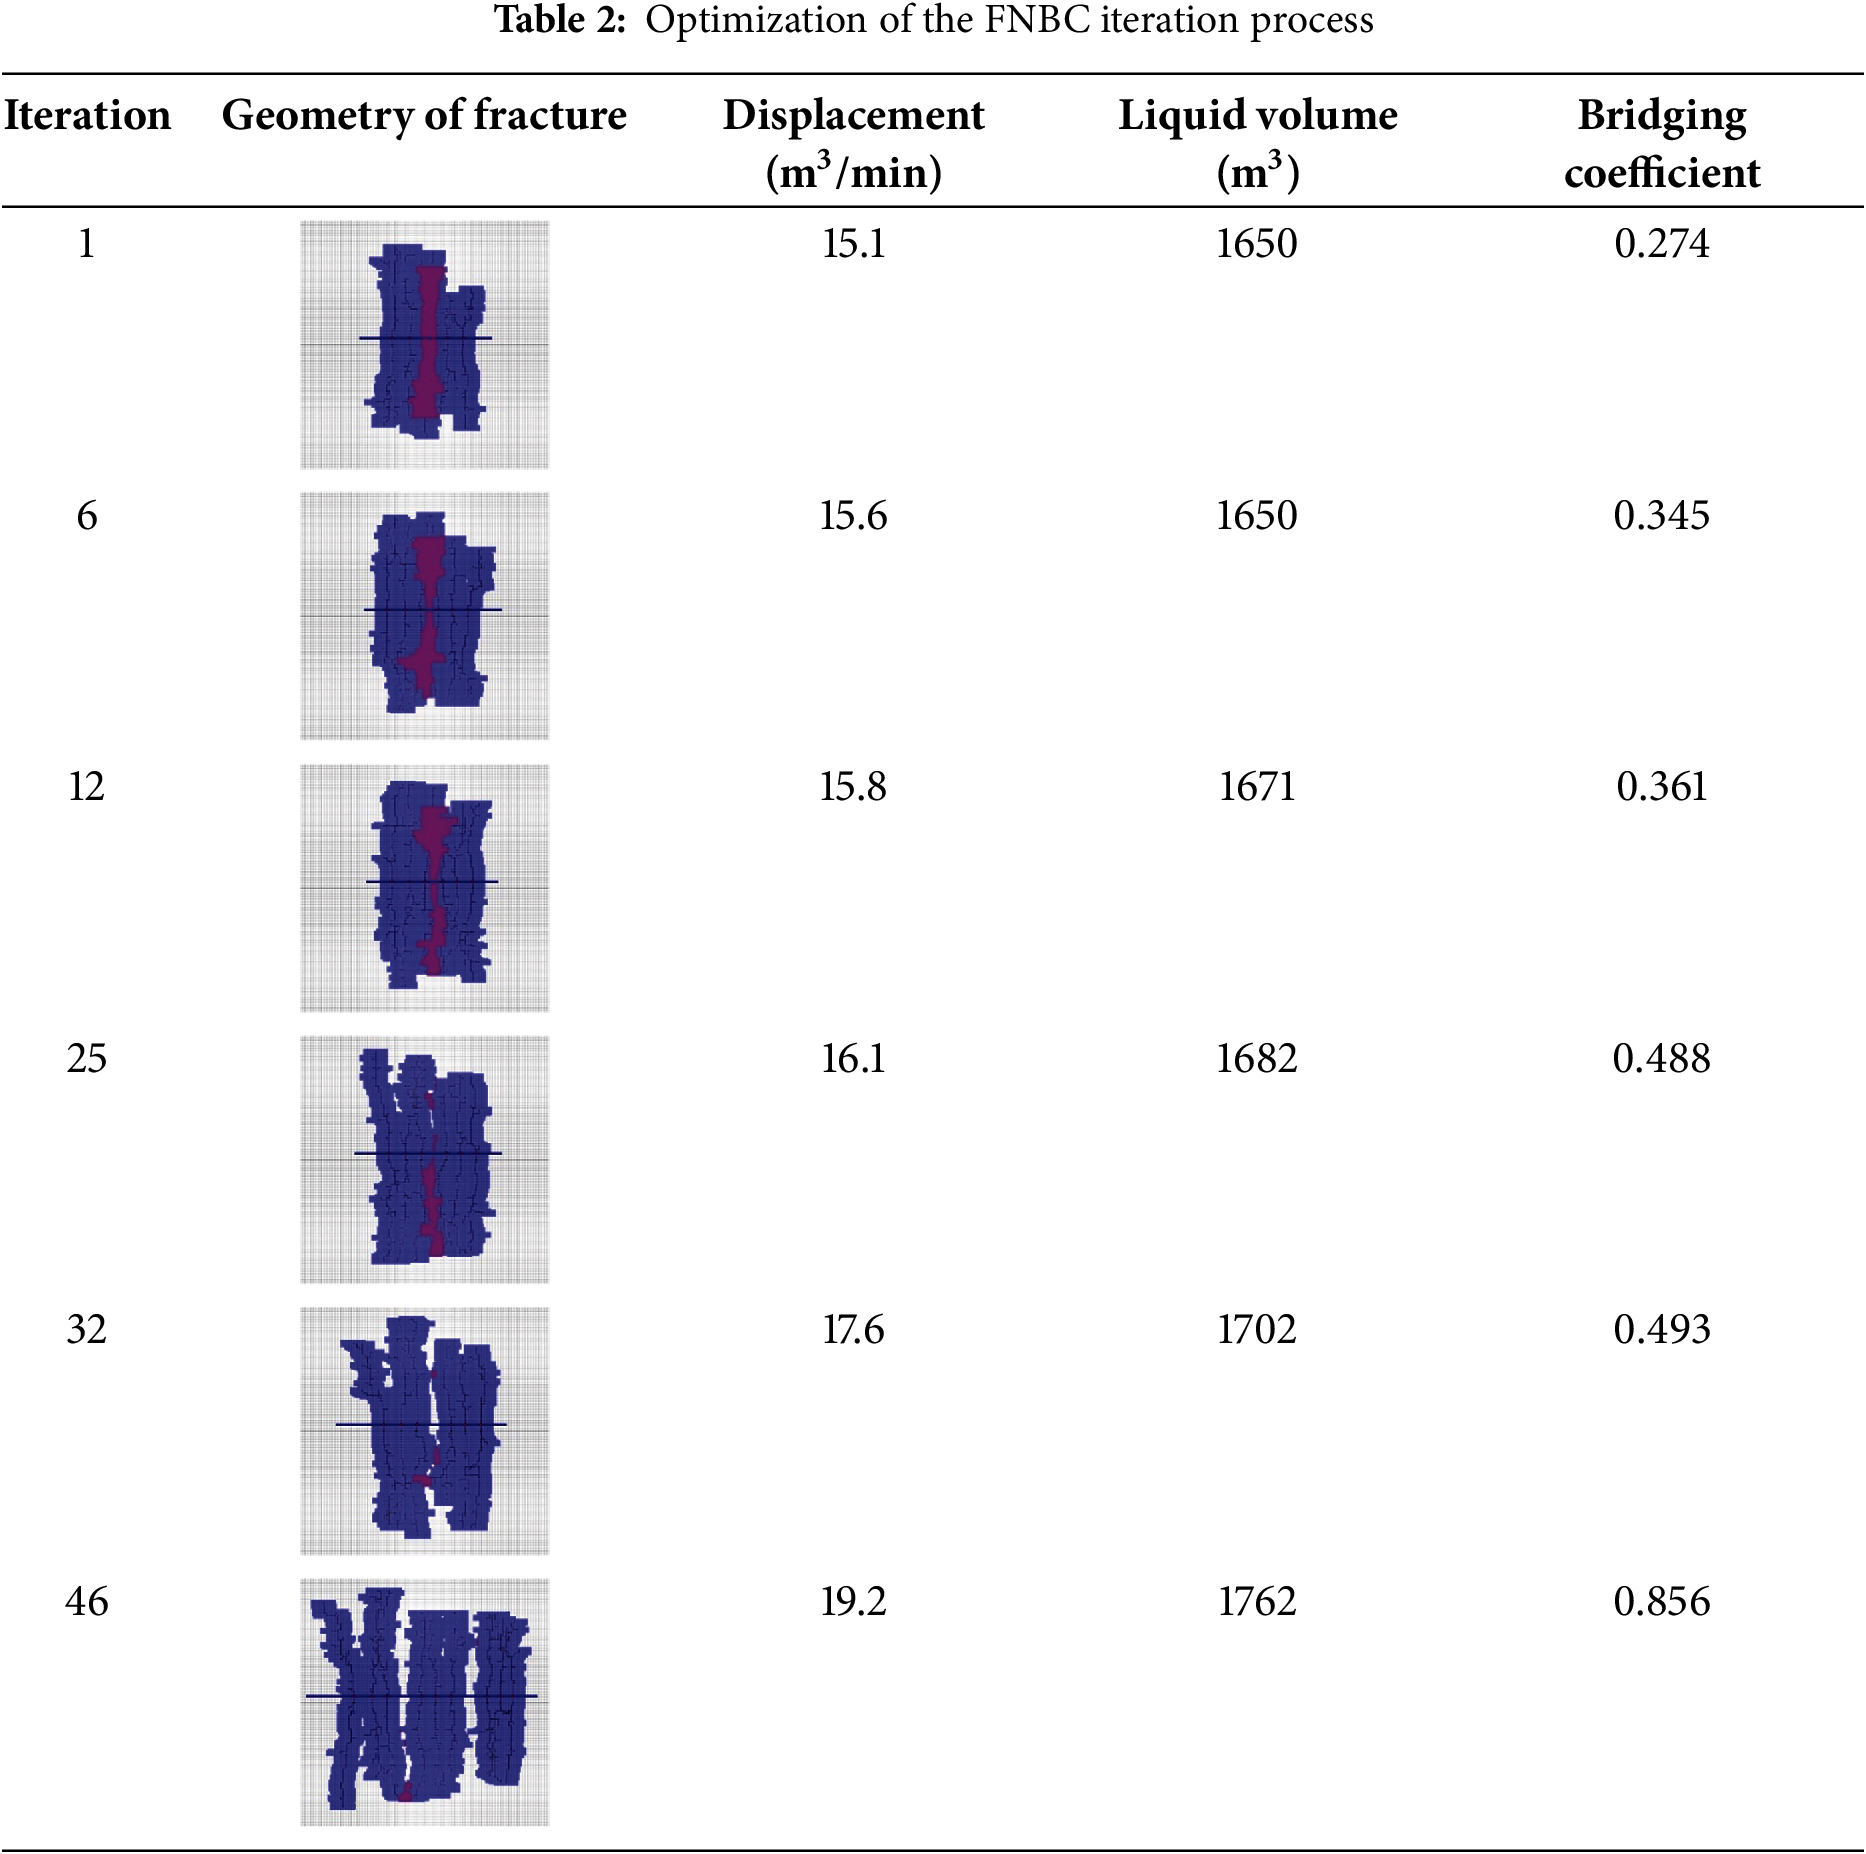
Using the proposed method for optimization, the initial fracture network bridging coefficient for the two-stage fractures was 0.274. After 32 iterations, the overstimulated reservoir volume between the two stages was nearly eliminated, resulting in a maximized effective stimulated volume and an improved bridging coefficient of 0.493. At this point, further enhancement of the bridging coefficient between the two fractures was no longer achievable. Based on the configuration of the two fractures, a third fracture was introduced at the 46th iteration. The additional stage introduced minimal repeated stimulation volume while significantly increasing the effective stimulated volume within the well-controlled area. With three fractures, the stimulated region fully covered the well-controlled volume. Further addition of fractures would result in substantial overlapping with the existing fracture network. Therefore, the optimal configuration in this model involves three fracture stages, achieving the best bridging performance. The optimal bridging coefficient reached 0.856, which is 1.48 times higher than the initial value. Correspondingly, the injection rate increased from 15.1 to 19.2 m3/min, and the fluid volume increased from 1650 to 1762 m3. The fracture network morphology at selected optimization steps, along with the corresponding injection rates, fluid volumes, and bridging coefficients, is presented in Table 2.
Compared with earlier approaches that focused solely on economic maximization and treated SRV as the optimization target [25,26], our method explicitly incorporates complex fracture morphology on top of the SRV framework, mitigating bias from inter-fracture interference and spurious intersections. This yields a more accurate SRV estimation and, consequently, improved optimization outcomes.
3.2 Field Application in Deep CBM Well
The proposed method was applied to a typical deep CBM well. Fracturing was completed in 2023 at a measured depth of approximately 3500 m, with a total horizontal length of 1350 m. Ten fracture stages were executed, each perforated with 5–7 clusters spaced 10.4–22.3 m apart. The average injection rate per stage ranged from 20.1 to 21.1 m3/min, and stage fluid volumes varied between 2450 and 3470 m3.
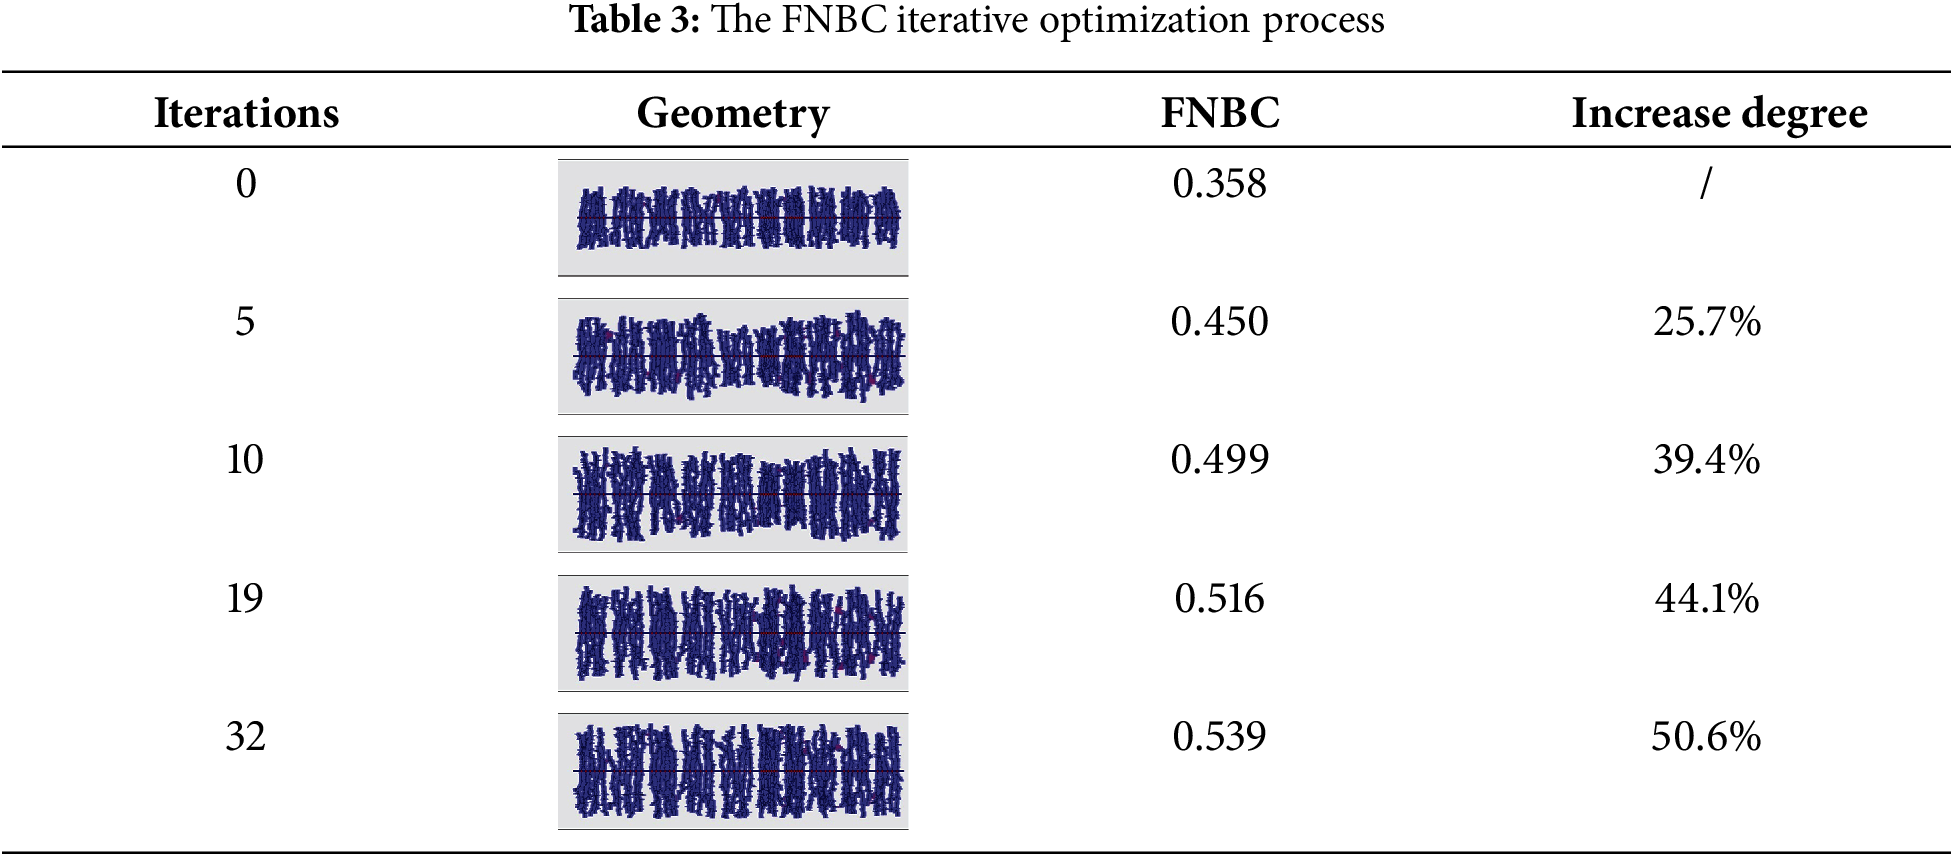
Firstly, based on the fracture propagation simulation method proposed by Sheng et al. [27], combined with the constraints of micro-seismic detection and fracturing construction curve, an expansion simulation was performed on the fracture geometry of the well. The fitting rate of the single-stage construction curve is about 95%. The average fracture length is 290 m. The result accounts for 76.5% of micro-seismic detection. The average fracture width is 127 m. The result accounts for 72.2% of micro-seismic detection. The whole fracture geometry is shown in Fig. 9, based on the fracture geometry after fracturing and considering the gas stimulated range around the fracture, the simulated volume distribution and overstimulated reservoir volume at different stages are calculated, as shown in Fig. 10, it can be seen from the figures, the total stimulated volume in the well is small, and there are overstimulated reservoir volumes among some stages. Based on the calculation method of FNBC proposed above, the current FNBC is 0.358, indicating the fracturing stimulated effect is mediocre.
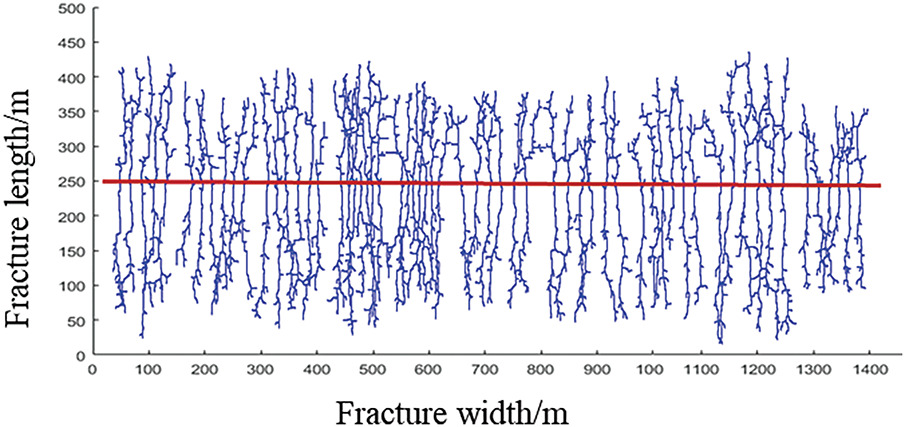
Figure 9: fracture network distribution

Figure 10: stimulated volume distribution
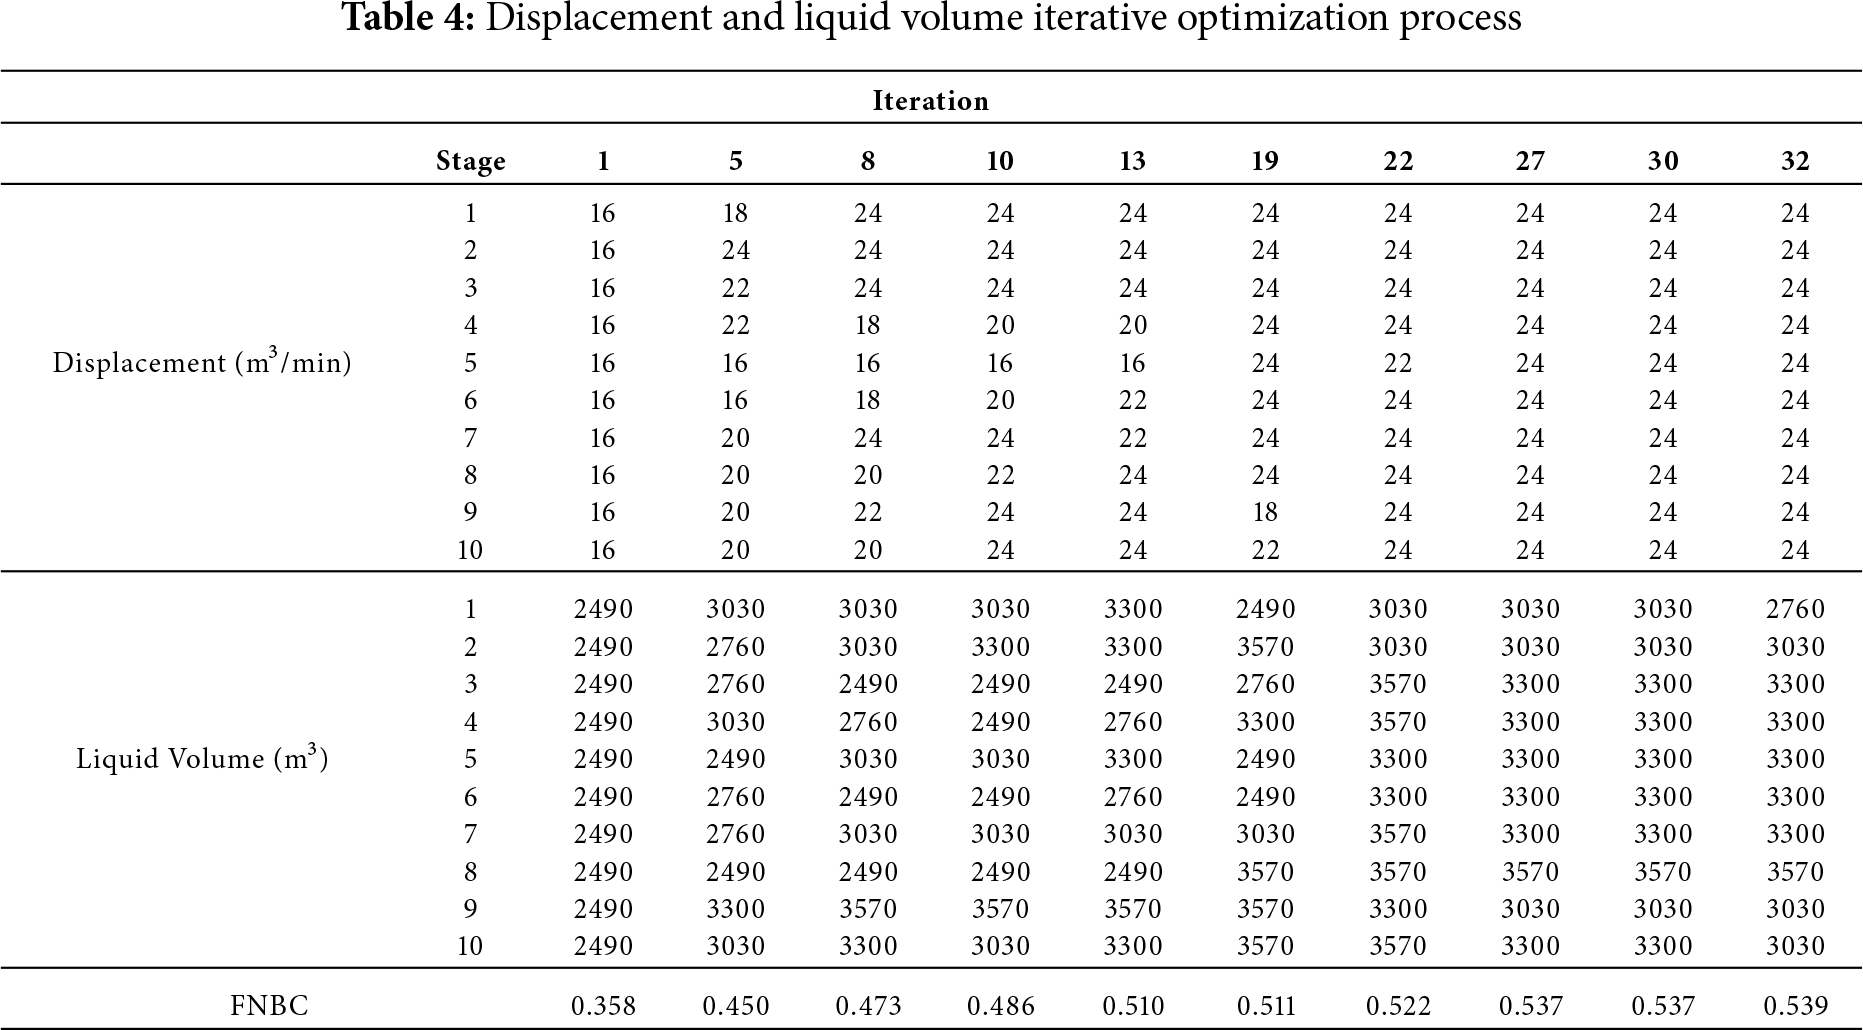
Aim at the existing fracturing scheme, taking the FNBC as the objective function, using intelligent algorithm SPSA to optimize the construction parameters, such as displacement and liquid volume, calculate the FNBC, and keep iteratively updated until finding the optimal FNBC. The initial FNBC is 0.358. Table 3 shows that after 32 steps of iterative optimization, the FNBC of the optimized fracture distribution scheme is 0.539, which is increased by 50.6%, the displacement increases from 16 to 24 m3/min, and the average liquid volume in a single stage increases from 2490 to 3192 m3 on average. The changes in liquid volume and displacement in some iterations during the optimization process are shown in Table 4.
This paper presents a novel fracturing effectiveness metric—the fracture network bridging coefficient—and builds an optimization framework for fracturing parameters. Its validity for maximizing deep CBM recovery is demonstrated through a field case study. The specific conclusions are as follows:
(1) A fracture network bridging coefficient is defined to minimize unstimulated reservoir volume and overstimulated reservoir volume, and a background-grid method is developed for its quantitative calculation.
(2) The bridging coefficient serves as the objective function, with injection rate and fluid volume as decision variables. The SPSA algorithm automatically iterates to adjust these parameters.
(3) In a typical well in CBM reservoirs, 32 optimization iterations raised the bridging coefficient from 0.358 to 0.539; injection rate increased from 16 to 24 m3/min, and average stage fluid volume rose from 2490 to 3192 m3.
The proposed FNBC-based workflow jointly optimizes economics and stimulation effectiveness under dynamic operational constraints: It reduces development capital while maximizing productivity gains and explicitly mitigates inter-fracture interference and unfavorable intersections. This provides a rigorous theoretical basis for designing efficient stimulation strategies in unconventional reservoirs.
Acknowledgement: Not applicable.
Funding Statement: The authors are grateful for the financial support from National Natural Science Foundation of China (No. 52474029). Strategic and Applied Scientific Research Project of PetroChina Company Limited (2023ZZ18, 2023ZZ18YJ04).
Author Contributions: The authors confirm contribution to the paper as follows: Conceptualization: Xia Yan, Wei Wang, and Kai Shen (corresponding author); Methodology: Xia Yan, Kai Shen, and Yanqing Feng; Software: Junyi Sun, Xiaogang Li, and Wentao Zhu; Validation: Binbin Shi, and Guanglong Sheng; Writing—review and editing: Kai Shen, Xiaogang Li, Wentao Zhu, and Binbin Shi. All authors reviewed the results and approved the final version of the manuscript.
Availability of Data and Materials: Data available within the article.
Ethics Approval: Not applicable.
Conflicts of Interest: The authors declare no conflicts of interest to report regarding the present study.
References
1. Li S, Qin Y, Tang D, Shen J, Wang J, Chen S. A comprehensive review of deep coalbed methane and recent developments in China. Int J Coal Geol. 2023;279:104369. [Google Scholar]
2. Liao Q, Wang B, Chen X, Tan P. Reservoir stimulation for unconventional oil and gas resources: recent advances and future perspectives. Adv Geo-Energy. 2024;13(1):7–9. [Google Scholar]
3. Lu Y, Zhao G, Ge Z, Jia Y, Tang J, Gong T, et al. Challenges and development direction of deep fragmented soft coalbed methane in China. Earth Energy Sci. 2025;1(1):38–64. [Google Scholar]
4. Yang F, Li B, Hao Z. Deep coalbed methane reservoir stimulation technology in shenfu block. In: International Petroleum Technology Conference; 2025 Feb 18–20; Kuala Lumpur, Malaysia. IPTC-24742-MS; 2025. [Google Scholar]
5. Yang F, Li B, Wang K, Heng W, Yang R. Extreme massive hydraulic fracturing in deep coalbed methane horizontal wells: a case study of the Linxing Block, eastern Ordos Basin, NW China. Pet Explor Dev. 2024;51(2):440–52. doi:10.1016/s1876-3804(24)60035-2. [Google Scholar] [CrossRef]
6. Chen B, Li S, Tang D. Numerical simulation study on hydraulic fracture propagation of multi-cluster fracturing of horizontal well in deep fractured coal seams. Eng Frac Mech. 2025;318:110983. doi:10.1016/j.engfracmech.2025.110983. [Google Scholar] [CrossRef]
7. Mayerhofer M, Lolon E, Warpinski N, Cipolla C, Walser D, Rightmire C. What is stimulated reservoir volume? SPE Prod Oper. 2010;25(1):89–98. [Google Scholar]
8. Vermylen J, Zoback M. Hydraulic fracturing, microseismic magnitudes, and stress evolution in the Barnett Shale, Texas, USA. In: SPE Hydraulic Fracturing Technology Conference; 2011 Jan 24–26; The Woodlands, TX, USA. SPE-140507-MS. [Google Scholar]
9. Ibrahim AU, Negash BM, Rahman MT, Suleiman A, Kwaku DD. A mathematical model for estimating effective stimulated reservoir volume. J Petrol Explor Produc Technol. 2022;12(7):1775–84. [Google Scholar]
10. Cleary MP. Comprehensive design formulae for hydraulic fracturing. In: SPE Annual Technical Conference and Exhibition; 1980 Sep 21–24; Dallas, TX, USA. SPE-9259-MS. [Google Scholar]
11. Guo J, Zhao X, Zhu H, Zhang X, Pan R. Numerical simulation of interaction of hydraulic fracture and natural fracture based on the cohesive zone finite element method. J Nat Gas Sci Eng. 2015;25:180–8. [Google Scholar]
12. Meyer BR, Bazan LW. A discrete fracture network model for hydraulically induced fractures theory, parametric and case studies. In: SPE Hydraulic Fracturing Technology Conference and Exhibition; 2011 Jan 24–26; The Woodlands, Texas, USA. SPE-140514-MS. [Google Scholar]
13. Taleghani AD. Fracture re-initiation as a possible branching mechanism during hydraulic fracturing. In: ARMA US Rock Mechanics/Geomechanics Symposium; 2010 Jun 27–30; Salt Lake City, UT, USA. ARMA-10-278. [Google Scholar]
14. Longinos SN, Abbas AH, Bolatov A, Skrzypacz P, Hazlett R. Application of image processing in evaluation of hydraulic fracturing with liquid nitrogen: a case study of coal samples from Karaganda Basin. Applied Sciences. 2023;13(3):7861. [Google Scholar]
15. Longinos SN, Serik A, Bayramov E, Junussov M, Begaliyev D, Hazlett R. Laboratory study of liquid nitrogen cryo-fracturing as an environmentally friendly approach for coalbed methane (CBM) reservoirs. Energies. 2024;17(10):2359. doi:10.3390/en17102359. [Google Scholar] [CrossRef]
16. Yang J, Lian H, Li L. Fracturing in coals with different fluids: an experimental comparison between water, liquid CO2, and supercritical CO2. Sci Rep. 2020;10(1):18681. doi:10.1038/s41598-020-75787-y. [Google Scholar] [PubMed] [CrossRef]
17. Zhang F, Damjanac B, Maxwell S. Investigating hydraulic fracturing complexity in naturally fractured rock masses using fully coupled multiscale numerical modeling Rock Mech Rock Eng. 2019;52(12):5137–60. doi:10.1007/s00603-019-01851-3. [Google Scholar] [CrossRef]
18. He X, Li J, Xu S, Hu S, Sheng M, Si L, et al. Data-driven intelligent optimization design of fracturing stage and cluster locations: a case study. In: ARMA/DGS/SEG International Geomechanics Symposium; 2024 Nov 18–20; Kuala Lumpur, Malaysia. ARMA-IGS-2024-0643. [Google Scholar]
19. Ibrahim AF. Optimizing cluster spacing in multistage hydraulically fractured shale gas wells: balancing fracture interference and stress shadow impact. J Pet Explor Prod Technol. 2024;14(7):2297–313. doi:10.1007/s13202-024-01831-6. [Google Scholar] [CrossRef]
20. Chen R, Xue X, Datta-Gupta A, Yu H, Kalyanaraman N. The impact of cluster spacing on multi-fractured well performance. In: SPE Liquids-Rich Basins Conference-North America; 2019 Nov 7–8; Odessa, TX, USA. SPE-197103-MS. [Google Scholar]
21. Han X, Tan X, Li X, Pang Y, Zhang L. Water invasion performance of complex fracture-vuggy gas reservoirs based on classification modeling. Adv Geo-Energy Res. 2021;5(2):222–32. [Google Scholar]
22. Wen Z, Tang H, Zhang L, Chen S, Zeng J, Qin J, et al. Coupled simulation of fracture propagation and Lagrangian proppant transport. SPE J. 2024;29(9):4668–83. [Google Scholar]
23. Hu X, Tu Z, Zhou F, Zhao Y, Li X, Zhou Q, et al. A hydraulic fracture geometry inversion model based on distributed-acoustic-sensing data. SPE J. 2023;28(3):1560–76. [Google Scholar]
24. Sheng G, Zhao H, Huang L, Huang H, Liu J. A real-time inversion approach for fluid-flow fractures in unconventional stimulated reservoirs. SPE J. 2024;29(2):1178–94. doi:10.2118/218001-pa. [Google Scholar] [CrossRef]
25. Alzahabi A, Berlow N, Soliman MY, AlQahtani G. Multigrid fracture-stimulated reservoir volume mapping coupled with a novel mathematical optimization approach to shale reservoir well and fracture design. J Sustain Energy Eng. 2016;4(3–4):310–34. doi:10.1002/9781119555711.ch10. [Google Scholar] [CrossRef]
26. Deng H, Sheng G, Zhao H, Meng F, Zhang H, Ma J, et al. Integrated optimization of fracture parameters for subdivision cutting fractured horizontal wells in shale oil reservoirs. J Petrol Sci Eng. 2022;212:110205. doi:10.1016/j.petrol.2022.110205. [Google Scholar] [CrossRef]
27. Sheng GL, Zhao H, Ma JL, Huang H, Deng HY, Zhan WT, et al. A new approach for flow simulation in complex hydraulic fracture morphology and its application: fracture connection element method. Petrol Sci. 2023;20(5):3002–12. [Google Scholar]
Cite This Article
 Copyright © 2026 The Author(s). Published by Tech Science Press.
This work is licensed under a Creative Commons Attribution 4.0 International License , which permits unrestricted use, distribution, and reproduction in any medium, provided the original work is properly cited.
 Downloads
 Citation Tools