
 Submit a Paper
 Propose a Special lssue
 Open Access
ARTICLE
Thin-Layer Convective Solar Drying and Mathematical Modelling of the Drying Kinetics of Marrubium vulgare Leaves
1 Department of Electrical Engineering, Institute of Technology, University Center Nour Bachir, El Bayadh, 32000, Algeria
2 Laboratory of Energetics in Arid Zones (ENERGARID), Team of Solar Resources and Its Applications, Tahri Mohamed University, Béchar, 08000, Algeria
3 Department of Material Sciences, Faculty of Exact Sciences, Laboratory of Energetics in Arid Zones (ENERGARID), Team of Solar Resources and Its Applications, University of Tahri Mohammed, Béchar, 08000, Algeria
4 Department of Material Sciences, Faculty of Exact Sciences, Laboratory for the Development of Renewable Energies and Their Applications in Saharan Areas (LDREAS), Tahri Mohamed University, Béchar, 08000, Algeria
5 Laboratory of Electronic Systems, Telecommunications and Renewable Energies, Department of Electrical Engineering, University Center Nour Bachir, El Bayadh, 32000, Algeria
* Corresponding Author: Bendjillali Ridha Ilyas. Email:
(This article belongs to the Special Issue: Recent Advance and Development in Solar Energy)
Energy Engineering 2026, 123(1), 18 https://doi.org/10.32604/ee.2025.072641
Received 31 August 2025; Accepted 11 November 2025; Issue published 27 December 2025
 View Full Text
 Download PDF
Abstract
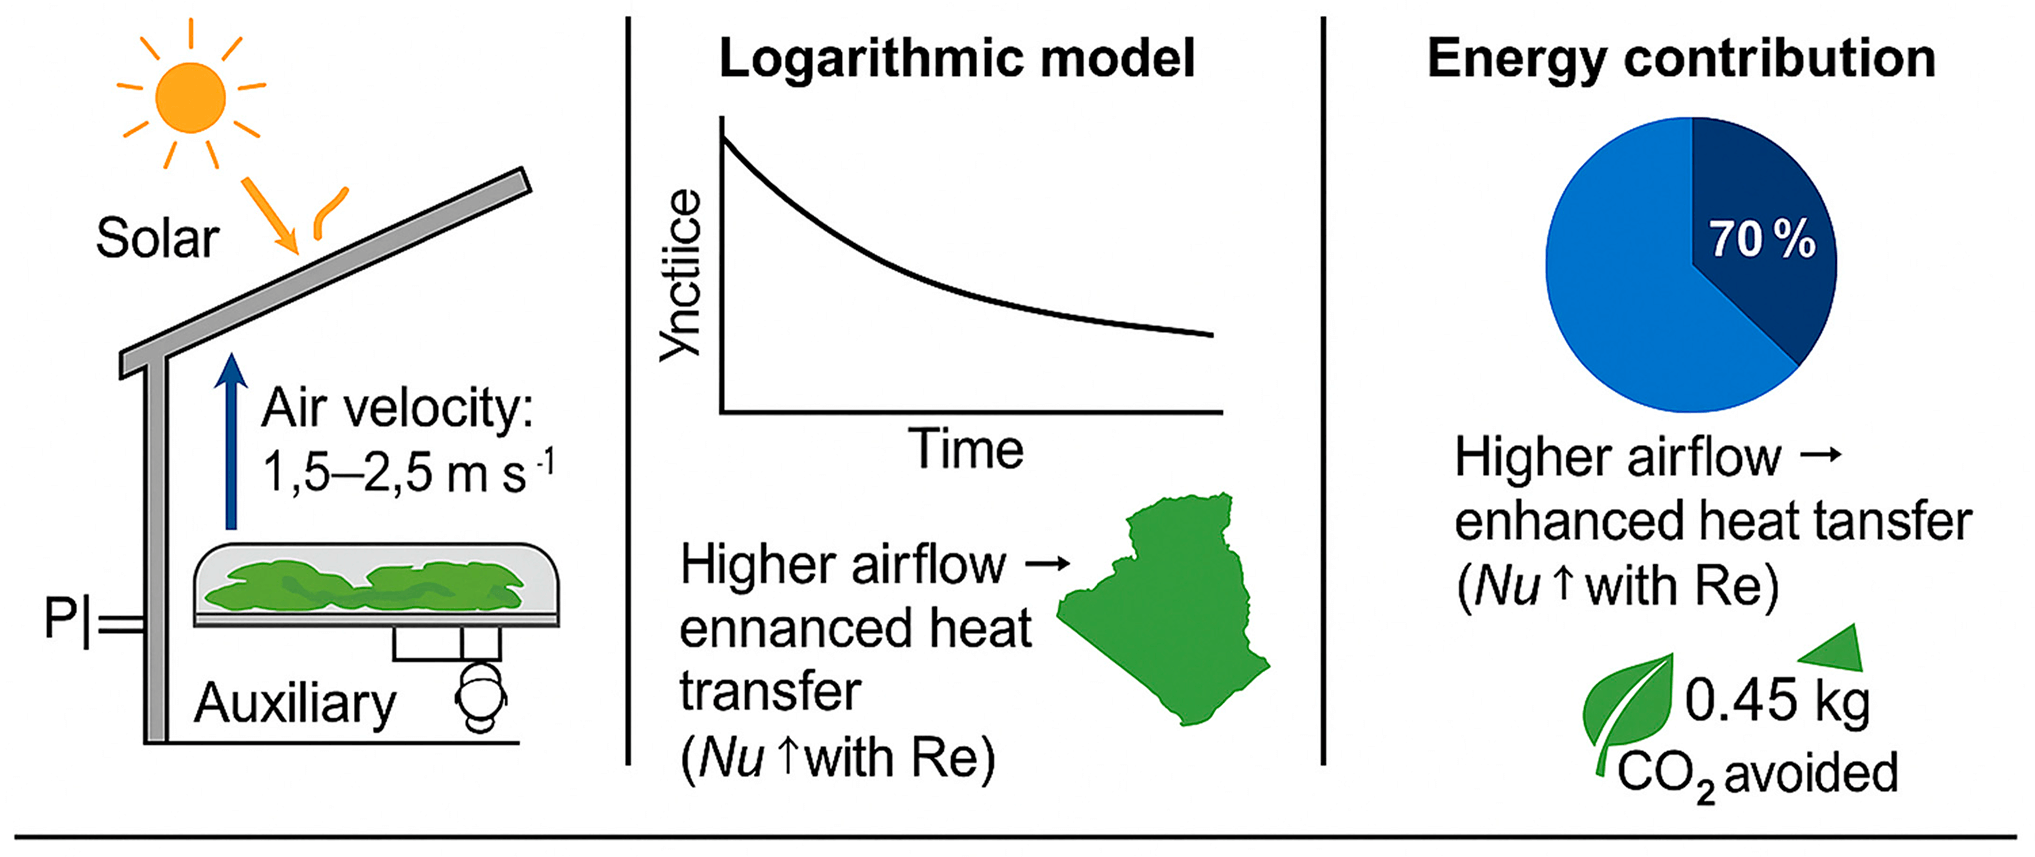
This study explores the thin-layer convective solar drying of Marrubium vulgare L. leaves under conditions typical of sun-rich semi-arid climates. Drying experiments were conducted at three inlet-air temperatures (40°C, 50°C, 60°C) and two air velocities (1.5 and 2.5 m·s−1) using an indirect solar dryer with auxiliary temperature control. Moisture-ratio data were fitted with eight widely used thin-layer models and evaluated using correlation coefficient (r), root-mean-square error (RMSE), and Akaike information criterion (AIC). A complementary heat-transfer analysis based on Reynolds and Prandtl numbers with appropriate Nusselt correlations was used to relate flow regime to drying performance, and an energy balance quantified the relative contributions of solar and auxiliary heat. The logarithmic model consistently achieved the lowest RMSE/AIC with r > 0.99 across all conditions. Higher temperature and air velocity significantly reduced drying time during the decreasing-rate period, with no constant-rate stage observed. On average, solar input supplied the large majority of the thermal demand, while the auxiliary heater compensated short irradiance drops to maintain setpoints. These findings provide a reproducible dataset and a modelling benchmark for M. vulgare leaves, and they support energy-aware design of hybrid solar dryers for medicinal plants in sun-rich regions.Graphic Abstract
Keywords
Aromatic and medicinal plants (AMPs), particularly those from desert areas, are often perceived as undervalued and neglected species, despite their significant importance. These plants are commonly used for medicinal, culinary, aromatic, and ritual purposes due to their health benefits, their ability to perfume the environment and the human body, and their role in gastronomy. For all these reasons, scientists resort to drying these plants in order to take full advantage of their beneficial properties.
Due to advances in science and technology, as well as the convenience they offer, drying techniques have diversified, allowing large quantities of products to be treated in a single day. However, a major constraint remains the high energy consumption required to carry out this process [1]. In fact, drying aromatic and medicinal plants by dehydration is an ancient practice widely used to preserve them for the production of processed goods in sectors such as perfumery, confectionery, and the pharmaceutical industry. This process involves the removal of liquid from a material through evaporation, which results in simultaneous heat and mass transfer [2,3].
Advances in drying science have made the process very beneficial for the preservation of agro-food products as well as aromatic and medicinal plants. The drying of agricultural products is an effective solution to the problem of seasonal production, which leads to surpluses at certain times of the year and shortages at others [4].
This study focuses on Marrubium vulgare L. (common horehound), a herbaceous plant belonging to the Lamiaceae family and native to south-western Algeria. The choice of this plant was motivated by its frequent use in Algeria, particularly in the western and south-western regions of the country, as well as by the importance of its botanical family, the Lamiaceae, known for their richness in secondary metabolites such as polyphenols and flavonoids. These compounds are exclusively synthesised by plants, and Marrubium vulgare L. is also known for its widespread traditional use among the local population. It is a greyish perennial plant, similar to mint, which can grow between 25 and 45 cm in height. The leaves are covered with fine hairs, measure between 2 and 5 cm in length, and have a crinkled texture. The white flowers exhibit a typical characteristic of the Lamiaceae family a square-shaped stem [5]. According to [6], the geographical distribution of Lamiaceae is cosmopolitan, encompassing all types of climates and including approximately 2500 species, particularly abundant in the Mediterranean region [7,8]. This plant is known locally as Marriouth [9].
Phytochemical studies have been conducted on the genus Marrubium. Bibliographic references, notably [10,11], have identified numerous secondary metabolites such as flavonoids, sesquiterpenes, diterpenes, triterpenes, and tannins. Horehound is widely used in herbal medicine for its expectorant, antispasmodic, and diuretic properties and for its effectiveness against respiratory infections. It is also applied in the treatment of cellulite and obesity, and several of its traditional uses have been scientifically validated; horehound is additionally recognised for its antidiabetic properties [12].
Drying temperature and airflow conditions directly affect the retention of key bioactive compounds in Marrubium vulgare L., including flavonoids, phenolic acids, and essential oils. Excessive thermal exposure above 60°C can lead to degradation of these heat-sensitive molecules, altering both the pharmacological and aromatic qualities of the product. Therefore, optimising solar-assisted convective drying parameters is essential not only for process efficiency but also for preserving the medicinal and sensory value of the dried leaves.
In Algeria, the harvesting of medicinal and aromatic plants for use in cosmetics, medicines, and flavourings for the food industry remains largely untapped, despite the abundance of plant resources found along the coast, plains, mountains, steppes, and Sahara. Most species are harvested and dried outdoors before being delivered and sold wholesale [13]. Fresh plants, with a high water content of 80% or more, are susceptible to various forms of microbial attack.
The water contained in plant tissue behaves similarly to pure water, providing a favourable environment for chemical, enzymatic, and microbial reactions that reduce the quality and nutritional value of the material. At lower moisture levels, water is more tightly bound and cannot participate in these degradation processes. Thus, it is not merely the total water content that influences deterioration, but rather the state and availability of the water within the plant matrix. A reduction in water availability through drying prevents such degradative reactions [14].
Water plays a crucial role in many alteration mechanisms, including biochemical and biophysical changes, enzymatic reactions, and microbial growth. Shelf life can therefore be significantly extended by reducing water activity, regardless of the technique used drying, salting, etc. The drying process improves product quality, extends shelf life, and facilitates further processing. Extensive research has been devoted to improving drying performance in the agri-food sector [15]. This operation aims to optimise both energy efficiency and the preservation of the quality of the dried product. In this context, solar drying represents a particularly suitable alternative for countries that lack conventional energy resources but enjoy high solar irradiance throughout the year.
Recent developments in thin-layer drying emphasize rigorous model benchmarking and energy-aware design. Contemporary assessments highlight the importance of reporting uncertainty (95% confidence intervals), RMSE and AIC rather than relying solely on correlation coefficients when comparing empirical and semi-empirical models across herbs and agricultural products. In parallel, solar-dryer research increasingly leverages flow/thermal analysis (including CFD or greenhouse-dryer studies) to improve air-distribution uniformity and mitigate irradiance variability, which directly impacts kinetics and energy use. These trends motivate our combined kinetics–heat-transfer–energy framework: we benchmark eight canonical thin-layer models under controlled temperature and air-velocity set-points and explicitly quantify the solar vs. auxiliary heat split [16,17].
Recent studies highlight significant advancements in solar drying technologies, especially the application of clay-based solar dryers. Kherrafi and Benseddik [18] reported that this technology offers improved efficiency and economic feasibility for drying medicinal plants such as Moringa and Mint. Fig. 1 shows a sample of Marrubium vulgare L. leaves used in the experiment, collected from the Moughel region in southwestern Algeria, which were then subjected to the drying process.

Figure 1: Leaves of common horehound (Marrubium vulgare L.) with (experimental sample)
In this study, the drying behaviour of Marrubium vulgare L. leaves was investigated under forced convection using an indirect, solar-assisted thin-layer dryer. Particular attention was given to the effects of air temperature and velocity on moisture removal and energy efficiency. The research aims to provide a deeper understanding of the drying kinetics of this medicinal plant and to identify the most suitable thin-layer model to describe its behaviour, thereby contributing to optimized solar-drying processes in sun-rich regions.
The Marrubium vulgare L. plant was harvested in the Moughel region, located in the wilaya of Béchar, in south-western Algeria, under dry weather conditions. The product was carefully stored under controlled ambient conditions in terms of temperature (not exceeding 25°C) and humidity during transport to the laboratory to prevent any possible deterioration. Before each experiment, the leaves were detached from the stems and any dry or damaged parts were removed. The initial moisture content of the freshly harvested Marrubium vulgare L. leaves was 76.2 ± 0.8% (wet basis), corresponding to 3.20 kg water·kg−1 dry matter. After drying, the equilibrium storage moisture content threshold for the dried leaves was maintained below 10% (wet basis) to ensure stability and prevent microbial growth.
2.2 Experimental Equipment Used
The experimental setup was installed on the rooftop of the Renewable Energy Research Laboratory at Tahri Mohamed University, Béchar (31.62° N, 2.22° W), located in southwestern Algeria. The site is characterized by high solar irradiance and low ambient humidity, providing suitable conditions for solar-assisted drying experiments. The experimental device used to study the drying kinetics is an indirect forced-convection solar dryer, as shown in Fig. 2. It consists of a single-circulation flat-plate air collector that serves as a hot-air generator, coupled with a drying chamber composed of two main units. The first is a heating unit with external dimensions of 80 × 44 × 53.5 cm and internal dimensions of 75 × 40 × 49.5 cm, while the second is a parallelepiped-shaped drying unit measuring 81 × 81 × 55 cm, one of whose sides is removed to allow the passage of heated air from the heating chamber.
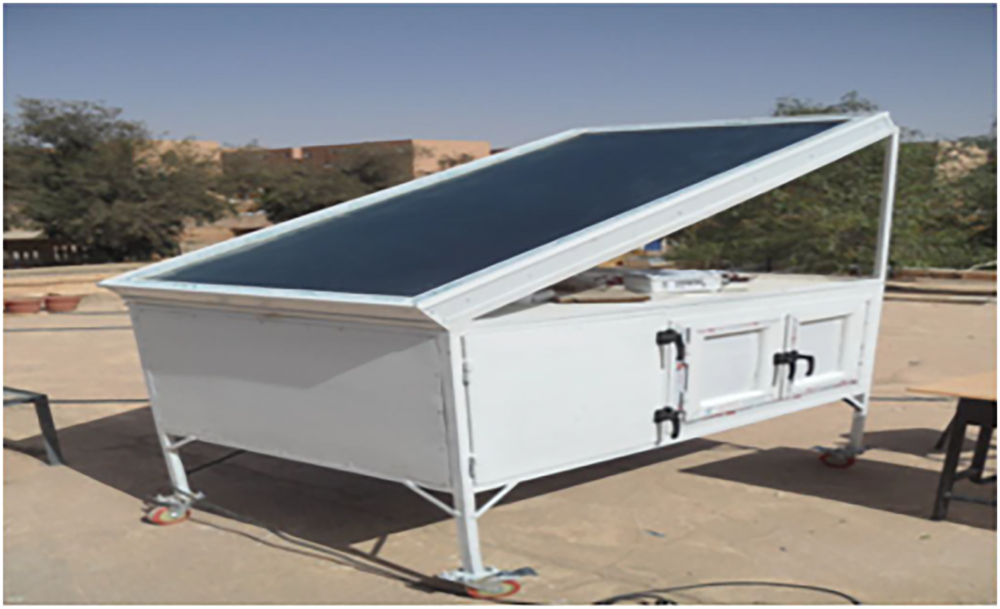
Figure 2: Solar dryer used
The outer walls consist of galvanized sheet metal, insulated with a 6 cm (4 + 2 cm) layer of polystyrene to reduce heat loss to the environment. Inside the chamber, eight racks (arranged in four stacked pairs) hold the samples to be dried, with 10 cm spacing between each rack to ensure uniform airflow. Four ventilators equipped with a variable-speed controller regulate the air circulation. A backup power source ensures continuous operation during periods of low solar radiation, and all components are managed through an integrated control box. A removable metallic frame holds the sensors and supports both the heating and drying units, facilitating calibration and maintenance. As shown in Fig. 3, a synoptic diagram provides a simplified view of the solar dryer system, illustrating the components and their connections.
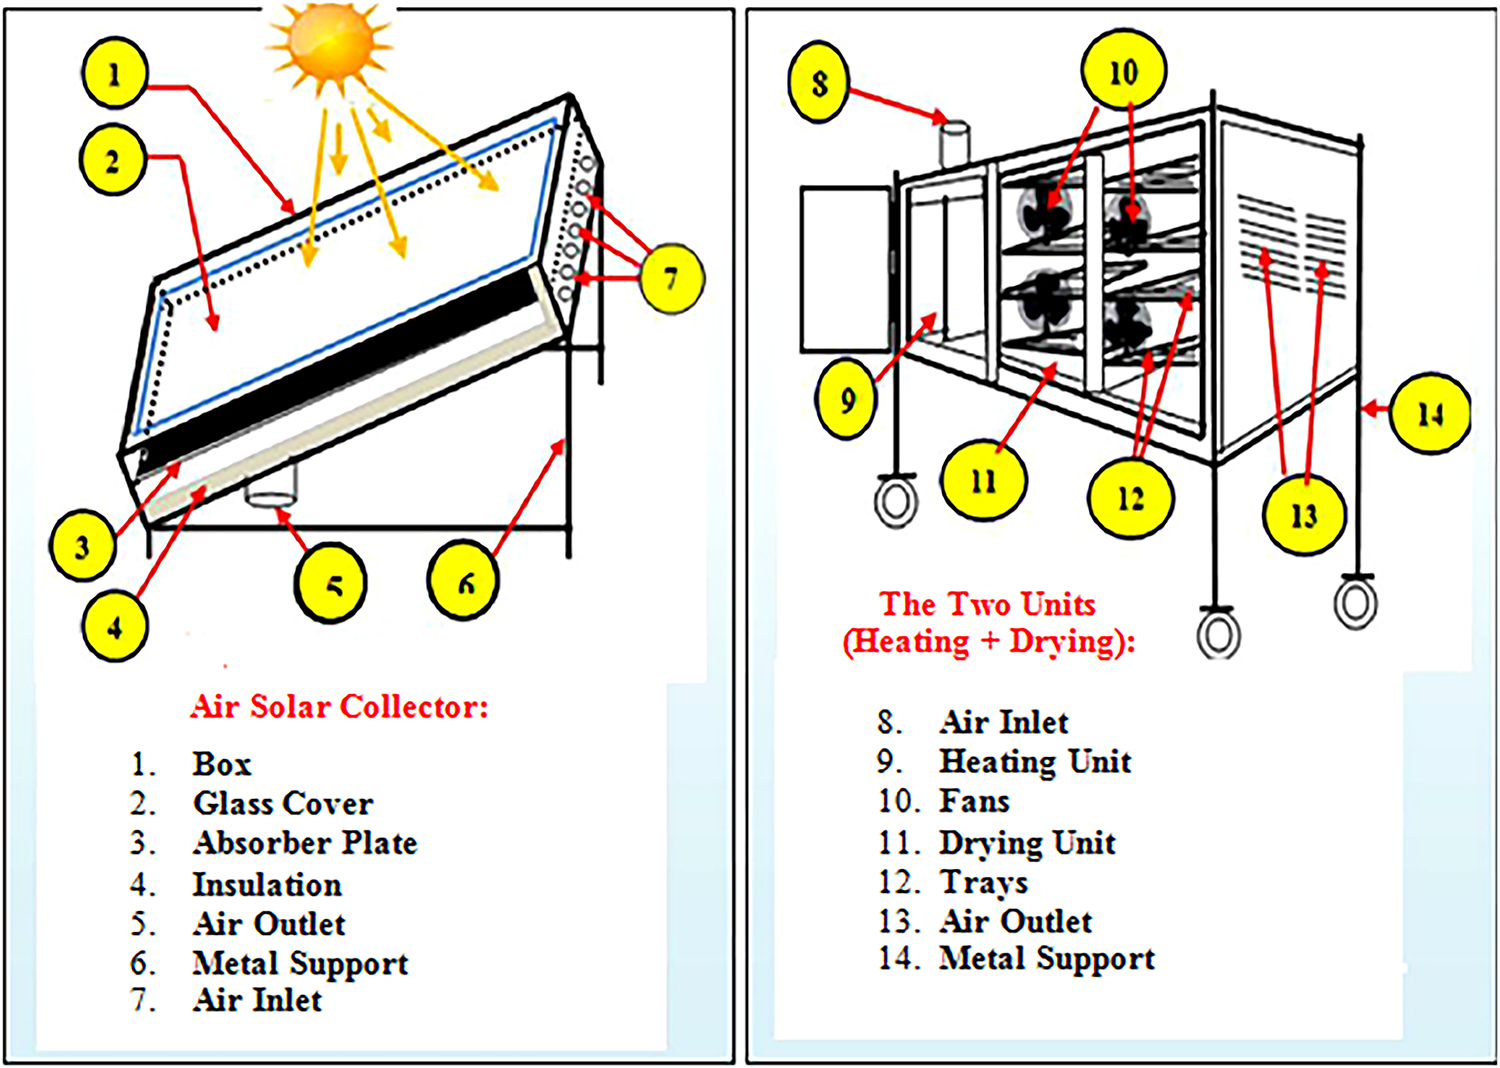
Figure 3: Synoptic diagram of the solar dryer
Airflow Uniformity
To ensure uniform air distribution across all trays inside the drying chamber, A honeycomb grid and perforated baffles were installed at the collector outlet to ensure uniform air distribution. Air velocity was measured at multiple locations using a hot-wire anemometer, and the variation between trays did not exceed ±5%, confirming uniform flow conditions throughout the drying chamber. This configuration ensured consistent heat and mass transfer across all leaf layers during the drying process.
(a) Solar Collector Description
The flat-plate solar air collector was built with an aluminum absorber plate (1 mm thick, 1.2 × 0.8 m) coated in matte black paint (absorptivity ≈ 0.95, emissivity ≈ 0.88). The insulation consisted of 6 cm EPS (λ ≈ 0.035 W·m−1·K−1), with a single 4 mm glass cover. The airflow duct (height = 0.04 m, width = 0.12 m) provided a hydraulic diameter of 0.06 m. A variable-speed DC fan maintained air velocities of 1.5 and 2.5 m·s−1.
(b) Temperature Control
An auxiliary electrical heater regulated inlet temperature (±2°C tolerance) using a PID controller linked to a K-type thermocouple. The heater activated only when solar radiation dropped below 650 W·m−2.
(c) Sample Preparation
Leaves were cut to uniform size and spread in a single thin layer (2 mm ± 0.3 mm thick) over the tray surface (15 × 20 cm). A 20 g sample ensured non-overlapping coverage and consistent heat–mass transfer.
Each tray contained a single uniform layer of approximately 20 g of Marrubium vulgare L. leaves. The leaves were evenly spread to avoid overlapping and to ensure uniform airflow and heat–mass transfer conditions across all trays. The trays were labeled T1 to T8 to maintain consistent sampling and data tracking during each drying run.
(d) Equilibrium Moisture Content
Equilibrium moisture (Xeq) was estimated using the GAB model fitted to Marrubium vulgare L. sorption isotherms. The simplified form MR = X/X0 was validated since Xeq < 1% X0 at 60°C.
Air velocity was measured using a hot-wire anemometer (accuracy ± 0.1 m·s−1), and air temperature was monitored by K-type thermocouples (±1°C) connected to a digital data-logging system. Ambient temperature and relative humidity were recorded using a calibrated digital thermo-hygrometer (±0.5°C; ±2% RH). The sample mass was measured with a precision analytical balance (readability 0.001 g). Solar radiation was monitored with a standard pyranometer, while the auxiliary electrical heater (500 W) was controlled by a PID temperature regulator to maintain constant inlet air temperature. All sensors were calibrated before testing, and each drying run was repeated three times to ensure repeatability within ±3% deviation.
2.4 Statistical Analysis and Uncertainty
All parameters were estimated using nonlinear least-squares regression. The goodness of fit of the drying models was evaluated using the root mean square error (RMSE) and the Akaike information criterion (AIC):
where N is the number of experimental observations and k is the number of model parameters.
Experimental uncertainty was quantified using standard error-propagation, assuming independent measurement errors in temperature, air velocity, and geometry. For any derived quantity
Confidence intervals for the fitted parameters were obtained from the parameter covariance matrix using the Student’s t-distribution at the 95% confidence level.
During all experiments, the ambient laboratory temperature ranged between 28°C and 34°C, with a relative humidity of 20%–25%, measured using a calibrated digital thermo-hygrometer (accuracy ±2% RH, ±0.5°C). These conditions reflect typical Saharan indoor environments in Béchar, southwestern Algeria. Uncertainties in the airflow velocity and temperature measurements were estimated at ±0.1 m·s−1 and ±1°C, respectively, based on repeated instrument calibration checks.
3 Protocol and Experimental Measures
The leaves of Marrube vulgaire, Fig. 4, are meticulously prepared inside an airtight enclosure. In fact, evaporation occurs rapidly at the leaf level due to the presence of a vapour concentration gradient between the product surface and the atmosphere. Minimizing the duration of operations involved in product preparation, dryer loading, and measurement initiation is crucial, as common horehound (Marrubium vulgar L.) leaves, are thin and prone to drying out quickly. First, it is necessary to measure the moisture content of the plant at each stage of the drying process. Measurements were taken at three different temperatures (40°C, 50°C and 60°C) on sunny days between 02 and 13 May 2023. In order to dry the plant, it is necessary to arrange the treated samples in a uniform and regular manner in a thin layer on the racks of the drying chamber. During all experiments, the temperature and drying air flow are kept constant, and the change in wet mass (Mw (t)) of the product to be dried is monitored over time by measuring its weight. During the day of the experiment, the total amount of radiation received on the sensor plane is measured in watts per square metre using a pyranometer. Eight DHT22 sensors, connected to an Arduino board, are positioned at various locations in the solar dryer to measure temperature. An anemometer is used to monitor air speed. To ensure effective drying, it is recommended that the appliance be run for at least one hour at low temperatures and for more than one hour at high temperatures before inserting the loaded racks into the drying cabinet, especially on cold days.
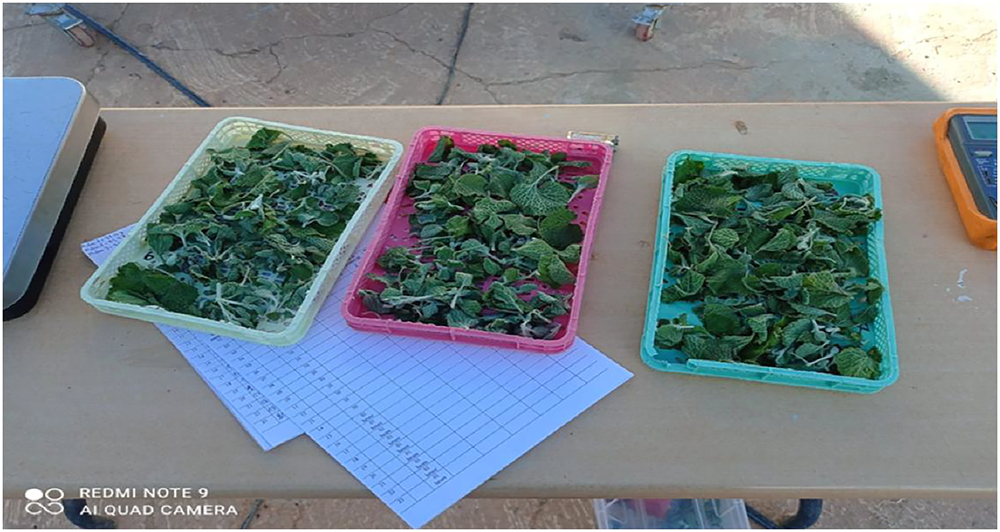
Figure 4: Samples used from the leaves of commun horehound (Marrubium vulgare L.)
The common horehound plant is extremely delicate and cannot withstand drying temperatures above 80°C (Lahsasni et al.) [19]. It was subjected to a drying process at predefined temperatures (40°C, 50°C and 60°C) controlled at the entrance to the drying cabinet using an auxiliary energy source. The drying temperature is regulated by means of an electronic thermostat. The product is prepared, weighed, and then spread in a thin layer into three samples of 20 g each on the rack of the drying chamber. The amount of product used for drying remains constant for all experimental scenarios considered in order to avoid bulk drying by processing a single layer of leaves.
3.2 Measurement of the Humid and Dry Masses of the Product
Since the device used is an actual dryer, it was not possible to install a continuous weighing mechanism inside the drying chamber due to the disturbances it would cause [16]. Consequently, the samples are weighed outside the dryer. The weighing time for three samples is approximately 60 s. During all experiments, the temperature and drying air flow are kept constant, and the change in wet mass Mh of the sample to be dried is monitored over time by successive weighings. This monitoring continues until the mass becomes constant, with direct measurements taken on a precision balance accurate to ±0.001 g every 5 min, until the wet mass of the sample reaches its final water content. At the start of each experiment, the time between two successive measurements is 5 min, before being gradually extended to 60 min at the end of the experiment. The product is then dehydrated in an oven at a temperature of 105°C for 24 h in order to calculate the dry mass (DM) of the product, following the AOAC Official Method 934.06 (2019) for moisture determination in plant materials [17]. The water content of the product at a given time (t) was determined according to the standard relation presented later in Section 5.1 (Eq. (8)).
3.2.1 Measurement of Solar Radiation
The total solar radiation received by the sensor is quantified in watts per square metre (W·m2) using a Kipp and Zonenpyranometer and CASSY LAB 2 TYPE 524010 software throughout the experimental day.
3.2.2 Measuring Temperatures and Humidity
We used eight AHT10 sensors to measure temperature and humidity changes in the solar dryer, two sensors at the inlet and outlet of the flat plate collector, and six AHT10 sensors in the drying chamber, as shown in Fig. 5 below.
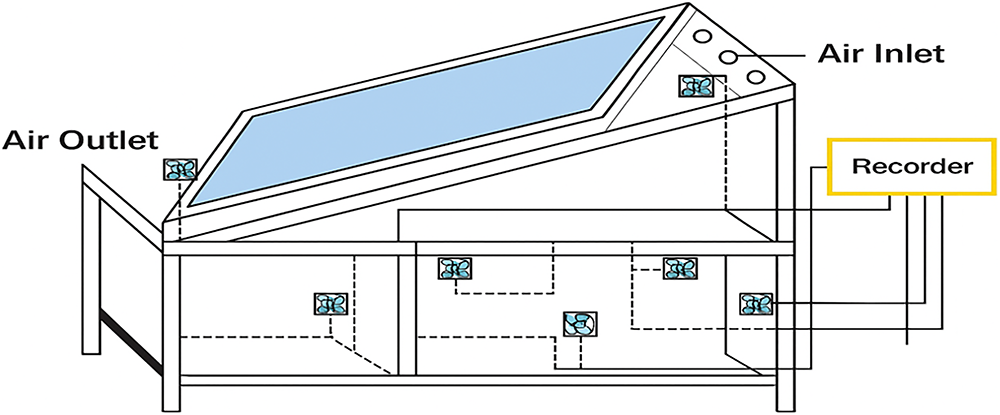
Figure 5: Temperature measurement points in the solar dryer
The tests were carried out at a constant drying temperature of between 40°C and 60°C.
The air flow velocity is measured using an electronic anemometer equipped with a GM8903 hot-wire anemometer, installed at the inlet of the duct connecting the heating chamber to the flat plate sensor.
3.3 Convective Heat-Transfer Characterization
To enhance the thermal and energy analysis of the drying process, an additional procedure was implemented to evaluate the convective heat-transfer performance of the solar dryer [20,21].
The hydraulic diameter (Dh) of the drying duct was determined as:
where A is the cross-sectional area of the duct and P is its wetted perimeter.
The airflow regime was then characterized by the Reynolds number (Re) and the Prandtl number (Pr):
where
Thermophysical properties (ρ, μ, k, cp) and the corresponding dimensionless numbers (Re, Pr, Nu) were evaluated at the film temperature, defined as:
Depending on the flow regime, the Nusselt number (Nu) was calculated using the Sieder-Tate correlation for laminar flow and the Dittus–Boelter correlation for turbulent flow, with a Gnielinski-type interpolation applied for the transitional regime (2300 ≤ Re ≤ 104).
The convective heat-transfer coefficient (h) was then obtained from:
The calculated values of the Nusselt number (Nu) were subsequently plotted against (i) the airflow velocity and (ii) the drying rate. These results, presented in Figs. 6 and 7, provide a direct quantitative link between the convective heat-transfer characteristics of the drying air and the drying kinetics of Marrubium vulgare L. leaves, thereby reinforcing the energy-efficiency perspective of this study.

Figure 6: Bubble plot of Nusselt number (Nu) vs. drying rate
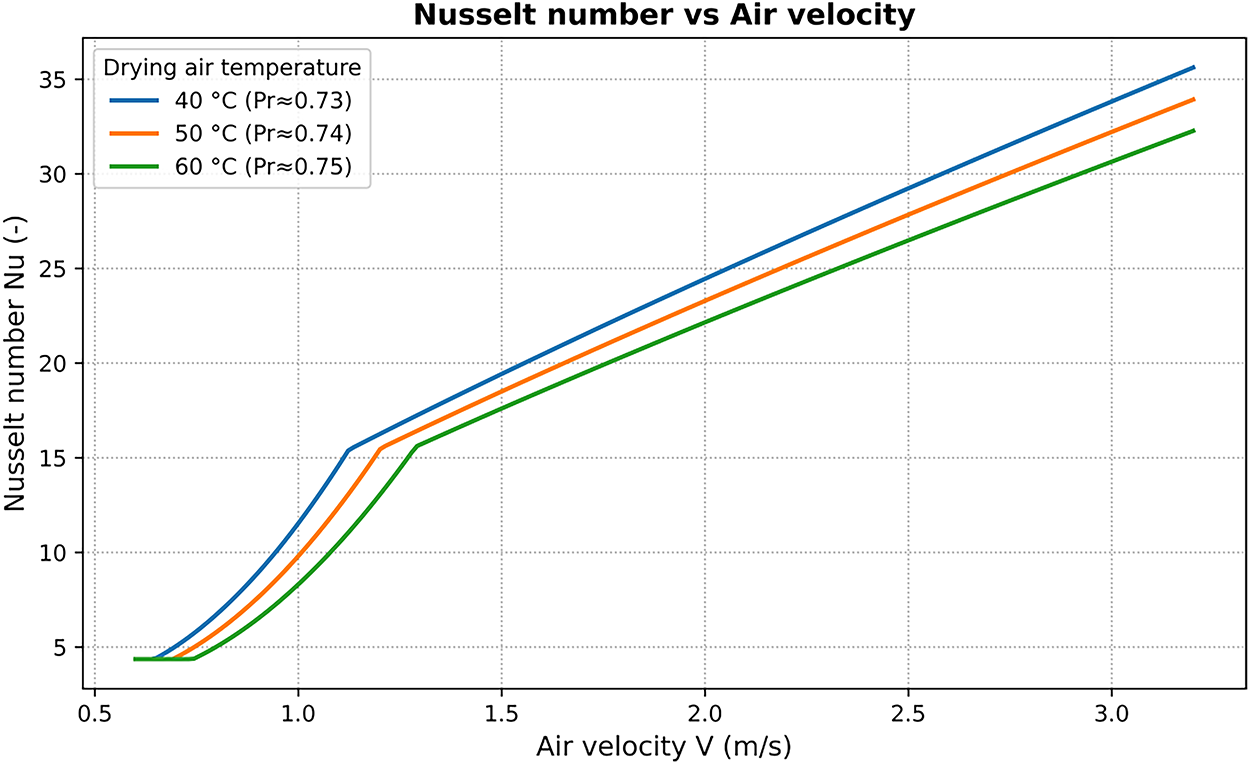
Figure 7: Variation of Nusselt number (Nu) with airflow velocity
Fig. 7 confirms that the Nusselt number increases with airflow velocity, reflecting the transition from laminar to turbulent flow regimes and the enhancement of convective mixing. Fig. 6 demonstrates a nearly linear correlation between Nu and the drying rate, highlighting that stronger convective heat transfer directly accelerates moisture removal. This quantitative link further supports the energy-focused interpretation discussed in Section 6.3.
4 Results Obtained during the Experiment Days at the Solar Dryer Level
4.1 At the Flat Solar Collector Level
Sunshine is a climatic parameter that has a significant impact on the drying process, as illustrated in Fig. 3, which shows the evolution of total sunshine during the days of the experiment. Fig. 8 presents the variation in global radiation on an inclined plane, while Fig. 9 illustrates the variation in ambient temperature.
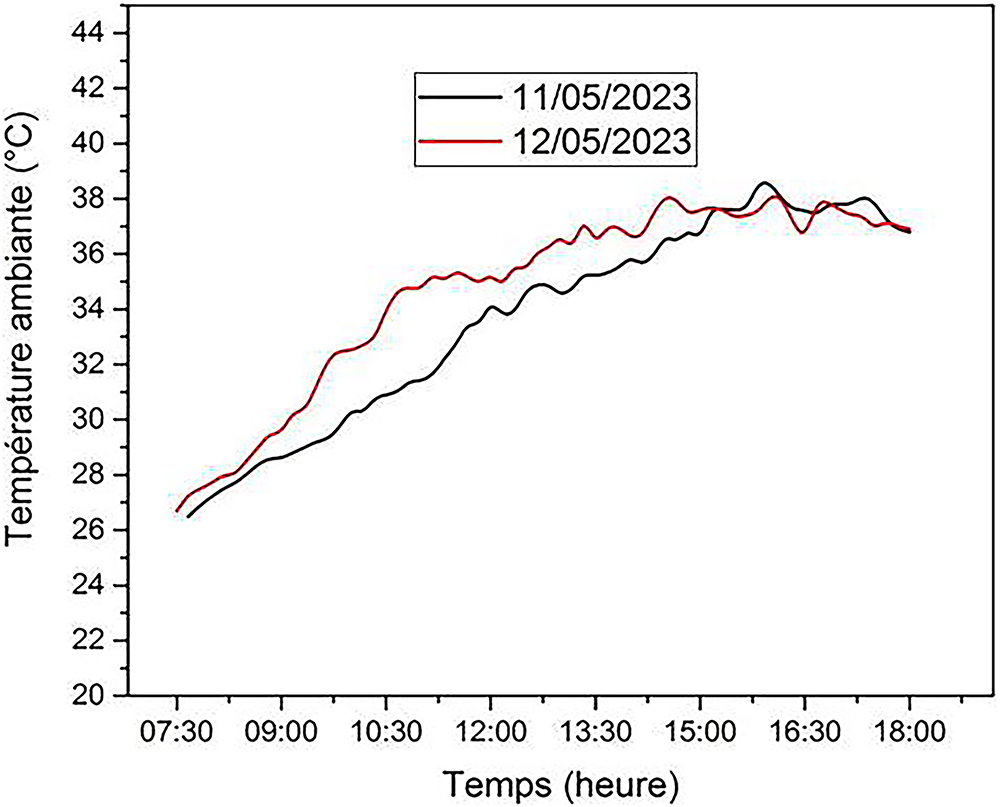
Figure 8: Variation in global radiation on an inclined plane
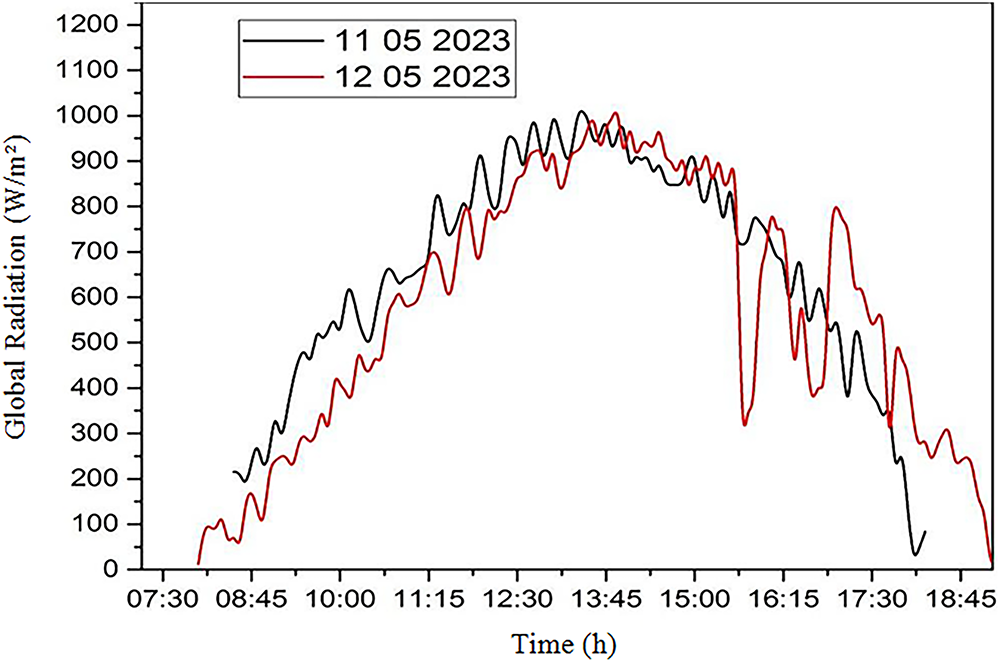
Figure 9: Variation de la température ambiante
Fig. 8 illustrates the experimental evolution of global oblique solar irradiance over these two days. It can be seen that between 8:30 a.m. and 6:00 p.m., the two curves are almost identical, but a difference appears at 3:30 p.m., attributable to the presence of recorded cloud cover. Fig. 9 illustrates the variations in ambient temperature observed on 11 and 12 May 2023, reaching their peak for three hours, from 3:00 to 6:00 p.m. Fig. 10 shows the temporal variation in sensor inlet and outlet temperatures, while Fig. 11 presents the variation in relative humidity at the inlet and outlet of the solar sensor air.
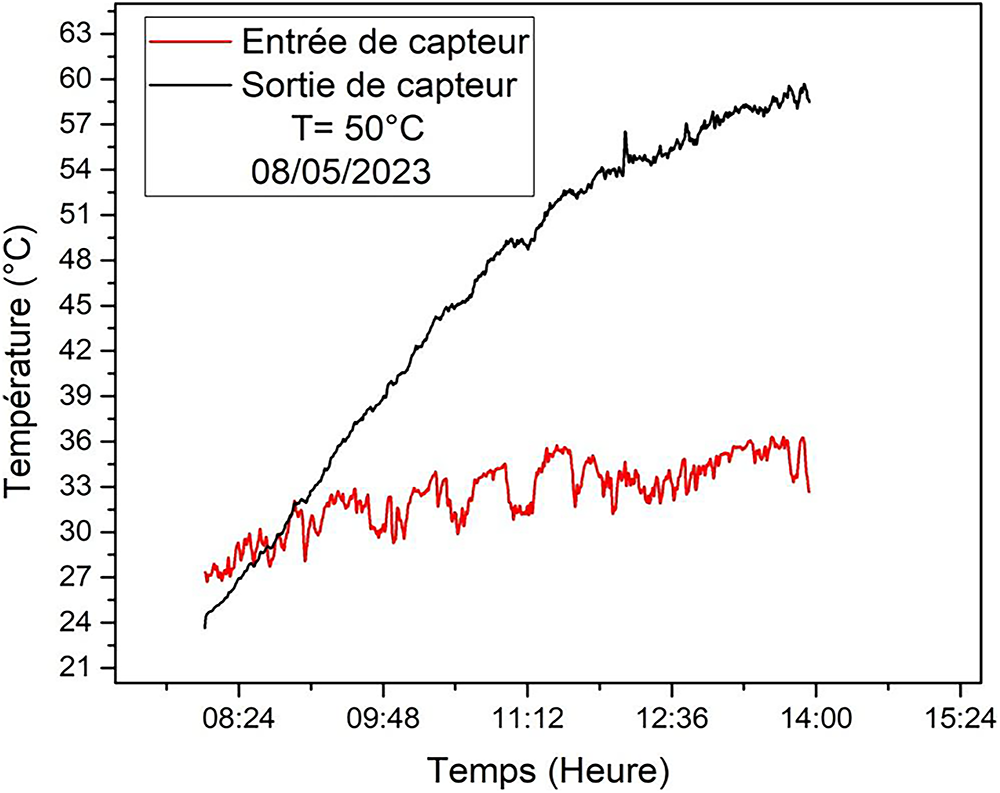
Figure 10: Temporal variation in sensor inlet and outlet temperature
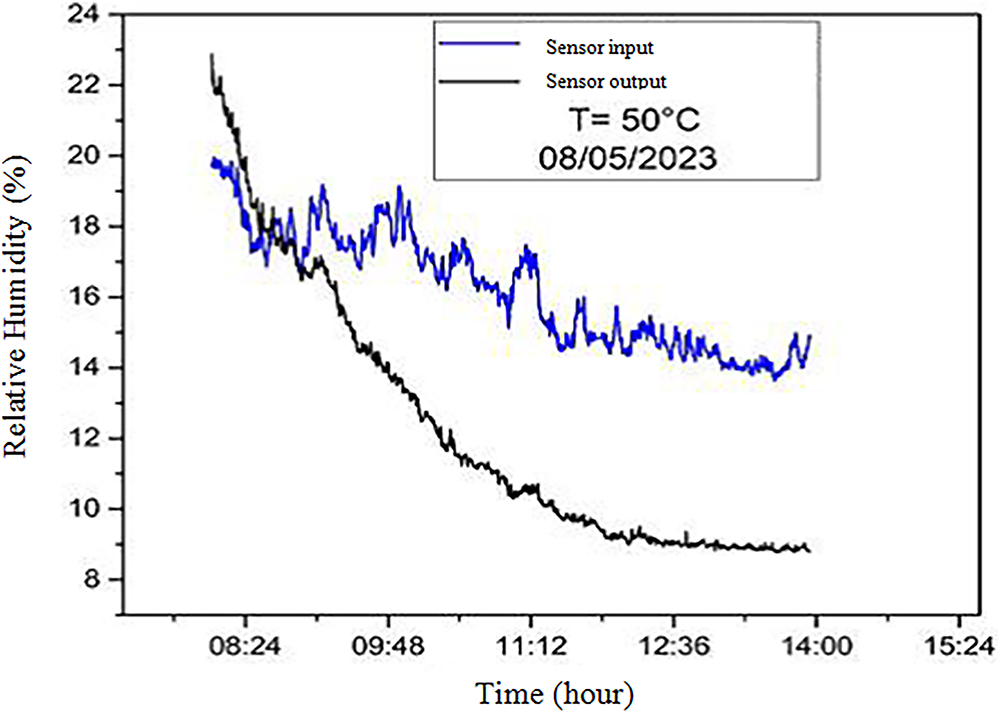
Figure 11: Variation in relative humidity at the inlet and outlet of the solar sensor air
From Fig. 10, which shows the variation in the inlet and outlet air temperatures of the solar collector where the air velocity is set at 2.5 m/s, we can see a large difference between the inlet and outlet temperatures from 11:00 onwards. This means that the inlet temperature is linked to the ambient temperature and the outlet temperature is linked to the significant power absorbed by the solar collector, due to the black-tinted absorber, where the absorptivity of this plate increases the heat absorbed, producing a greenhouse effect with the glass. However, we note that the relative humidity trends at the solar sensor inlet and outlet are opposite to the temperature trends due to the severe increase in heat (Fig. 11).
4.2 At the Drying Chamber Level
Fig. 12 illustrates the evolution of temperature over time at different locations in the drying chamber. An initial temperature gradient is observed, followed by a trend towards stability in the temperature range defined at 50°C, with fluctuations attributed to the sensitivity of the thermostat. It should be noted that all sensors provide similar data, indicating a homogeneous distribution of heat in the drying chamber, which will facilitate the drying process. Fig. 13 shows the variation in relative humidity of the drying air arriving from the sensor passing through the heating element. We observe general humidity stability, and we also note that the sensors at positions 2 and 5 indicate humidity levels around the product that are generally lower.
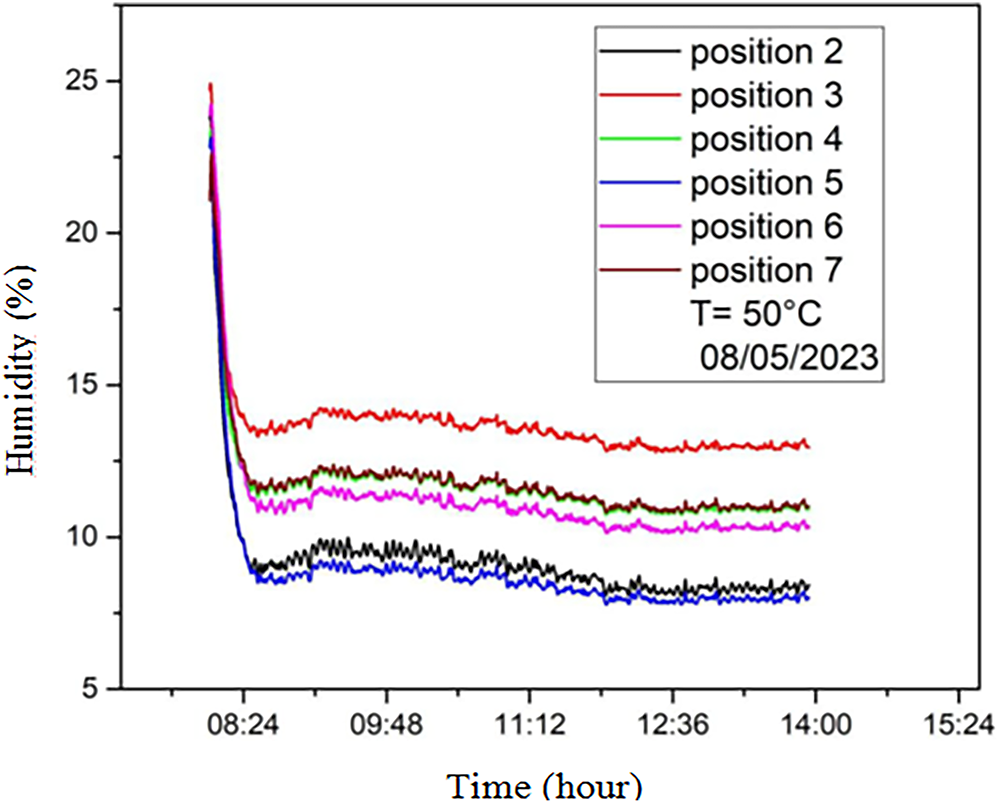
Figure 12: Temporal variation in temperature at different positions in the drying chamber
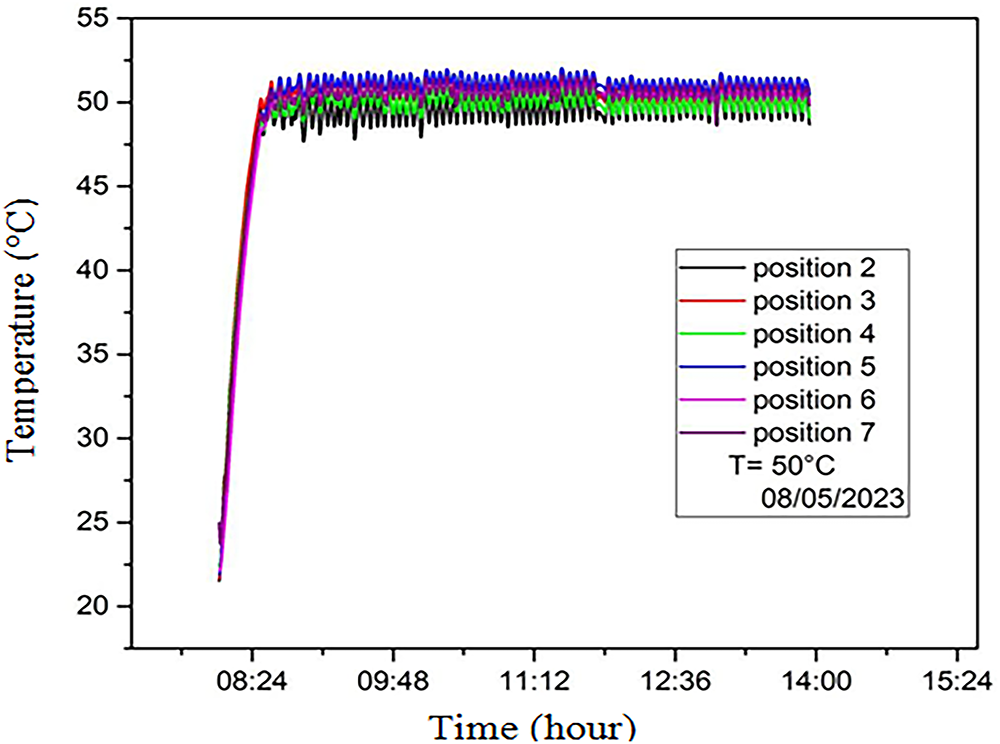
Figure 13: Temporal variation in relative humidity of the drying air at different positions in the drying chamber
5 Modelisation of the Drying Kinetics of Thin Layers of Marrubium vulgare L. Leaves
The moisture content X(t) as a function of time represents the ratio between the mass of water contained in the product (Mh) at time t and the dry mass (Ms) of the anhydrous product, and is referred to as the moisture content on a dry basis [22,23].
We note that the movement of water in the product differs depending on the temperature, as at a temperature of 60°C it took the least time compared to temperatures of 50°C and 40°C. As for the speed of the air, the difference is negligible.
As a result of the complexity of the phenomena associated with the drying process of a product, various authors have developed mathematical models, in the form of empirical or semi-empirical relationships, to characterise drying curves. The equations of these models describe the variation in various moisture levels MR [24].
where MR is the dimensionless reduced moisture content, X(t) is the moisture content after a drying time (t) (kg water/kg, d.w.), X0 is the initial water content of the samples (kg water/kg dry matter) and Xeq (kg water/kg dry matter) is the equilibrium moisture content. However, MR has been simplified by modifying (Eq. (9)) instead of (MR = X(t)/X0) [25].
5.3 Mathematical Modelling of Thin-Layer Drying
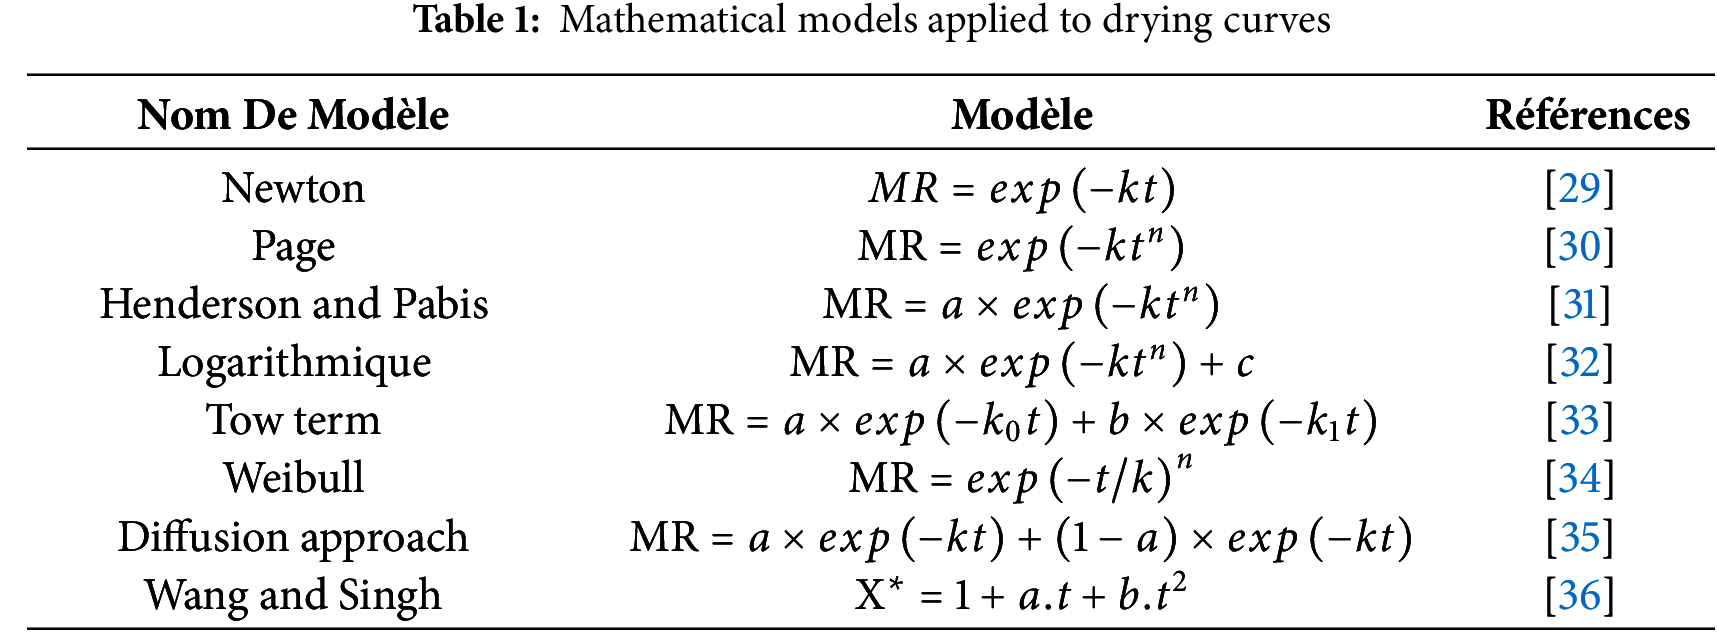
Many empirical or semi-empirical models are used to describe drying kinetics and predict the reduced moisture content X∗ as a function of drying time [26–28]. In order to characterise the drying process of common horehound leaves (Marrubium vulgare L.) and establish the most appropriate empirical equation, we adopted eight thin-layer drying models used in the field of medicinal plants [28]. The equations of these models, describing the variation in reduced moisture content X∗ as a function of time, incorporate adjustable parameters in order to align the theoretical results with the experimental drying curves. Thus, their validity is limited to the experimental research field for which they were defined. Table 1 presents the empirical drying equations commonly used in modelling.
The parameters of each equation were calibrated based on the experimental results obtained. The software programs ‘CurveExpert 2.8’ and ‘Origin 15’ were used to apply the Marquardt-Levenberg non-linear optimisation method in order to determine the coefficients of the models describing the reduced water content curves of the leaves of Marrubium vulgare L. The statistical parameters were analysed in order to identify the most appropriate model, based on the correlation coefficient (r) and standard error (EST) of the reduced moisture content MR. Indeed, the optimal model is characterised by a high correlation coefficient (r) and a low standard error (EST) value. The values of r and the standard error of the estimate (EST) are obtained from the following equations:
The drying kinetics of common horehound (Marrubium vulgare L.), are examined using a solar dryer equipped with an electric backup and operating under forced convection. The objective of this study is to contribute to the analysis and understanding of the diffusion mechanisms that impact the drying process of medicinal plants. Drying experiments were conducted at three different drying air temperatures (40°C, 50°C and 60°C), while maintaining constant drying air velocities (V = 1.5 m/s, V = 2.5 m/s). Figs. 14–18, show the experimental curves illustrating the evolution of the drying rate as a function of time and water content. The various drying curves presented (Figs. 17 and 18) illustrate the gradual decrease in moisture content and drying rate as a function of time. They also confirm the absence of phases (0) and (I) when the product is in sheet form, while highlighting the exclusive presence of phase (II). Identical results were obtained for various products of vegetable origin [37–40]. The drying process during the decreasing rate phase is controlled by the phenomenon of water diffusion through the solid material. This is a complex process involving water in liquid and vapour form, generally defined by effective diffusion. This characteristic is influenced by factors such as temperature, pressure and the water content of the product [41]. The influence of relative humidity (RH) is less than that of temperature. Hybrid solar systems, such as the automated dryer evaluated by Amer et al. [42], have shown significant advantages in drying aromatic herbs like lemongrass and lavender, improving drying time while maintaining quality by preserving essential oils. These findings align with our own results, where Marrubium vulgare L. exhibited improved drying efficiency under controlled temperature and airflow conditions.
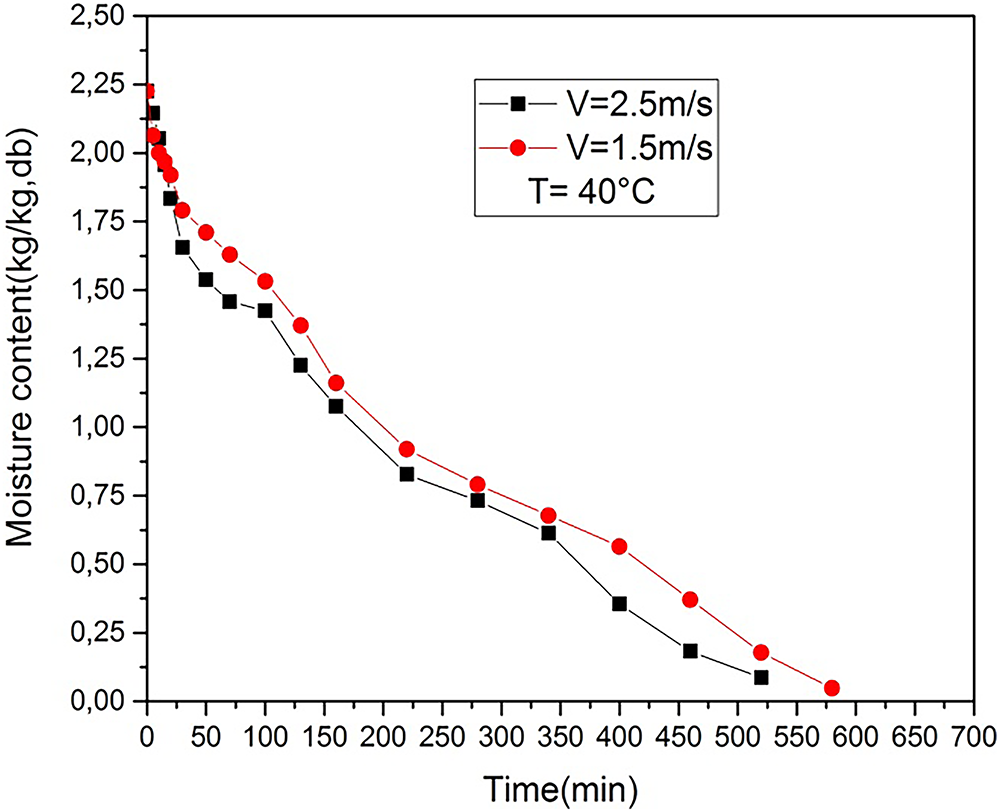
Figure 14: Temporal variation of moisture content at different air velocities (T = 40°C). x-axis: Time (min); y-axis: Moisture content (kg water·kg−1 dry basis)
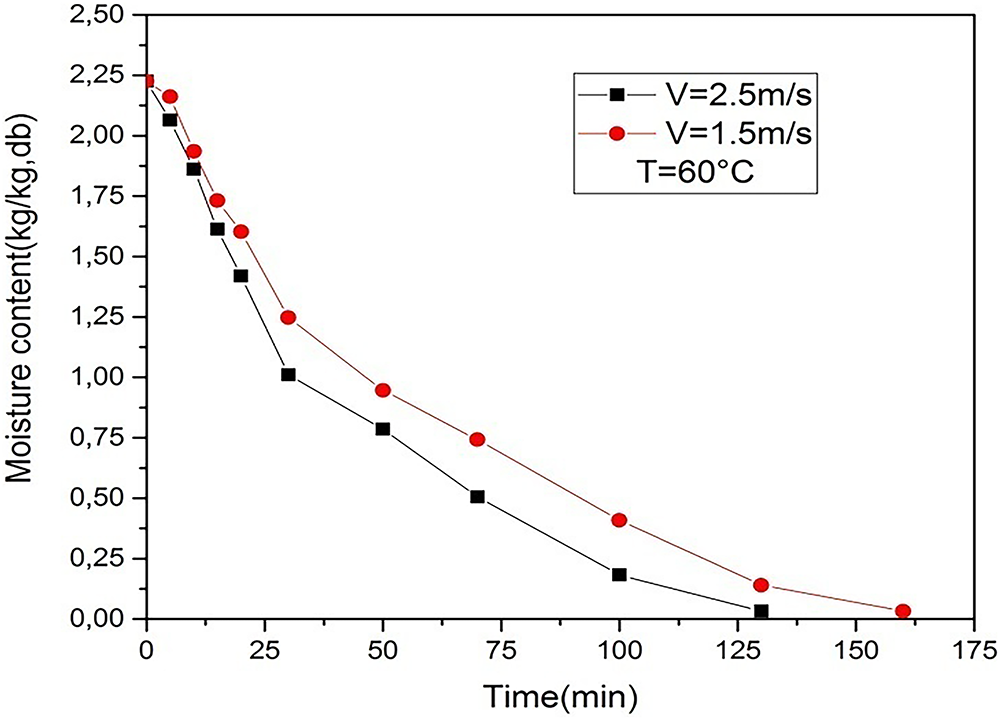
Figure 15: Temporal variation of moisture content at different air velocities (T = 60°C)
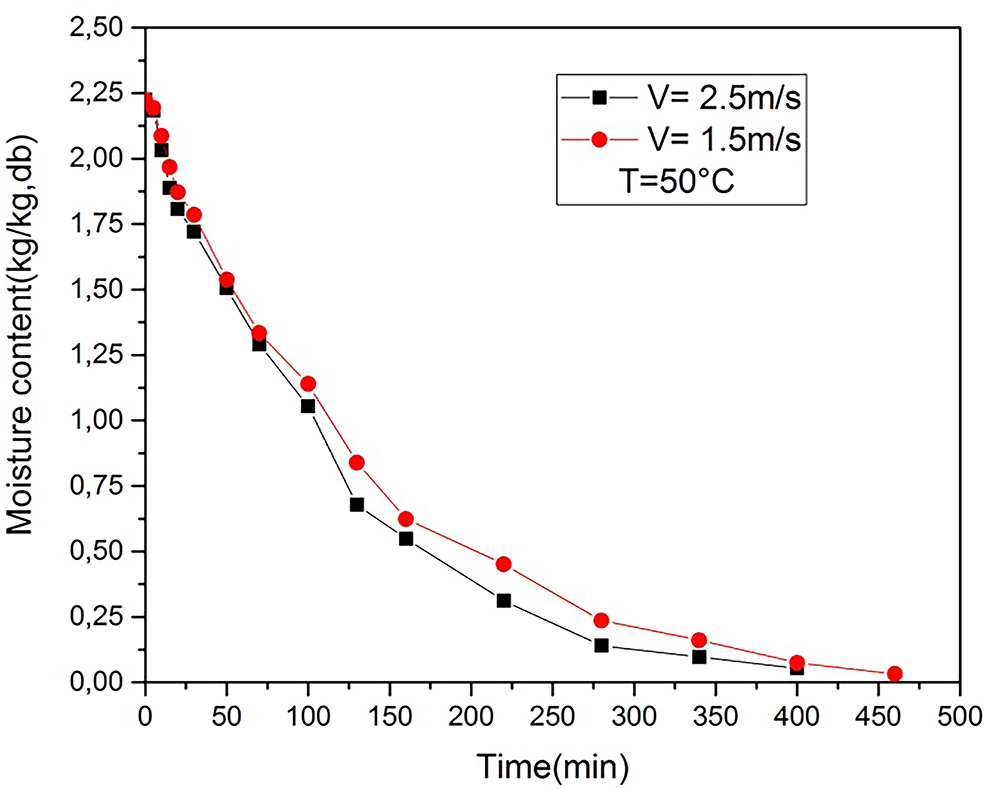
Figure 16: Temporal variation of moisture content at different air velocities (T = 50°C)
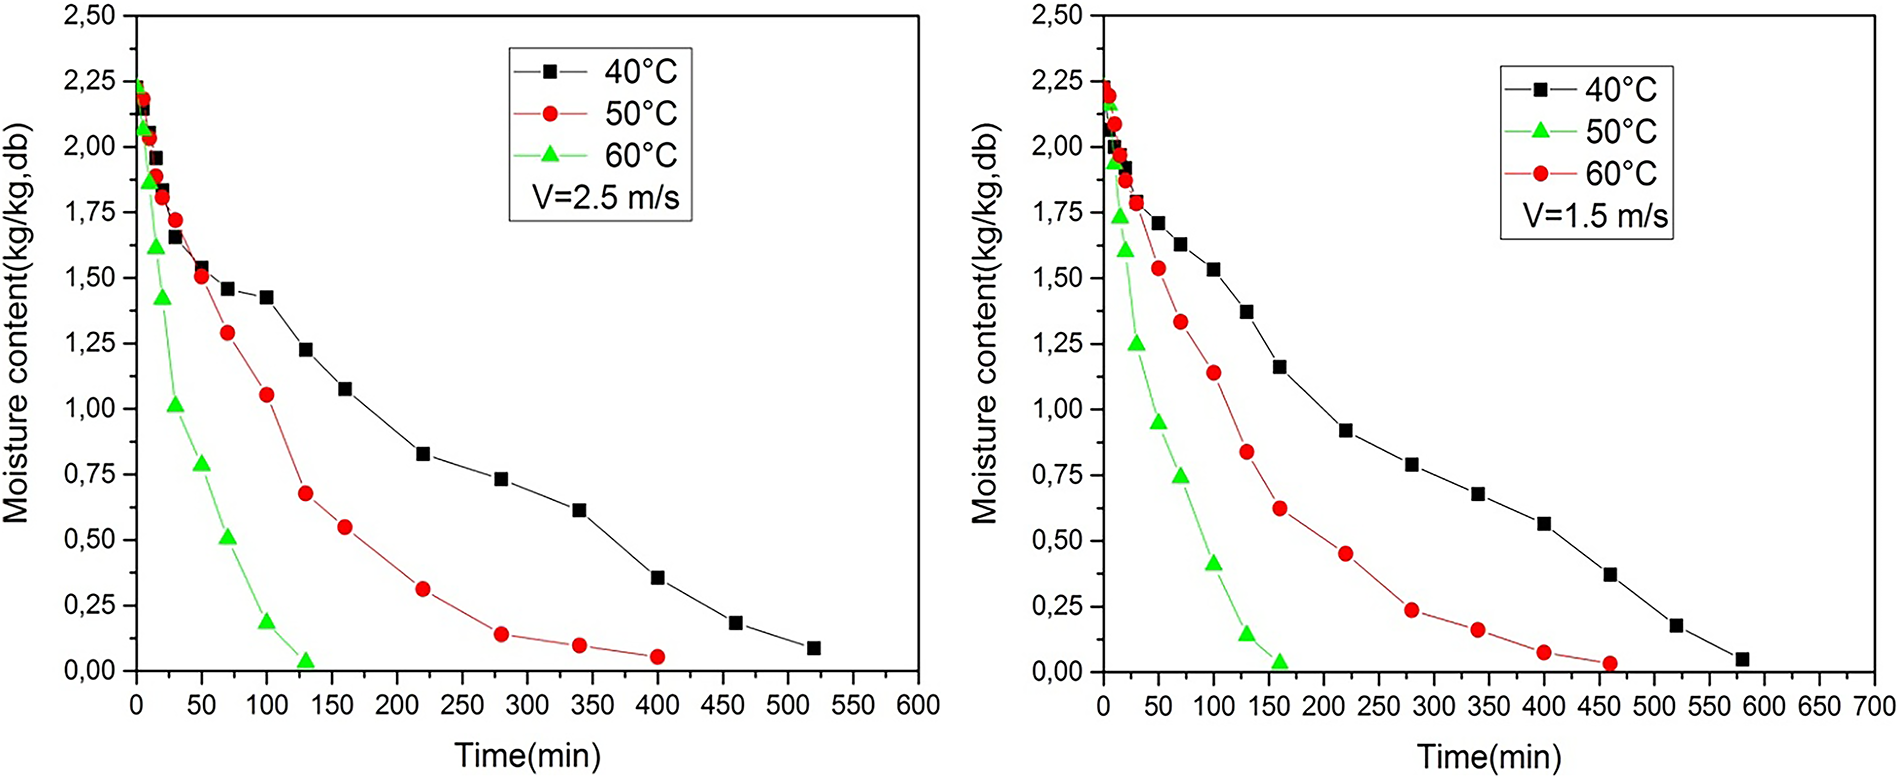
Figure 17: Temporal variation of moisture content for different temperatures (V = 1.5 and 2.5 m·s−1)
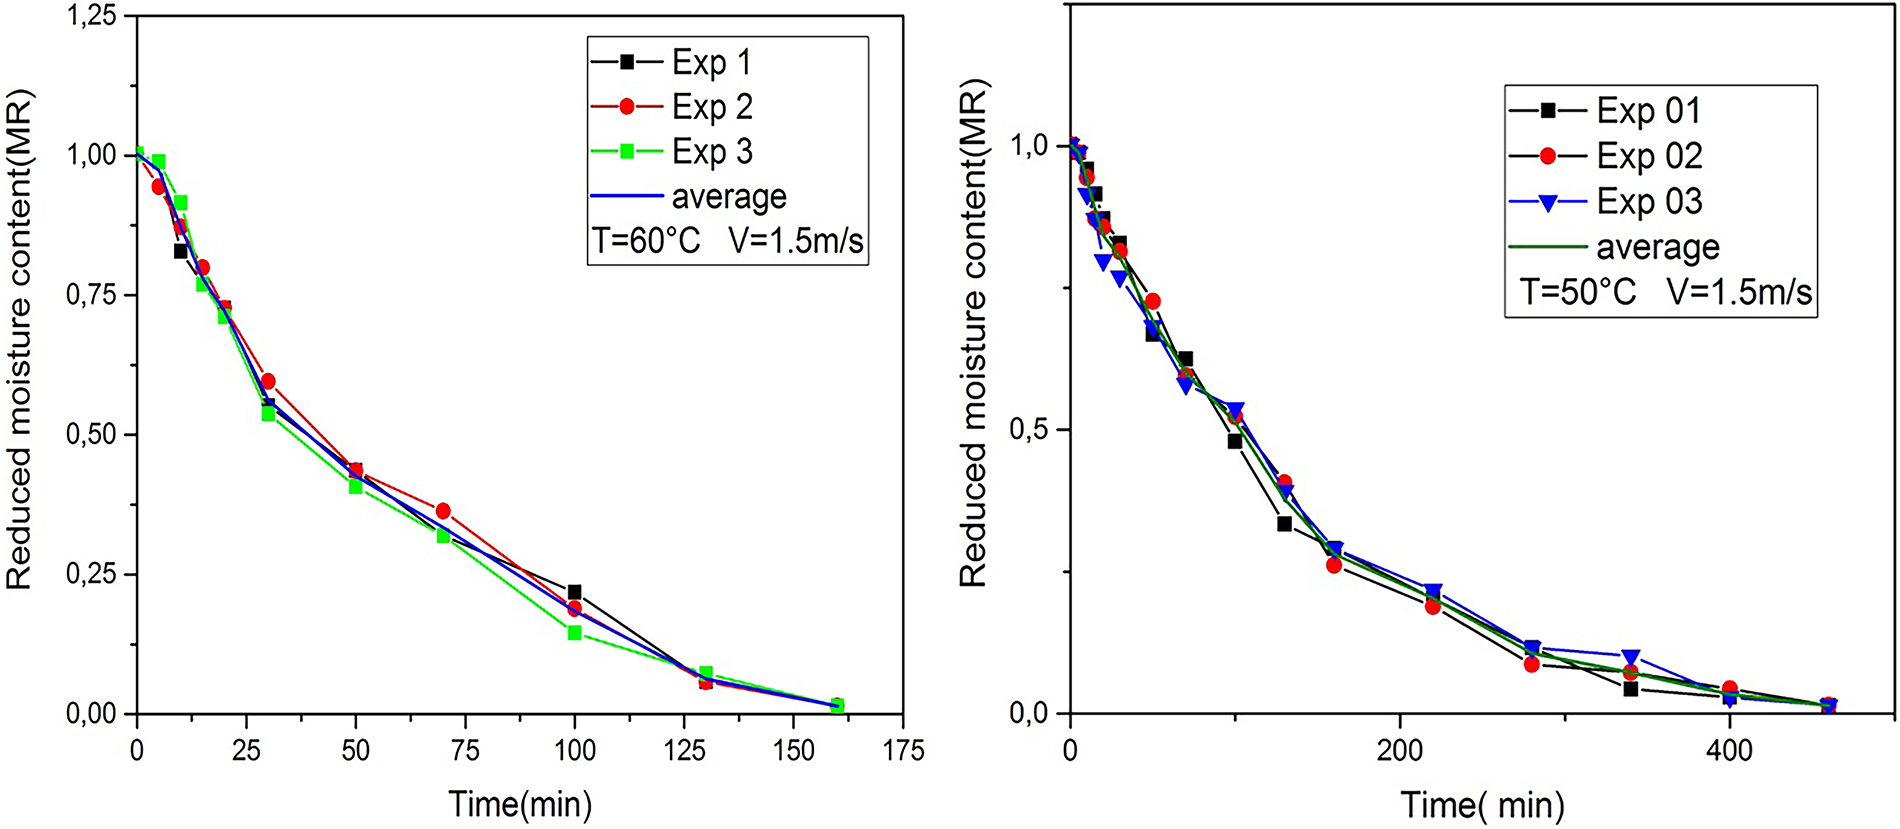
Figure 18: Reduced moisture content (MR) vs. drying time for different temperatures at V = 1.5 m·s−1
Hybrid solar systems, such as the automated dryer evaluated by Amer et al. [42], have shown significant advantages in drying aromatic herbs like lemongrass and lavender, improving drying time while maintaining quality by preserving essential oils.
Fig. 14 illustrates the change in water content as a function of time at different temperatures. These data show that, in our experiments, there is no drying period at constant temperature. Figs. 15–18 illustrate the variations in water content following the drying process of common horehound (Marrubium vulgare L.) leaves. It is clear that the increase in temperature significantly reduced the drying time.
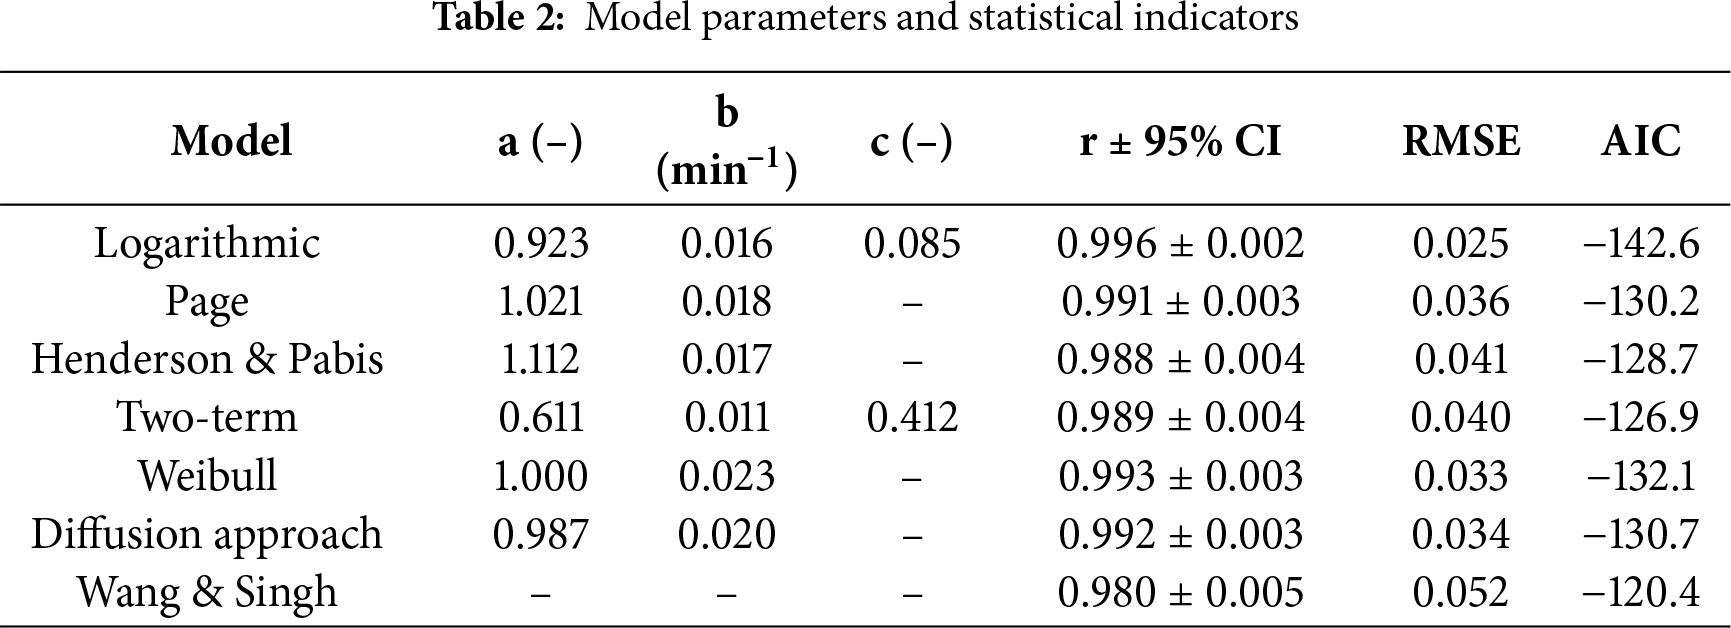
The results of the experiments were analysed using eight well-known mathematical equations, such as: Newton, Page, Henderson and Pabis, Logarithmic, Tow term, Weibull, Diffusion approach and Wang and Singh. These equations are commonly used to model the dynamics of the drying process (see Table 1). These mathematical models are adapted to the data concerning reduced moisture content, taking into account the standard error (EST) and the correlation coefficient (r) within the conditions associated with the experiments conducted. The results of the curve smoothing indicated that all of these models are considered acceptable for predicting reduced water content. However, among the models evaluated, the logarithmic model proved to be particularly effective in describing the thin-layer drying kinetics of Marrubium vulgare L. leaves in a particularly satisfactory manner, as illustrated in Fig. 19. Table 2 presents the results of the non-linear regression analyses of the kinetics of the leaves of Marrubium vulgare L., obtained under the conditions of the experiment. These results refer to the values of the constants of the logarithmic model, which provided the best fit, with the lowest standard error (EST) and the highest correlation coefficient (r) [43].
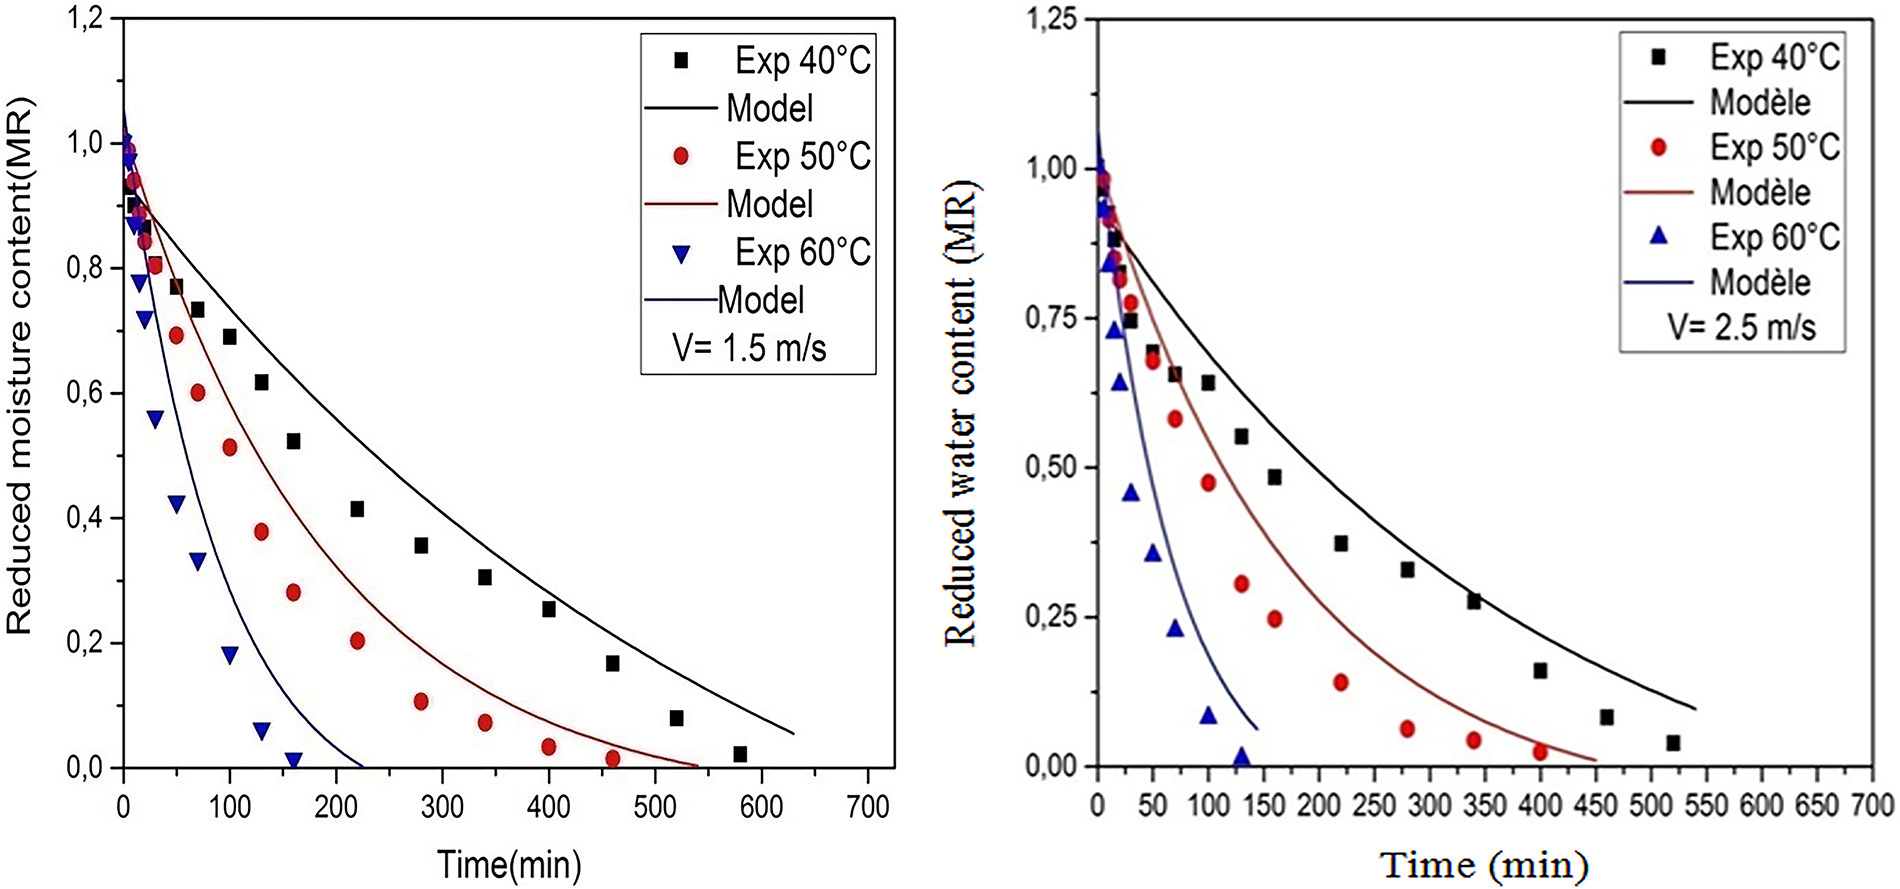
Figure 19: Reduced moisture content described by the logarithmic model for both dryingair flow rates (V = 1.5 m·s−1, V = 2.5 m·s−1)
The logarithmic model yielded the lowest RMSE and AIC values, confirming its robustness and accuracy in describing the convective solar drying kinetics of Marrubium vulgare L. leaves.
6.3 Energy Efficiency and Sustainability Perspective
The experiments conducted with the hybrid solar drying system demonstrated high efficiency in energy consumption. The solar radiation supplied an average of 68 to 75 percent of the total thermal energy needed in the process with the supplemental electric heater only operating during brief intervals when the irradiance was poor. Collector efficiency at any one time was between 45 and 62 percent with respect to the air velocity and entering air temperature. The above outcomes testify to the fact that the majority of the energy needs were met by the contribution of solar energy, which not only decreased the demand on electricity and operating expenses. The auxiliary heating system provided stability of temperature and continuity of operation especially in the transient weather conditions.
In the sustainability perspective, the findings propose the possibility of using solar-assisted drying systems to process aromatic and medicinal plants on large scale in arid and semi-arid areas. The hybrid model is ideal because it incorporates the characteristic of using renewable energy and at the same time maintaining consistency in the performance of the drying process, as well as adding to the greater goals of sustainable post-harvest management in Algeria. Table 2 presents the model parameters and statistical indicators for the drying process, while Fig. 19 shows the reduced moisture content described by the logarithmic model for both drying air flow rates (V = 1.5 m·s−1, V = 2.5 m·s−1).
All parameters were obtained by nonlinear regression.
and the Akaike information criterion (AIC) was determined from:
where N is the number of observations and k is the number of model parameters.
The correlation that was developed between the Nusselt number (Nu) and the drying rate is helpful in the engineering design and optimization of solar-assisted dryers. An increase in Nu values with air velocity verifies the enhancement in convective heat transfer, which directly facilitates faster moisture removal and shortens the drying time. This relationship can be utilized to size the drying chamber and the airflow system according to various plant loads or scales. Additionally, the obtained Nu–Re–Pr correlations can help in forecasting the thermal performance of larger units, which will assist in the development of new cost-effective and energy-efficient solar dryers applicable at the community or semi-industrial level under Saharan climatic conditions.
6.5 Sustainability and Environmental Analysis
The environmental performance of the hybrid solar dryer was evaluated based on its ability to reduce greenhouse gas emissions by partially replacing traditional electric heating with solar energy. Since the solar collector supplied approximately 70% of the total thermal energy used for drying, the reduction in carbon emissions was estimated using the emission factor of the Algerian national electricity grid. (0.548 kg·CO2e·kWh−1) [44]:
The resulting avoided emissions ranged from 0.38 to 0.45 kg CO2e per drying batch, depending on the operating temperature and drying duration. Although modest at the laboratory scale, this reduction demonstrates the environmental viability of integrating solar-assisted systems into post-harvest processing. For regions with high solar irradiance such as southwestern Algeria, the large-scale deployment of such dryers could yield substantial cumulative energy savings and long-term emission reductions, contributing meaningfully to low-carbon agricultural practices.
6.6 Drying Characteristic Curve
The aim of this approach is to model the rate of drying. Essentially, it involves analysing whether, despite the complexity of the phenomena observed at the microscopic level (i.e., in the pores of the medium), it is possible to achieve a certain simplicity in the interpretation of experimental results at the macroscopic level, and to establish a model of uniform behaviour for the product under study, regardless of the experimental conditions [45,46]. The approach aims to standardise average water contents and drying rates in order to obtain a single curve for a specific product with defined dimensions, regardless of aerothermal conditions such as the speed, temperature and humidity of the drying air [47,48]. Thus, the objective of this section, in accordance with what has been previously stated, is to summarise the results obtained experimentally by establishing a characteristic drying curve based on the tests carried out. The fundamental concept of the approach developed by [49] is based on the analysis of the variation in normalised drying rate (f) as a function of reduced moisture content (MR). This approach allows for a more accurate grouping of the different values obtained around a specific average curve called the characteristic drying curve (CDC). The equation describing the drying kinetics of the product is represented by the function f as a function of the reduced water content MR, and can therefore be formulated as follows: f = f (MR). To achieve this result, the method used involves a normalisation step which consists of expressing the ratio between the drying rate at a given time t (−dX/dt), and the drying rate of the first phase (−dX/dt)I, under similar air conditions, as a function of the reduced water content (X − Xeq)/(Xcri − Xeq). Since we do not have the first phase, it follows that:
Under a series of constant experimental conditions during the drying process (such as temperature, rate, air humidity, and dimensions of the product to be dried), it is reasonable to assume that the function f = f(X∗) has the following properties [33].
Fig. 20 illustrates the drying characteristic curve (DCC) obtained from the calculations performed. This curve is significant because it allows for in-depth analysis and understanding of how specific data evolves over time. This curve makes it possible to identify trends, variations and correlations that would otherwise be difficult to perceive. In reality, it is essential to have accurate data on initial moisture content values in order to be able to analyse and describe the drying process in depth under various air conditions.

Figure 20: Characteristic drying curve for Marrubium vulgare L. leaves obtained for different drying air conditions and temperatures
When smoothing the drying characteristic curve of Marrubium vulgare L., an in-depth analysis is carried out to determine its equation. This Eq. (19), is then expressed as a 9th degree polynomial, giving us a detailed and accurate mathematical representation of the drying process of this plant.
6.7 Physical Interpretation and Model Validation
The parameters of the logarithmic model also possess clear physical meaning related to the drying process. The coefficient a represents the equilibrium moisture ratio scale, b corresponds to the effective drying constant that captures the combined influence of temperature, air velocity, and mass-transfer resistance, and c acts as an empirical adjustment factor linked to internal diffusion effects within the leaf structure.
To verify the robustness of this model, a five-fold cross-validation was performed by randomly dividing the dataset into independent subsets. The logarithmic model consistently produced the lowest RMSE and AIC across all validation folds, confirming its reliability and predictive stability under varying experimental conditions.
These findings not only corroborate previous reports but also reinforce the physical realism and reproducibility of the logarithmic model when applied to thin-layer drying of Marrubium vulgare L.
6.8 Comparison with Previous Studies and Scientific Novelty
The drying behaviour observed in this work is consistent with trends reported for other aromatic and medicinal plants, where the decreasing-rate period dominates the drying process and moisture diffusion is the controlling mechanism. The logarithmic model provided the best fit to the experimental data (r > 0.99; lowest RMSE and AIC values), which agrees with reports by several authors who also found this model to be the most suitable for herbs and leafy products with high surface-area-to-volume ratios. Minor deviations in the model constants can be attributed to differences in morphology, porosity, and air-flow configuration among studies.
The originality of the present study lies in the strictly controlled air-velocity experiments (1.5 and 2.5 m·s−1) performed under a solar-assisted hybrid drying system adapted to Saharan climatic conditions. In addition to kinetic modelling, the analysis integrated heat-transfer correlations (Re, Pr, Nu) and a quantitative energy balance separating solar and auxiliary contributions. Such an integrated kinetics–heat-transfer–energy approach is rarely reported for Marrubium vulgare L. and provides a reproducible benchmark for further design and optimization of solar dryers for medicinal plants.
In this study, we closely examined how Marrubium vulgare leaves dry under solar energy using forced airflow. The focus was on how two main factors the drying air temperature (40°C, 50°C, and 60°C) and airflow speed (1.5 and 2.5 m/s) influence the overall drying performance. Among all the models tested, the logarithmic model stood out as the most accurate one for describing how the drying process evolves over time. This was clearly supported by its high correlation values (r > 0.99) and low RMSE results.
What makes this model particularly interesting is not just its strong statistical fit, but also its potential for real-world applications. It can guide the development of larger solar drying systems, whether for industrial use or smaller community setups. By improving how air moves across the drying trays and how heat is transferred, this approach supports a more efficient and eco-friendly drying process something increasingly important in sustainable agriculture.
We also explored how heat transfer takes place during drying, mainly through the Nusselt number (Nu), which links airflow speed with the drying rate. This part helped clarify how the system handles energy. The results showed that solar energy supplied roughly 70%–75% of the total heat required, while the auxiliary heater maintained stable operation when sunlight was low. In practical terms, this hybrid design lowered electricity use and running costs, which makes solar drying not only cleaner but also more affordable in the long run.
It’s worth noting that systems like this can make a real difference when it comes to cutting down carbon emissions and promoting sustainable farming especially in arid and semi-arid regions. The hybrid setup adds a level of reliability that pure solar systems often lack, allowing the dryer to perform well even under unstable weather conditions.
Overall, this research provides a solid experimental base for future studies on solar drying of medicinal and aromatic plants. By combining drying kinetics with a detailed look at energy efficiency, it gives useful guidance for designing and optimizing solar dryers in regions with strong sunlight, such as southwestern Algeria.
Moving forward, future work will focus on scaling up the system using Computational Fluid Dynamics (CFD) simulations to improve airflow and heat distribution. Another important step will be studying how drying affects bioactive compounds, to make sure that the medicinal properties are preserved. Finally, conducting life cycle assessments (LCA) will help evaluate how sustainable and cost-effective these hybrid solar dryers can be under different climate conditions.
Acknowledgement: The authors would like to thank the Renewable Energy Research Laboratory at Tahri Mohamed University, Béchar, for providing technical facilities and support during the experimental work.
Funding Statement: The authors received no specific funding for this study.
Author Contributions: Mohammed Benamara: Conceptualized the study, designed the experimental setup, performed data collection, and contributed to writing the manuscript. Boumediene Touati: Contributed to the development of the drying model, conducted the data analysis, and reviewed the manuscript for technical content. Said Bennaceur: Supported the experimental design, analyzed the energy efficiency data, and contributed to the discussion of results. Bendjillali Ridha Ilyas: Led the overall study, supervised the experimental work, provided guidance on data interpretation, and reviewed the manuscript. All authors reviewed the results and approved the final version of the manuscript.
Availability of Data and Materials: The datasets generated and analyzed during the current study are available from the corresponding author upon reasonable request.
Ethics Approval: Not applicable.
Conflicts of Interest: The authors declare no conflicts of interest to report regarding the present study.
Nomenclature
| EST | Standard error of reduced moisture content MR |
| f | Standardised drying rate |
| N | Number of experimental points |
| X∗(MR) | Reduced moisture content |
| X∗eq | Equilibrium moisture content (% DM) |
| t | Drying time (min) |
| Xin | Initial moisture content (kg water/kg DM) |
| Xeq | Equilibrium moisture content determined from sorption isotherms (kg water/kg DM) |
| Ms | Dry mass of the product |
| MS | Dry matter |
| n | Number of model parameters |
| r | Correlation coefficient |
| X∗exp | Reduced water contentexperimental |
References
1. Bennamoun L, Belhamri A. Design and simulation of a solar dryer for agriculture products. J Food Eng. 2003;59(2–3):259–66. doi:10.1016/S0260-8774(02)00466-1. [Google Scholar] [CrossRef]
2. Azzouz S, Guizani A, Jomaa W, Belghith A. Moisture diffusivity and drying kinetic equation of convective drying of grapes. J Food Eng. 2002;55(4):323–30. doi:10.1016/S0260-8774(02)00109-7. [Google Scholar] [CrossRef]
3. Belghith A, Azzouz S, ElCafsi A. Desorption isotherms and mathematical modeling of thin layer drying kinetics of tomato. Heat Mass Transf. 2016;52(3):407–19. doi:10.1007/s00231-015-1560-0. [Google Scholar] [CrossRef]
4. Bahammou Y, Tagnamas Z, Lamharrar A, Idlimam A. Thin-layer solar drying characteristics of Moroccan horehound leaves (Marrubium vulgare L.) under natural and forced convection solar drying. Sol Energy. 2019;188(1–4):958–69. doi:10.1016/j.solener.2019.07.003. [Google Scholar] [CrossRef]
5. Zarai Z, Kadri A, Ben Chobba I, Ben Mansour R, Bekir A, Mejdoub H, et al. The in-vitro evaluation of antibacterial, antifungal and cytotoxic properties of Marrubium vulgare L. essential oil grown in Tunisia. Lipids Health Dis. 2011;10(1):161. doi:10.1186/1476-511x-10-161. [Google Scholar] [PubMed] [CrossRef]
6. Sadadou A, Hanini S, Laidi M, Rezrazi A. Novel approach for predicting direct and open solar drying using artificial neural network for medicinal plant. Kem U Ind. 2021;70(3–4):145–52. doi:10.15255/kui.2020.049. [Google Scholar] [CrossRef]
7. Al-Hamdani A, Jayasuriya H, Pathare PB, Al-Attabi Z. Drying characteristics and quality analysis of medicinal herbs dried by an indirect solar dryer. Foods. 2022;11(24):4103. doi:10.3390/foods11244103. [Google Scholar] [PubMed] [CrossRef]
8. Sandepogu DP, Somineni DS. A review on plant taxonomy. Int Res J Adv Eng Manag. 2024;2(4):1138–43. doi:10.47392/irjaem.2024.0150. [Google Scholar] [CrossRef]
9. Asahina H, Shinozaki J, Masuda K, Morimitsu Y, Satake M. Identification of medicinal Dendrobium species by phylogenetic analyses using matK and rbcL sequences. J Nat Med. 2010;64(2):133–8. doi:10.1007/s11418-009-0379-8. [Google Scholar] [PubMed] [CrossRef]
10. Zhang X, Dapar MLG. Phylogenetic tree of 50 medicinal plants in Shandong Province. China BIO Web Conf. 2023;60:1–5. doi:10.1051/bioconf/20236001013. [Google Scholar] [CrossRef]
11. Doymaz İ. Thin-layer drying behaviour of mint leaves. J Food Eng. 2006;74(3):370–5. doi:10.1016/j.jfoodeng.2005.03.009. [Google Scholar] [CrossRef]
12. Mghazli S, Ouhammou M, Hidar N, Lahnine L, Idlimam A, Mahrouz M. Drying characteristics and kinetics solar drying of Moroccan rosemary leaves. Renew Energy. 2017;108:303–10. doi:10.1016/j.renene.2017.02.022. [Google Scholar] [CrossRef]
13. Reguieg L. Using medicinal plants in Algeria. Am J Food Nutr. 2011;1(3):126–7. doi:10.5251/ajfn.2011.1.3.126.127. [Google Scholar] [CrossRef]
14. Joachim M, Heindl A. Drying of medicinal plants. In: Bogers RJ, Craker LE, Lange D, editors. Medicinal and aromatic plants: agricultural, commercial, ecological, legal, pharmacological and social aspects. Berlin/Heidelberg, Germany: Springer; 2006. p. 237–52. doi:10.1007/1-4020-5449-1. [Google Scholar] [CrossRef]
15. Belghit A, Kouhila M, Boutaleb B. Experimental study of drying kinetics of sage in a drying tunnel working in forced convection. J Ren Energ. 1999;2(1):17–26. doi:10.54966/jreen.v2i1.919. [Google Scholar] [CrossRef]
16. Bhardwaj AK, Kumar R, Kumar S, Goel B, Chauhan R. Energy and exergy analyses of drying medicinal herb in a novel forced convection solar dryer integrated with SHSM and PCM. Sustain Energy Technol Assess. 2021;45(4):101119. doi:10.1016/j.seta.2021.101119. [Google Scholar] [CrossRef]
17. AOAC International. Official methods of analysis of AOAC International. Gaithersburg, MD, USA: AOAC International; 2019. [Google Scholar]
18. Kherrafi MA, Benseddik A, Saim R, Daoud D, Bouregueba A, Krami AC, et al. Experimental investigation and economic analysis of a novel clay-based solar dryers for drying medicinal and aromatic plants under semi-arid climate. Energy Sources Part A Recovery Util Environ Eff. 2024;46(1):11658–72. doi:10.1080/15567036.2024.2391109. [Google Scholar] [CrossRef]
19. Lahsasni S, Kouhila M, Mahrouz M, Idlimam A, Jamali A. Thin layer convective solar drying and mathematical modeling of prickly pear peel (Opuntia ficus indica). Energy. 2004;29(2):211–24. doi:10.1016/j.energy.2003.08.009. [Google Scholar] [CrossRef]
20. Natarajan SK, Elavarasan E. A review on computational fluid dynamics analysis on greenhouse dryer. IOP Conf Ser Earth Environ Sci. 2019;312(1):012033. doi:10.1088/1755-1315/312/1/012033. [Google Scholar] [CrossRef]
21. Incropera FP, DeWitt DP, Bergman TL, Lavine AS. Fundamentals of heat and mass transfer. 6th ed. Hoboken, NJ, USA: John Wiley & Sons; 2007. [Google Scholar]
22. Buzrul S. Reassessment of thin-layer drying models for foods: a critical short communication. Processes. 2022;10(1):118. doi:10.3390/pr10010118. [Google Scholar] [CrossRef]
23. Visavale GL. Principles, classification and selection of solar dryers. In: Hii CL, Ong SP, Jangam SV, Mujumdar AS, editors. Solar drying: fundamentals, applications and innovations. Singapore: World Scientific Publishing Company; 2012. p. 1–50. [Google Scholar]
24. Belghit A, Kouhila M, Boutaleb BC. Experimental study of drying kinetics by forced convection of aromatic plants. Energy Convers Manag. 2000;41(12):1303–21. doi:10.1016/S0196-8904(99)00162-4. [Google Scholar] [CrossRef]
25. Shanmugam V, Natarajan E. Experimental investigation of forced convection and desiccant integrated solar dryer. Renew Energy. 2006;31(8):1239–51. doi:10.1016/j.renene.2005.05.019. [Google Scholar] [CrossRef]
26. Midilli A, Kucuk H, Yapar Z. A new model for single-layer drying. Dry Technol. 2002;20(7):1503–13. doi:10.1081/DRT-120005864. [Google Scholar] [CrossRef]
27. Jorge de Jesús CG, Margarita CT, Beatriz CT, Francisco Román LZ, Gerardo Alberto MP, Carlos Jesahel VG. Improvements and evaluation on bitter orange leaves (Citrus aurantium L.) solar drying in humid climates. Sustainability. 2021;13(16):9393. doi:10.3390/su13169393. [Google Scholar] [CrossRef]
28. Midilli A, Kucuk H. Mathematical modeling of thin layer drying of pistachio by using solar energy. Energy Convers Manag. 2003;44(7):1111–22. doi:10.1016/S0196-8904(02)00099-7. [Google Scholar] [CrossRef]
29. Saxena G, Tiwari GN, Singh A. Performance evaluation and drying kinetics for solar drying of coriander and fenugreek. J Sol Energy Eng. 2020;143(5):14. doi:10.1115/1.4046465. [Google Scholar] [CrossRef]
30. Joel J, Alkali AK, Ibrahim B, Ahmad Adamu A, Babba FJ, Dayo O. Evaluation of parabolic shaped solar dryer (PSSD) for drying of tomatoes under semi-arid climate zone. Discov Food. 2024;4(1):191. doi:10.1007/s44187-024-00255-9. [Google Scholar] [CrossRef]
31. Zeng Z, Han C, Wang Q, Yuan H, Zhang X, Li B. Analysis of drying characteristic, effective moisture diffusivity and energy, exergy and environment performance indicators during thin layer drying of tea in a convective-hot air dryer. Front Sustain Food Syst. 2024;8:1371696. doi:10.3389/fsufs.2024.1371696. [Google Scholar] [CrossRef]
32. Yagcioglu A, Degirmencioglu A, Cagatay F. Drying characteristic of laurel leaves under different conditions. In: Proceedings of the 7th International Congress on Agricultural Mechanization and Energy; 1999 May 26–27; Adana, Türkiye. [Google Scholar]
33. Henderson SM. Progress in developing the thin layer drying equation. Trans ASAE. 1974;17(6):1167–8. doi:10.13031/2013.37052. [Google Scholar] [CrossRef]
34. Cunha LM, Oliveira FAR, Oliveira JC. Optimal experimental design for estimating the kinetic parameters of processes described by the Weibull probability distribution function. J Food Eng. 1998;37(2):175–91. doi:10.1016/S0260-8774(98)00085-5. [Google Scholar] [CrossRef]
35. Kassem AS. Comparative studies on thin layer drying models for wheat. In: Proceedings of the 13th International Congress on Agricultural Engineering; 1998 Feb 2–6; Rabat, Morocco. p. 2–6. [Google Scholar]
36. Hacıhafızoğlu O, Cihan A, Kahveci K. Mathematical modelling of drying of thin layer rough rice. Food Bioprod Process. 2008;86(4):268–75. doi:10.1016/j.fbp.2008.01.002. [Google Scholar] [CrossRef]
37. Dhande A, Agarwal M, Das Agarwal G. Drying kinetics (mathematical modeling) and quality evaluation of herbal leaves (Adulsa and Durva) dried in small-scale greenhouse solar dryer (GHSDexperimental investigation and comparative analysis. J Food Process Eng. 2024;47(8):e14704. doi:10.1111/jfpe.14704. [Google Scholar] [CrossRef]
38. Karami H, Nooralivand A, Jafari D. Thermodynamic evaluation of a forced convective hybrid-solar dryer for rosemary leaves. Energies. 2021;14(18):5835. doi:10.3390/en14185835. [Google Scholar] [CrossRef]
39. Bellagha S, Amami E, Farhat A, Kechaou N. Drying kinetics and characteristic drying curve of lightly salted sardine (Sardinella aurita). Dry Technol. 2002;20(7):1527–38. doi:10.1081/DRT-120005866. [Google Scholar] [CrossRef]
40. Kumar M, Sansaniwal SK, Khatak P. Progress in solar dryers for drying various commodities. Renew Sustain Energy Rev. 2016;55(2):346–60. doi:10.1016/j.rser.2015.10.158. [Google Scholar] [CrossRef]
41. Onwude DI, Hashim N, Janius RB, Nawi NM, Abdan K. Modeling the thin-layer drying of fruits and vegetables: a review. Comp Rev Food Sci Food Safe. 2016;15(3):599–618. doi:10.1111/1541-4337.12196. [Google Scholar] [PubMed] [CrossRef]
42. Amer A, Ibrahim A, Shahin A, Elsebaee I, Saad R, Hassan MF, et al. Performance evaluation of an automated hybrid solar system dryer for drying some aromatic herbs. Dry Technol. 2024;42(4):728–47. doi:10.1080/07373937.2024.2308607. [Google Scholar] [CrossRef]
43. Constantino-Robles CD, Romero-Eredia JA, Sevilla-Camacho PY, Robles-Ocampo JB, Sol-Montejo LJ, Rodríguez-Reséndiz J, et al. Novel hybrid solar dryer for medicinal plants: an experimental evaluation (Tithonia diversifolia Gray). Sustain Energy Technol Assess. 2022;51:101950. doi:10.1016/j.seta.2022.101950. [Google Scholar] [CrossRef]
44. Zaatri A, Nemouchi Z, Bessaih R, Benissaad S, Talbi K. Optimal design and comparison between renewable energy, hybrid energy, and non-renewable energy systems: case of Skikda. Algeria Energy. 2017;135(5):526–39. doi:10.1016/J.ENERGY.2017.06.155. [Google Scholar] [CrossRef]
45. Koyuncu T. Performance of various design of solar air heaters for crop drying applications. Renew Energy. 2006;31(7):1073–88. doi:10.1016/j.renene.2005.05.017. [Google Scholar] [CrossRef]
46. Ghatrehsamani SH, Dadashzadeh M, Zomorodian A. Kinetics of apricot thin layer drying in a mixed and indirect mode solar dryer. Int J Agri Scie. 2012;4(6):262–7. doi:10.9735/0975-3710.4.6.262-267. [Google Scholar] [CrossRef]
47. Doymaz İ. The kinetics of forced convective air-drying of pumpkin slices. J Food Eng. 2007;79(1):243–8. doi:10.1016/j.jfoodeng.2006.01.049. [Google Scholar] [CrossRef]
48. Mohamed LA, Kouhila M, Jamali A, Lahsasni S, Kechaou N, Mahrouz M. Single layer solar drying behaviour of Citrus aurantium leaves under forced convection. Energy Convers Manag. 2005;46(9–10):1473–83. doi:10.1016/j.enconman.2004.08.001. [Google Scholar] [CrossRef]
49. Mujumdar AS, Law CL. Drying technology: trends and applications in postharvest processing. Food Bioprocess Technol. 2010;3(6):843–52. doi:10.1007/s11947-010-0353-1. [Google Scholar] [CrossRef]
Cite This Article
 Copyright © 2026 The Author(s). Published by Tech Science Press.
This work is licensed under a Creative Commons Attribution 4.0 International License , which permits unrestricted use, distribution, and reproduction in any medium, provided the original work is properly cited.
 Downloads
 Citation Tools