
 Login
Login Register
 Submit a Paper
 Propose a Special lssue
 Open Access
ARTICLE

Blockchain-Powered Dynamic Coordination of EV Charging in Integrated Transport-Power Systems
Electric Power Research Institute, State Grid Jiangsu Electric Power Co., Ltd., Nanjing, 211103, China
* Corresponding Author: Xiaodong Yuan. Email:
(This article belongs to the Special Issue: Sustainable Transport Technologies and Strategies: Impacts on Energy and Environment)
Energy Engineering 2026, 123(10), 10 https://doi.org/10.32604/ee.2025.074882
Received 20 October 2025; Accepted 18 December 2025; Issue published 30 August 2026
 View Full Text
 Download PDF
Abstract
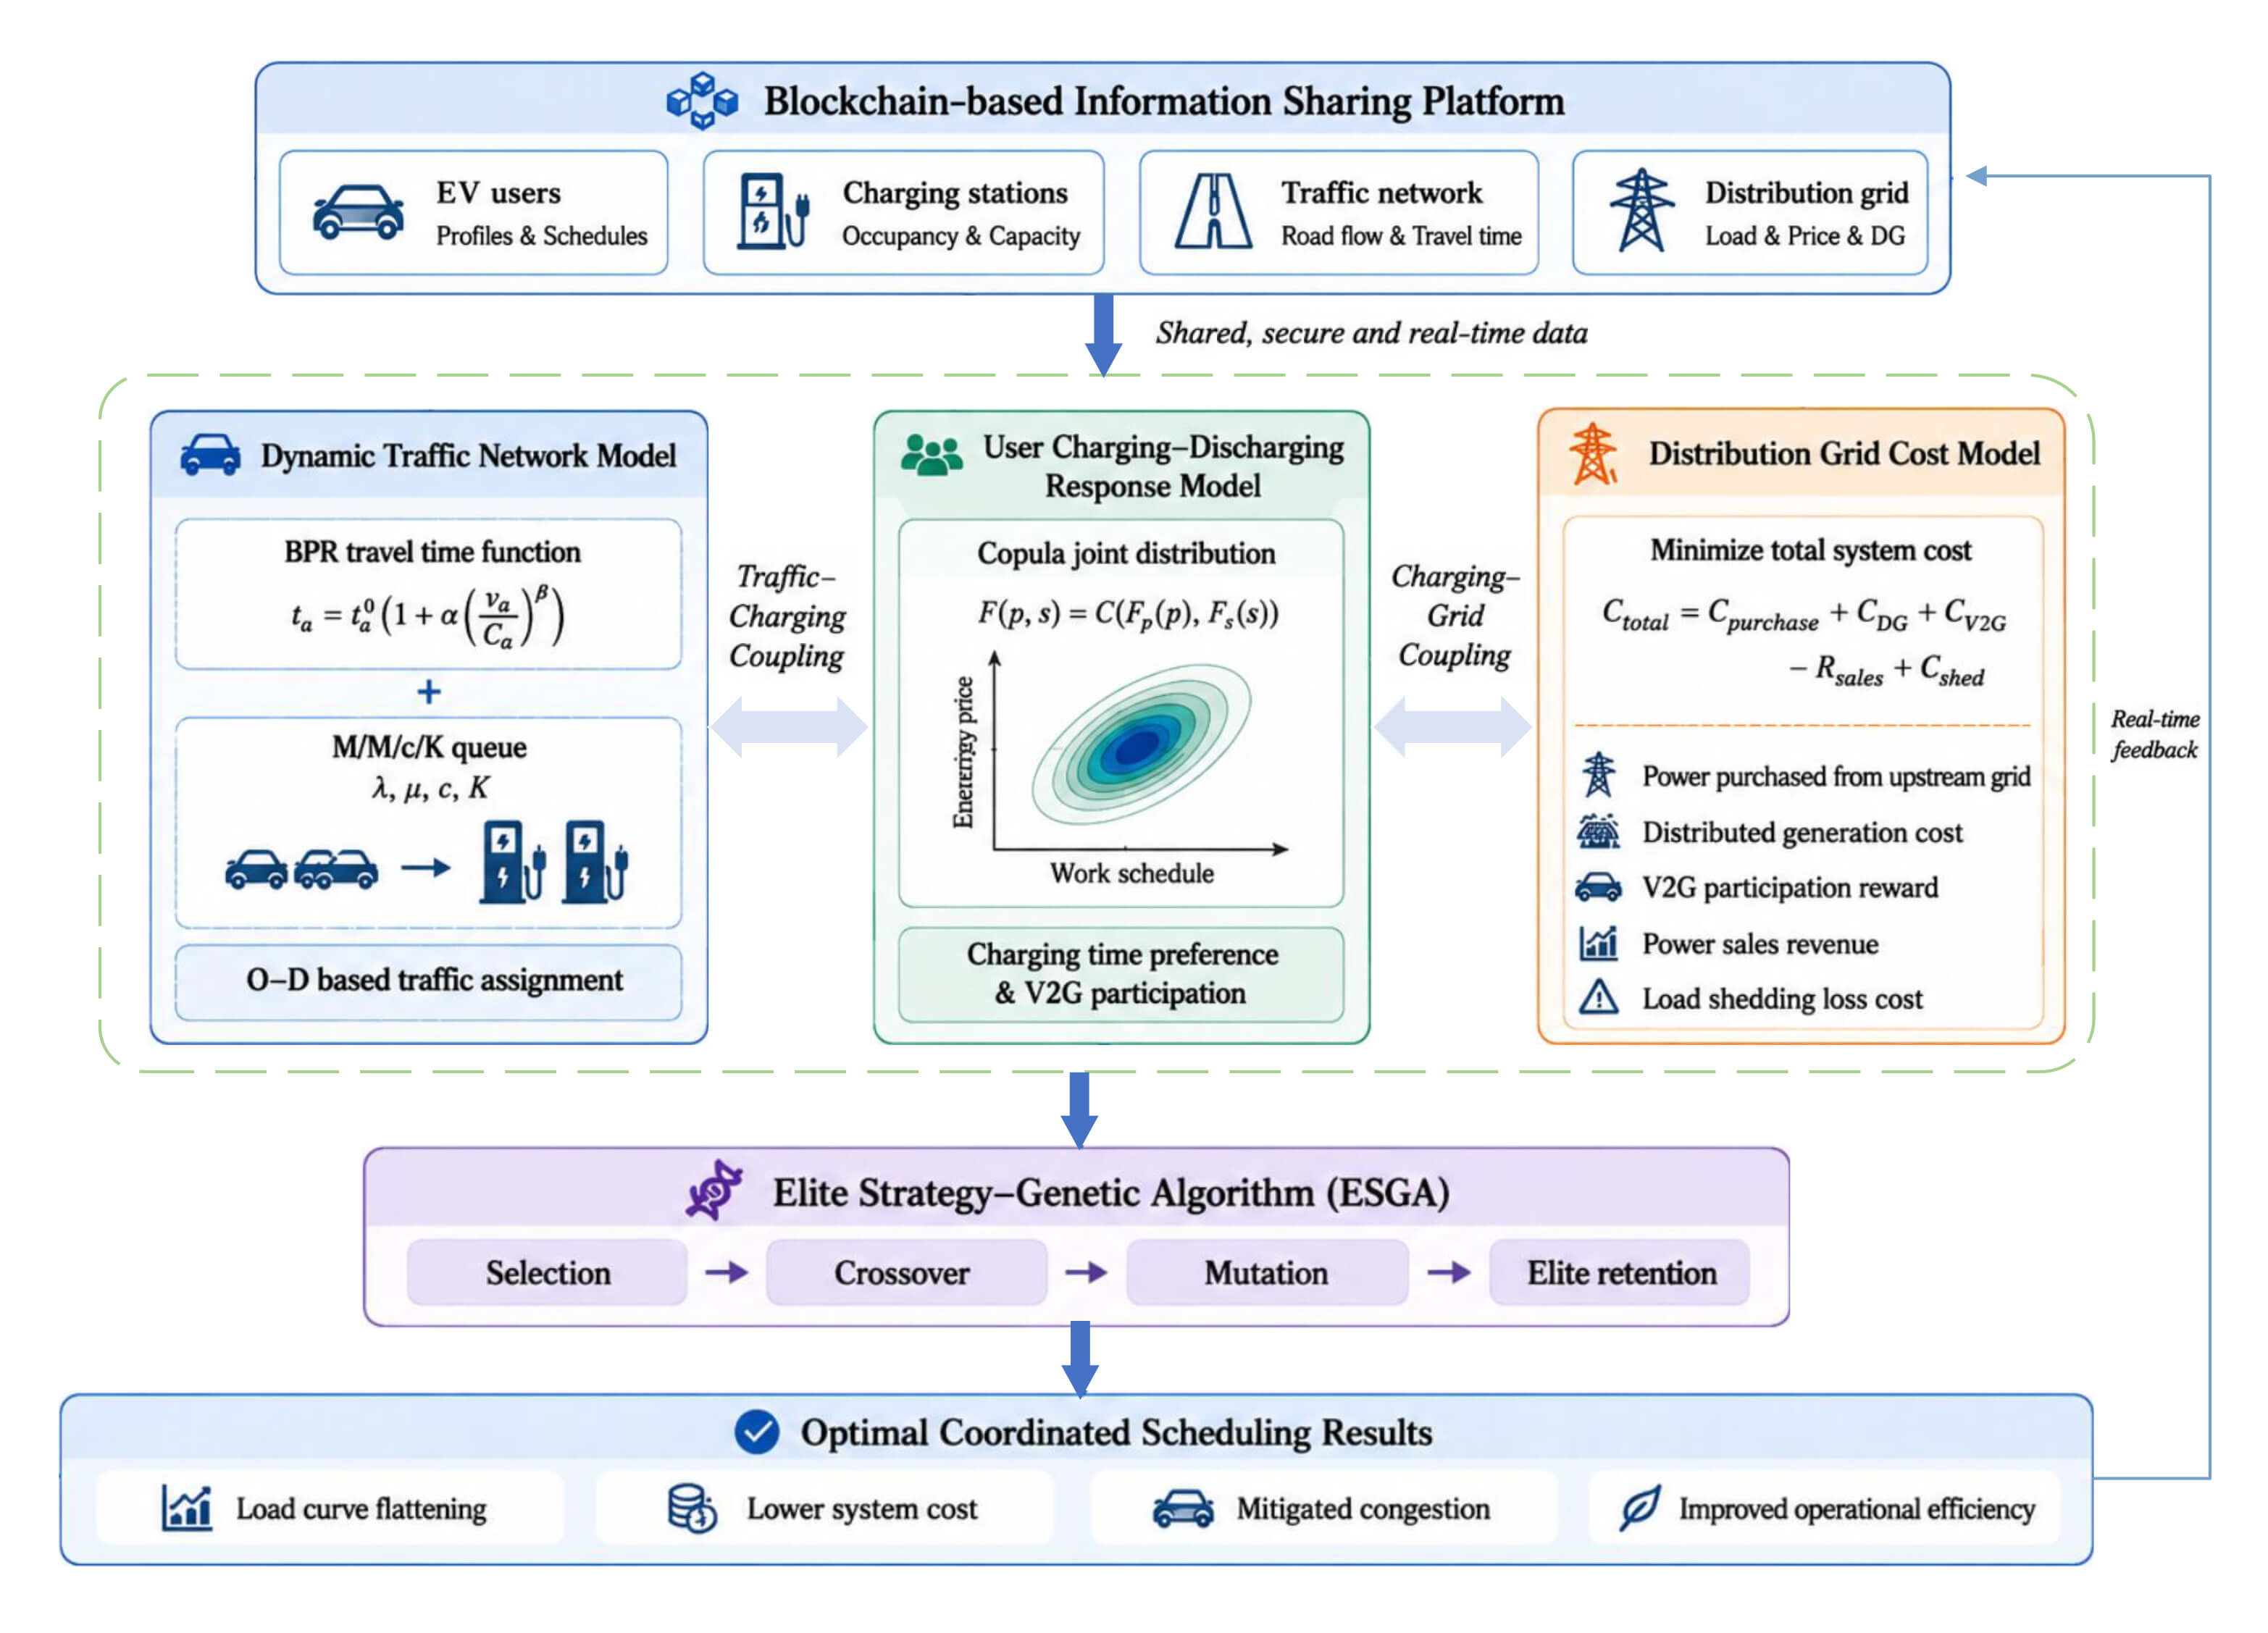
Electric vehicles (EVs), characterized by their large-scale deployment and flexible charging–discharging scheduling, represent a growing form of transportation. However, their widespread adoption poses considerable challenges to the security and stability of the power grid during peak charging periods, highlighting the need for effective management of the coupled traffic–grid system. To address this issue, this paper proposes a blockchain-driven optimization model for charging scheduling in dynamic traffic networks. Blockchain technology is introduced to ensure data transparency and security in decentralized decision-making. First, a queuing model integrating the Bureau of Public Roads (BPR) function with the M/M/c/K queue is established, and a dynamic traffic network model is constructed using origin–destination (O-D) combinations. This integrated model effectively captures travel time and queuing delays, thereby addressing constraints from user travel planning. Second, incorporating economic incentives for charging and discharging, a transfer model based on the Copula joint distribution is developed to quantify the influence of electricity prices and user work schedules on charging time preferences. Finally, a comprehensive objective function is formulated to minimize the total cost of the distribution network, incorporating key cost components such as power purchased from the upper-level grid, electricity generation from distributed sources, vehicle-to-grid (V2G) participation rewards, power sales revenue, and costs associated with load shedding losses. The model is solved using an elite strategy genetic algorithm (ESGA), demonstrating effectiveness in achieving collaborative optimization between grid and traffic flows. Case study results verify that the proposed strategy not only flattens the load curve but also reduces the overall system cost, thereby improving the operational efficiency of the coupled system.Graphic Abstract
Keywords
In recent years, the EV sector in China has witnessed remarkable growth, characterized by a sustained expansion in the national EV stock over the past five years and a consistently high annual growth rate [1,2]. This rapid development has not only propelled the ongoing energy transition in the transportation sector but has also yielded substantial benefits in terms of energy efficiency and emissions reduction [1,2]. However, the growing penetration of EVs has created a tight coupling between transportation and power distribution infrastructures. The convergence of user charging behavior leads to spatiotemporal synchronization of demand, exacerbating peak-to-valley differences and posing significant threats to both grids through potential congestion and overload [3–5].
To enhance the security of coupled transportation-power systems, coordinated charging scheduling balances grid load, mitigates traffic congestion, and reduces user costs by shifting demand and optimizing power allocation. While economic incentives are key to influencing EV user behavior, their effectiveness is limited by existing models’ inability to cope with dynamic traffic flows, resulting in a spatiotemporal mismatch between charging station utilization and actual traffic conditions.
Considerable research has been devoted to user charging behaviors, particularly regarding their diversity and uncertainty. Reference [6] proposed a dynamic pricing mechanism that accounts for regional load characteristics to optimize EV charging behavior, aiming to mitigate increased power losses in distribution networks caused by uncoordinated charging. Reference [7] established a charging decision-making model incorporating bounded user rationality to analyze the spatiotemporal patterns of EV charging behavior and demand. Reference [8] developed a regret theory-based charging decision model, integrating factors such as remaining battery capacity, electricity prices, and charging station distribution to examine the influences on charging load spatiotemporal distribution. Reference [9] further simulated user responses to price signals by considering fairness-aware decision-making and closed-loop commuting behavior. However, in existing research on EV charging guidance, current strategies exhibit shortcomings in accommodating user preferences, uncovering personalized demands, and leveraging incentive mechanisms. Most scheduling approaches predominantly rely on charging incentives and compensation, while insufficiently accounting for the diversity and uncertainty of user behavior.
Blockchain technology is utilized to store charging data in a decentralized manner across multiple nodes, including vehicles, charging piles, and grid components, through distributed ledger technology, ensuring that any single-point failure does not affect overall operations [10–12]. Research on scheduling problems based on blockchain technology has been conducted in existing literature. To enable the scheduling of charging behaviors in the distribution network, smart contracts can be employed to automatically match user charging demands with charging station capacity, while dynamically adjusting electricity prices based on user credibility, thereby achieving closed-loop optimization of demand-supply-price. The introduction of blockchain technology in electric vehicle charging scheduling is considered an inevitable choice to address challenges such as the decentralization of energy networks, the diversification of transaction entities, and the increasing sensitivity of data security. In [13], a hybrid integer linear model for the optimized scheduling of shared electric vehicles is established based on a network flow model, considering coordinated charging optimization decisions, with the aim of improving operator profits and user satisfaction. Reference [14] proposes a blockchain-based charging reservation model for electric vehicles, allowing users to reserve charging based on station queue conditions, thereby saving time. Reference [15] presents a blockchain-based protocol for efficient charging station selection and implements secure charging services and trusted reservations through smart contracts. Recent studies have significantly advanced the integration of home-connected EV charging with dynamic retail tariff structures. Current research focuses on developing pricing mechanisms that bridge the gap between wholesale market signals and residential charging behavior. For instance, Li et al. [16] demonstrated a hierarchical pricing model that coordinates utility-level prices with retail time-of-use rates, achieving 25% improvement in peak load reduction. Meanwhile, Matkovic et al. [17] proposed a game-theoretic approach for dynamic pricing optimization, effectively balancing grid constraints with user satisfaction through adaptive price signals. These approaches highlight the importance of real-time price adjustments that respond to both system conditions and consumer behavior patterns, providing valuable insights for developing practical smart-grid pricing mechanisms [18]. However, in most of these studies, transactions are primarily completed based on user preferences and reservation times, with insufficient optimization of scheduling strategies. Limitations remain in achieving orderly charging of electric vehicles, reducing user costs, and alleviating grid pressure.
To develop an aggregated electric vehicle model that combines high accuracy, high computational efficiency, and low real-time communication requirements, the following considerations should be considered.
(1) Establishes a blockchain-enabled cross-domain coordination theory for integrated transport-power systems, addressing multi-agent information sharing challenges through decentralized trust mechanisms.
(2) Develops a dynamic traffic network model by integrating BPR function with queuing theory, and characterizes user behavior patterns using Copula theory.
(3) Proposes an Elite Genetic Algorithm (ESGA) that significantly improves solution efficiency while ensuring convergence stability.
This paper proposes a blockchain-driven optimization framework for EV charging scheduling in dynamic transportation networks. The model integrates the BPR function with an M/M/c/K queuing approach to capture both road congestion and charging station dynamics, while O-D pairs simulate travel demand patterns. A Copula-based pricing mechanism quantifies how user habits and electricity prices jointly influence charging behavior. The optimization minimizes distribution network costs—including generation, procurement, and V2G compensation—using an elite genetic algorithm that enhances convergence and stability. This approach enables coordinated, efficient operation of coupled power-transportation systems under real-world constraints.
2 Cooperative Charging Scheduling Framework for Integrated Transportation-Power Grid Systems with Information Sharing
Information sharing serves as the foundational enabler for coordinated charging scheduling in integrated transportation-power distribution systems. The decentralized, tamper-proof, and trust-enhanced nature of blockchain technology provides critical technical support for cross-domain information exchange between the transportation network and the power grid. This section presents a blockchain-based information-sharing framework, explicitly defining the participating entities, shared content, technical architecture, and its supporting role in subsequent coordinated optimization models. The proposed mechanism enables real-time, trusted interoperability of multi-domain data including traffic flow, power flow, and user behavior across the coupled system. Smart contracts serve as the core execution mechanism in this framework. They are programmed to automatically trigger the following operations: Real-time matching between charging demands and station capacities based on predefined rules; Dynamic adjustment of electricity prices according to grid load conditions and user credibility scores; Automatic settlement of charging fees and V2G compensations upon task completion. This automation significantly reduces manual intervention and enhances system efficiency.
2.1 Information Sharing Entities and Core Content
Information sharing within the dynamic transportation-power grid coupled system involves multiple stakeholders. Key participants include electric vehicle (EV) users, charging station operators, distribution grid dispatch centers, distributed generation owners, and transportation management authorities. The information requirements and shared data for each entity are outlined as follows:
Electric vehicle users: The shared information is defined as real-time origin–destination pairs, state of charge, preferred charging periods, and daily routines. The acquired information is expressed as real-time queue conditions at charging stations, dynamic electricity prices—including charging prices, V2G discharge compensation, and subsidies—and link travel times.
Charging station/V2G station operators: Shared information includes real-time occupancy of charging interfaces, queue waiting times, current charging power, and available capacity; Acquired information includes traffic flow on surrounding road segments, real-time load limits of the distribution grid, and forecasts of distributed generation output, which are used to dynamically adjust service strategies [19].
Distribution grid dispatch center: The shared information includes real-time traffic flow, travel time, and traffic congestion warnings on road sections; the accessed information includes the distribution of charging routes, which is used for coordinated management of traffic pressure induced by concentrated charging activities.
The aforementioned information is uniformly stored via the blockchain’s distributed ledger, forming a tripartite information pool integrating transportation, power, and user data, thereby providing a foundational data base for subsequent modeling.
2.2 The Supporting Role of Information Sharing in Collaborative Optimization
The information-sharing mechanism provides critical data support for subsequent dynamic traffic network models, charging and discharging response models, and distribution grid cost optimization models, serving as the vital nexus for achieving transportation-grid synergy. Its specific roles are illustrated in Fig. 1.

Figure 1: Transportation-grid coordinated optimization framework under information sharing
Supporting the dynamic traffic network model: Real-time shared road segment flow data provides input parameters for the BPR function, enabling accurate travel time calculation. The integration of charging station queue information with O-D data enhances the traffic network model’s capability to precisely characterize user route selection behavior, thereby addressing travel planning constraint issues.
Supporting the charging-discharging response decision model: Blockchain-shared dynamic electricity prices and user behavioral data provide the quantitative foundation for Copula joint distribution models, enabling precise characterization of how pricing and routines influence charging time-shifting probabilities. Meanwhile, V2G compensation and subsidy information directly affect user participation rates, forming the incentive mechanism basis for the response model.
Supporting the distribution grid cost optimization model: The sharing of distributed generation output, upstream grid electricity purchase prices, and real-time charging station load data enables the distribution grid’s total cost objective function to be solved based on real-world data. Through an elite genetic algorithm, multi-factor collaborative optimization is achieved, reducing operational costs.
3 Charging Station Selection Model Incorporating Dynamic Traffic Conditions
3.1 Dynamic Traffic Network Model
During EV operation, the dynamic traffic assignment model [20] serves as a mathematical framework that characterizes the spatiotemporal evolution of traffic flow. By quantifying the time-varying distribution of vehicles across road networks, their operational states, and the dynamic progression of travel demand, it provides theoretical foundations for transportation planning, management, and control. Compared to static models, its core advantage lies in capturing time-dependent system behaviors-including flow surges during peak hours and network state transitions caused by traffic incidents-through explicit modeling of transient dynamics.
A transportation network is conceptualized as a system comprising nodes and links. The set of nodes is denoted as
To describe the aggregation relationship of vehicles on links and the dynamic process of flows entering from origin nodes and exiting to destination nodes, the following equations are established:
In the equations,
The Bureau of Public Roads (BPR) function is used to describe the travel time of vehicles on conventional links [21].
In the equation,
The charging links
In the equation,
3.2 Charging Station Selection Optimization Model
The diversity in user behavior leads to varied choices in charging station selection. To balance optimal outcomes among multiple charging stations, a computational method for evaluating user travel costs has been designed.
This approach comprehensively analyzes and compares the travel costs associated with different charging service options, enabling users to make informed charging service selections. It better aligns with real-world application scenarios when users choose charging stations.
In the equation:
4 Consideration of Price Incentives in the Charge-Discharge Response Decision Model
4.1 Charging Time Shift Probability Model under Incentive Pricing
This study leverages shared incentive pricing information to encourage user participation in charging scheduling. However, whether users adjust their charging time depends not only on temporal price differences but also on their daily routines. For instance, early risers are unlikely to delay their charging to off-peak hours even for cost savings and their participation probability further decreases as the suggested delay extends deeper into the night.
The functional zones within the community are categorized into three types: residential (H), workplace (W), and recreational (C) [23]. The H, W, and C zones where vehicle owners reside, work, or engage in leisure activities are referred to as the associated zones of the respective vehicles. Since charging typically takes several hours, charging demand usually arises when vehicles approach their associated zones. Specifically, residents in zone H often generate charging demand based on their remaining battery level when returning home after work. They may delay charging to late-night off-peak hours to take advantage of lower electricity prices. In contrast, users in zones W and C have parking durations and schedules heavily influenced by work or activities, making them less likely to shift their charging times in response to incentive pricing.
Based on the above conclusions, it can be inferred that the user response to incentive compensation is bounded within a specific range. When the compensation price is sufficiently low, charging time shift is not observed due to user unwillingness to wait. Once the compensation price reaches a threshold value, charging time shift is considered by users, and the shift probability is increased with further increases in the compensation price. When the compensation price exceeds a certain level, the number of vehicles undergoing charging time shift approaches saturation, though not all vehicles are observed to shift. Accordingly, the charging time shift probability model is constructed as follows:
Therefore, the probability distribution function of charging time shifting influenced by incentive pricing can be expressed as:
In the equation, ω(t) is defined as the incentive compensation price difference at time t, and
From the perspective of users’ sleep habits, they are unlikely to wake up after falling asleep to transfer their charging time. Therefore, the probability of charging time transfer influenced by users’ daily routines is:
In the equation,
From a pricing perspective, users tend to shift their charging time to off-peak hours. However, from the standpoint of daily routines, the probability of user response decreases over time as the night progresses. Therefore, the two influencing factors have a negative correlation. To combine these two factors, the probability of charging time transfer, influenced by
The parameters are determined by maximizing the log-likelihood function of the probability density function.
In the equation,
4.2 Users’ Charging Response to Incentive Pricing
This paper proposes using incentive-based compensation to guide electric vehicle (EV) charging during off-peak and peak periods, achieving load balancing at charging stations through price-based regulation across time and space. When EV users have charging demands, they autonomously decide whether to respond to the incentive mechanism based on shared compensation price information, thereby forming responsive and non-responsive clusters. For the responsive cluster, the study assumes full compliance with the incentive compensation, meaning participation in the distribution grid’s charging scheduling. In contrast, the non-responsive cluster indicates users with lower sensitivity to compensation prices, who will maintain their original charging choices [24,25]. This differentiated response mechanism enables charging station operators to precisely regulate load distribution.
The price incentive model established in this study is essentially a dynamic system with closed-loop feedback characteristics. Its core lies in achieving real-time coupling and synergistic interaction among price evolution, user response, and grid load balancing. This coupling mechanism is automated through blockchain smart contract technology, forming a complete “state perception-decision optimization-execution feedback” loop. he coupling relationship among these three elements constitutes a dynamic equilibrium system: price evolution drives user response, user response changes the grid load, and the load state feeds back into the price generation mechanism. This closed-loop structure ensures the system can automatically track the optimal operating point, achieving the comprehensive goals of peak shaving, valley filling, and safe and economic operation.
When faced with charging guidance, users’ willingness to respond varies depending on the incentive discounts offered. This paper uses the term response rate to describe users’ willingness to respond. Fig. 2 illustrates the relationship between users’ response levels and different incentive intensities [26].

Figure 2: EV user response rates under different incentive levels across two time periods. (a) Off-Peak charging response level; (b) Peak-hour charging response level
As can be seen from Fig. 2a, as the incentive level increases from 0, the user response rate gradually rises from 0 with upper and lower bounds before reaching threshold
In contrast to Fig. 2a,b demonstrates that user response only initiates when the incentive level reaches threshold
4.3 User Response to Incentive-Based Discharge Pricing
The percentage of vehicles participating in V2G scheduling
The percentage of vehicles opting for initial charging paths instead of participating in V2G scheduling
In the equation, p is defined as the state-of-charge (SOC) level of electric vehicle users;
5 Charging Optimization Scheduling Model for Distribution Network Operating Costs
Modern distribution networks, as the core carriers of power systems, exhibit diversified and dynamic operating cost characteristics. Against the backdrop of high renewable energy penetration and large-scale electric vehicle integration, system operating costs must transition from traditional single-source procurement to multi-factor coordinated optimization. The specific cost structure can be decomposed into five core components: upstream grid electricity procurement costs, distributed generation costs, V2G compensation payments, charging station electricity sales revenue, and load shedding penalties, as formally expressed below:
The calculation formulas for each component are as follows:
In the equation,
5.2.1 Distributed Renewable Energy Output Constraints
Since the distributed renewable energy generation is owned by the charging stations and has extremely low marginal costs, its output costs are not considered in short-term economic optimization.
Renewable energy output exhibits volatility and instability. The constraints related to renewable energy output and total power are as follows:
In the equation,
5.2.2 Dynamic Traffic Link Aggregated Flow Constraints
Considering that the aggregated link flow should not exceed road capacity, to prevent traffic congestion from affecting charging accessibility:
5.2.3 Dynamic Traffic Node Flow Conservation Constraints
In the equation,
5.2.4 EV Travel Energy Constraints
When EV users select charging stations, they should choose stations within the range that their remaining battery charge can reach to avoid complete battery depletion.
In the equation, ξ is defined as the EV energy consumption coefficient, which is influenced by factors such as weather, road conditions, and driving habits, with units of electricity consumption per 100 km;
In the equation,
5.2.5 Price Fluctuation Constraints
In the equation,
In the equation,
5.2.7 Node Voltage Constraints
In the equation,
This paper cites a solution model based on an elite genetic algorithm, which demonstrates superior convergence speed compared to traditional genetic algorithms [27]. The core concept of this algorithm lies in selecting elite individuals from the previous generation population to form an elite population. During the iteration process of the new generation population, individuals with lower fitness in the original population are replaced by the elite population, thereby enhancing the retention capability of high-quality genes. The optimization process of the genetic algorithm is specifically illustrated in Fig. 3.

Figure 3: Genetic algorithm optimization process
The EV charging scheduling optimization model proposed in this study constitutes a large-scale nonlinear combinatorial optimization problem with complex constraints. Conventional mathematical programming methods face challenges in handling the non-convexity and high dimensionality of such a problem.
The Enhanced Selective Genetic Algorithm (ESGA) is selected primarily for three reasons. First, its chromosome encoding scheme naturally accommodates the representation of complex scheduling plans. Second, the algorithm possesses strong global search capabilities, enabling efficient exploration of high-quality solutions within a large search space. Most importantly, its elite preservation strategy significantly accelerates convergence and ensures solution stability—a fact validated in the case study through comparative experiments with the standard Genetic Algorithm. While other heuristic methods could also be applied, ESGA has been widely and successfully used in similar resource scheduling problems, and its performance in this case is shown to be both superior and reliable.
6 Case Study Results and Analysis
6.1 Case Study Scenario Configuration
15% of vehicles in travel demand require charging, with a charging power of 60 kW and V2G power of 40 kW. Both charging and V2G durations are set at 30 min. The charging station capacity accommodates 60 vehicles, while the V2G station capacity supports 30 vehicles. The user’s travel time cost is quantified at 5 yuan per 10-min interval. Vehicle remaining battery levels (p) are categorized into three tiers (25%, 50%, and 75%), corresponding to conservative, neutral, and aggressive V2G response user profiles, respectively, with associated parameters of 0.2/0.4/0.6 and 0.01/0.02/0.03, distributed among 25%/50%/25% of vehicles. The study adopts a standardized EV battery capacity of 30 kWh, assumes equivalent charging and discharging efficiencies of 0.95, and uses a baseline electricity price of 0.5 yuan/kWh for conventional consumption.
6.1.2 Traffic Network Parameter Configuration
The Nguyen–Dupuis network was selected as the traffic network model [28], comprising 13 nodes, 19 links, and 4 origin-destination (O-D) pairs. The network is equipped with 4 EV charging stations and 2 V2G stations, which are modeled as charging and V2G nodes, respectively, expanding the total network to 19 regular nodes, 4 charging stations, and 2 V2G stations. The charging station capacity is set at 60 vehicles, while the V2G station capacity accommodates 30 vehicles. This study employs a genetic algorithm to solve the optimization model, with an initial population size of 300, a total of 80 iterations, a crossover probability of 0.8, and a mutation probability of 0.4.
Fig. 4 demonstrates that when the number of iterations reaches 80, the model achieves optimal optimization and convergence probability, indicating the rationality of the genetic algorithm simulation parameter settings.

Figure 4: Evolutionary optimization process diagram
6.1.3 Distribution Network Parameter Configuration
This study employs a 33-node distribution network coupled system as a case study to validate the safety and economic benefits brought by the optimal pricing strategy for vehicle-grid interaction considering dynamic traffic flow. Charging stations CS1 and CS2 are equipped with distributed photovoltaic systems, connected to nodes 22 and 25 of the distribution network, respectively, while CS3 and V2G1 are jointly connected to node 16, and CS4 and V2G2 are jointly connected to node 30. The charging electricity price ranges from
The distribution network, as shown in Fig. 5, adopts a 33-node system [29]. Node 1 is connected to the upper-level grid, while the network incorporates 3 distributed generation units. Charging stations CS1 and CS2 are equipped with distributed photovoltaic systems, connected to nodes 22 and 25 of the distribution network, respectively. CS3 and V2G1 are jointly connected to node 16, and CS4 and V2G2 are jointly connected to node 30.

Figure 5: Power distribution-traffic coupling topology diagram
6.2 Case Study Results Analysis
As shown in Figs. 6 and 7, without scheduling optimization, the vehicle charging distribution exhibits significant imbalance characteristics. Since CS4 charging station is located closer to residential areas, it accommodates the highest number of charging vehicles while simultaneously demonstrating the longest queue waiting time. This concentrated charging behavior easily leads to local station overloads and increases peak-valley differences in the distribution network. After scheduling optimization, both the number of charging vehicles and queue waiting times at each station become more balanced. The vehicle numbers and waiting times at high-load stations like CS3 and CS4 decrease significantly, thereby alleviating pressure on peak-demand stations.

Figure 6: Comparison between uncoordinated and coordinated charging at the temporal scale

Figure 7: Comparison between uncoordinated and coordinated charging at the spatial scale
To achieve the “Dual Carbon” goals, China is accelerating the development of a new power system dominated by renewable energy. The integration of renewable energy sources is also a key research focus in meeting these targets. The energy required for electric vehicle (EV) charging can significantly enhance the utilization rate of renewable energy, improve its integration efficiency, and promote the transformation of China’s energy structure. The Chinese government is actively promoting renewable energy generation technologies, with photovoltaic power generation as a representative example. The output of PV power is closely linked to natural conditions and is subject to instability due to factors such as weather variations and seasonal changes, making intermittent output a defining characteristic of renewable energy. This uncertainty can affect energy supply reliability, particularly during peak demand periods or under adverse weather conditions. Fig. 8 illustrates a typical output curve of a PV power station.

Figure 8: Typical output curve of a photovoltaic power station
To visually demonstrate the optimization effects of different scheduling strategies on charging load distribution, this paper conducts a comparative analysis of the results from uncoordinated charging, traditional genetic algorithm scheduling, and elite genetic algorithm scheduling, with the corresponding load power distributions shown in Fig. 8. These three strategies respectively reflect the load fluctuation characteristics of EV charging behavior under uncontrolled conditions, traditional optimization algorithm control, and improved algorithm control.
Please see the research result shown in Table 1. regarding peak shaving, both algorithms effectively reduce the charging load from 4105.05 under uncoordinated conditions to 3281.06 during the peak period (20:00), indicating that ESGA achieves comparable peak shaving performance to TGA while demonstrating superior convergence stability. In terms of valley filling, during the off-peak period at 4:00, both algorithms successfully increase the load from 769.13 to 1519.13 under uncoordinated conditions, fully utilizing the redundant capacity and resulting in a pronounced valley-filling effect.

Fig. 9 shows the charging load power distribution under uncoordinated charging, conventional genetic algorithm, and elitist genetic algorithm. In uncoordinated charging, the peak-to-valley load difference is observed to be substantial, with the load dropping to a trough during 0–4 at night and peaking during 18–22 in the evening. Due to random user behavior, significant grid fluctuations and high risks are induced. After optimization by the conventional genetic algorithm, the peak-to-valley difference is reduced, with peak loads lowered and valley loads raised, achieving “peak shaving and valley filling”. However, pressure during peak hours persists, optimization depth is limited, and fluctuations during off-peak hours (8–16) are reduced but remain. Peak shaving is approximately 10%–20%, and due to the randomness of genetic operations, the algorithm is prone to local optima. The confidence intervals around its curve reflect result fluctuations, indicating suboptimal optimization stability. With the elitist genetic algorithm, which incorporates an elite retention mechanism, the peak-to-valley difference is further narrowed. Peak loads are lower and the curve is smoother, with valleys more fully filled. Off-peak loads are stabilized within the 2300–3000 range, and peak shaving exceeds 20%. Significant improvements are demonstrated in load balance and curve smoothness compared to the conventional algorithm, with narrower confidence intervals and more stable optimization results. Thus, uncoordinated charging is shown to threaten grid security and economic operation. While genetic algorithms can improve load distribution, the elitist genetic algorithm, with its superior optimization capability and stability, provides more reliable technical support for grid demand response and intelligent charging facility scheduling.

Figure 9: Charging load statistics before and after optimization
Fig. 10 shows the number of EVs participating in scheduling response under different incentive discounts. As can be seen from Fig. 9, initially, as users are attracted by the incentive prices, the number of EVs participating in scheduling response gradually increases with higher incentive discounts. However, as the incentive discounts continue to rise, the responding users reach saturation, and the number of participating EVs stabilizes without further increase.

Figure 10: Number of EVs participating in incentive-based demand response under different incentive discounts
To comprehensively consider the impact of charging/discharging incentive mechanisms on the revenue of EV charging station operators, this paper conducts revenue analysis for the following four scenarios:
Scenario 1: EV users are not involved in charging dispatch, no incentive compensation prices are set, and subsidies from the grid are not accepted. Charging is conducted independently by EV users.
Scenario 2: EV users are guided by low incentives, where the incentive price is set at a level that induces a low user response. Subsidies for following dispatch guidance are accepted, and charging electricity price discounts are provided to users.
Scenario 3: EV users are guided by high incentives, where the incentive price is set at a level that induces a high user response without reaching saturation. The dispatching guidance from the distribution network is accepted, and charging electricity price discounts are provided to users.
Scenario 4: EV users are guided by high incentives, and compared with the incentive price set in Scenario 3, the incentive compensation price has reached saturation.
In all four scenarios, the goal is to minimize the distribution network’s operating costs, with the key difference being the varying attitudes of EV users toward the charging and discharging incentive mechanisms.
Please see the research result shown in Table 2. Scenario 3 achieves the lowest total operating cost (calculated as 5.14), which primarily results from a substantial reduction in upstream electricity purchase cost (2.15) and load shedding cost (0.12), along with an increase in V2G compensation (0.25) and charging revenue (0.43). Compared with the total cost of 7.60971 in the baseline Scenario 1, Scenario 3 achieves a cost reduction of approximately 32.4%, strongly demonstrating the economic advantage of the proposed blockchain-enabled coordination mechanism.

Fig. 11 presents the composition of distribution network operating costs under four charging scheduling scenarios, covering five indicators: load shedding, charging revenue, V2G, distributed generation, and upstream power procurement. In Scenario 1, where users do not participate in scheduling, uncoordinated charging results in significant peak-valley load differences, high costs for external power procurement and load shedding, and minimal contributions from V2G and charging revenue. Scenario 2 employs low incentives to guide participation, reducing load shedding and external procurement costs, with initial but limited benefits from V2G and charging revenue. Scenario 3 utilizes high incentives to drive deeper participation, further lowering load shedding costs, reducing external procurement, and increasing the proportion of V2G and charging revenue. In Scenario 4, with saturated user response, the load and source-load-storage achieve deep coordination, nearly eliminating load shedding, minimizing external procurement, maximizing revenue, and stabilizing costs.

Figure 11: Comparison of distribution network operating costs across scenarios
This study addresses the power system scheduling challenges arising from large-scale electric vehicle integration by proposing a blockchain-driven charging scheduling optimization framework. Through the construction of a dynamic traffic network model, incentive electricity price response mechanism, and elite genetic algorithm solution model, the following key conclusions are drawn:
This paper proposes an information-sharing-based dynamic traffic network model and charging station selection model to quantify user travel costs and route choice behavior. By combining the BPR function and queuing model, it accurately captures vehicle movement and charging queue dynamics.
This paper establishes an incentive electricity price-based sharing mechanism, identifies user response characteristics to different incentive levels during off-peak and peak charging periods, and achieves refined categorical guidance of user charging behaviors. By dynamically adjusting incentive strategies according to real-time load conditions, the mechanism effectively balances charging station load both temporally and spatially.
This paper designs a charging time transition probability model based on the Copula joint distribution, which explicitly captures the interactive effects of price incentives and user routines on charging time decisions. The proposed model is validated to effectively achieve “peak shaving and valley filling” and cost control objectives, thereby optimizing the operational costs of the distribution network. This approach provides robust support for the economically efficient operation of the coupled transportation–power grid system.
Furthermore, the blockchain technology serves as the trust infrastructure throughout the optimization framework. It not only ensures the integrity and reliability of multi-domain data but also enables automated execution through smart contracts. The case study results confirm that blockchain’s decentralized trust mechanism is essential for achieving practical coordination in multi-stakeholder environments like the coupled transportation-power system.
Future Work will focus on scalability and generalization by evaluating the model in large-scale urban networks. Computational challenges will be addressed using distributed optimization algorithms, and a sensitivity analysis will assess the impact of key parameters to enhance adaptability. The framework’s practicality and robustness will be validated by integrating real-world data from smart grids and dynamic traffic systems.
Acknowledgement: This research was supported by State Grid Jiangsu Electric Power Co., Ltd. The author expresses sincere gratitude to all those who participated in this study.
Funding Statement: This work is supported by the State Grid Jiangsu Electric Power Co., Ltd. Science and Technology Project (Grant number: J2024132).
Author Contributions: Conceptualization, Yi Pan and Mingshen Wang; methodology, Yi Pan and Mingshen Wang; software, Mingshen Wang and Ye Xue; validation, Huiyu Miao, Kemin Dai and Xiaodong Yuan; formal analysis, Yi Pan and Mingshen Wang; investigation, Kemin Dai and Xiaodong Yuan; resources, Yi Pan and Fei Zeng; data curation, Mingshen Wang and Ye Xue; writing—original draft preparation, Yi Pan, Mingshen Wang and Ye Xue; writing—review and editing, Huiyu Miao, Kemin Dai and Ye Xue; supervision, Fei Zeng; project administration, Xiaodong Yuan; funding acquisition, Yi Pan. All authors reviewed the results and approved the final version of the manuscript.
Availability of Data and Materials: The authors confirm that the data used in this study are available on request. Data supporting this study are included in the article.
Ethics Approval: Not applicable.
Conflicts of Interest: The authors declare no conflicts of interest to report regarding the present study.
References
1. Liang F, Dong H, Ji Z, Zhang W, Zhang H, Cao C, et al. Temperature-dependent synthesis of SnO2 or Sn embedded in hollow porous carbon nanofibers toward customized lithium-ion batteries. Sci China Mater. 2023;66(5):1736–46. doi:10.1007/s40843-022-2301-y. [Google Scholar] [CrossRef]
2. Zhang C, Kuang Y. Low-carbon economy optimization of integrated energy system considering electric vehicles charging mode and multi-energy coupling. IEEE Trans Power Syst. 2024;39(2):3649–60. doi:10.1109/tpwrs.2023.3280067. [Google Scholar] [CrossRef]
3. Stringini L, Allison N, do Prado JC. Optimal EV charging station allocation for a coupled power-transportation system considering road congestion mitigation. In: 2024 IEEE Power & Energy Society General Meeting (PESGM); 2024 Jul 21–25; Seattle, WA, USA. p. 1–5. doi:10.1109/PESGM51994.2024.10689167. [Google Scholar] [CrossRef]
4. Yu W, Qi L, Li M, Luan W, Guo X. Heuristic strategies for traffic guidance in scenarios with multiple EVs and multiple accident points. In: 2024 International Conference on Networking, Sensing and Control (ICNSC); 2024 Oct 18–20; Hangzhou, China. doi:10.1109/ICNSC62968.2024.10760001. [Google Scholar] [CrossRef]
5. Pandey G, Narsa Reddy T. Power flow study of grid connected bidirectional WPT systems for EV application. In: 2020 IEEE International Conference on Power Electronics, Smart Grid and Renewable Energy (PESGRE2020); 2020 Jan 2–4; Cochin, India. p. 1–6. doi:10.1109/pesgre45664.2020.9070486. [Google Scholar] [CrossRef]
6. Shi X, Xu Y, Guo Q, Sun H. Optimal dispatch based on aggregated operation region of EV considering spatio-temporal distribution. IEEE Trans Sustain Energy. 2022;13(2):715–31. doi:10.1109/tste.2021.3130547. [Google Scholar] [CrossRef]
7. Erdogan N, Pamucar D, Kucuksari S, Deveci M. A hybrid power heronian function-based multicriteria decision-making model for workplace charging scheduling algorithms. IEEE Trans Transp Electrific. 2023;9(1):1564–78. doi:10.1109/tte.2022.3186659. [Google Scholar] [CrossRef]
8. Li X, Han Q. An EV charging station load prediction method considering distribution network upgrade. IEEE Trans Power Syst. 2024;39(2):4360–71. doi:10.1109/tpwrs.2023.3311795. [Google Scholar] [CrossRef]
9. Lv S, Sun G, Wei Z, Chen S, Chen Z. Optimal pricing and energy sharing of EV charging stations with an augmented user equilibrium model. IEEE Trans Power Syst. 2024;39(2):4336–49. doi:10.1109/tpwrs.2023.3288369. [Google Scholar] [CrossRef]
10. Li Y, Ma Y, Zhu Z, Qi G, Zhou Z, Huang X. Blockchain-based EVs charging right trading model. In: 2023 IEEE 6th International Electrical and Energy Conference (CIEEC); 2023 May 12–14; Hefei, China. p. 1107–11. doi:10.1109/CIEEC58067.2023.10166413. [Google Scholar] [CrossRef]
11. Ping J, Chen S, Yan Z, Wang H, Yao L, Qian M. EV charging coordination via blockchain-based charging power quota trading. In: 2019 IEEE Innovative Smart Grid Technologies—Asia (ISGT Asia); 2019 May 21–24; Chengdu, China. p. 4362–7. doi:10.1109/isgt-asia.2019.8881070. [Google Scholar] [CrossRef]
12. Agarwal S, Jain A. Blockchain applications in smart grid: challenges and opportunities. In: 2023 IEEE International Conference on Blockchain and Distributed Systems Security (ICBDS); 2023 Oct 6–8; New Raipur, India. p. 1–7. doi:10.1109/icbds58040.2023.10346363. [Google Scholar] [CrossRef]
13. Sakamoto Y, Namba T, Takaba K. Energy management of a workplace with EVs by mixed-integer linear programming. In: 2024 International Technical Conference on Circuits/Systems, Computers, and Communications (ITC-CSCC); 2024 Jul 2–5; Okinawa, Japan. p. 1–5. doi:10.1109/itc-cscc62988.2024.10628194. [Google Scholar] [CrossRef]
14. Padma J, Likhita K, Charan SRS, Pradhayi GLKV, Vardhan CN. Resident-centric government EV charging stations using blockchain technology. In: 2024 IEEE International Conference on Blockchain and Distributed Systems Security (ICBDS); 2024 Oct 17–19; Pune, India. p. 1–5. doi:10.1109/icbds61829.2024.10837447. [Google Scholar] [CrossRef]
15. Gohil K, Gohil A, Gupta R, Tanwar S. Deep learning and proxy smart contract-based supply chain management for electric vehicles. In: 2024 IEEE Third International Conference on Power Electronics, Intelligent Control and Energy Systems (ICPEICES); 2024 Apr 26–28; Delhi, India. p. 1172–7. doi:10.1109/icpeices62430.2024.10719230. [Google Scholar] [CrossRef]
16. Li J, Xu X, Karimi HR, Wu Z. Optimization of electric vehicle charging strategies in residential integrated energy systems: a SARIMA model approach for dynamic electricity prices. Energy. 2025;330:136600. doi:10.1016/j.energy.2025.136600. [Google Scholar] [CrossRef]
17. Matkovic D, Pilski TM, Capuder T. Participation of electric vehicle charging station aggregators in the day-ahead energy market using demand forecasting and uncertainty-based pricing. Energy. 2025;328:136299. doi:10.1016/j.energy.2025.136299. [Google Scholar] [CrossRef]
18. Meng Q, He Y, Gao Y, Hussain S, Lu J, Guerrero JM. Bi-level four-stage optimization scheduling for Active Distribution Networks with Electric Vehicle integration using multi-mode dynamic pricing. Energy. 2025;327:136316. doi:10.1016/j.energy.2025.136316. [Google Scholar] [CrossRef]
19. Deshmukh SM, Singh M, Kumar S, Rana GK. Microgrid powered plug-in hybrid EV charging stations with adaptive Harris’ Hawks optimization technique for enhancing reliability. In: 2024 Fourth International Conference on Advances in Electrical, Computing, Communication and Sustainable Technologies (ICAECT); 2024 Jan 11–12; Bhilai, India. p. 1–7. doi:10.1109/icaect60202.2024.10469537. [Google Scholar] [CrossRef]
20. Wei C, Tang D, Hong L. Propagation analysis and cascading effects of charging station failure considering dynamic traffic assignment. In: 2021 IEEE Sustainable Power and Energy Conference (iSPEC); 2021 Dec 23–25; Nanjing, China. p. 3538–43. doi:10.1109/ispec53008.2021.9735724. [Google Scholar] [CrossRef]
21. Liu Y, Wang Y, Li Y, Gooi HB, Xin H. Multi-agent based optimal scheduling and trading for multi-microgrids integrated with urban transportation networks. IEEE Trans Power Syst. 2021;36(3):2197–210. doi:10.1109/tpwrs.2020.3040310. [Google Scholar] [CrossRef]
22. Li Y, Chai S, Zhang X, Wang G, Zhu R, Chung E. STPNet: quantifying the uncertainty of electric vehicle charging demand via long-term spatiotemporal traffic flow prediction intervals. IEEE Trans Intell Transport Syst. 2023;24(12):15018–34. doi:10.1109/tits.2023.3305626. [Google Scholar] [CrossRef]
23. Xu X, Li K, Wang F, Mi Z, Jia Y, Wei W, et al. Evaluating multitimescale response capability of EV aggregator considering users’ willingness. IEEE Trans Ind Applicat. 2021;57(4):3366–76. doi:10.1109/tia.2021.3081402. [Google Scholar] [CrossRef]
24. Khorramdel H, Gitizadeh M, Siano P, Bakhtiari S. Evaluating the economic impact of users’ personality on selection of demand response programs. CSEE J Power Energy Syst. 2021;9(3):1036–50. doi:10.17775/cseejpes.2020.05710. [Google Scholar] [CrossRef]
25. Tang D, Wang P. Probabilistic modeling of nodal charging demand based on spatial-temporal dynamics of moving electric vehicles. IEEE Trans Smart Grid. 2015. doi:10.1109/tsg.2015.2437415. [Google Scholar] [CrossRef]
26. Cui L, Qu H, Ju P, Ge L, Wang M. A forecasting method for EV charging demand considering refined division of functional areas. In: 2022 IEEE 5th International Electrical and Energy Conference (CIEEC); 2022 May 27–29; Nangjing, China. p. 4067–72. doi:10.1109/cieec54735.2022.9846246. [Google Scholar] [CrossRef]
27. Zhou T, Zhou Z, Li X, Zhang B. Joint rebalancing and vehicle-to-grid coordination of EVs through an aggregative game model. In: 2023 IEEE 7th Conference on Energy Internet and Energy System Integration (EI2); 2023 Dec 15–18; Hangzhou, China. p. 1–6. doi:10.1109/ei259745.2023.10512781. [Google Scholar] [CrossRef]
28. Xie Z, Qi W, Huang C, Li H. Effect analysis of EV optimal charging on DG integration in distribution network. In: 2019 IEEE 8th International Conference on Advanced Power System Automation and Protection (APAP); 2019 Oct 21–24; Xi’an, China. p. 525–8. doi:10.1109/apap47170.2019.9224720. [Google Scholar] [CrossRef]
29. Zhu Y, Lee KY, Wang Y. Adaptive elitist genetic algorithm with improved neighbor routing initialization for electric vehicle routing problems. IEEE Access. 2021;9:16661–71. doi:10.1109/access.2021.3053285. [Google Scholar] [CrossRef]
Cite This Article
 Copyright © 2026 The Author(s). Published by Tech Science Press.
This work is licensed under a Creative Commons Attribution 4.0 International License , which permits unrestricted use, distribution, and reproduction in any medium, provided the original work is properly cited.
 Downloads
 Citation Tools
