
 Login
Login Register
 Submit a Paper
 Propose a Special lssue
 Open Access
ARTICLE
Quantitative Evaluation Model of Tight Reservoir Permeability Based on the Dual Effect of Temperature and Pressure
1 The College of Petroleum, China University of Petroleum (Beijing) at Karamay, Karamay, China
2 Heavy Oil Development Company, Xinjiang Oilfield Company, PetroChina, Karamay, China
3 Intercontinental Strait Energy Technology Co., Ltd., Chengdu, China
* Corresponding Author: Hu Yang. Email:
(This article belongs to the Special Issue: Enhanced Oil and Gas Recovery in Unconventional Reservoirs)
Energy Engineering 2026, 123(11), 8 https://doi.org/10.32604/ee.2026.079024
Received 13 January 2026; Accepted 25 March 2026; Issue published 24 September 2026
 View Full Text
 Download PDF
Abstract
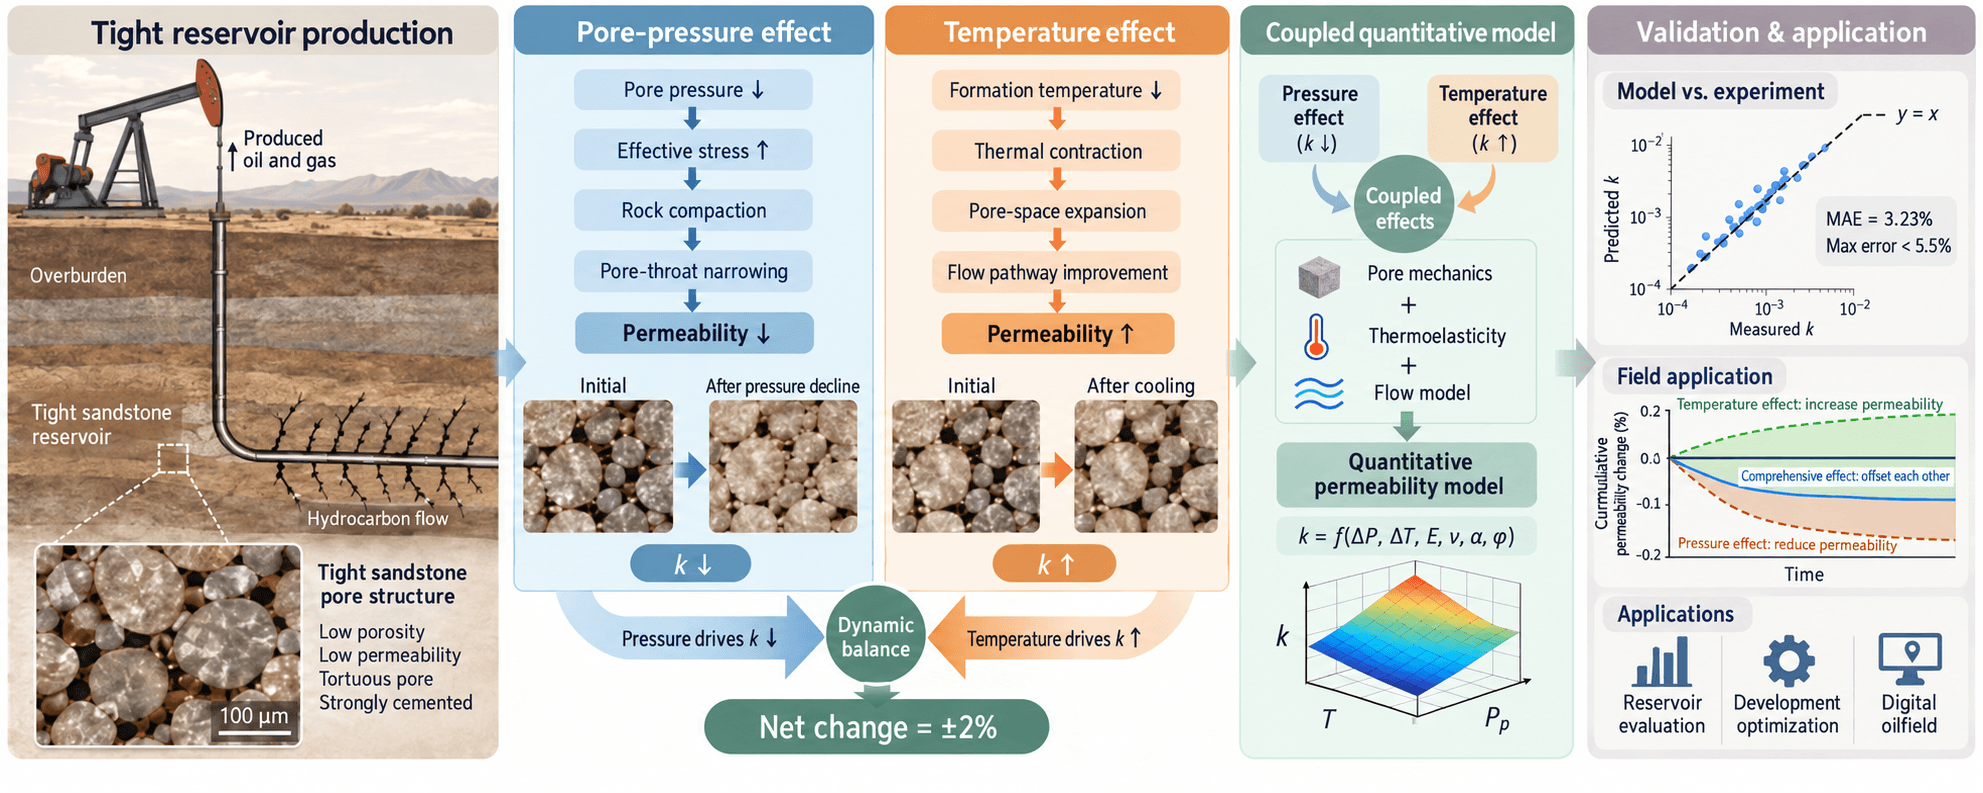
To quantitatively evaluate the changes in reservoir permeability induced by variations in temperature and pore pressure during the oil and gas exploitation process, this study proposes a novel quantitative evaluation model. This model innovatively integrates thermoelastic and poroelastic effects to predict the evolution of permeability in tight reservoirs. The study assumes that rocks undergo only elastic deformation, and the stress–strain relationships governing pore volume and pore size were derived based on the theory of elasticity for porous media. A capillary flow model was employed to simulate the fluid flow process, and in combination with the Kozeny-Carman equation, a quantitative model was developed to describe permeability changes as functions of temperature and pore pressure. To address the limitations of conventional permeability testing methods, the experimental setup was modified to replicate actual reservoir temperature and pressure conditions, allowing for simultaneous measurements of rock mechanics and permeability. The results show that the permeability reduction predicted by the model is in strong agreement with experimental data, thereby validating the reliability of the proposed model. It is observed that during the oil and gas exploitation process, a decline in pore pressure leads to a reduction in permeability, whereas a decrease in reservoir temperature enhances permeability. These two effects tend to offset each other, resulting in a relatively small net change in permeability, typically within ±2%. The proposed model is suitable for quantitatively estimating permeability in tight rocks with poorly developed fractures under conditions of elastic deformation, and can provide theoretical guidance for digital oilfield applications and development optimization.Graphic Abstract
Keywords
With the advancement of oil and gas exploration and development into deep and unconventional resources, unconventional hydrocarbon production in China has entered a phase of large-scale development. Formulating scientifically sound development plans is crucial for increasing reserves and production. However, ultra-deep reservoirs are generally characterized by high compaction, high temperature and pressure, and extremely low permeability, making accurate determination of reservoir permeability exceptionally difficult. There is an urgent need to develop evaluation methods that reflect true geological conditions.
Permeability is a key parameter in reservoir evaluation, development design, and productivity prediction. Among its influencing factors, stress sensitivity—the variation of permeability with changes in stress conditions-significantly impacts the productivity and recovery efficiency of low-permeability and tight reservoirs [1–3]. Early studies have recognized that increased effective stress generally leads to a decline in permeability [4–6], and permeability-stress models based on exponential or power-law relationships have been established [7,8]. Recent research further reveals the controlling roles of lithology, fracture development, and pore structure on stress sensitivity [9–11]. Under deep burial and heterogeneous stress fields, the influence of stress anisotropy becomes more pronounced [12,13], and a clear correlation between permeability and in-situ stress has also been identified within strike-slip fault zones [14].
Temperature is another important factor affecting permeability evolution. Studies indicate that within low-temperature ranges (e.g., 20°C–100°C), increased temperature often leads to decreased permeability [15,16]; whereas in high-temperature ranges (>400°C), thermal cracking can significantly enhance permeability [17,18]. This discrepancy is closely related to rock type, initial permeability, and temperature range [19,20], reflecting the nonlinear and condition-dependent nature of the temperature-permeability relationship. High-temperature and high-pressure experiments also confirm that the stress-sensitive behavior of permeability is significantly controlled by the average pore-throat radius and mineral composition [21,22].
During production, reservoir pore pressure decreases and effective stress increases, inducing elastoplastic deformation of the rock matrix and fractures, thereby altering flow pathways. Simultaneously, changes in fluid pressure, chemical dissolution, and multi-field coupling effects also influence the dynamic response of permeability [23–25]. Currently, permeability models are predominantly established based on laboratory experimental data, deriving empirical or semi-empirical relationships between permeability and effective stress through fitting [26–28].
However, conventional stress sensitivity experiments exhibit three main limitations:
First, the experimental loading path differs significantly from the actual subsurface stress state. Experiments typically employ a constant pore pressure with variable confining pressure, whereas in actual production, pore pressure continuously decreases while in-situ stress remains largely stable [5,29]. Second, most existing experiments do not systematically consider temperature variations and their coupling effects with stress [15,21,30]. Third, experiments often struggle to distinguish whether irreversible permeability reduction stems from plastic deformation or other mechanisms; although it is commonly attributed to irrecoverable deformation of pore throats, direct microstructural evidence is lacking [3,7,19].
To overcome these limitations, this study, under the assumption that rock deformation is primarily elastic, derives the stress-strain relationship for pore volume and dimensions based on porous media elasticity theory. Combined with pipe-flow modeling, a quantitative theoretical model for permeability variation with temperature and pore pressure is established. Furthermore, by improving experimental setups and procedures to simulate true reservoir temperature and pressure conditions, synchronized core mechanical and permeability tests are conducted to validate the reliability of the theoretical model. This work aims to provide a basis for permeability evaluation and development optimization of deep tight reservoirs.
2 Establishment of Evaluation Model of Reservoir Permeability
The proposed permeability evaluation model is developed under the following assumptions, which are widely adopted in classical poroelasticity and rock mechanics studies:
(1) Rock deformation is purely elastic and reversible [31]; (2) Fractures are not developed, and the reservoir is dominated by pore-type storage space [32]; (3) The reservoir rock is isotropic and homogeneous [33]; (4) External geostatic stresses remain constant during production [31]; (5) Thermal expansion of the rock skeleton is isotropic [34]; (6) Fluid flow in porous media follows the capillary bundle model, which can be described by the Kozeny-Carman equation [35]; (7) Pore volume and bulk volume change proportionally under elastic deformation, i.e., porosity remains constant [36].
These assumptions provide the theoretical foundation for deriving stress-strain relationships and permeability evolution equations presented in the following sections.
Based on the assumptions outlined in Section 2.1, we conduct a comprehensive analysis of how these coupled changes impact permeability. We begin by examining the stress variations in the reservoir both before and after production. Utilizing elastic theory for porous media, we derive the pore-volume strain. Through simulations of flow within capillary bundles, we assess the alterations in pore throat dimensions. Finally, we apply the Kozeny–Carman relation to establish a quantitative model for variations in permeability.
2.2 Stress Variation of Reservoir Rock
Prior to production, temperature and pore pressure remain at their original formation values. During production, near-wellbore pore pressure and temperature decline significantly, while regions remote from the well remain close to the original state (Fig. 1).
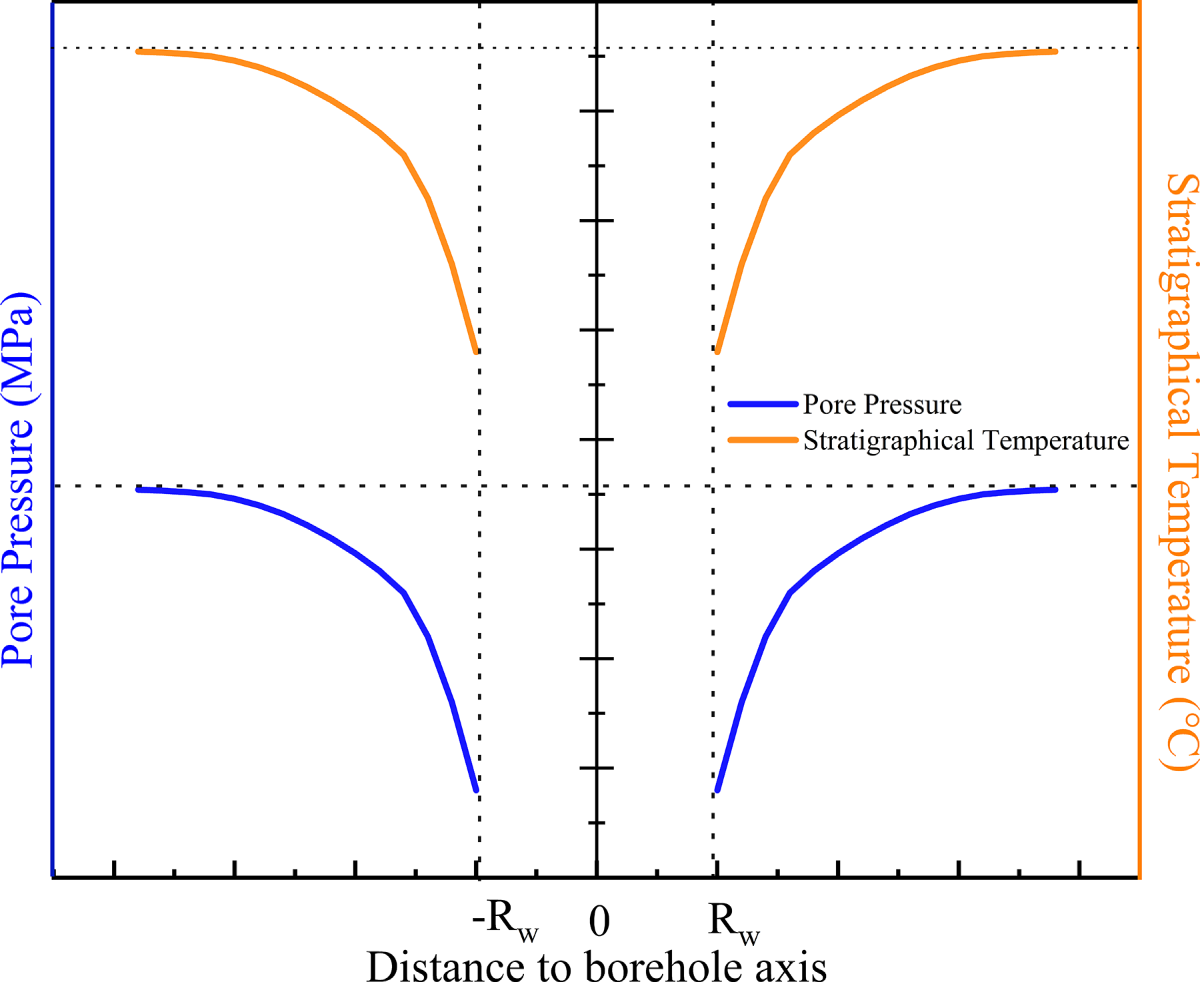
Figure 1: Law of formation temperature and pressure change after oil and gas production.
In the near-well region, bottomhole pressure drops sharply. Reservoir fluids flow rapidly towards the wellbore, producing a pressure drawdown cone; bottomhole pressure becomes much lower than the initial pore pressure. Temperature also decreases because fluid expansion from high-pressure formation into the low-pressure wellbore is an endothermic process, causing cooling of the fluid and surrounding rock. In contrast, pressure declines more slowly in the far field and the temperature remains closer to the original value.
Before production, the reservoir rock is in an initial static stress equilibrium determined by overburden and pore pressure. Considering a rock element (Fig. 2a), the initial external stresses are the vertical overburden and the horizontal maximum and minimum principal stresses, while the internal stress is pore pressure. After production (Fig. 2b), external stresses are approximately unchanged while pore pressure decreases and formation temperature declines; thermal stress components are generated along the directions of the three principal stresses due to the temperature change.
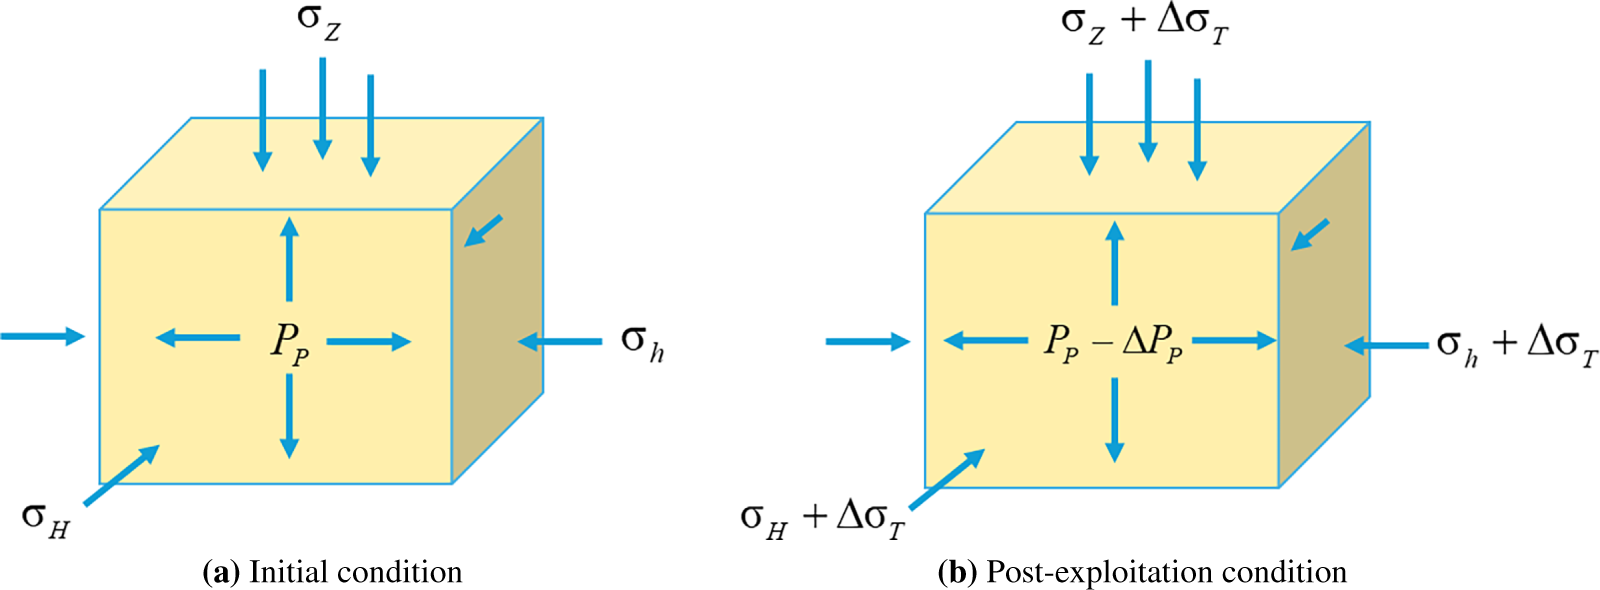
Figure 2: Reservoir rock stress state.
2.3 Analysis of Pore-Volume Strain in Reservoir Rock
In the initial state, the effective stresses acting on the rock are defined as [31]:
where
Total effective stress is given by:
Within the elastic regime, changes in bulk rock volume and pore volume are proportional (i.e., they change by the same factor), as illustrated in Fig. 3. The pore volume changes while porosity may be considered constant under strictly proportional volumetric deformation [33]. Thus,
where
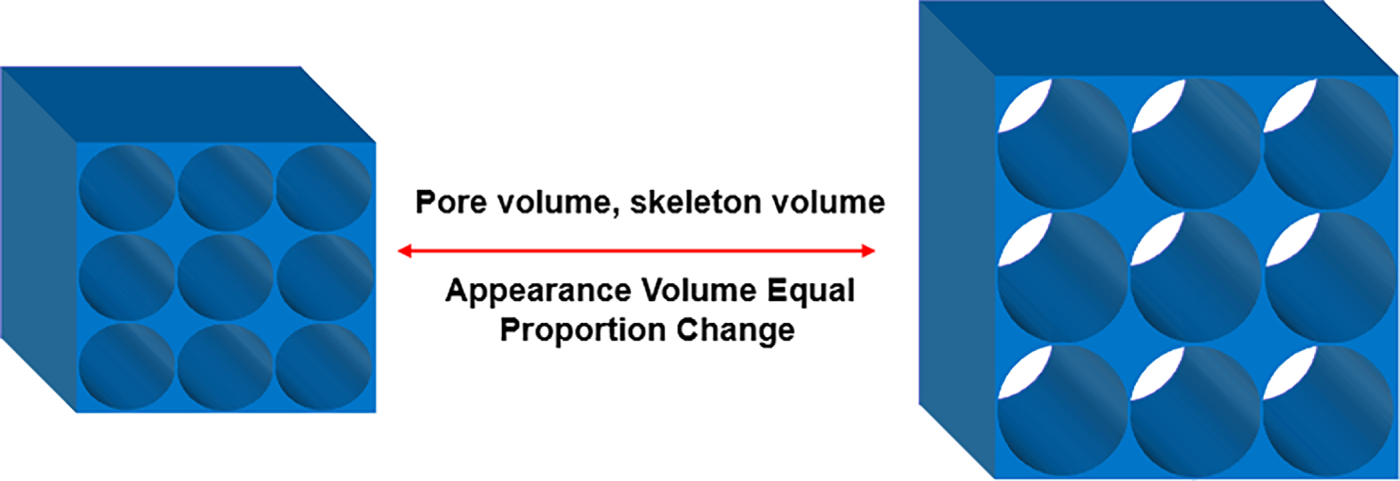
Figure 3: Schematic of proportional volumetric change during elastic deformation.
Assuming external (geostatic) stress is unchanged while pore pressure decreases [33], the total effective stress becomes
The variation of total effective stress can be obtained from the Eqs. (2) and (4).
From the elastic theory [33], the pore-volume strain (i.e., pore-volume contraction) is expressed as:
where
If the thermal expansion coefficient of rock is
Considering combined effects of temperature and pore pressure reductions, the total pore-volume strain is the sum of mechanical and thermal contributions:
2.4 Simulation of Porous Media Seepage by Capillary Beam Flow
In tight reservoirs where fractures are poorly developed and storage space is dominated by pores, pore-space flow can be represented by a bundle of capillaries. Flow in the porous medium is therefore modeled by flow through numerous capillaries (Fig. 4). The capillary bundle model simulates flow through the formation by representing pore throats as a distribution of capillary tubes.
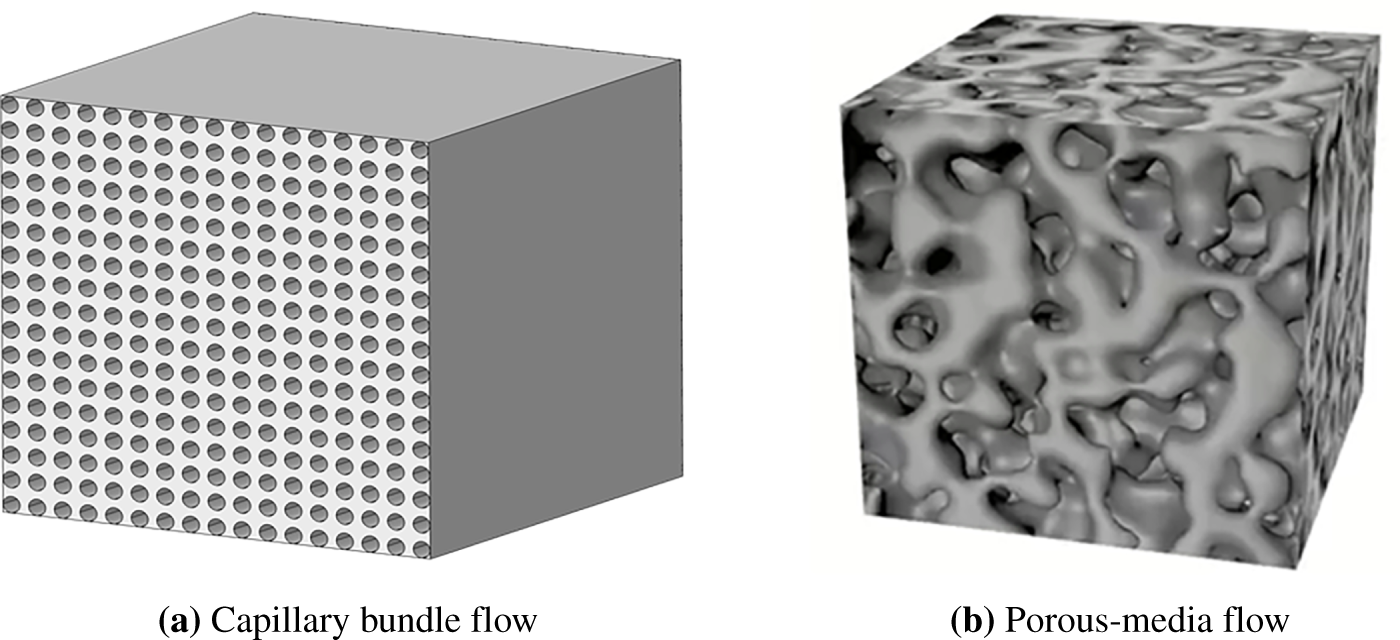
Figure 4: Two seepage modes diagram.
When simulating flow in porous media using capillary bundle flow, it is assumed that the rock contains no fractures. Initial state: Assume the rock contains n capillaries of length
The initial and post-production volumes of the capillary bundle are:
where
Before and after oil and gas production, the volume relationship of capillary bundle satisfies:
From Eqs.(9)–(11), it can be obtained that
Compared with the size of rock, the elastic deformation of rock is very small, so the tortuosity of capillary before and after oil and gas recovery is almost unchanged.
It can be approximately considered that:
Permeability can be calculated using the Kozeny-Carman equation. The Kozeny-Carman equation expresses the relationship between permeability and porosity and pore size, and its basic form is [35]:
In the formula,
Considering the changes of pore volume strain and capillary size [37], this equation can be extended to the permeability evaluation model under elastic deformation conditions.
The initial rock permeability is:
After production, permeability becomes:
After oil and gas production, the percentage of permeability loss is:
Substituting expressions for pore-volume and pore-radius changes derived from stress and thermal strains (see Eqs. (3), (8), (14) and (15) in the original manuscript), we obtain a closed-form expression (Eq.(18)) for permeability as a function of pore pressure and temperature changes.
Eq. (18) represents a novel contribution of this study, integrating thermal strain (Eq. (8)) and mechanical strain (Eq. (6)) into a unified permeability model based on the Kozeny-Carman formulation. This is an analytical expression that simultaneously accounts for both temperature and pressure effects on permeability under elastic deformation assumptions in tight, unfractured reservoirs. From the Eq. (18), it is clear that two competing mechanisms govern permeability change during production. First, pore-pressure reduction causes rock compaction and pore-volume decrease, reducing permeability because the support provided by pore fluid pressure weakens and the rock framework compresses under unchanged external stresses, narrowing pore throats. Second, formation cooling induces thermal contraction of the rock skeleton, which may increase pore volume and thus permeability by slightly enlarging flow pathways. Therefore, the net permeability change results from a dynamic balance between pressure-induced compaction and temperature-induced contraction (which in this context tends to increase pore volume).
2.5 Sensitivity Analysis of the Permeability Model
Using Eq. (18) and keeping other parameters fixed, we analyze the sensitivity of permeability to pore-pressure reduction, Young’s modulus, temperature change, thermal expansion coefficient, Poisson’s ratio, and porosity. The baseline parameter values used were:
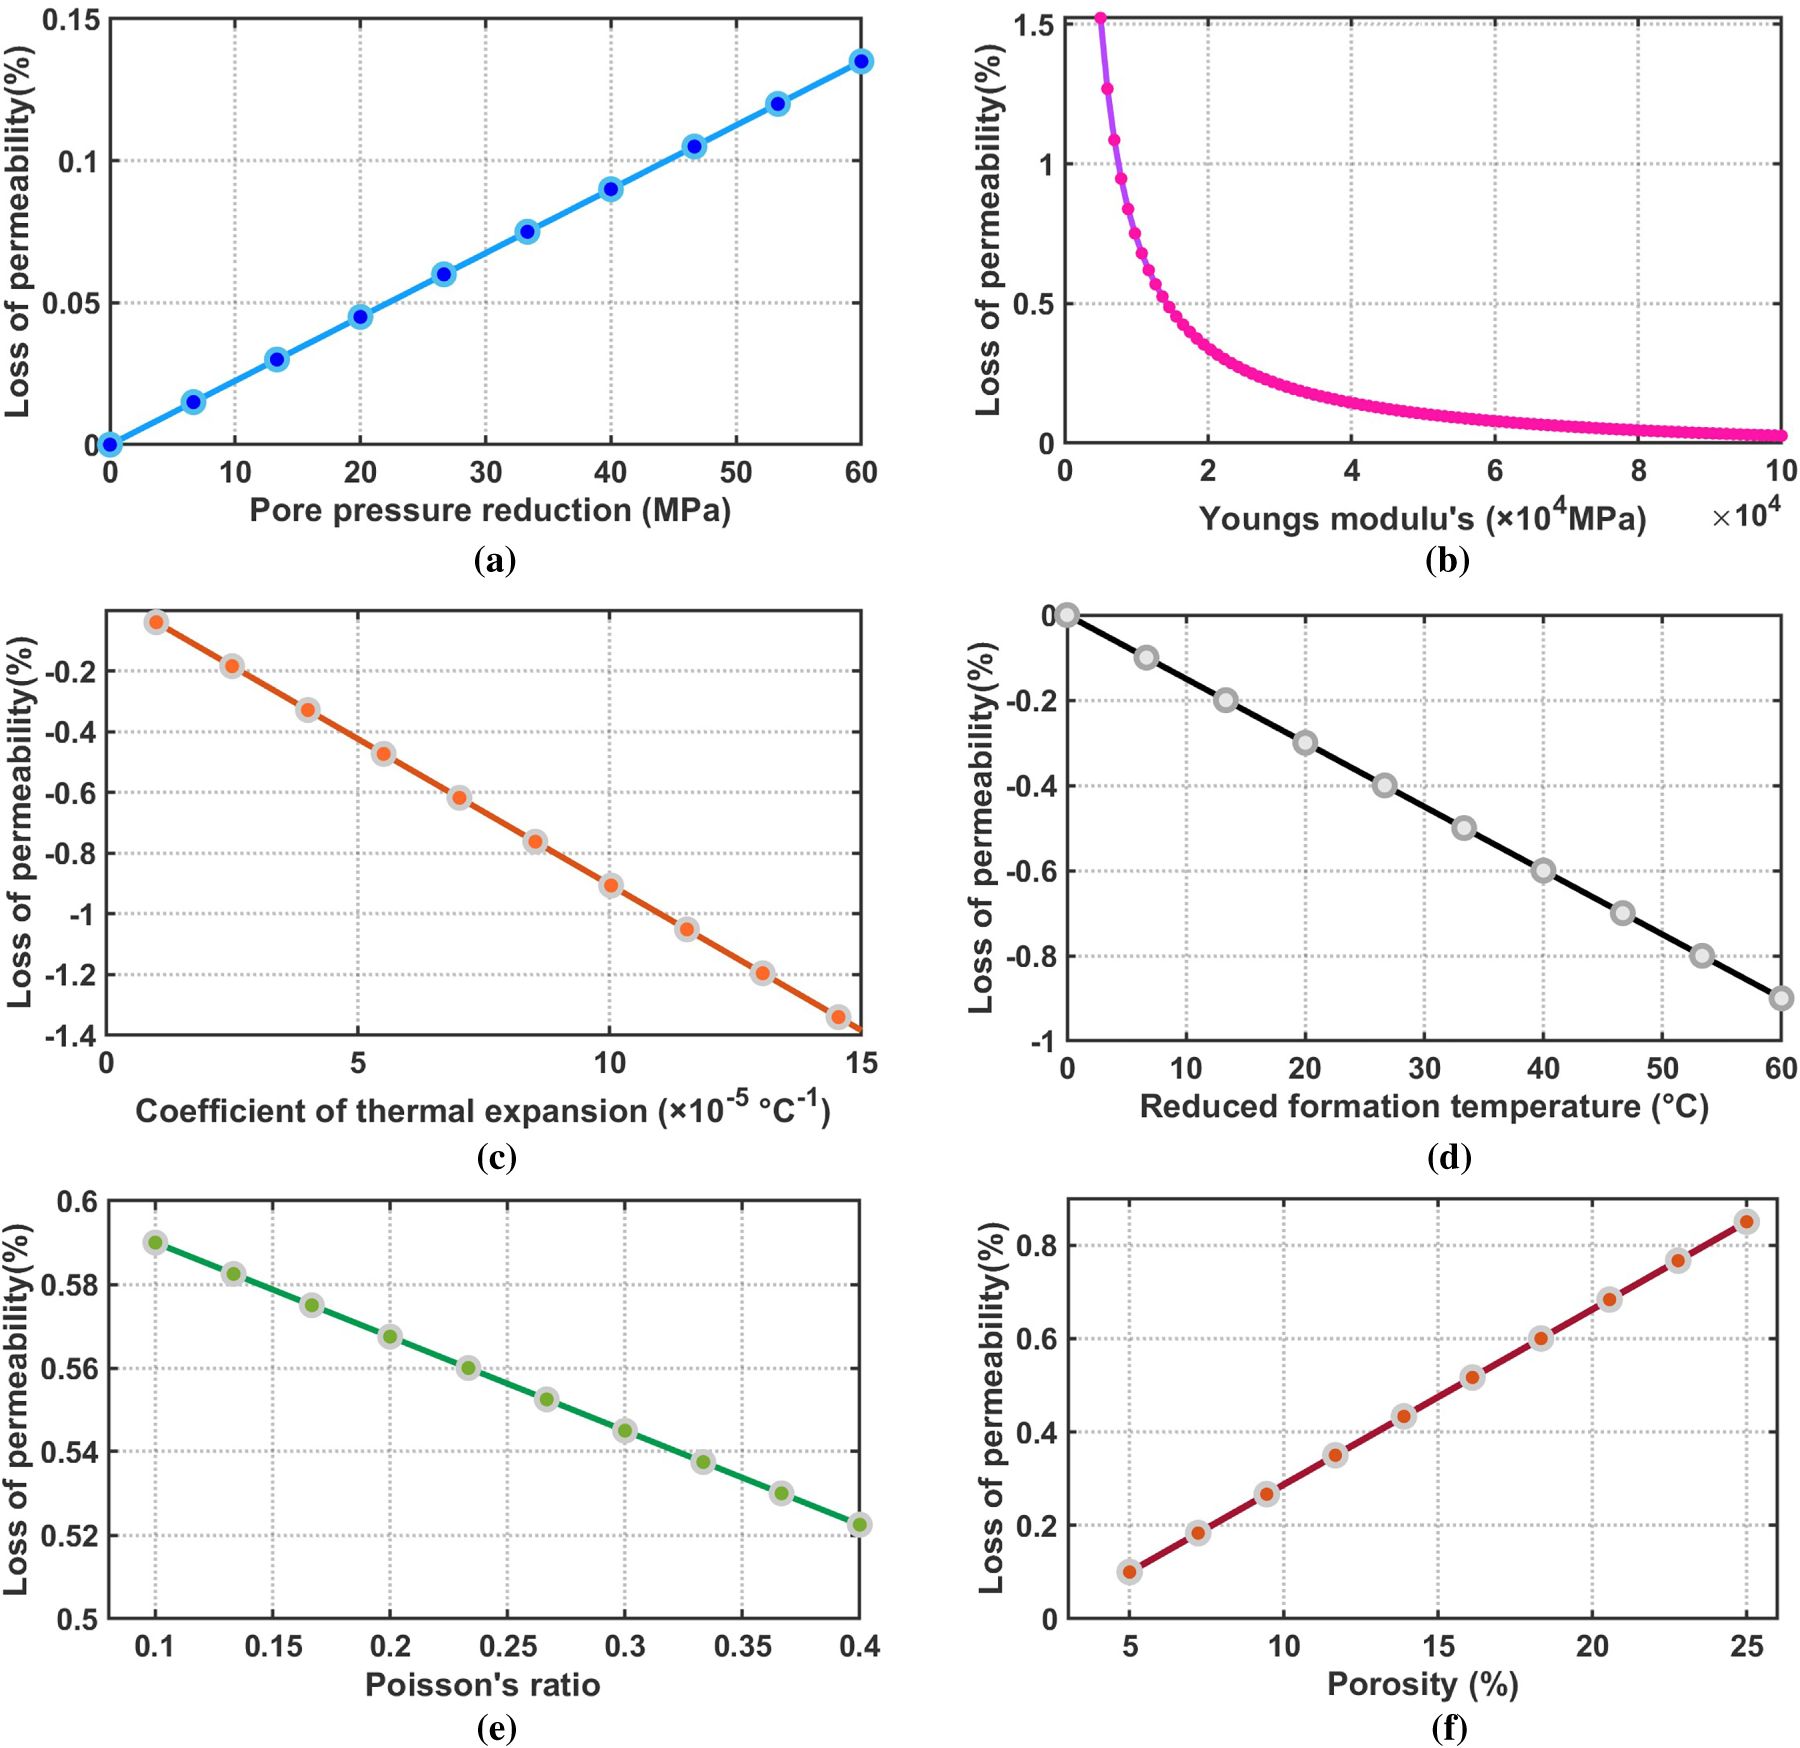
Figure 5: Analysis of factors affecting permeability. (a) Effect of pore pressure reduction on permeability. (b) Effect of Young’s modulus on permeability. (c) Effect of coefficient of thermal expansion on permeability. (d) Effect of reduced formation temperature on permeability. (e) Effect of Poisson’s ratio on permeability. (f) Effect of porosity on permeability.
Fig. 5a illustrates that permeability loss increases approximately linearly with a reduction in pore pressure. This phenomenon occurs because decreased pore pressure reduces internal support and compresses pore volume, resulting in lowered permeability. Fig. 5b shows that permeability loss initially decreases sharply as Young’s modulus increases, and then levels off. In stiffer rocks (with higher Young’s modulus), permeability is less sensitive to changes in pore pressure. Fig. 5c indicates that an increase in the thermal expansion coefficient leads to a negative trend in permeability loss, meaning greater thermal expansion results in increased permeability under an imposed temperature drop. This is because larger thermal contraction of the rock skeleton expands pore volume. Fig. 5d demonstrates that a decrease in reservoir temperature generally correlates with a negative linear trend in permeability loss, indicating that permeability tends to increase as temperature falls. This observation is consistent with the thermal contraction mechanism described earlier. Fig. 5e reveals that an increase in Poisson’s ratio tends to raise permeability loss in an approximately linear fashion. Materials with a higher Poisson’s ratio deform more easily under stress changes, leading to greater reductions in pore volume. Finally, Fig. 5f shows that permeability loss increases linearly with porosity. Higher porosity implies larger absolute pore volumes, which can be more significantly reduced under the same stress decrement, resulting in larger relative losses in permeability.
Overall, when evaluating the parameter ranges under consideration, it becomes evident that the combined effects of typical fluctuations in temperature and pore pressure on permeability are relatively modest. Specifically, these variations generally fall within a range of ±2%. Although alterations in temperature and pressure do impact permeability to some extent, the overall net change remains limited and manageable.
To validate the quantitative permeability model, core permeability tests were conducted under controlled temperature and pressure conditions that emulate reservoir changes.
A HPHT (high-pressure and high-temperature) rock physics and mechanics testing system was used. The system includes a HPHT chamber, confining and axial stress control, pore-pressure control, a stress–strain monitoring system, permeability measurement apparatus, and computerized control (Fig. 6).
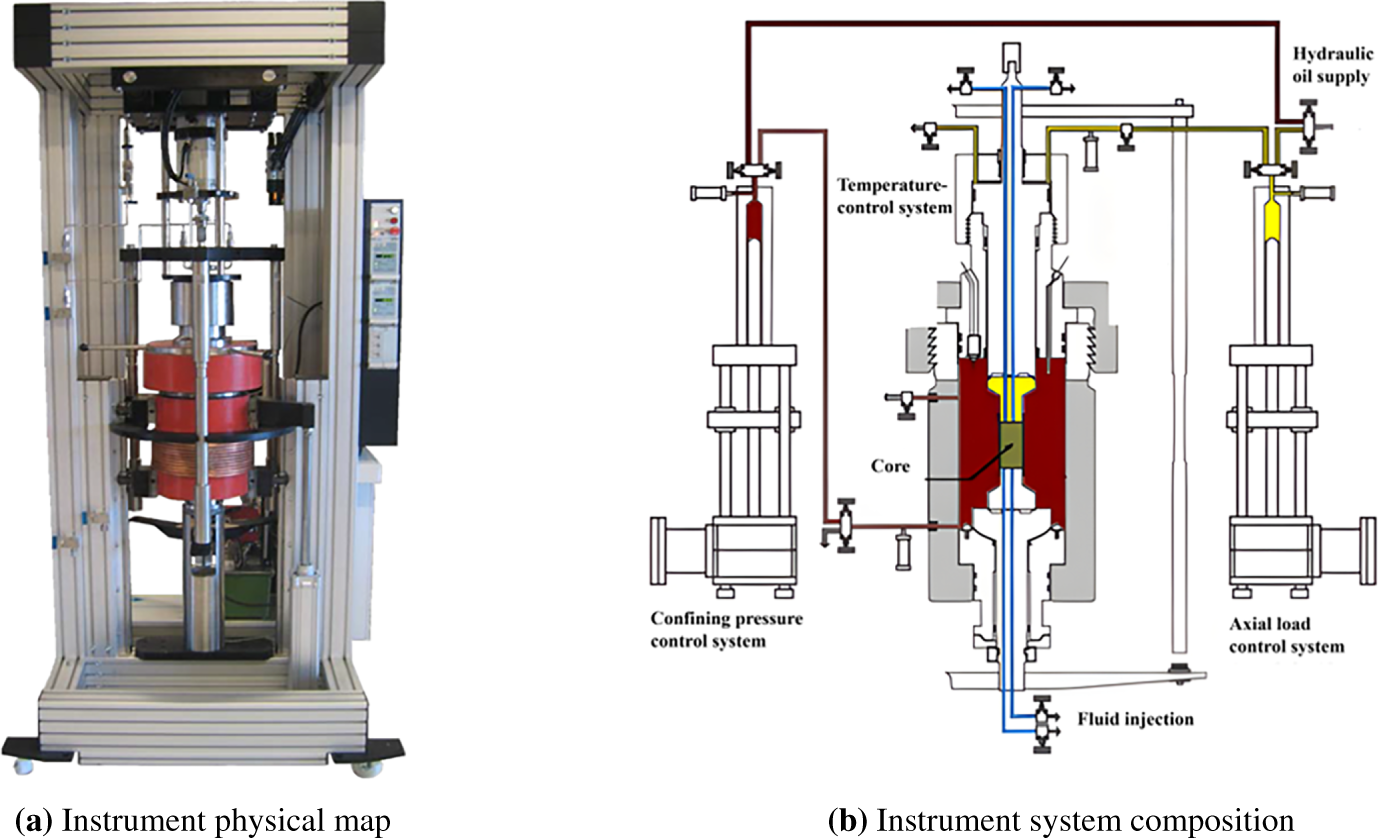
Figure 6: HPHT rock physics and mechanics testing system.
The HPHT chamber can simulate the extreme conditions found deep within formations, allowing experiments to be conducted under high-temperature and high-pressure conditions similar to actual reservoir environments. The HPHT system operates at up to 120 MPa confining pressure and 150°C, with pressure accuracy of ±0.1 MPa and temperature accuracy of ±0.5°C.
The stress-strain testing system is used to measure the stress-strain characteristics of rocks under different pressure conditions, with high-precision sensors providing real-time monitoring of changes in stress and strain. The wave velocity testing system measures the velocities of P-waves and S-waves in rocks, which is crucial for assessing the elastic modulus and other mechanical properties of the rock. The acoustic emission testing system captures acoustic emission signals generated by rocks during pressure changes, allowing for the analysis of microcrack development and fracture mechanisms within the rock. The permeability testing system is one of the core components of this equipment, capable of measuring the permeability of rocks under HPHT conditions. With a flow accuracy of ±2%, the system ensures the accuracy and reliability of permeability measurements.
The computer-based control system integrates the above subsystems, managing them through an advanced software control platform that enables full automation of the experimental process and data acquisition. This system not only precisely controls experimental conditions but also records and analyzes experimental data in real time, improving experimental efficiency and data reliability.
The HPHT rock physics and mechanics testing system allows for the testing of rock permeability under simulated real reservoir conditions, providing high-precision experimental data and strong technical support for the study of reservoir physical and mechanical properties. The system is capable of conducting permeability tests under reservoir temperature and pressure conditions.
To investigate mechanical and flow properties of tight reservoir rocks under different stress and permeability conditions, full-diameter cores were collected from four representative tight reservoirs in Xinjiang, China: tight mudstone from the Anjihaihe Formation in the Hutubi anticline; shale oil from the Lucaogou Formation in the Jimusar Depression; Carboniferous tuffaceous (pyroclastic) rocks from the Karamay field; and Triassic Middle Oil Formation tight sandstones from the Tarim Basin (Tahe field). These cores represent a diversity of lithologies typical of tight reservoirs (Fig. 7).
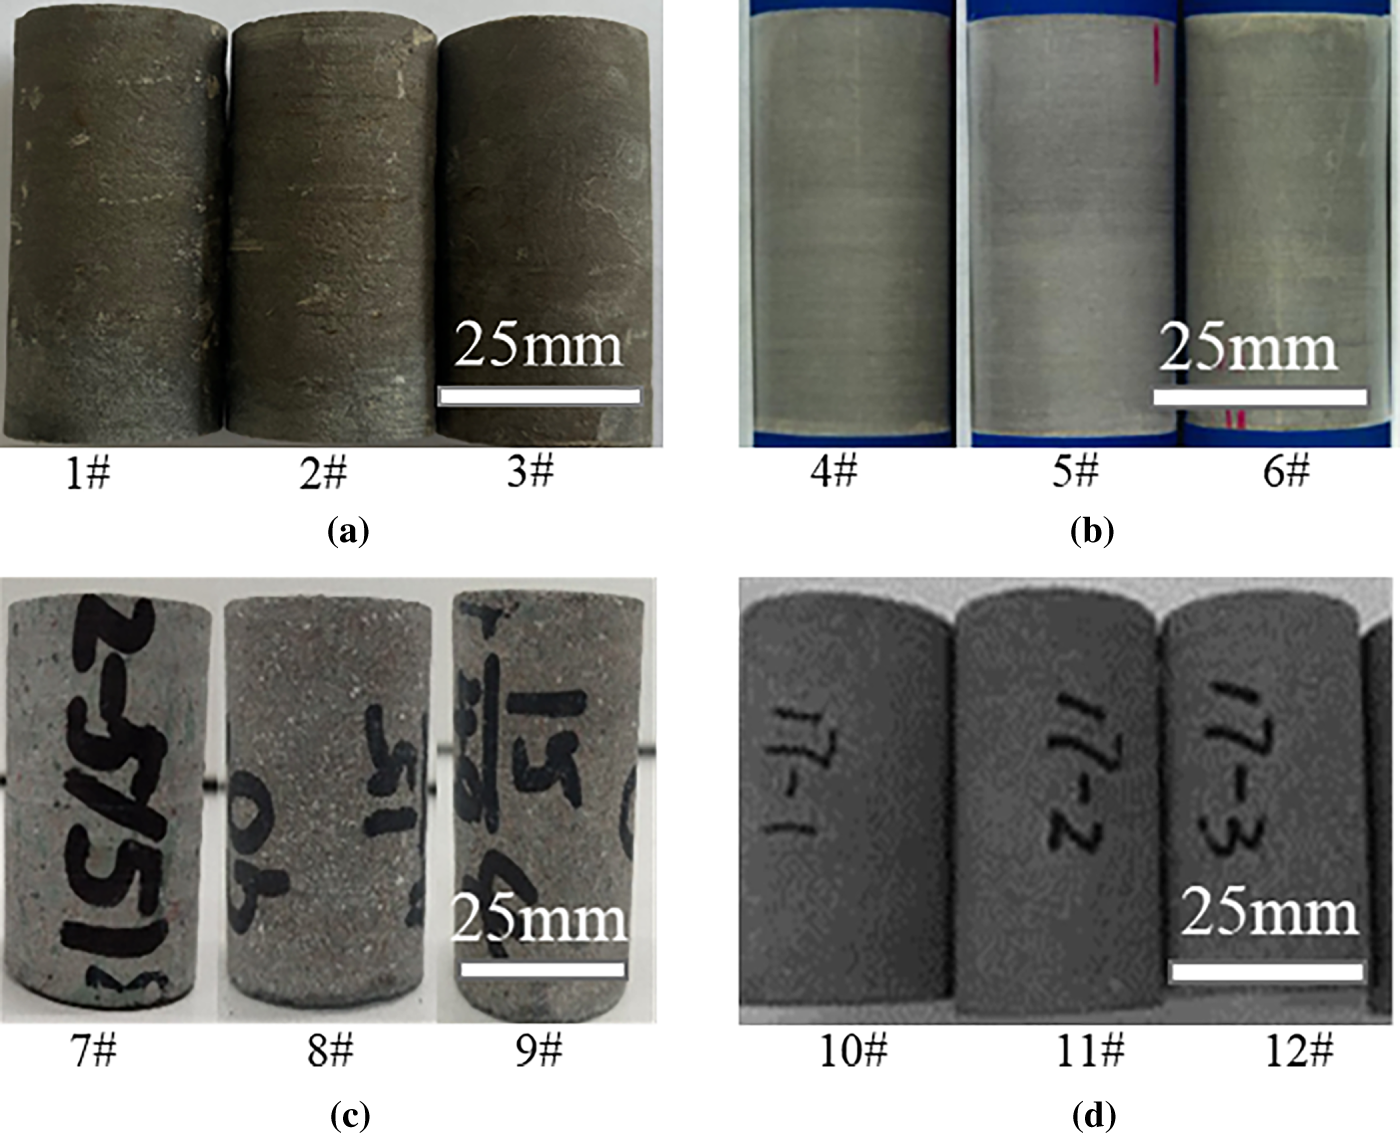
Figure 7: Four typical tight reservoir core samples: (a) Tight Mudstone of Anjihaihe Formation in Hutubi Anticline; (b) Luchaogou Formation, Jimusar Depression; (c) Carboniferous Formation of Karamay; (d) Triassic Middle Oil Formation.
(1) Core selection and standard sample preparation
From each full-diameter core, sections with less than 30 cm variation in depth were chosen to ensure homogeneity. Three standard samples (Φ25 mm × 50 mm cylinders) were drilled from each core to ensure sample consistency, minimize individual variability, and improve data repeatability.
(2) CT screening for defects
Prior to specimen preparation, longitudinal and cross-section CT scans were performed on the full cores to detect microcracks or defects that could affect experimental outcomes (Fig. 8).
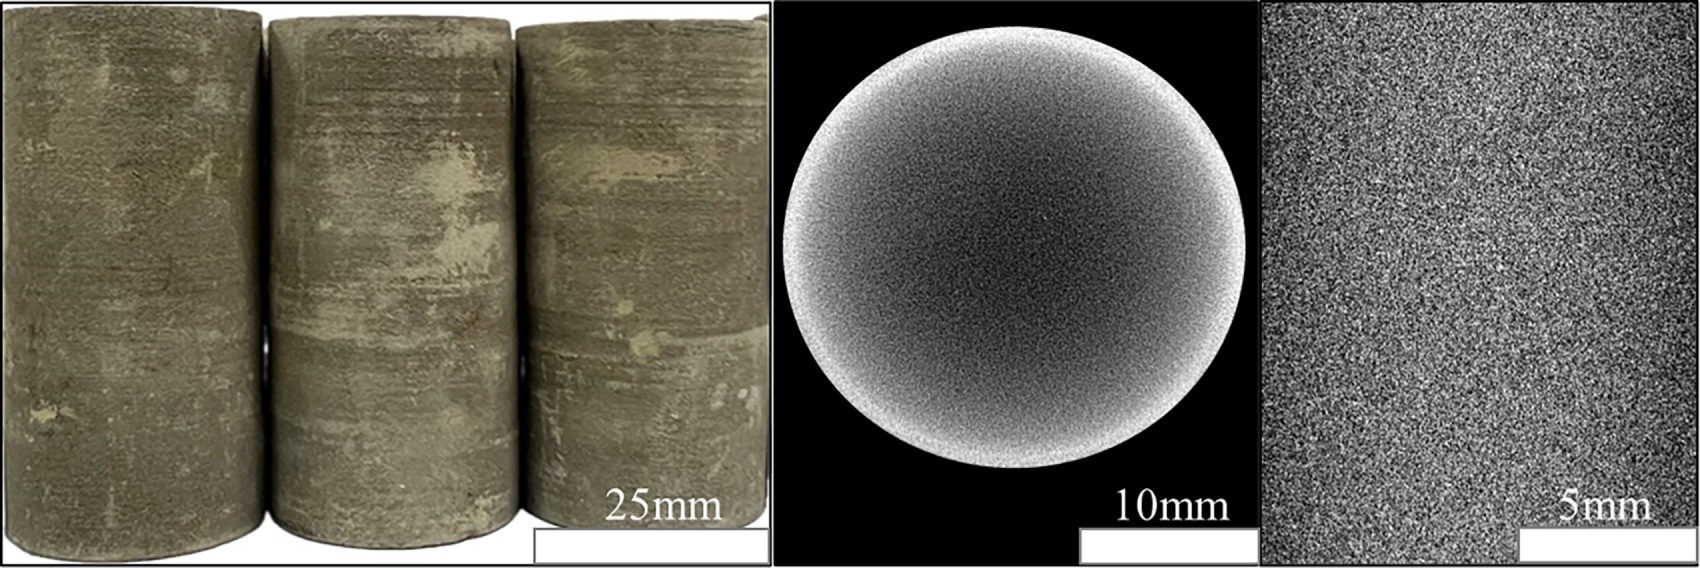
Figure 8: CT inspection for core defects.
(3) Preparation of multi-layer samples and documentation
A total of 12 standard samples were prepared from the four lithologies (tight mudstone/silty, shale/tuffaceous, rock/muddy, fine sandstone). All samples were machined to strict dimensional standards to ensure experimental consistency (Fig. 7).
(4) Assignment of test tasks
Two samples from each lithology group were assigned to full stress–strain mechanical tests to determine elastic limits, peak strength, and failure characteristics. The third specimen of each group was used for permeability testing under controlled pore pressure and temperature. Tests were conducted under simulated reservoir temperature and pressure conditions.
(5) Integrated testing and data acquisition
Mechanical and permeability tests were performed to obtain dynamic parameters of the different tight reservoir types under coupled temperature–pressure conditions.
A comprehensive stress-strain test was performed on 1#, 2#, 4#, 5#, 7#, 8 #, 10# and 11# samples. The test results are shown in Table 1 and Fig. 9. Due to the narrow drilling depth range of these samples, samples from the same full-diameter core show highly consistent mechanical properties. The stress-strain curves of these samples show similar elastic limit, yield strength and peak stress, indicating that the mechanical properties of the rock within the selected depth range change little.
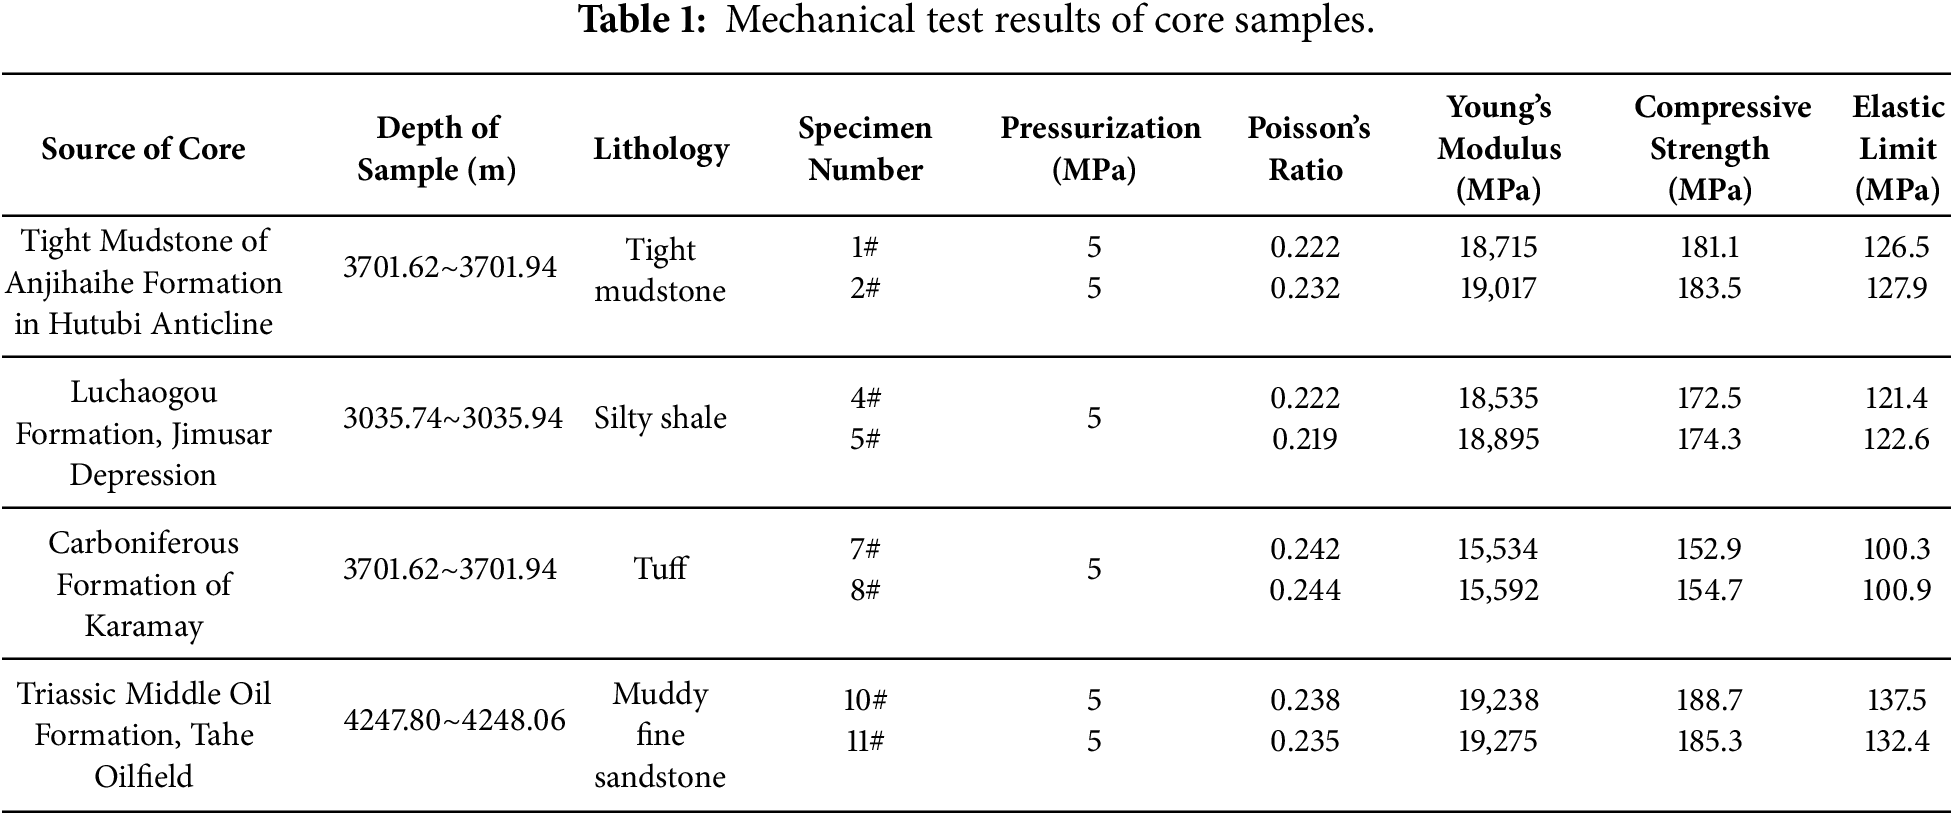
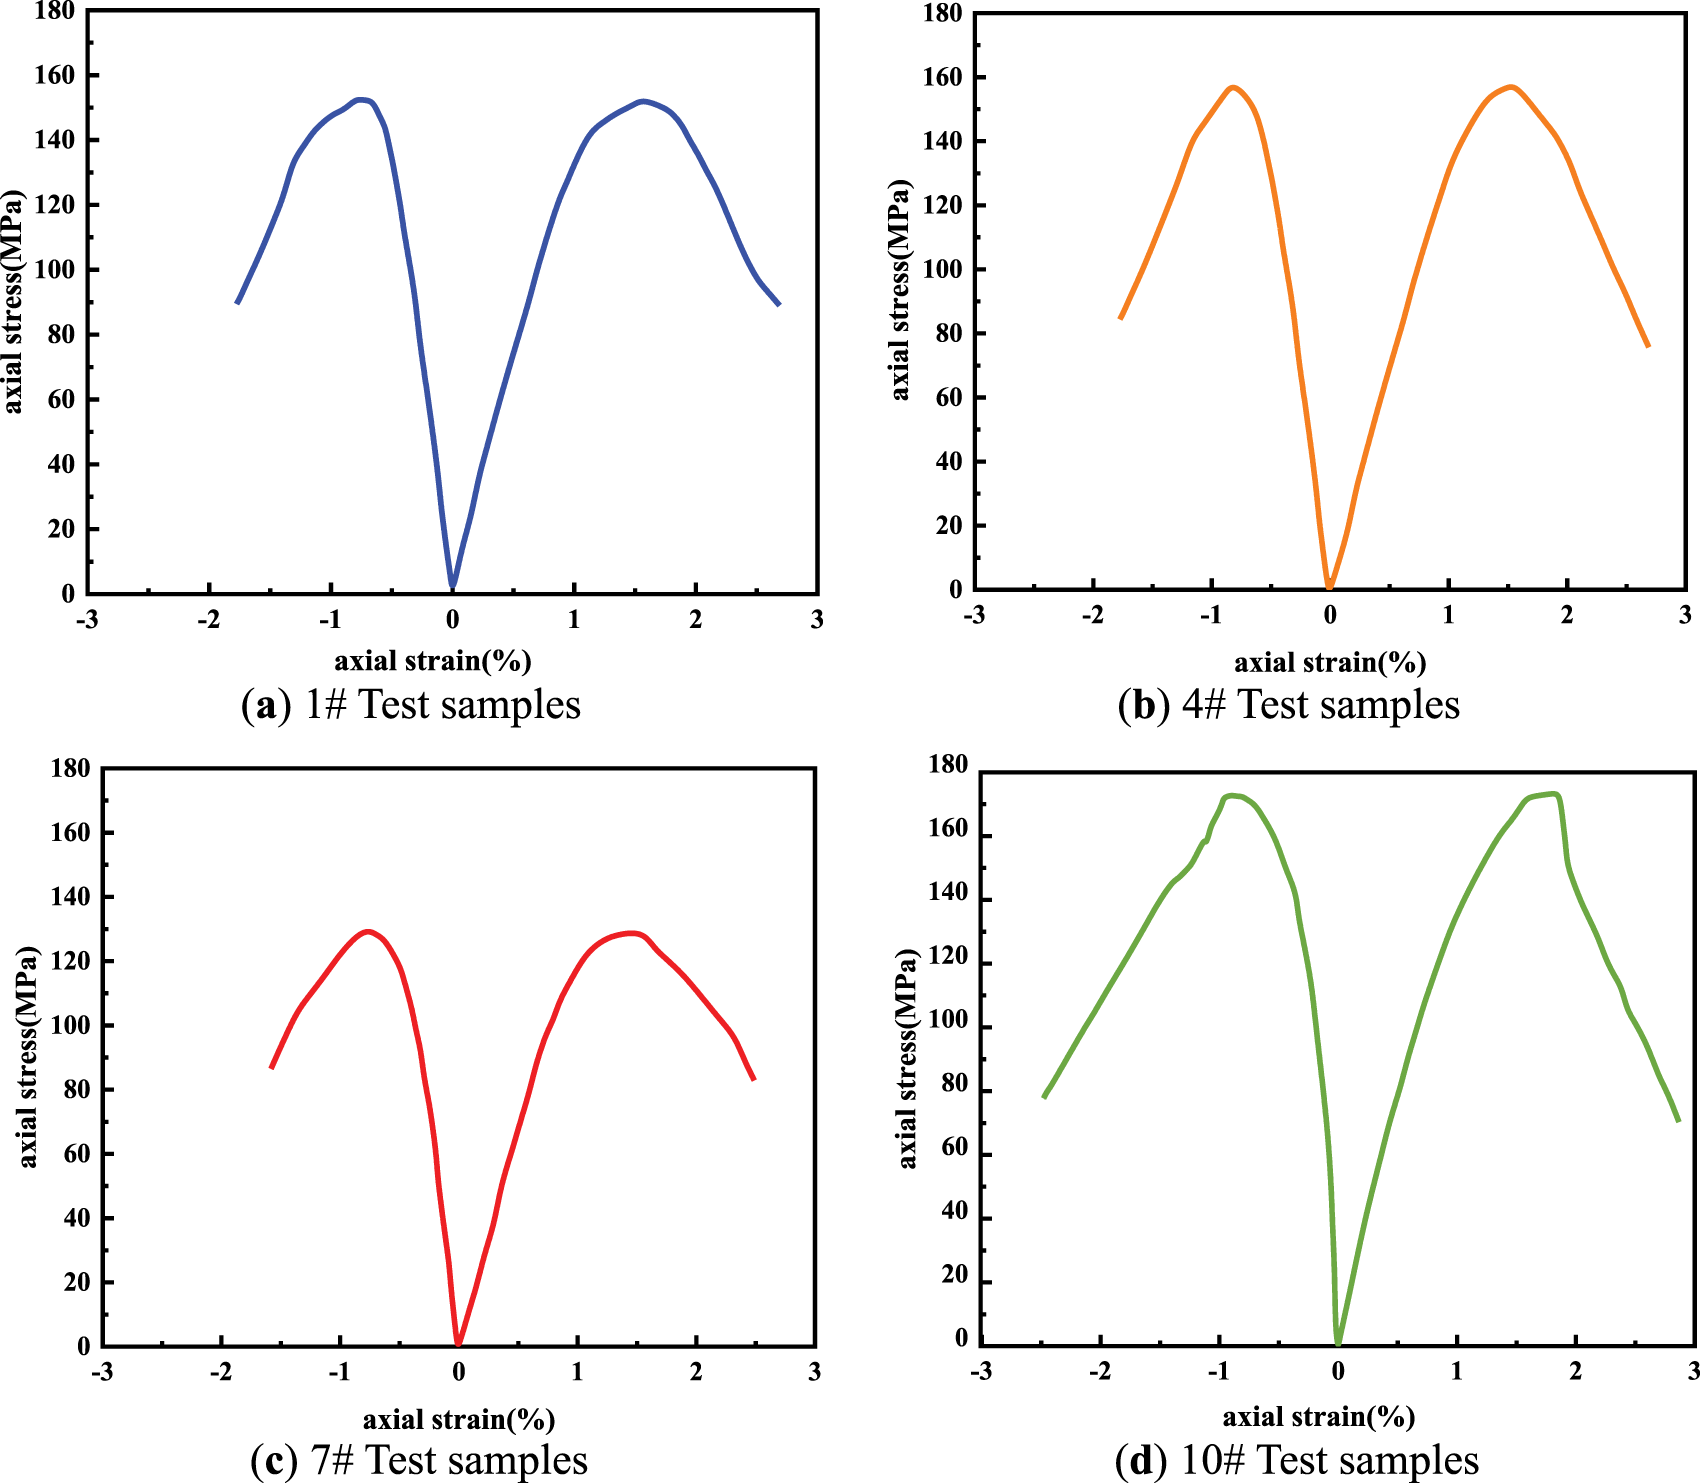
Figure 9: Stress-strain test results of core samples.
During the test, each sample experienced a gradual increase in confining pressure and axial pressure until it was damaged or reached the maximum stress level. By analyzing the stress-strain curve, the key mechanical properties of each sample were obtained. In addition, the similarity of the mechanical properties between the samples further verifies the effectiveness of the experimental design, indicating that the samples selected from the depth with the smallest change can effectively represent the mechanical properties of the entire core.
3.5 Experimental Uncertainty Analysis
To ensure data reliability, measurement uncertainties were systematically evaluated following the ISO/IEC Guide. Standard uncertainties for directly measured parameters were determined as follows:
(1) Pressure transducers (accuracy ±0.1 MPa) contributed
(2) Thermocouples (accuracy ±0.5°C) gave
(3) Caliper measurements (accuracy ±0.02 mm) yielded
(4) Permeability repeatability, assessed via three repeated measurements on each sample, showed a relative standard uncertainty of approximately 0.6%.
The combined standard uncertainty of permeability loss
where
For a representative case (Sample 3#),
All deviations between model predictions and experimental measurements fall within the evaluated uncertainty ranges, confirming model validity. Moreover, the core conclusion that permeability variations remain within ±2% holds at a confidence level exceeding 95%, ensured the reliability of the experimental results.
3.6 Comparison between Experimental and Theoretical Results
Permeability tests were conducted on samples 3, 6, 9, and 12 by maintaining fixed confining and axial stresses while varying internal pore pressure and temperature (see Tables 2 and 3). For these tests, confining and axial stresses of 65, 80, 90, and 100 MPa respectively were applied to samples 3, 6, 9, and 12-values close to the in-situ mean geostatic stress. Initial pore pressures and temperatures approximate the reservoir’s original conditions. By reducing pore pressure and temperature during tests, permeability was measured and compared with the initial state to compute permeability loss.
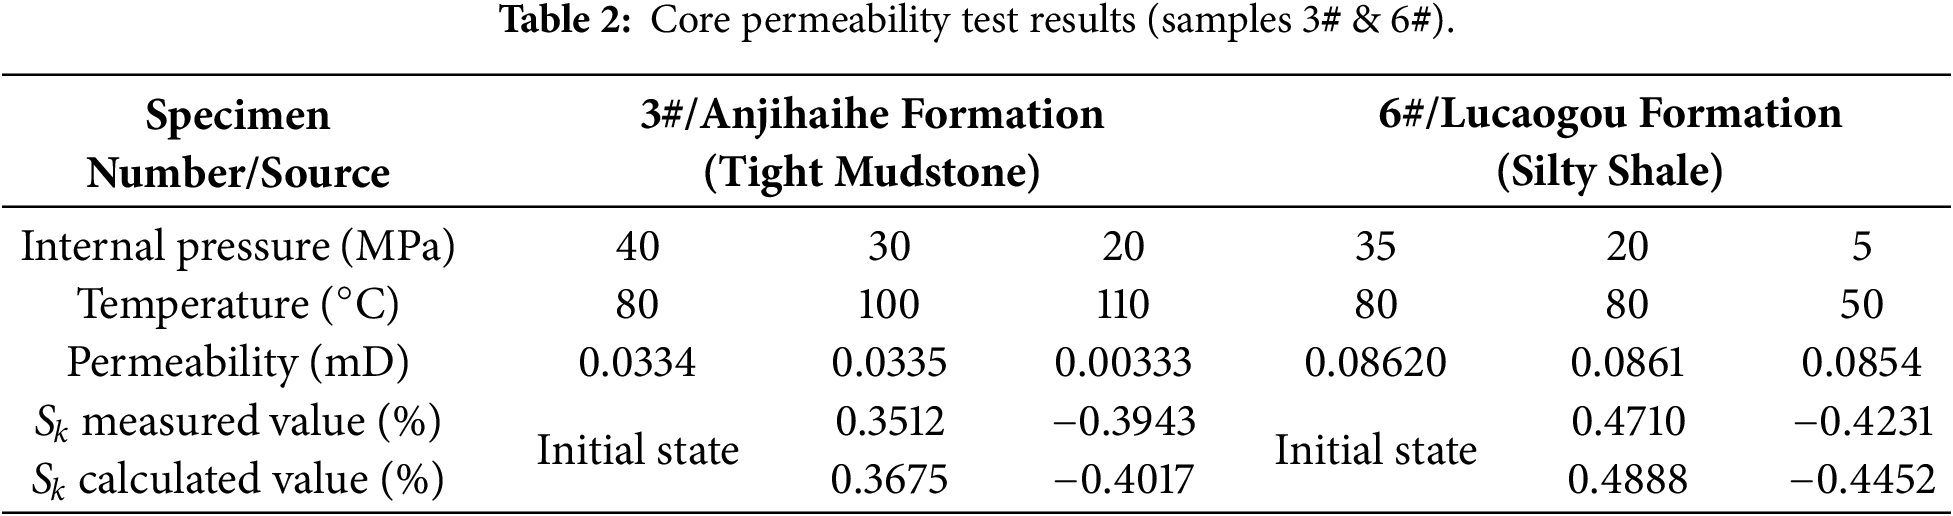
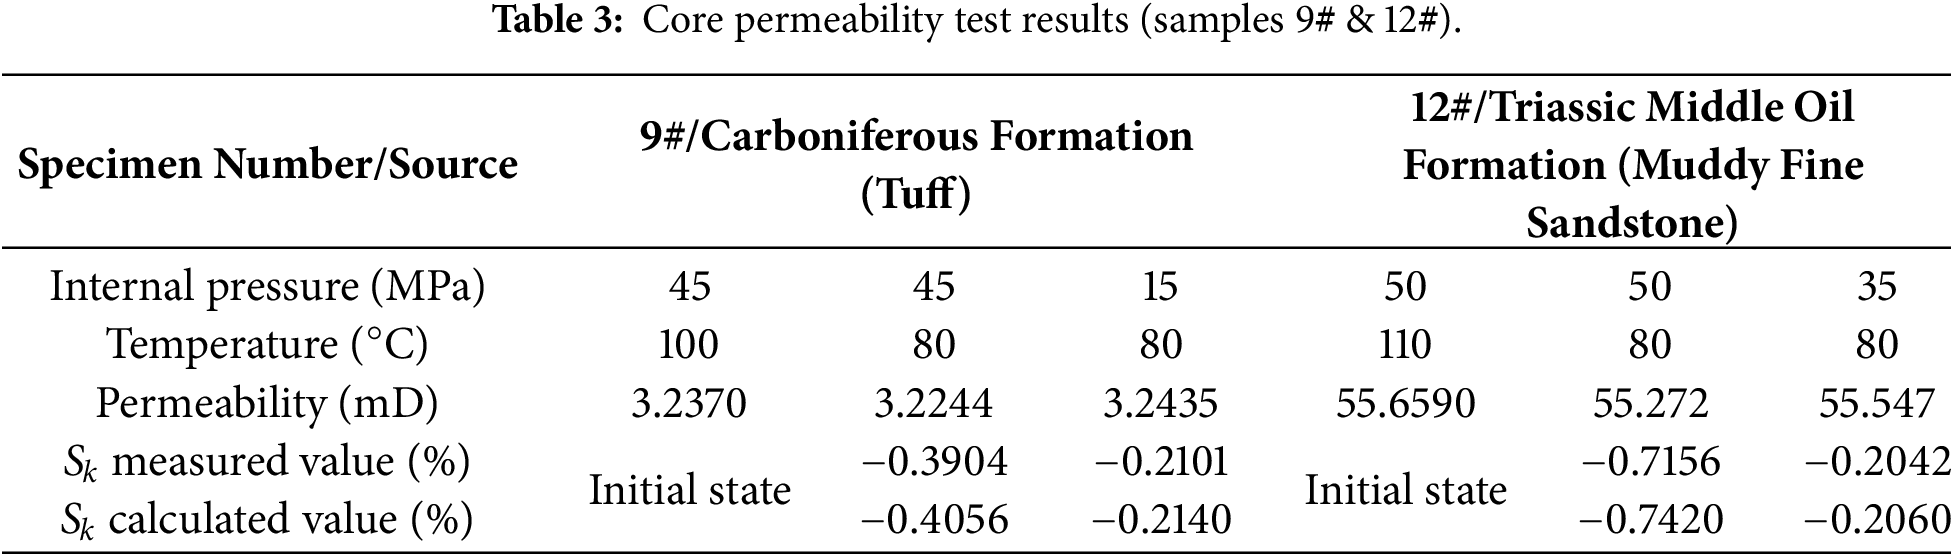
Prior to permeability testing, the mechanical properties of the samples were analyzed in detail (Table 2). Results indicate that the confining and axial stresses applied during permeability tests were below the elastic limits of samples 3, 6, 9, and 12. Thus, the samples experienced elastic deformation only during permeability testing, and observed permeability changes can be analyzed using elastic porous-media theory.
According to the elastic theory of porous media, we use Eq. (18) to calculate the expected permeability loss. Then the calculated results are compared with the measured permeability values obtained in the experiment. Tables 2 and 3 shows the detailed comparison between the experimental measured permeability loss values and the model calculated values under all eight experimental conditions (covering four lithology). Fig. 10 is the scatter plot of the error percentage between the permeability loss calculated by the model and the permeability loss measured by the experiment under eight different experimental conditions. As shown in Fig. 10, the relative errors for the eight experimental groups are: 4.64%, 1.88%, 3.78%, 5.22%, 3.89%, 1.86%, 3.69%, and 0.88%. Statistical analysis of these validation results reveals:
(1) Error range: 0.88% to 5.22%, with all errors below 5.5%
(2) Mean absolute error: 3.23%
(3) Median error: 3.74%
(4) Standard deviation: 1.44%
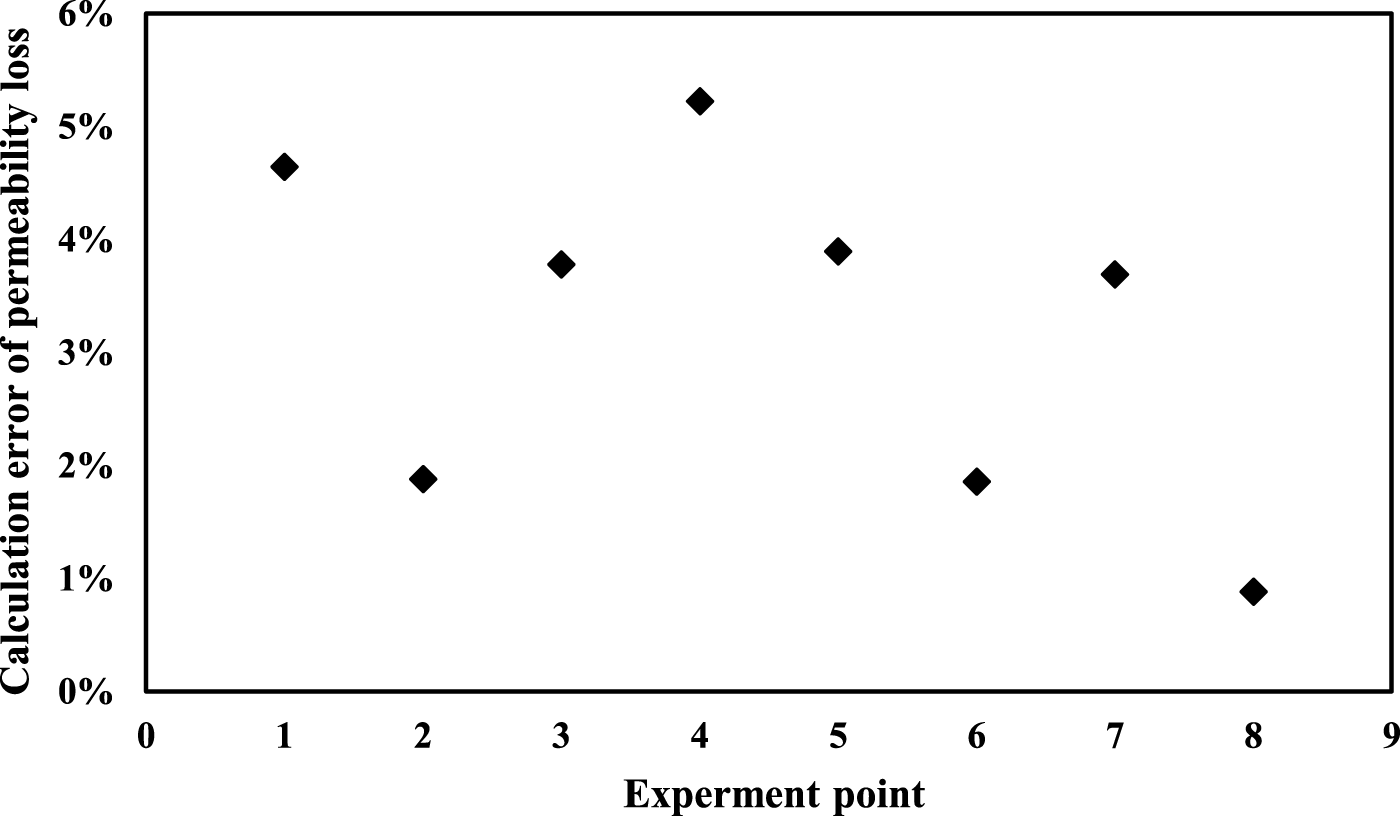
Figure 10: The error scatter plot between calculated value of model and experimental measured value.
These results demonstrate that the model predictions closely match experimental measurements, with an average deviation of only 3.23% and a maximum deviation within 5.5%. The low error values across all eight test conditions confirm the model’s reliability in predicting permeability evolution under coupled temperature and pressure effects. The random distribution of errors indicates no systematic bias in the model.
This strong correlation shows that the model effectively characterizes the complex interaction between rock pressure, temperature and permeability, and verifies the validity of the model.
3.7 Comparative Analysis with Existing Models
The existing permeability models can be divided into three categories: (1) empirical fitting model, which establishes the exponential or power-law relationship between permeability and effective stress through experimental data; (2) Based on the theoretical model of pore elasticity, the influence of stress change on pore throat size is considered; (3) The numerical model considering multi-field coupling can simulate the permeability evolution under complex conditions.
However, most of the existing models only consider the stress sensitivity effect, and the analytical models considering the coupling effect of temperature and pressure are rarely reported. Through Table 4, we summarize the comparison results between this model and several other representative models.
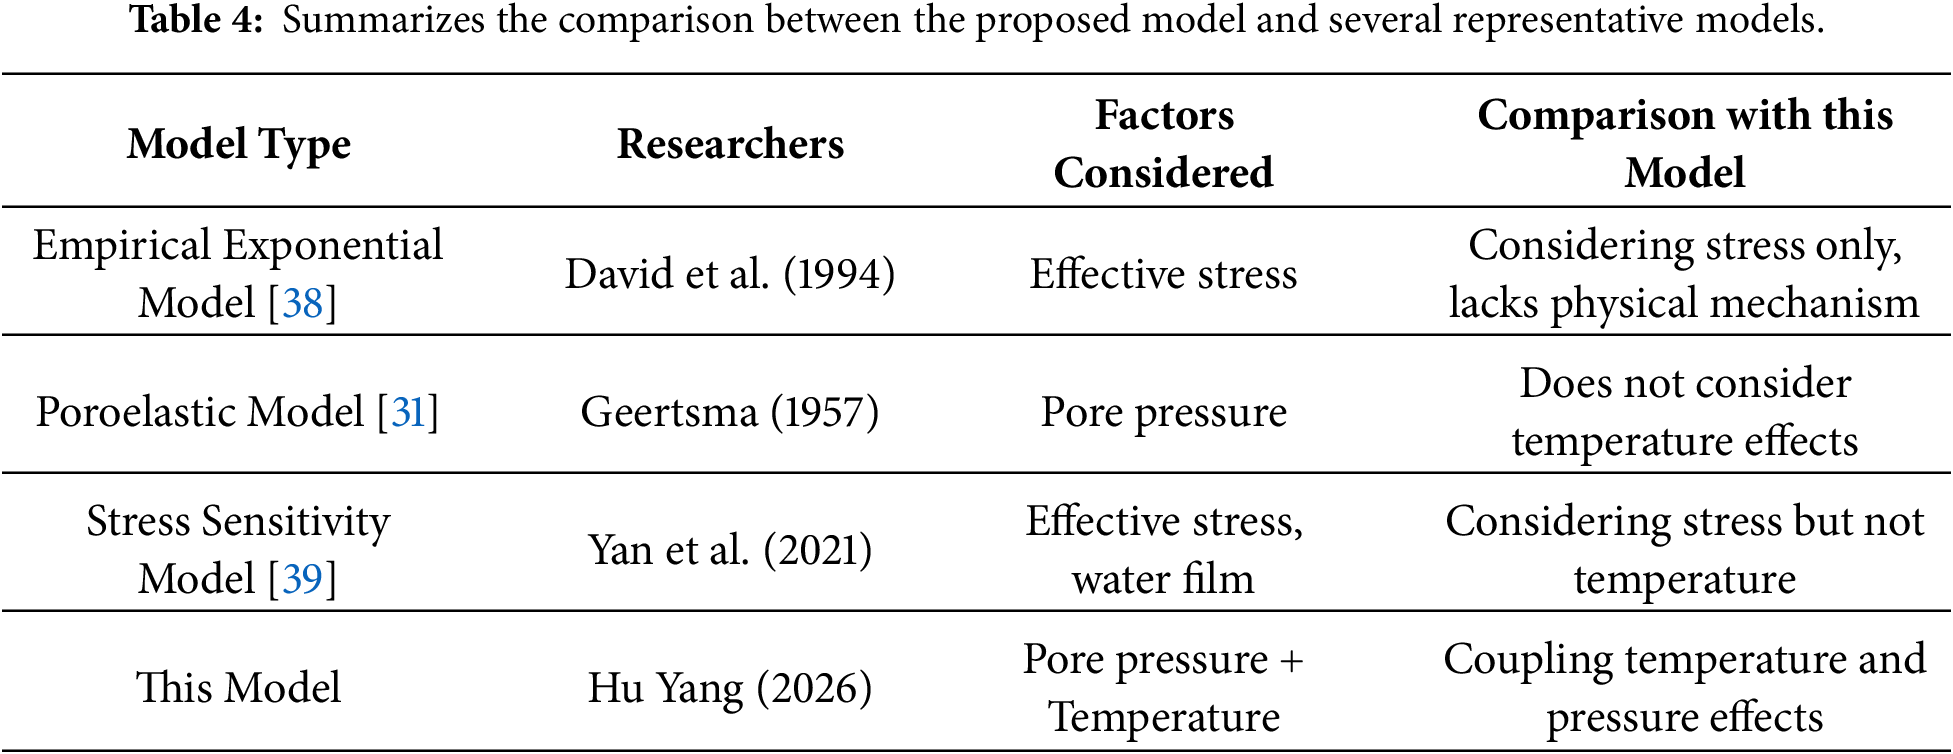
Compared with existing models, the innovations and advantages of this study are reflected in the following aspects:
(1) Coupling temperature and pressure effects: While most existing models only consider stress sensitivity, the proposed model simultaneously quantifies both the compaction effect caused by pore pressure reduction and the thermal contraction effect caused by temperature decrease, enabling prediction of bidirectional permeability changes (increase or decrease).
(2) Concise and practical analytical expression: Eq. (18) is a closed-form analytical expression with high computational efficiency, making it easy to integrate into reservoir simulators and suitable for engineering applications.
(3) Comprehensive validation: Systematic validation based on four lithologies and 12 experimental conditions shows that the mean absolute error between model predictions and experimental measurements is 3.23%, with the maximum error within 5.5%, demonstrating superior validation accuracy compared to similar models.
The systematic comparison with existing models reveals that the proposed model exhibits significant advantages in comprehensiveness of considered factors (first coupling of temperature and pressure effects), clarity of physical mechanisms (based on poroelastic and thermoelastic theory), and prediction accuracy (experimental validation error <5.5%). These advantages provide a solid theoretical foundation and experimental support for the application of this model in tight reservoir development.
After validating the theoretical model with laboratory core tests, the model was applied to Well X in the Jimusar oilfield, Junggar Basin, to evaluate reservoir permeability evolution over a 5-year production period.
Available data show that Well X has an initial pore pressure of 32 MPa, formation temperature of 88.5°C, and average reservoir permeability of 0.085 mD. Its comprehensive logging curve is shown in Fig. 11. Using field monitoring data, the reservoir pore pressure and temperature evolution over 5 years were extracted (Fig. 12c). Additionally, production data were analyzed by decline-curve methods and pressure-drawdown inversion to infer the relative permeability trend of the reservoir. The model was used to compute theoretical permeability evolution over 5 years and compared with production-derived permeability estimates; results are presented in Fig. 12a,b.
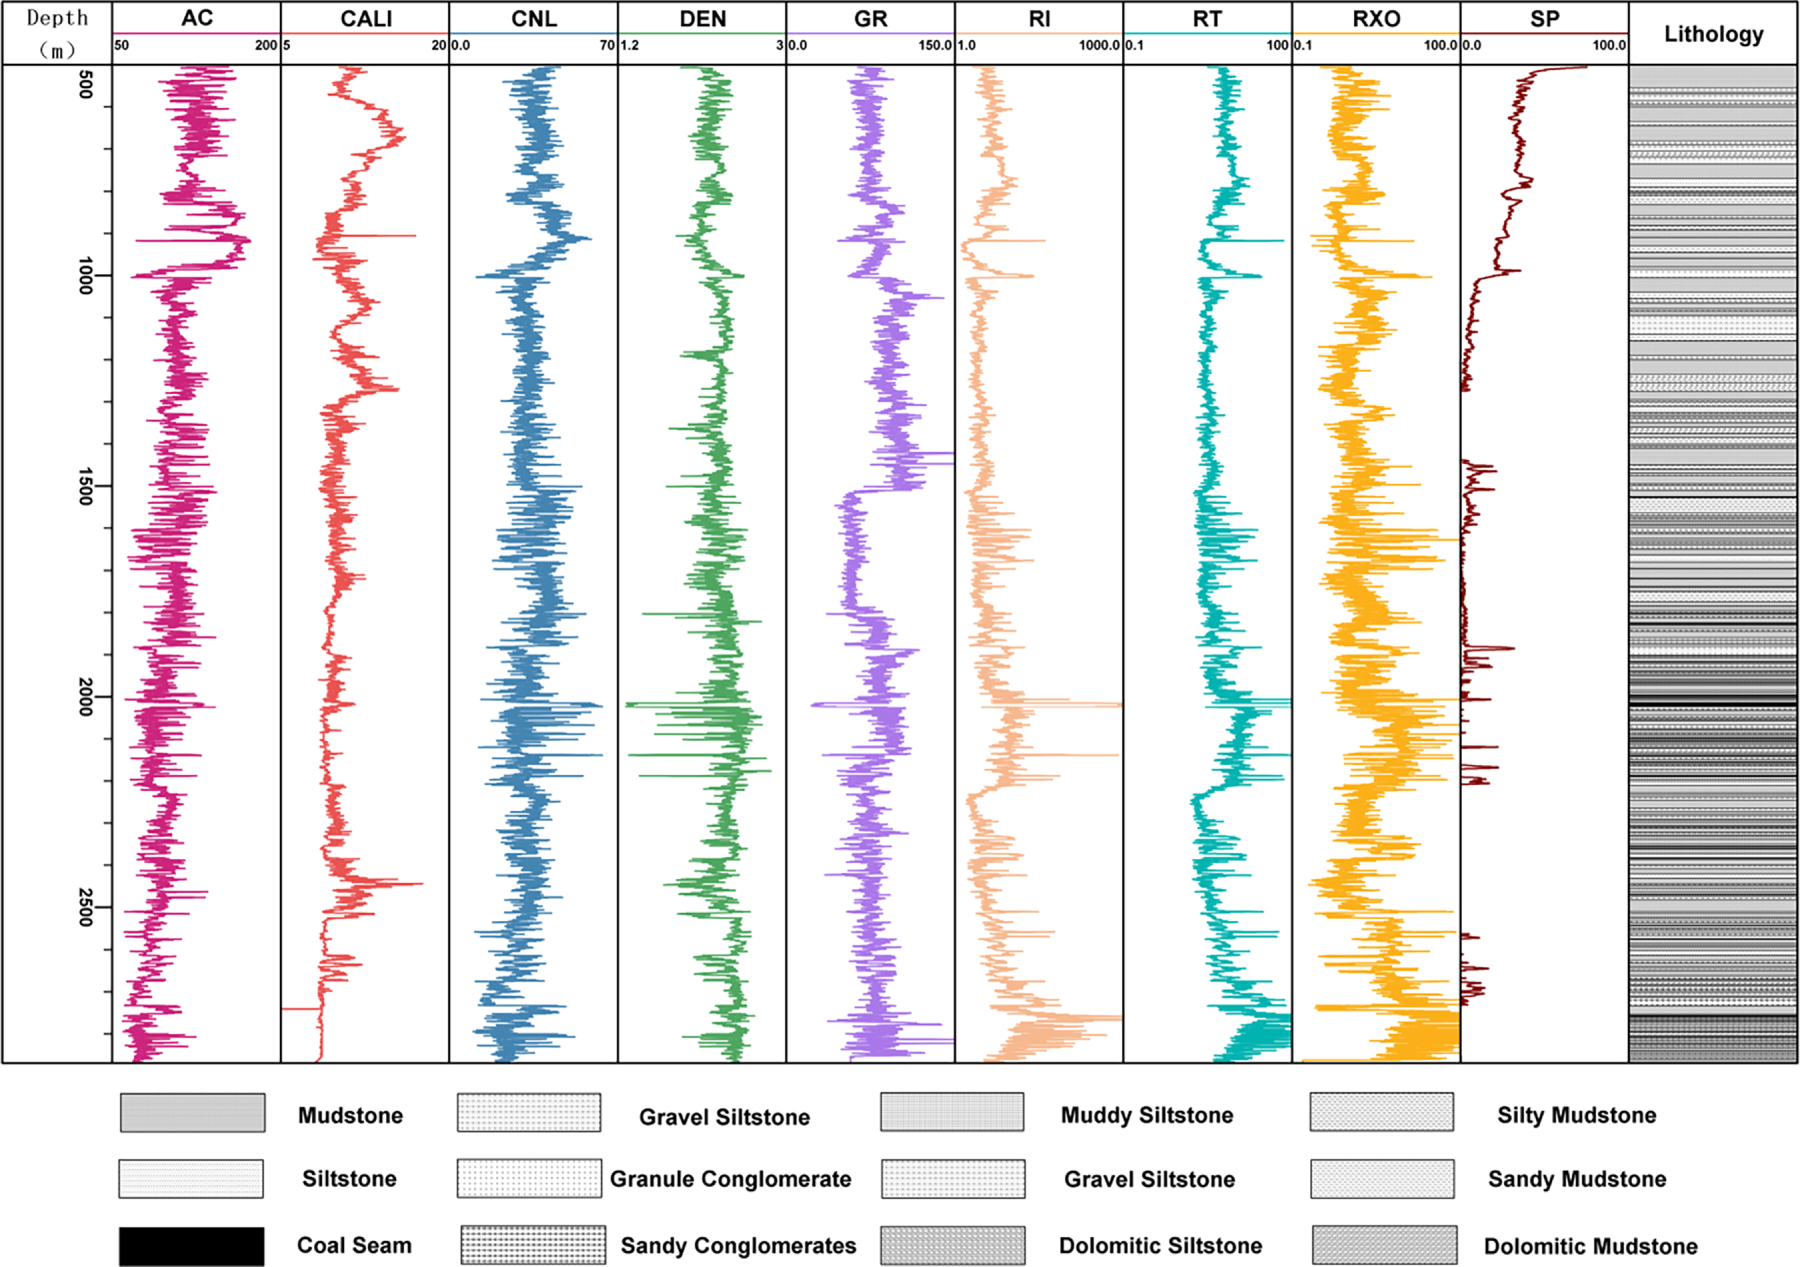
Figure 11: Comprehensive logging curve of well X in Jimusar.
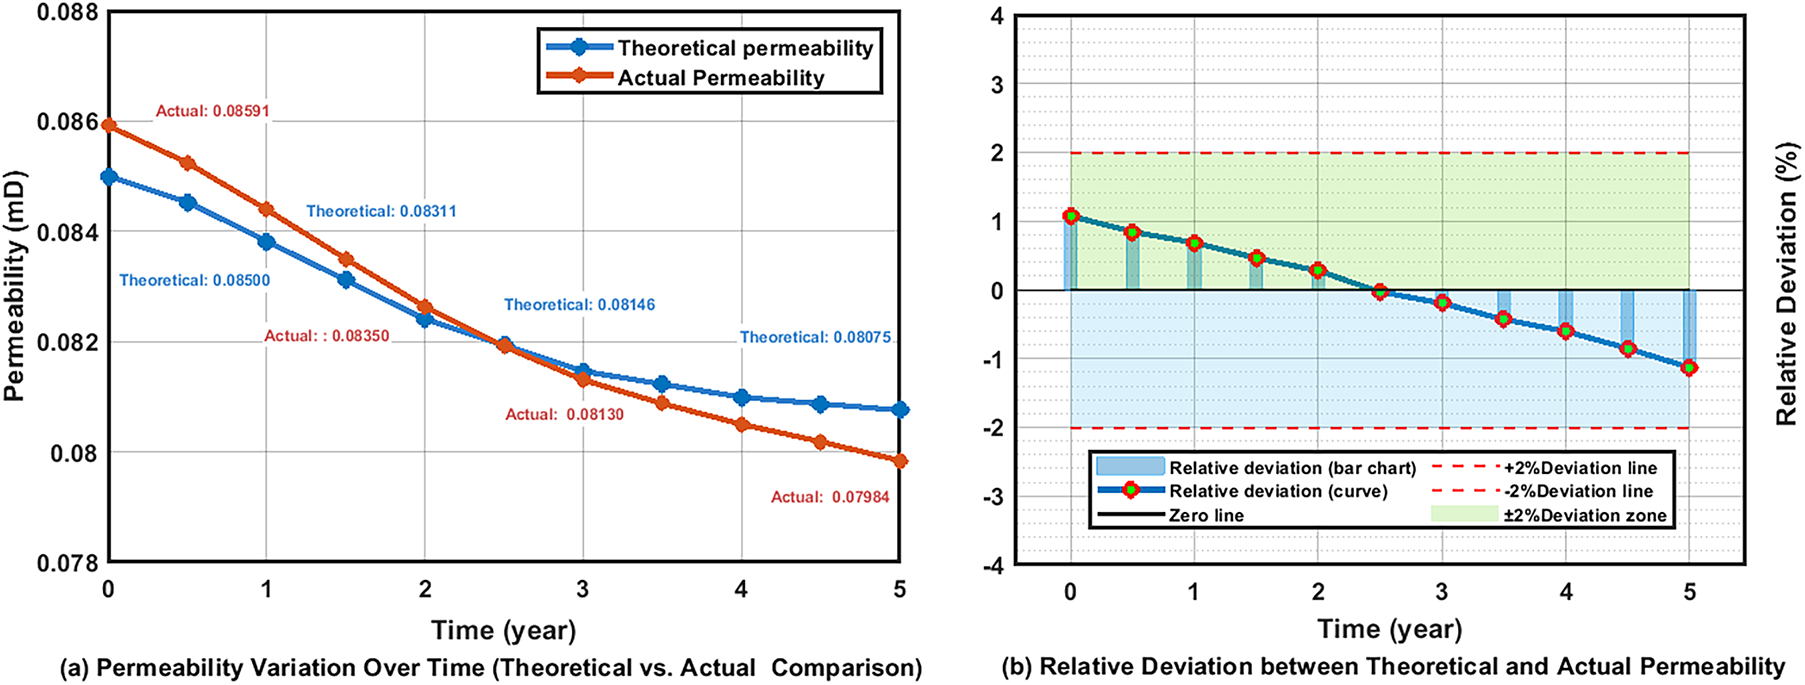
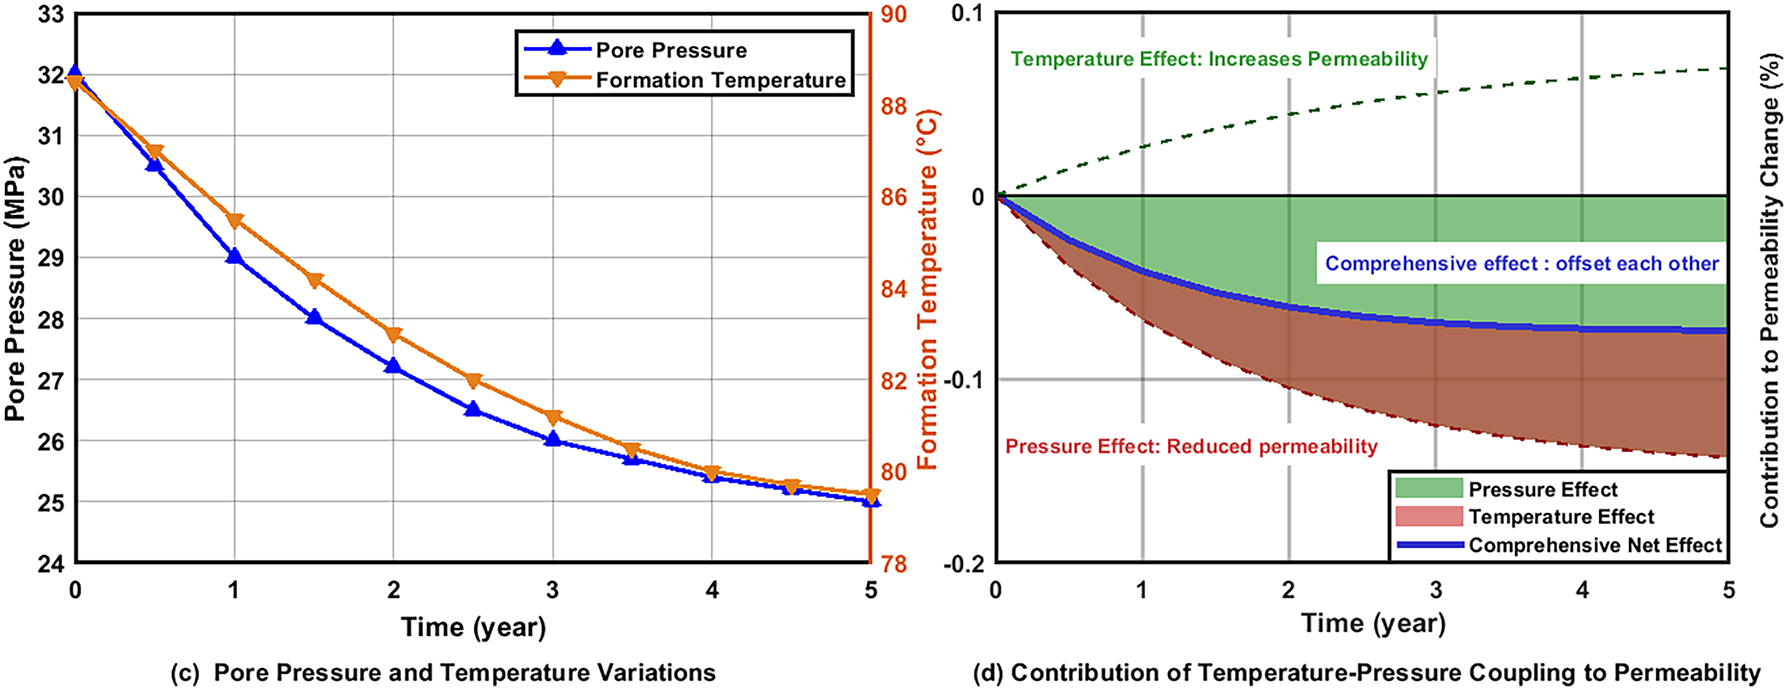
Figure 12: Permeability variation and temperature-pressure coupling effect in the shale oil reservoir of the lucaogou formation, Jimusar. (a) permeability variation over time (Theoretical vs. Actual Comparison); (b) relative deviation between theoretical and actual permeability; (c) pore pressure and temperature variations; (d) contribution of temperature-pressure coupling to permeability.
Fig. 12a shows the dynamic permeability variation of Well X over five years. The theoretical curve from the model matches the production-inferred permeability trend closely, validating the model’s field applicability. Fig. 12b indicates that the relative deviation between predicted and measured permeability remains within ±2% and fluctuates little, demonstrating good predictive accuracy and stability for tight reservoirs.
As discussed above, permeability evolution results from competing temperature and pressure effects. Fig. 12c shows that temperature changes occur slowly, whereas pressure declines follow a rapid-then-slow trend consistent with production physics. Fig. 12d illustrates the mechanisms:
(1) Pressure effect: pressure decline increases effective stress, compresses the rock framework, narrows pore throats, and reduces permeability.
(2) Temperature effect: temperature decline induces thermal contraction of the rock skeleton, enlarges pore space slightly, and tends to improve flow pathways, increasing permeability.
These opposing effects are of similar magnitude and thus partially cancel, creating a dynamic equilibrium that limits net permeability change.
This study proposes a quantitative permeability evaluation model that concurrently accounts for temperature and pore-pressure changes. The model’s validity and feasibility were confirmed through systematic laboratory experiments and a field application. The study integrates theoretical modeling, experimental verification, and field practice to provide a comprehensive understanding of permeability evolution from static parameters to dynamic behavior. The main findings are:
(1) Reservoir permeability during production is jointly influenced by pore-pressure reduction, porosity, Young’s modulus, Poisson’s ratio, thermal expansion coefficient, and temperature decline. Because temperature and pore-pressure changes exert opposite effects on permeability, their combined influence typically limits net permeability variation to within ±2%.
(2) Pore-pressure decline increases effective stress, compresses pore volume, and reduces permeability; conversely, formation cooling causes skeletal contraction that can increase pore volume and raise permeability. These two mechanisms counterbalance during production, producing a dynamic equilibrium.
(3) The model is applicable to tight reservoirs with undeveloped fractures and where deformation remains within elastic limits (effective stress below yield strength). For fractured formations or reservoirs undergoing plastic deformation, creep, or chemical diagenesis, model predictions require calibration or extension. Therefore, calibration and adjustment are necessary prior to broader application.
(4) The understanding of this study can provide technical support for the digital construction of the oilfield, and provide scientific basis and practical guidance for the efficient development of tight oil and gas reservoirs. Its potential applications include: (a) production forecasting under depletion drive; (b) integration into reservoir simulation workflows; (c) digital oilfield development for real-time permeability monitoring.
(5) Based on this study, in the future we will conduct the following further research: (a) extending the model to account for plastic deformation and fracture networks in naturally fractured reservoirs; (b) incorporating multi-field coupling effects, including chemical dissolution and creep under prolonged production; (c) conducting more realistic experimental validation under cyclic loading, true triaxial stress conditions, and higher temperature-pressure ranges; (d) developing a user-friendly software module for real-time permeability prediction and integration into digital oilfield platforms.
Acknowledgement: The authors would like to express their sincere gratitude to Xinjiang Oilfield Company of PetroChina for the generous support and funding provided for this research.
Funding Statement: This paper is supported by the financial support of the key research project of Science and Technology Department of Xinjiang Uygur Autonomous Region, China [Grant Number: 2024B010142].
Author Contributions: Conceptualization, Hu Yang; methodology, Hu Yang and Qiao Liu; software, Qiao Liu and Jinde Li; validation, Jinde Li, Junqing Wu and Qianbin Wen; formal analysis, Junqing Wu and Qianbin Wen; investigation, Hu Yang and Jinde Li; resources, Hu Yang; data curation, Qiao Liu and Yuhe Shi; writing—original draft preparation, Hu Yang, Qiao Liu and Yuhe Shi; writing—review and editing, Hu Yang and Qiao Liu; supervision, Hu Yang; project administration, Hu Yang; funding acquisition, Hu Yang. All authors reviewed and approved the final version of the manuscript.
Availability of Data and Materials: Data available on request from the authors.
Ethics Approval: Not applicable.
Conflicts of Interest: The authors declare no conflicts of interest.
References
1. Wang H, Ji B, Lv C, Zhang L, Li X, Cui C, et al. The stress sensitivity of permeability in tight oil reservoirs. Energy Explor Exploit. 2019;37(4):1364–76. doi:10.1177/0144598719855819. [Google Scholar] [CrossRef]
2. Gu Y, Ding W, Yin M, Liu J, Xiao Z, Jiao B, et al. Study on pressure sensitivity of tight sandstone and its influence on reservoir characteristics. Energy Sources Part A Recovery Util Environ Eff. 2018;40(22):2671–7. doi:10.1080/15567036.2018.1503753. [Google Scholar] [CrossRef]
3. Zhao C, Shi L, Su H, Yan L, Luo Y, Luo S, et al. Study on the four-dimensional variations of In Situ stress in stress-sensitive ultra-high-pressure tight gas reservoirs. Processes. 2025;13(5):1508. doi:10.3390/pr13051508. [Google Scholar] [CrossRef]
4. Wang H, Tian J, Lin J, Liu J, Maharjan N, Sheng J. NMR investigation on pore-scale stress sensitivity during pore fluid pumping cycles: implication for geological fluid storage. Int J Hydrogen Energy. 2025;120(1):1–12. doi:10.1016/j.ijhydene.2025.03.269. [Google Scholar] [CrossRef]
5. Liu K, Yin D, Sun Y. The mathematical model of stress sensitivities on tight reservoirs of different sedimentary rocks and its application. J Pet Sci Eng. 2020;193(1):107372. doi:10.1016/j.petrol.2020.107372. [Google Scholar] [CrossRef]
6. Xu Z, Lin M, Jiang W, Ji L, Xu L, Cao G. A pore network-based multiscale coupled model for rapid permeability prediction of tight sandstone gas. Mar Pet Geol. 2024;160(3):106600. doi:10.1016/j.marpetgeo.2023.106600. [Google Scholar] [CrossRef]
7. Zhao Y, Wang C, Bi J. Permeability model of fractured rock with consideration of elastic-plastic deformation. Energy Sci Eng. 2020;8(2):441–51. doi:10.1002/ese3.526. [Google Scholar] [CrossRef]
8. Cao R, Wang Y, Cheng L, Ma YZ, Tian X, An N. A new model for determining the effective permeability of tight formation. Transp Porous Medium. 2016;112(1):21–37. doi:10.1007/s11242-016-0623-0. [Google Scholar] [CrossRef]
9. Wang Q, Ru Z, Zhao R, Yu C, Liu Y, Deng S. A study on permeability along strike slip faults in Shunbei reservoir of Tarim Basin, China. Energy Sources Part A Recovery Util Environ Eff. 2025;47(1):2205–21. doi:10.1080/15567036.2020.1841341. [Google Scholar] [CrossRef]
10. Xu C, Tang J, Sun J, Kang Y, Tang Z, Huang C, et al. Dynamic stress sensitive analysis of fractured tight reservoirs under compound damage from drilling and fracturing fluids. Geoenergy Sci Eng. 2025;250:213807. doi:10.1016/j.geoen.2025.213807. [Google Scholar] [CrossRef]
11. Zhu Z, Niu Z, Que X, Liu C, He Y, Xie X. Study on permeability characteristics of rocks with filling fractures under coupled stress and seepage fields. Water. 2020;12(10):2782. doi:10.3390/w12102782. [Google Scholar] [CrossRef]
12. Liu HH, Zhang J, Eppler G, Boudjatit M. On the stress-dependent tight-rock permeability under anisotropic stress conditions. Gas Sci Eng. 2024;125(2):205313. doi:10.1016/j.jgsce.2024.205313. [Google Scholar] [CrossRef]
13. Liu Q, Chen T, Zhang H, Xu K, Zheng X, Wang Z, et al. Experimental investigation of permeability evolution in deep reservoirs under true triaxial stress: a review. Gas Sci Eng. 2025;144:205739. doi:10.1016/j.jgsce.2025.205739. [Google Scholar] [CrossRef]
14. Gerolymatou E, Leuthold J. Compaction localization and anisotropic permeability evolution. Comput Geotech. 2021;137:104173. doi:10.1016/j.compgeo.2021.104173. [Google Scholar] [CrossRef]
15. Guo X, Zou G, Wang Y, Wang Y, Gao T. Investigation of the temperature effect on rock permeability sensitivity. J Pet Sci Eng. 2017;156(8):616–22. doi:10.1016/j.petrol.2017.06.045. [Google Scholar] [CrossRef]
16. Ramezanian M, Emadi H. Investigating effects of temperature and confining pressure on dynamic elastic properties and permeability—an experimental study. Geomech Energy Environ. 2020;22:100179. doi:10.1016/j.gete.2020.100179. [Google Scholar] [CrossRef]
17. Wang G, Yang D, Zhao Y, Kang Z, Zhao J, Huang X. Experimental investigation on anisotropic permeability and its relationship with anisotropic thermal cracking of oil shale under high temperature and triaxial stress. Appl Therm Eng. 2019;146(5):718–25. doi:10.1016/j.applthermaleng.2018.10.005. [Google Scholar] [CrossRef]
18. Lyu C, Hao S, Sun Q, Zhang W, Geng J. Permeability evolution of two sedimentary rocks at different temperatures based on the Katz-Thompson theory. Int J Rock Mech Min Sci. 2021;144(4):104819. doi:10.1016/j.ijrmms.2021.104819. [Google Scholar] [CrossRef]
19. Li G, Li G, Luo C, Zhou R, Zhou J, Yang J. Dynamic evolution of shale permeability under coupled temperature and effective stress conditions. Energy. 2023;266(3):126320. doi:10.1016/j.energy.2022.126320. [Google Scholar] [CrossRef]
20. Tian S, Ren W, Li G, Yang R, Wang T. A theoretical analysis of pore size distribution effects on shale apparent permeability. Geofluids. 2017;2017(1):7492328. doi:10.1155/2017/7492328. [Google Scholar] [CrossRef]
21. Li YL, Li XP, Wu F, Lu HL, Lei X, Wang WJ, et al. Experimental study on stress sensitivity of high-temperature and high-pressure sandstone gas reservoirs in Yingqiong Basin. Energy Sci Eng. 2020;8(11):4116–25. doi:10.1002/ese3.800. [Google Scholar] [CrossRef]
22. Gao Q, Han S, Cheng Y, Li Y, Yan C, Han Z. Apparent permeability model for gas transport through micropores and microfractures in shale reservoirs. Fuel. 2021;285:119086. doi:10.1016/j.fuel.2020.119086. [Google Scholar] [CrossRef]
23. Li M, Liu X. Experimental and numerical investigation of the failure mechanism and permeability evolution of sandstone based on hydro-mechanical coupling. J Nat Gas Sci Eng. 2021;95(1):104240. doi:10.1016/j.jngse.2021.104240. [Google Scholar] [CrossRef]
24. Du J, Liu Q, Guo P, Jiang T, Xiong Y, Jiang X. Study on water displacing gas relative permeability curves in fractured tight sandstone reservoirs under high pressure and high temperature. ACS Omega. 2020;5(13):7456–61. doi:10.1021/acsomega.0c00139. [Google Scholar] [PubMed] [CrossRef]
25. Xu S, Yang D, Liu B, Jia C, Zhang Y. Multi-field coupling controls the formation and evolution of deep reservoirs. Adv Geo-Energy Res. 2025;17(2):176–8. doi:10.46690/ager.2025.08.08. [Google Scholar] [CrossRef]
26. Ma J. Review of permeability evolution model for fractured porous media. J Rock Mech Geotech Eng. 2015;7(3):351–7. doi:10.1016/j.jrmge.2014.12.003. [Google Scholar] [CrossRef]
27. Wang H. Effects of pore clusters on the permeability, formation factor and porosity exponent of porous media. Geosyst Eng. 2020;23(2):73–85. doi:10.1080/12269328.2018.1531729. [Google Scholar] [CrossRef]
28. Shi R, Liu J, Wang X, Wei M, Elsworth D. A critical analysis of shale laboratory permeability evolution data. Energy. 2021;236:121405. doi:10.1016/j.energy.2021.121405. [Google Scholar] [CrossRef]
29. Lyu Q, Shi J, Pathegama Gamage R. Effects of testing method, lithology and fluid-rock interactions on shale permeability: a review of laboratory measurements. J Nat Gas Sci Eng. 2020;78(3):103302. doi:10.1016/j.jngse.2020.103302. [Google Scholar] [CrossRef]
30. Berry FAF. Relative factors influencing membrane filtration effects in geologic environments. Chem Geol. 1969;4(1–2):295–301. doi:10.1016/0009-2541(69)90051-5. [Google Scholar] [CrossRef]
31. Geertsma J. The effect of fluid pressure decline on volumetric changes of porous rocks. Trans AIME. 1957;210(1):331–40. doi:10.2118/728-g. [Google Scholar] [CrossRef]
32. Nelson RA. Geologic analysis of naturally fractured reservoirs. Cambridge, MA, USA: Gulf Professional Publishing; 1985. [Google Scholar]
33. Jaeger JC, Cook NGW, Zimmerman RW. Fundamentals of rock mechanics. 4th ed. Oxford, UK: Blackwell Publishing; 2007. [Google Scholar]
34. McTigue DF. Thermoelastic response of fluid-saturated porous rock. J Geophys Res Solid Earth. 1986;91(B9):9533–42. doi:10.1029/JB091iB09p09533. [Google Scholar] [CrossRef]
35. Henderson N, Brêttas JC, Sacco WF. A three-parameter Kozeny-Carman generalized equation for fractal porous media. Chem Eng Sci. 2010;65(15):4432–42. doi:10.1016/j.ces.2010.04.006. [Google Scholar] [CrossRef]
36. Berryman JG, Ahrens TJ. Mixture theories for rock properties. In: Rock physics & phase relations. Washington, DC, USA: American Geophysical Union; 2013. p. 205–28. doi:10.1029/rf003p0205. [Google Scholar] [CrossRef]
37. Shapiro SA. Elastic piezosensitivity of porous and fractured rocks. Geophysics. 2003;68(2):482–6. doi:10.1190/1.1567215. [Google Scholar] [CrossRef]
38. David C, Wong TF, Zhu W, Zhang J. Laboratory measurement of compaction-induced permeability change in porous rocks: implications for the generation and maintenance of pore pressure excess in the crust. Pure Appl Geophys. 1994;143(1):425–56. doi:10.1007/BF00874337. [Google Scholar] [CrossRef]
39. Yan J, Zheng R, Chen P, Wang S, Shi Y. Calculation model of relative permeability in tight sandstone gas reservoir with stress sensitivity. Geofluids. 2021;2021:6260663. doi:10.1155/2021/6260663. [Google Scholar] [CrossRef]
Cite This Article
 Copyright © 2026 The Author(s). Published by Tech Science Press.
This work is licensed under a Creative Commons Attribution 4.0 International License , which permits unrestricted use, distribution, and reproduction in any medium, provided the original work is properly cited.
 Downloads
 Citation Tools
