
 Login
Login Register
 Submit a Paper
 Propose a Special lssue
 Open Access
ARTICLE
Analysis and Evaluation Methods for UHV AC Retrofitting Schemes and Application Effects under Renewable Energy Transmission Scenarios
1 Economic Research Institute, State Grid Jiangsu Electric Power Co., Ltd., Nanjing, China
2 College of Electrical Engineering, Zhejiang University, Hangzhou, China
* Corresponding Author: Ying Huang. Email:
Energy Engineering 2026, 123(11), 7 https://doi.org/10.32604/ee.2026.081805
Received 09 March 2026; Accepted 09 April 2026; Issue published 24 September 2026
 View Full Text
 Download PDF
Abstract
Aiming at the challenge of large-scale centralized integration of high-proportion renewable energy, and addressing current bottlenecks in ultra-high voltage (UHV) AC power grids—such as low utilization rates of transmission corridors and poor active power flow controllability—this paper proposes various upgrading and transformation schemes for UHV AC ring networks. These schemes aim to simultaneously enhance the renewable energy accommodation and operational regulation capabilities of the AC grid. First, targeting typical UHV double-circuit transmission corridors, three topological schemes are designed: direct AC integration of renewable energy, single-circuit voltage source converter-based high voltage direct current (VSC-HVDC) transformation, and double-circuit full VSC-HVDC transformation. Second, a unified DC power flow mathematical model is established to theoretically derive and reveal the power flow control characteristics under traditional AC integration, single-circuit VSC-HVDC transformation, and full VSC-HVDC transformation. Finally, a multi-dimensional evaluation system is constructed, encompassing power flow control flexibility, static and transient voltage stability, and short-circuit current levels. Simulations and analyses are then conducted using the Power System Dispatcher-Based Performance Analysis (PSD-BPA) program based on the 2040 planning data for the East China Power Grid. The research results indicate that the double-circuit full VSC-HVDC transformation scheme can overcome the physical constraints of the AC grid’s natural impedance, achieving active regulation of transmission power. Simultaneously, it effectively limits short-circuit currents by leveraging its nonlinear high-impedance characteristics. This scheme serves as an effective technical pathway for resolving the challenges of high-proportion renewable energy transmission and ensuring the safe and stable operation of receiving-end power grids.Keywords
With the profound advancement of the “carbon peaking and carbon neutrality” strategic goals, constructing a novel power system with renewable energy as the mainstay has become the core task of China’s energy transition [1]. As a major economic and energy-consuming province on the eastern coast, the development of Jiangsu’s power grid presents typical characteristics: on one hand, the province is abundant in onshore photovoltaic and offshore wind resources, driving an urgent need for the large-scale and centralized development of renewable energy [2]; on the other hand, due to the dense and heavy local electrical loads, there is a pressing demand for the continuous injection of external power through transmission corridors [3].
However, the development paradigm of traditional AC power grids is encountering multiple bottlenecks. First, there is a fundamental trade-off between the utilization rate of transmission corridors and the suppression of short-circuit currents: although strengthening grid interconnections can enhance transmission capacity, it further elevates the short-circuit current levels at hub buses, thereby exacerbating the risk of insufficient breaking capacity of circuit breakers [4]. Second, there is a deficiency in renewable energy integration and power flow control capabilities: after large-scale renewable energy is centrally connected via AC lines, the power flow distribution caused by its output fluctuations strictly follows Kirchhoff’s laws; this passive distribution cannot be actively controlled and is prone to causing transmission congestion [5]. Furthermore, the dynamic voltage support capability at load centers is weak: the superposition of the long-distance nature of UHV power injection and the weak-feed characteristics of renewable energy generators makes the voltage recovery issue of the receiving-end grid increasingly prominent after faults [6]. These issues indicate that traditional planning approaches centered on AC grid expansion are no longer adequate for the development needs of receiving-end grids under the context of high-proportion renewable energy integration. How to achieve the efficient integration of gigawatt-level renewable energy while ensuring the safe and stable operation of the main AC grid has become a critical scientific problem urgently needing resolution for the Jiangsu power grid.
To address these challenges, Jiangsu has constructed a UHV AC ring grid and formed a robust receiving-end grid relying on the East China UHV ring grid. Recent theoretical advancements have extensively explored the modeling, control mechanisms, and macroscopic impacts of hybrid AC/DC systems. From a macro-level perspective, recent empirical studies have confirmed that Ultra-High-Voltage (UHV) construction projects significantly improve cross-regional energy efficiency and facilitate large-scale renewable energy dispatch [7]. However, the current transmission capacity utilization rate of UHV AC corridors in Jiangsu is relatively low, and their potential transmission capability has not yet been fully harnessed [8]. Scientifically retrofitting the existing UHV AC ring grid to transform it into an “expressway” supporting the cross-regional transmission of renewable energy is a feasible technical pathway to enhance corridor utilization and successfully deliver renewable energy to load centers [9].
Therefore, the primary motivation of this study stems from the stark contrast between the urgent requirement for large-scale renewable energy integration and the current low transmission capacity utilization rate of existing UHV AC corridors. Driven by the dual demands of accommodating massive renewable energy and supplying growing local loads, this paper aims to explore scientifically feasible retrofitting schemes for UHV AC ring grids. By doing so, we intend to achieve a dual benefit: transforming underutilized AC corridors into actively controllable ‘expressways’ for cross-regional power transmission, while fundamentally resolving the bottleneck of passive power flow and excessive short-circuit currents.
The rapid development of VSC-HVDC technology provides a novel solution to address this requirement. This technology possesses superior features such as the independent and decoupled control of active and reactive power, less short-circuit current contribution, and fault isolation capabilities, which can fundamentally break through the physical constraints of AC transmission that rely on line impedance and power flow distribution strictly following Kirchhoff’s laws [10]. In particular, the increasingly mature engineering applications of Multi-Terminal DC (MTDC) systems make it possible to embed multiple converter stations within the receiving-end grid, thereby realizing multi-point power injection and flexible mutual support [11]. This “embedded VSC-HVDC” grid configuration mode can enhance corridor transmission capacity, strengthen regional mutual support capabilities, and improve voltage support characteristics without significantly increasing short-circuit currents, providing a completely new technical perspective for the upgrading and retrofitting of UHV AC ring grids [12]. To theoretically analyze such complex interconnected networks, advanced unified power flow models and sequential algorithms have been recently proposed for multi-terminal HVDC and hybrid AC/DC systems. These theoretical frameworks enable accurate evaluations of steady-state power distributions under various converter control modes [13,14]. Furthermore, regarding dynamic interactions, recent research has deeply investigated the active power flow control mechanisms and grid-forming capability transfers of VSC-HVDC systems, theoretically proving their bidirectional support capabilities for weak AC grids [15].
In response to the transmission bottlenecks and grid security issues caused by the large-scale integration of renewable energy, scholars worldwide have conducted extensive research. Regarding the capacity expansion and retrofitting of transmission corridors, traditional approaches have primarily focused on technologies such as the series compensation and dynamic reactive power compensation of AC lines, aiming to enhance the transmission capacity and stability of existing AC corridors [16]. However, these methods do not fundamentally alter the physical essence of AC transmission. In recent years, retrofitting existing AC corridors using VSC-HVDC technology has emerged as a research hotspot. Some scholars have proposed schemes to retrofit AC lines into VSC-HVDC systems, verifying their advantages in power flow control and short-circuit current suppression [17]. Nevertheless, for UHV AC ring grid structures, comparative studies on system-level performance under different retrofitting modes remain insufficient, and there is a lack of analytical analysis revealing their power flow control characteristics from a theoretical perspective [18].
Aiming at the limitations of the current research, this paper sets the core objective of enhancing the renewable energy integration capacity and corridor utilization rate of the receiving-end grid. Focusing on the retrofitting of the UHV AC ring grid, three main contributions are made as follows:
1. Proposing three progressive UHV AC ring grid retrofitting schemes: Targeting a typical UHV double-circuit corridor, three topological scenarios are designed, ranging from the direct AC integration of renewable energy and single-circuit VSC-HVDC retrofitting, to double-circuit full VSC-HVDC retrofitting. The operational boundaries and control characteristics of each scheme are clarified.
2. Revealing the control mechanisms of each scheme based on DC power flow theory: A unified mathematical model applicable to the three schemes is established, and the analytical relationship of the total transmission power in key transmission corridors is rigorously derived from a theoretical perspective. The essential reasons for the “passive congestion effect” of traditional AC integration, the “shunting and squeezing effect” of single-circuit retrofitting, and the “global controllability” achieved by full VSC-HVDC retrofitting are physically verified.
3. Constructing a comprehensive evaluation system and conducting quantitative verification: A multi-dimensional evaluation system encompassing power flow control flexibility, static/transient voltage stability, and short-circuit current levels is proposed.
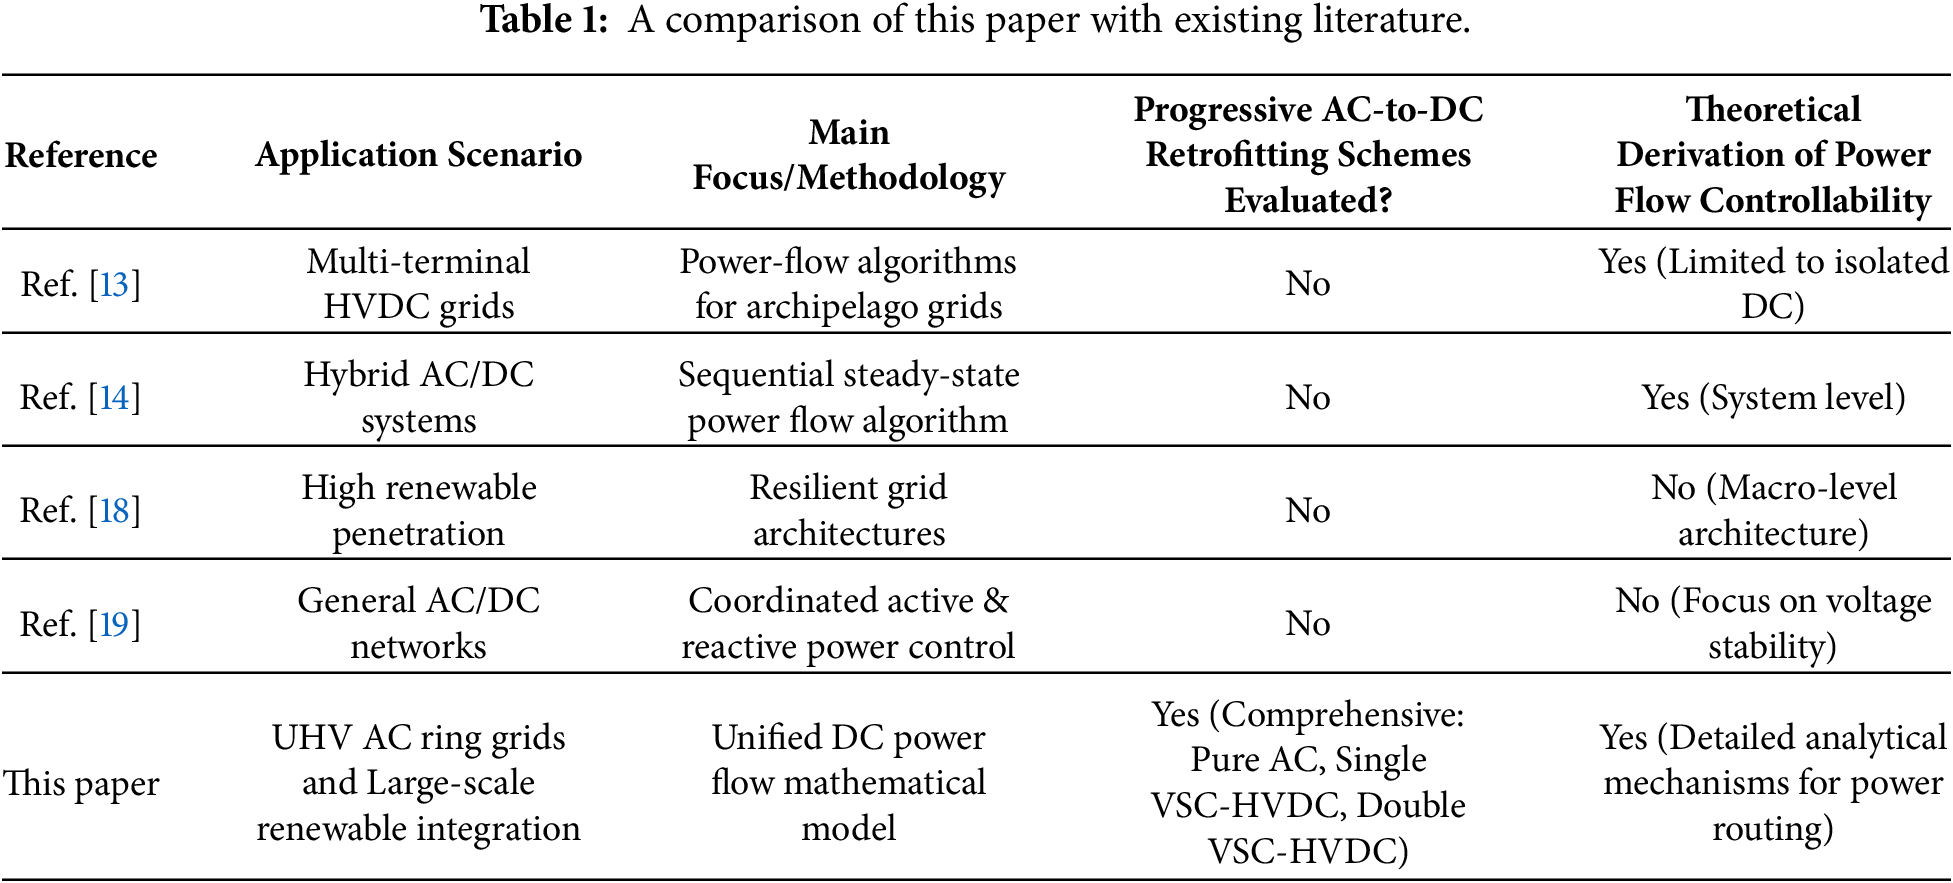
Based on the 2040 planning data of the East China Grid, comprehensive simulations are conducted to quantitatively verify the practical engineering effects of different retrofitting schemes in breaking through transmission bottlenecks and enhancing the security of the receiving-end grid. To clearly highlight the unique contributions of this study compared to the existing state-of-the-art, a systematic comparison is presented in Table 1.
2 Design of Retrofitting Schemes for UHV AC Ring Grids
This chapter designs three representative retrofitting schemes for UHV AC corridors. These schemes encompass technical pathways ranging from traditional AC expansion to DC retrofitting, aiming to explore the optimal path for enhancing the control flexibility and operational security of the receiving-end grid by altering the physical characteristics of transmission corridors.
2.1 Scheme I: Direct AC Integration Scheme for Renewable Energy
Scheme I follows the evolutionary paradigm of traditional AC grids. Based on the existing UHV double-circuit AC lines, as shown in Fig. 1, it achieves the collection and transmission of renewable energy by constructing new AC substations.
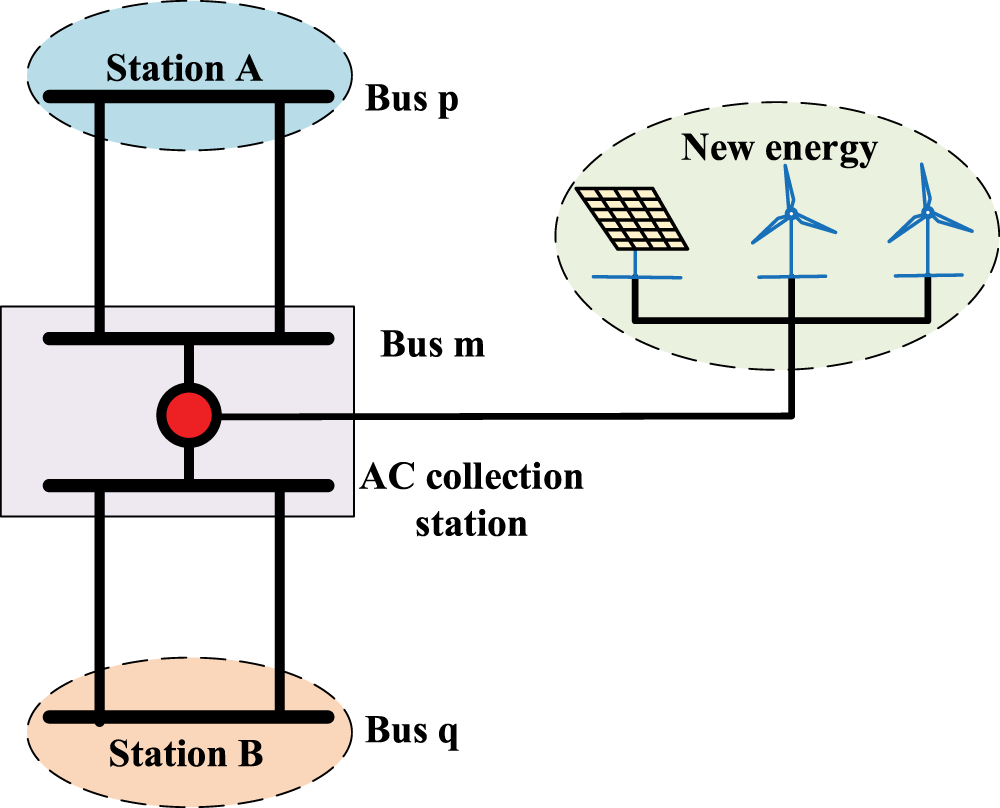
Figure 1: Diagram of UHV AC transformation scheme I.
In Scheme I, after being stepped up by the collection system, the renewable energy power plants are connected to the intermediate node m located between bus p and bus q. The original double-circuit UHV AC lines remain in parallel operation, and the renewable energy directly enters the AC ring grid at this node, forming a typical topology of “AC corridor-intermediate grid integration”.
Under this topology, the power flow distribution of the corridor depends entirely on the nodal impedance matrix and the nodal phase angle distribution of the system. Due to the absence of active regulation components, the corridor power cannot be adjusted independently of the grid state. This “passive physical coupling” characteristic may lead to localized transmission congestion.
2.2 Scheme II: Single-Circuit VSC-HVDC Retrofitting Scheme
Scheme II adopts the transitional approach of “AC/DC parallel operation”. Considering the complexity and economic factors of AC-to-DC retrofitting, only one circuit of the original UHV double-circuit lines is retrofitted with VSC-HVDC, aiming to introduce active control variables to enhance the transmission performance of the corridor.
This scheme retains one AC circuit unchanged and retrofits the other into a VSC-HVDC transmission system based on Modular Multilevel Converters (MMC). If the transmission capacity of the original AC line can meet the DC system capacity, it can be disconnected in the middle to construct back-to-back converter stations, which are then connected to the renewable energy terminal (as shown in Fig. 2); if the transmission capacity of the original AC line cannot meet the DC system capacity, the entire line needs to be retrofitted to DC line.
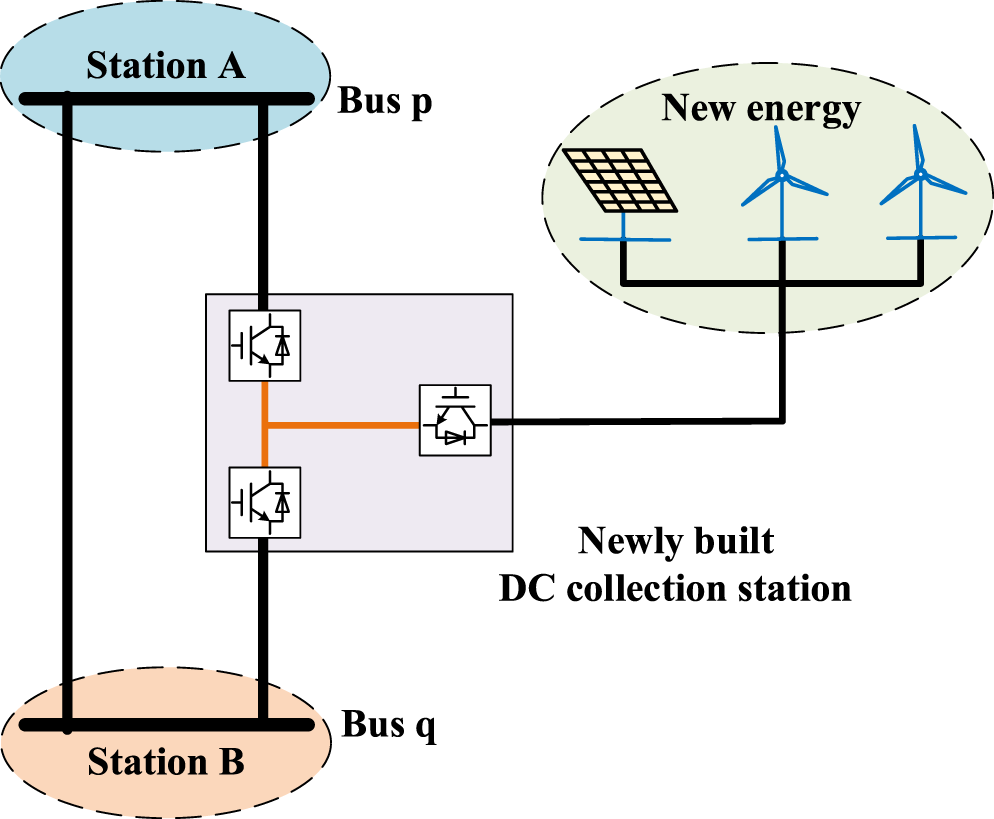
Figure 2: Diagram of UHV AC transformation scheme II.
The control objectives of the MMC are primarily divided into two categories: active power and reactive power. The active power control objectives mainly involve parameters such as active power Ps and DC voltage Udc, while the reactive power control objectives mainly include parameters such as reactive power Qs and AC voltage amplitude Us. When supplying power to a passive network through a VSC-HVDC system, constant U/f control is typically adopted [20]. For the three-terminal VSC-HVDC system shown in Fig. 2, the converter at the renewable energy terminal usually adopts constant U/f control. For the two converters connected to the UHV lines, in terms of active power, one adopts constant DC voltage control and the other adopts constant active power control [21]. In terms of reactive power, constant zero reactive power control is usually applied; however, when the AC grid is weak, constant AC voltage control at the grid-connected converter bus can be utilized to provide reactive power-voltage support for the AC grid [19].
In Scheme II, the DC corridor can achieve precise power regulation. However, because the AC branch still exists, the regulation of DC power will trigger a redistribution of power flow in the parallel AC branch. The power flow in the parallel branch may decrease or even reverse, generating a “power flow squeezing” or “shunting effect”.
2.3 Scheme III: Double-Circuit VSC-HVDC Retrofitting Scheme
Scheme III retrofits both AC circuits of the original UHV corridor. If the transmission capacity of the original AC lines can meet the DC system capacity, they can be disconnected in the middle to construct back-to-back converter stations, which are then connected to the renewable energy terminal (as shown in Fig. 3); if the transmission capacity of the original AC lines cannot meet the DC system capacity, the entire lines need to be retrofitted to DC. At this point, there is no longer a direct AC electrical connection between bus p and bus q, forming an “active energy pipeline” entirely supported by power electronic equipment.
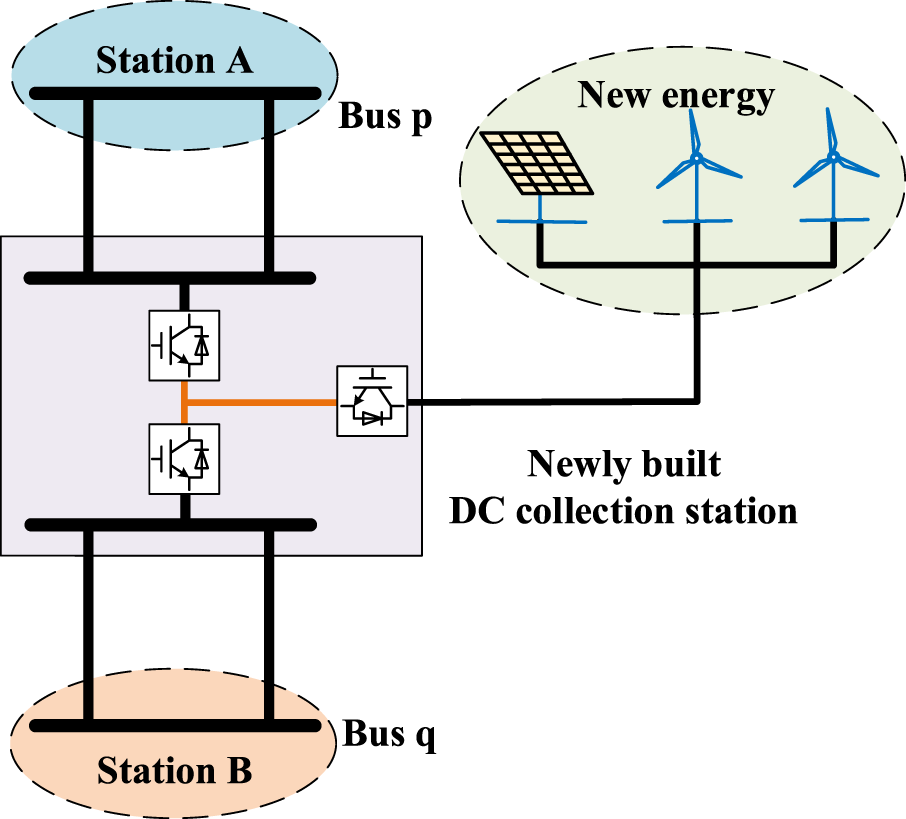
Figure 3: Diagram of UHV AC transformation scheme III.
The core advantage of this scheme lies in “completely decoupling”. On one hand, the transmission power is completely freed from the physical constraints of network impedance and bus phase angles, achieving a 100% degree of control freedom. On the other hand, the nonlinear impedance characteristics of the DC system can block the short-circuit current injection paths from the systems on both sides. Among them, the control methods for the three converters are identical to those in Scheme II.
3 Analysis of Control Flexibility Based on DC Power Flow Algorithm
This chapter aims to theoretically reveal the impact of different UHV AC retrofitting schemes on power flow control flexibility. The DC power flow model is employed because it linearizes complex nonlinear problems, thereby facilitating the analytical analysis of the fundamental relationship between power distribution and network parameters. By establishing a unified mathematical model, this chapter sequentially analyzes the capabilities of the three schemes proposed in the previous chapter in controlling the total power of the transmission corridor.
3.1 Unified Mathematical Model for DC Power Flow
For an n-bus system, the DC power flow equation can be expressed as:
where
1. Off-diagonal elements:
2. Diagonal elements:
For an AC line connecting bus p and bus q, the transmitted active power Ppq is:
when multiple parallel AC lines exist between two buses, the total power is the sum of the active power of each line. Taking the single-circuit reactance x as a reference, if the parameters of the double-circuit lines are identical, the equivalent parallel reactance is x/2, and the total power is
3.2 Power Flow Characteristics of Scheme I
In Scheme I, nodes p and q are connected by double-circuit AC lines (the total equivalent impedance is denoted as
3.2.1 Network Topology Changes
Assume that before the integration of renewable energy, the initial nodal susceptance matrix of the original system is
Let the electrical distance ratio of the newly constructed node m from node p be
The augmented DC power flow equation containing the new node m is expressed in a block matrix format. Let the new phase angle vector of the original n nodes after the integration of renewable energy be
The physical definitions of the elements in the augmented matrix are as follows:
1. Self-susceptance of node m:
2. Mutual susceptance vector
3. Original nodal correction matrix
3.2.2 Solution for Phase Angles and Transmission Power
To solve for the actual phase angles of the original n nodes after the integration of renewable energy, matrix algebraic solving is performed on Eq. (3). Expanding the second row of the matrix yields the phase angle expression for node m:
Substituting this into the first row of the matrix to eliminate
Moreover, since:
Therefore, Eq. (9) can be simplified as:
Since the power flow of the original system before integration satisfies
The new phase angles of node p and node q after deviation are obtained as follows:
Then, the phase angle difference between the two ends after the integration of renewable energy is:
Consequently, the actual active power of the two lines sections within the corridor are, respectively:
Combining with Eq. (8), the actual power flow of the corridor can be finally obtained:
The above rigorously derived formulas profoundly reveal the fundamental physical defects faced by the current pure AC grid when adapting to the integration of renewable energy at intermediate nodes:
1. Passive physical splitting of renewable energy power: Eq. (19) indicates that the renewable energy integrated at the intermediate node cannot be fully transmitted to node q, and a portion of the power flows to node p. This purely passive physical allocation mechanism can easily lead to undesirable power flow reduction or even reverse flow in the p-side network.
2. High susceptibility to AC section congestion: Because the corridor power cannot be actively regulated, when fluctuations in the external grid power flow cause
3. If the superimposed power flow exceeds the thermal stability limit of the line, the dispatch system cannot alleviate the power flow through internal regulation and is forced to resort to the extreme measure of curtailing renewable energy (wind and solar curtailment).
In summary, Scheme I completely depends on the natural physical parameters of the network and cannot achieve the active control of the renewable energy transmission power and the power flow of the UHV AC ring grid. This is the fundamental motivation for introducing VSC-HVDC technology to retrofit the UHV AC ring grid under the renewable energy transmission scenario.
3.3 Scheme II: Limitation Analysis of the Single-Circuit VSC-HVDC Retrofitting Scheme
3.3.1 Network Topology Changes
For Scheme II, one AC circuit between nodes p and q is retrofitted into a VSC-HVDC line, while considering the integration of renewable energy.
Let the initial nodal active power injection vector of the system be
After retrofitting one AC circuit with an impedance of x into a DC line, it is equivalent to disconnecting this branch in the original AC grid. The correction to the nodal susceptance matrix is a rank-1 matrix:
where
Ignoring the DC line losses, the VSC-HVDC converter extracts the DC command power
3.3.2 Solution for Phase Angles and Transmission Power
According to the Woodbury matrix identity, the nodal impedance matrix
where the physical meaning of α is the Thevenin equivalent reactance of the system looking into nodes p and q.
The new phase angle vector
Expanding this equation, substituting the initial phase angle, as well as the scalar relationships and equivalent reactance, and combining like terms, the exact analytical expression of the phase angle vector is obtained:
Specifically, for the renewable energy injection term, a mutual impedance difference scalar is defined:
To calculate the transmission power of the remaining one AC circuit in the transmission corridor, it is necessary to calculate the new phase angle difference between nodes p and q:
After simplification, it yields:
Since the reactance of the remaining parallel AC line is still x, its transmission power is:
Finally, the total transmission power
As can be seen from Eq. (30), the total transmission power is linearly correlated with the DC power reference value.
3.3.3 Analysis of Power Flow Congestion and Local Renewable Energy Substitution Effect
Eq. (30) profoundly reveals the physical limitations of the single-circuit VSC-HVDC retrofitting scheme and its controlled characteristics under complex operational scenarios:
(1) “Shunting/congestion effect” of DC control: The coefficient before the DC command is
(2) “Substitution and squeezing effect” at the renewable energy injection terminal: A term determined by the renewable energy is newly added to the formula. Since, in actual power systems, the nodal self-impedance
3.4 Scheme III: Theoretical Analysis of Double-Circuit VSC-HVDC Retrofitting and Complete Power Flow Decoupling Characteristics
Scheme III retrofits both AC circuits between nodes p and q into a VSC-HVDC system. At this point, this direct electrical connection between the sending and receiving ends is completely severed, replaced by a fully controllable power transmission corridor composed of converters and their DC networks. This section will prove that under this scheme, the transmission power of the UHV corridor will completely break free from the constraints of network parameters and achieve active decoupling from the renewable energy integration at the receiving end.
3.4.1 Network Topology Changes
Completely dismantling or retrofitting the double-circuit AC lines is equivalent to disconnecting a branch with an impedance of x/2 in the original AC grid.
The correction to the nodal susceptance matrix is:
The nodal susceptance matrix of the retrofitted system is:
The double-circuit VSC-HVDC converters operate in coordination, collectively extracting the DC command power
3.4.2 Solution for Phase Angles and Transmission Power
According to the Woodbury matrix identity, the nodal impedance matrix
where α remains the equivalent transfer reactance of the external system.
Substituting the new nodal injection vector to calculate the phase angles of the entire grid
Although the receiving-end renewable energy and the extracted DC power will still cause a redistribution of phase angles in the rest of the AC nodes across the grid, for this specific transmission corridor from p to q, its AC connection at the physical level has been completely severed. Therefore, no matter how drastically the AC phase angle difference
4 Comprehensive Evaluation System for Application Effects
Section 3 has rigorously demonstrated, from a theoretical perspective, the characteristic differences in flexible power flow control of transmission corridors among various retrofitting schemes for the UHV AC ring grid. However, considering the complex operational scenarios of high-proportion renewable energy integration in the receiving-end grid, the evaluation of the engineering applicability of the UHV corridor retrofitting schemes should not be solely limited to the single dimension of power flow control characteristics; a comprehensive evaluation must be conducted from multiple dimensions. Therefore, this chapter focuses on three core dimensions: power flow control flexibility, voltage stability, and short-circuit current level, proposing quantitative evaluation indices for each.
4.1 Evaluation and Index Definition of Power Flow Control Flexibility
Power flow control flexibility is a core index for measuring the scheduling adaptability of transmission corridors, directly determining the integration adaptability of the receiving-end grid to renewable energy output fluctuations. It is also a key indicator for alleviating transmission congestion and enhancing the resource allocation efficiency of the power grid.
In this study, the Power Flow Controllability (PFC) index is defined as: under given steady-state operating conditions, the ratio of the actual achievable total transmission power regulation range of a transmission corridor to its physical limit transmission capacity (i.e., the sum of the thermal stability limits of individual circuits or the rated capacities of the converters within the corridor). Its calculation formula is as follows:
where
4.2 Evaluation and Index Definition of Voltage Stability
This paper proposes the following two quantitative evaluation indices from two dimensions: steady-state disturbance resistance and transient fault recovery.
4.2.1 Static Voltage Stability Index (
It characterizes the system’s ability to resist the active power fluctuations of renewable energy and maintain nodal voltage stiffness under steady-state operating conditions. It is defined as the ratio of the steady-state voltage amplitude at the Point of Common Coupling (PCC) after the integration of renewable energy at its full-rated capacity
A larger value of this index indicates superior static voltage stabilization characteristics of the system; however, attention must be paid to avoiding overvoltage. It is important to note the operational interpretation of the proposed static voltage stability index. In this study, the safe and optimal threshold range for this index is defined as 0.95 to 1.05 p.u., which aligns with the general consensus in power system operations allowing for a voltage fluctuation of ±0.05 p.u. Furthermore, the actual value of this index is directly influenced by the selected control strategy of the VSC-HVDC converters. When the VSC adopts Constant Reactive Power Control, it acts as a fixed reactive power source/sink, and the AC voltage at the PCC depends entirely on the natural power flow calculation of the wider AC system. Conversely, when Constant AC Voltage Control is applied, the VSC leverages its dynamic reactive power capability. Provided the required reactive power remains within the converter’s capacity limits, this strategy can actively maintain the PCC AC voltage at a strictly constant value (e.g., exactly 1.0 p.u.), thereby providing superior voltage support and stabilizing the index against grid disturbances.
4.2.2 Transient Voltage Stability Index (
It characterizes the dynamic support capability of the system to maintain the voltage at the grid connection point and achieve rapid recovery after a severe fault occurs. Selecting a three-phase short-circuit fault as the typical disturbance scenario, this index is defined as the time required for the bus voltage at the grid connection point to recover to 0.95 p.u.:
where t0 is the fault occurred time. A smaller value of
4.3 Evaluation and Index Definition of Short-Circuit Current Level
4.3.1 VSC-HVDC Short-Circuit Current Limiting Mechanism
In traditional AC grids, when a short-circuit fault occurs at node k, the short-circuit current is mainly provided by the synchronous machines across the grid and is determined by the system equivalent impedance network:
Retaining or strengthening the AC grid interconnections will reduce the system equivalent impedance, thereby inevitably pushing up the short-circuit current at the receiving-end hub buses.
The short-circuit response mechanism of the VSC-HVDC transmission system is fundamentally different from that of traditional AC components. When a short-circuit fault on the AC side causes a voltage dip, the internal control system of the converter will instantaneously trigger the current-limiting loop [22]. To protect the power electronic devices, the control system strictly clamps the output d- and q-axis current reference values of the converter within their maximum safety limits:
where
As the voltage
4.3.2 Short-Circuit Current Level Index
Based on the above short-circuit current evolution mechanism, this study selects the peak short-circuit current index
This index is defined as the maximum transient peak value of the first half-cycle short-circuit current flowing through critical circuit breakers after a three-phase metallic short-circuit fault occurs at a specific hub node (unit: kA). In subsequent case evaluations, whether this index breaks through the breaking capacity limit of the circuit breaker will be used as a strict constraint to judge the security and feasibility of the scheme.
It should be noted that in the electromechanical transient simulation software BPA, some of the calculation principles for short-circuit current are as follows [23]:
1. Static loads are considered.
2. Shunt reactive power compensation is incorporated.
3. Line charging power is accounted for.
4. MMC-HVDC systems are included in the model.
5. Contributions from renewable energy sources are evaluated.
6. STATCOM devices are considered in the analysis.
7. A short-circuit voltage coefficient of 1.08 p.u. is applied.
Based on the power system computational analysis software BPA, a simulation analysis of the three proposed UHV AC retrofitting schemes is conducted using the 2040 planning data of the East China Grid. The local grid topology of the planning data is shown in the Fig. 4.
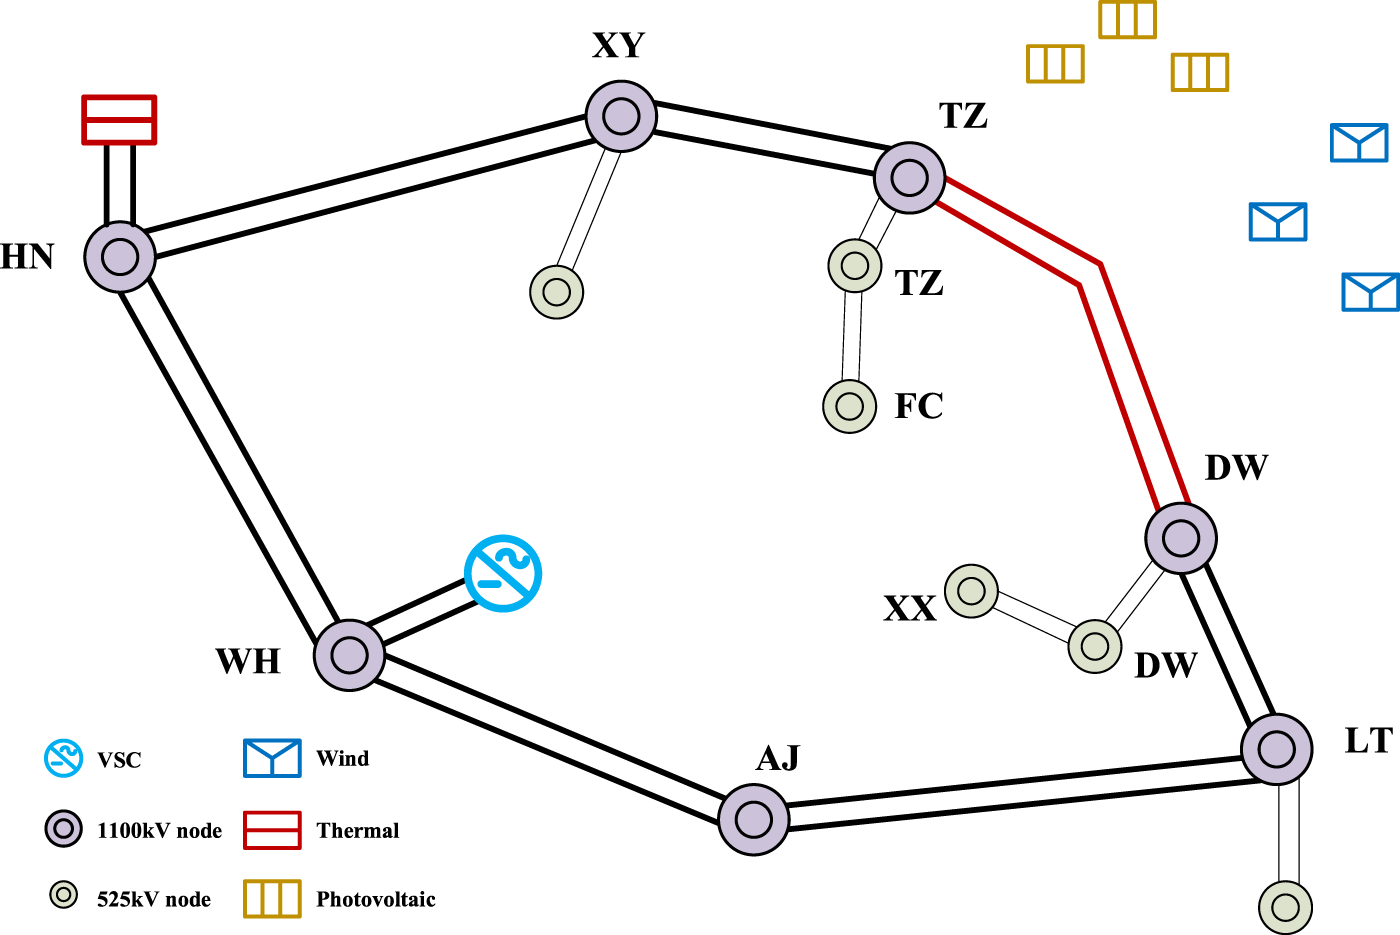
Figure 4: The East China Grid (Partial) 2040 planning wiring diagram.
5.1 Analysis of Power Flow Control Effects
The original power flow of the TZ-DW UHV AC line before retrofitting is +2330.6 × 2 MW, where the positive sign indicates the flow direction from TZ to DW, with a load rate of approximately 12.82%.
After the retrofitting in Scheme I, 3000 MW of power is injected from the renewable energy terminal. The line power from the injection point bus (newly added substation) to the DW substation is +3040.6 × 2 MW (the sign indicates the flow direction from the newly added substation to the DW substation), and the line power from the newly added substation to the TZ substation is −1589.0 × 2 MW (the sign indicates the flow direction from the TZ substation to the newly added substation), even resulting in a reverse power flow. The total active power flow from TZ to DW is 2903.2 MW, which is lower than the original power flow.
Overall, the retrofitting in Scheme I can only achieve the grid integration of renewable energy power but fails to enhance the utilization rate of the TZ-DW UHV AC line.
Assume that the capacity of the converter at the DW substation side is 9000 MVA, and the capacity of the converter at the TZ substation side is 7000 MVA (considering the DC line losses and reactive power requirements, a power margin of 1000 MVA is reserved). When the active power reference value of the converter at the DW substation side is set to its maximum of 9000 MW, the DW converter absorbs 6650.9 MW of active power from the AC grid. The power flow of the unretrofitted TZ-DW UHV AC line is −988.6 MW, flowing from DW to TZ, and the total active power flow from TZ to DW is 8011.4 MW.
Furthermore, a simulation analysis of the power flow control capability of the VSC-HVDC system in Scheme II is conducted, and the power flow control effect of Scheme II is obtained as shown in Fig. 5.
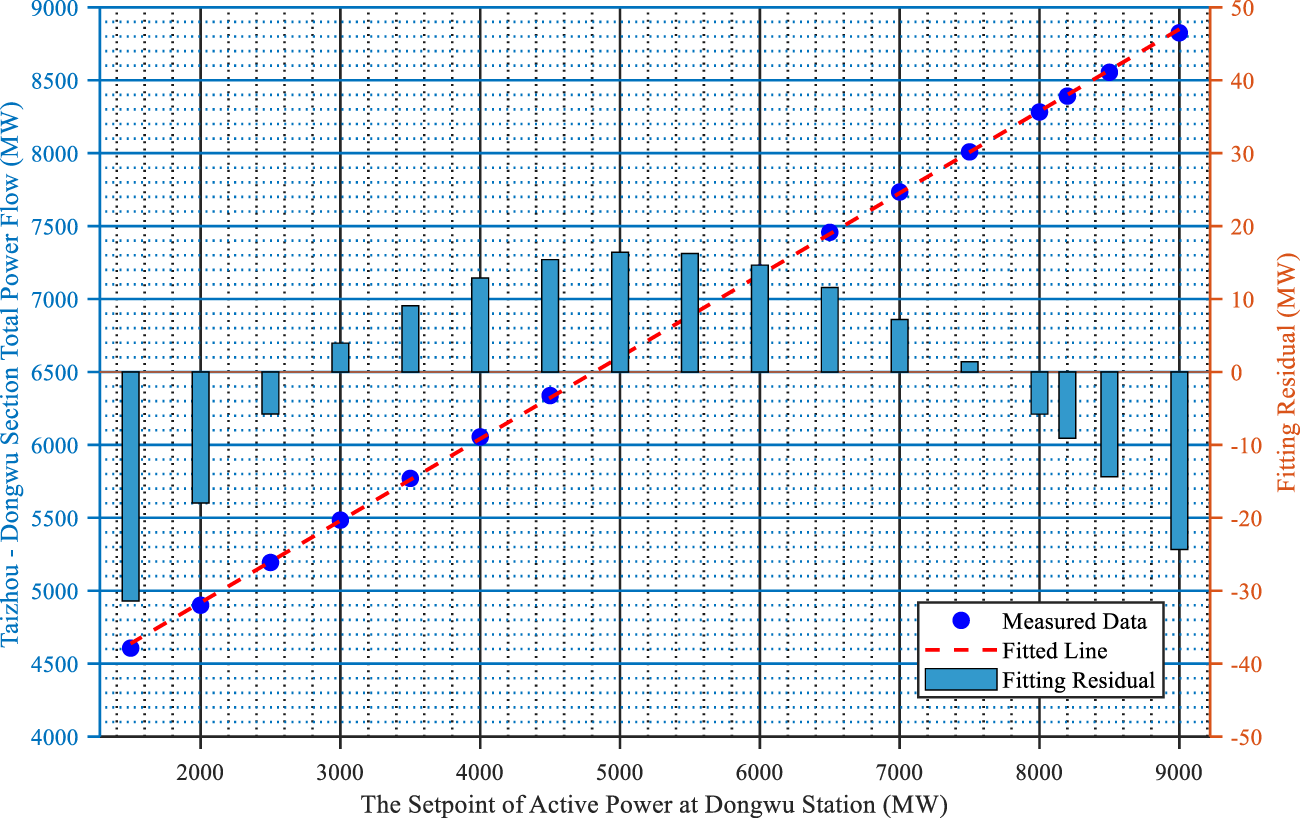
Figure 5: Power flow control effect diagram using scheme II.
As can be seen from Fig. 5, the relationship between the active power command value of the DW converter station and the total power flow of the TZ-DW UHV line can be approximated as a linear function, and its fitted equation is:
The mean absolute residual and the maximum absolute residual are 12.7939 and 31.3992 MW, respectively, and the residual standard deviation is 15.1947 MW. This is consistent with the relevant derivation in Section 3.3.2.
When the active power reference value of the converter at the DW substation side is set to its maximum of 9000 MW, the DW converter absorbs 6650.9 MW of active power from the AC grid, flowing from DW to TZ, and the total active power flow from TZ to DW is 9000 MW. The total power flow of the TZ-DW UHV line is entirely dictated by the active power command value of the DW converter station.
Further increasing the active power reference value of the converter at the DW substation side under the existing grid conditions, when the active power command of the DW station is set to approximately 10,000 MW, the system power flow fails to converge. This is mainly limited by the insufficient capacity of the 1100 to 525 kV step-down transmission corridor. This reveals a critical system constraint: while the full double-circuit VSC-HVDC transformation massively increases the transmission capability from TZ to DW at the UHV level (e.g., 1100 kV), the actual power deliverability is bottlenecked by the step-down capacity at the receiving end. The massive power influx must be stepped down through transformers to 500 and 220 kV networks to supply local loads. Once the newly added UHV transmission volume exceeds the thermal limits of these receiving-end transformers or lower-voltage distribution lines, power flow divergence occurs.
To address this bottleneck, a staggered grid reinforcement strategy is proposed. In practical grid engineering, the difficulty, environmental constraints, and capital costs of retrofitting UHV cross-regional corridors are significantly higher than upgrading local substations. Therefore, the optimal planning strategy is to fully maximize the UHV corridor’s capacity in one-time retrofit project, deliberately creating a transmission margin designed for the next 20 to 50 years. Subsequently, as the regional load demand naturally grows, the grid operators can progressively upgrade the receiving-end step-down substations—such as installing higher-capacity transformers and expanding 525 and 220 kV outgoing feeders. This phased approach ensures that the high-cost UHV infrastructure is future-proofed, while local distribution networks are upgraded economically in tandem with actual load growth.
5.2 Analysis of Voltage Stability Effects
5.2.1 Calculation of Static Voltage Stability Index
A simulation analysis is conducted on the static voltage stability of the system under different retrofitting schemes. The static voltage characteristics of major nodes such as TZ and DW are shown in Table 2.
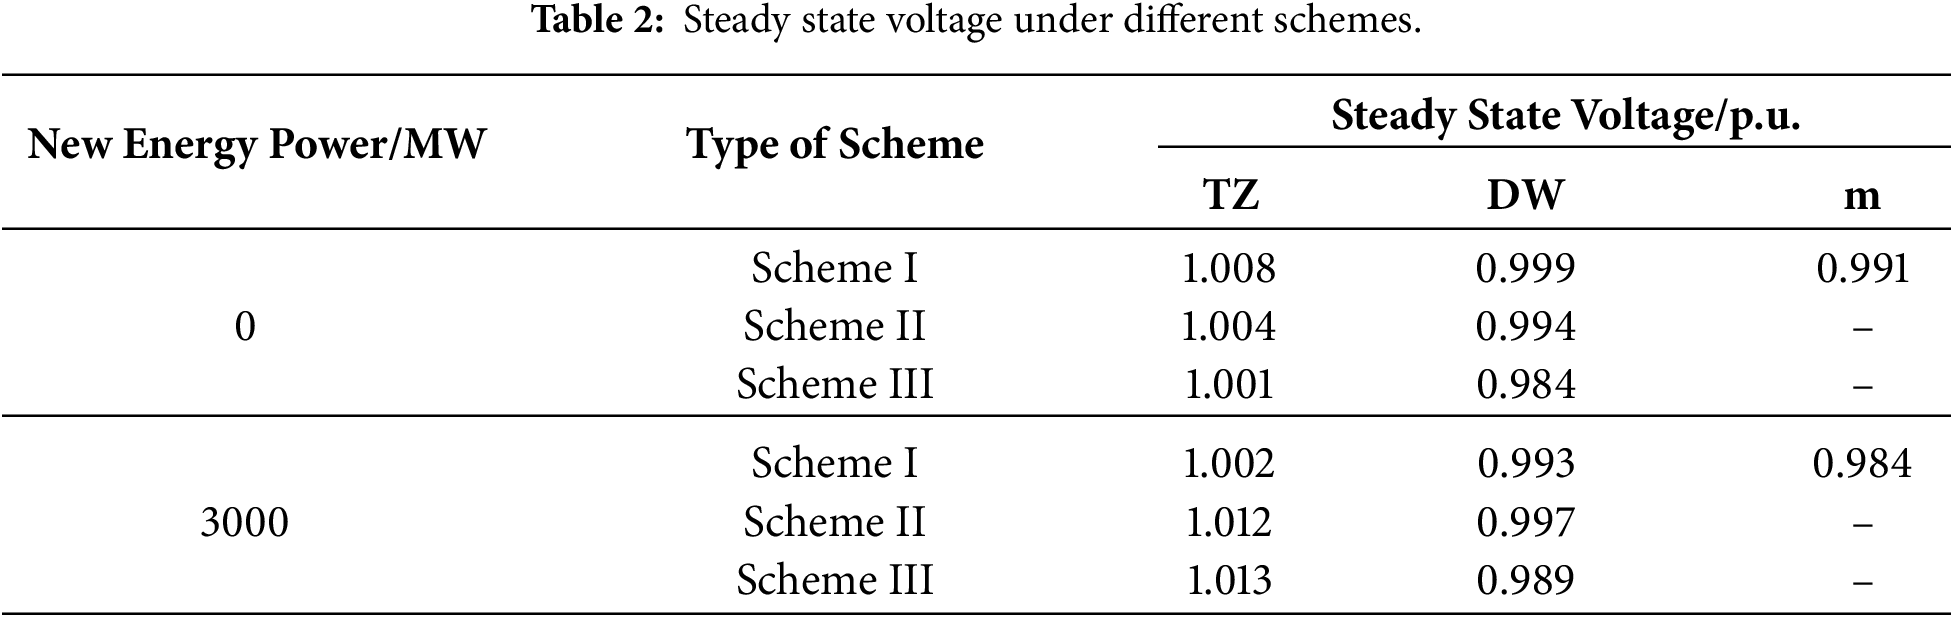
As can be seen from Table 2, under the three retrofitting schemes, the steady-state voltages of TZ, DW, and the newly added bus are all within a reasonable range (0.95–1.05 p.u.).
However, the static voltage at the DW node is relatively low. Combining with Eq. (37), further calculation shows that the static voltage stability indices of the three schemes at the DW station are 0.9940, 1.003, and 1.005, respectively. That is, under the AC retrofitting scheme, the smaller the grid-connected renewable energy power, the higher the static voltage at the Point of Common Coupling (PCC); under the DC retrofitting schemes, the larger the grid-connected renewable energy power, the higher the static voltage at the grid-connected converter bus.
It should be noted that the above analysis and calculations are all conducted under the condition that the converter adopts constant zero reactive power control. When the converter adopts constant AC voltage control, under the premise of not exceeding the capacity limit, the voltage at the PCC can be maintained at the desired target value, meaning the static voltage stability index is 1.
5.2.2 Transient Voltage Recovery
Setting an N-1 contingency (three-phase metallic grounding fault) on the TZ-FC 525 kV double-circuit lines at the FC side, the voltage recovery of the TZ 525 kV bus is shown in Fig. 6. The transient voltage recovery times of the main relevant nodes under different retrofitting schemes are shown in Fig. 7. Setting an N-1 contingency on the DW-XX 525 kV double-circuit lines at the DW side, the transient voltage recovery times of the main relevant nodes under different retrofitting schemes are shown in Fig. 8.
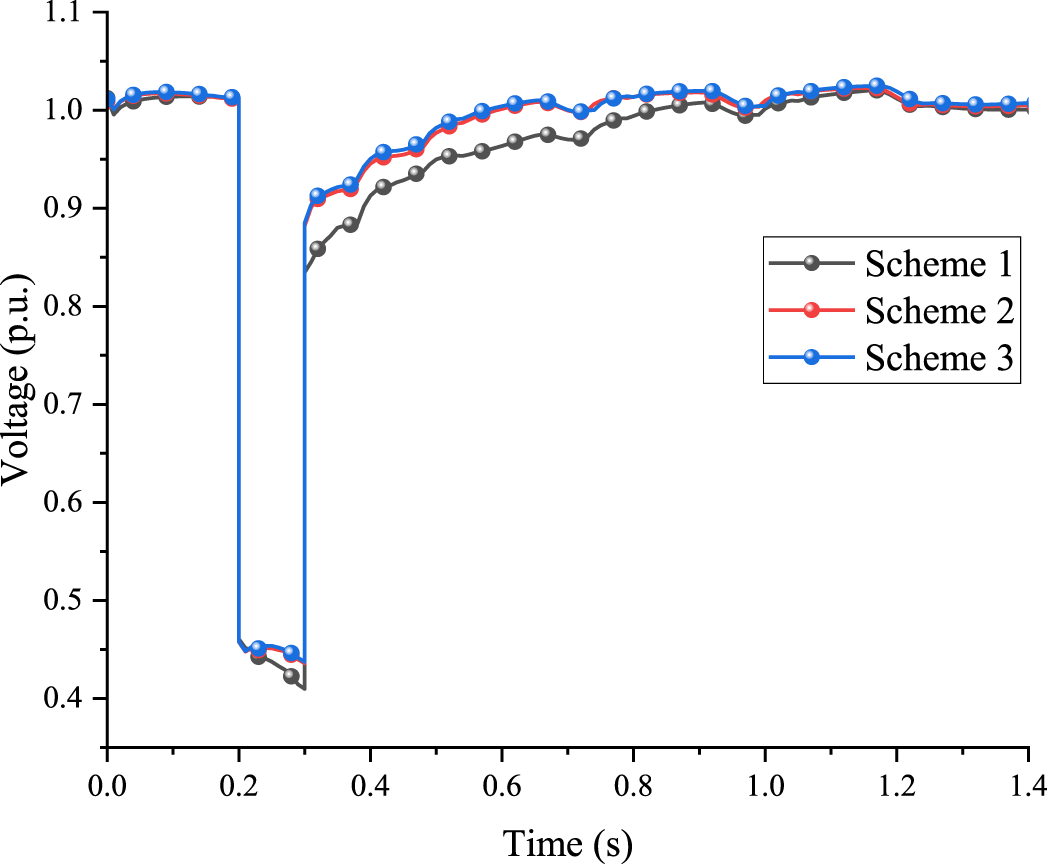
Figure 6: Voltage variation timing diagram of TZ 525 kV bus.
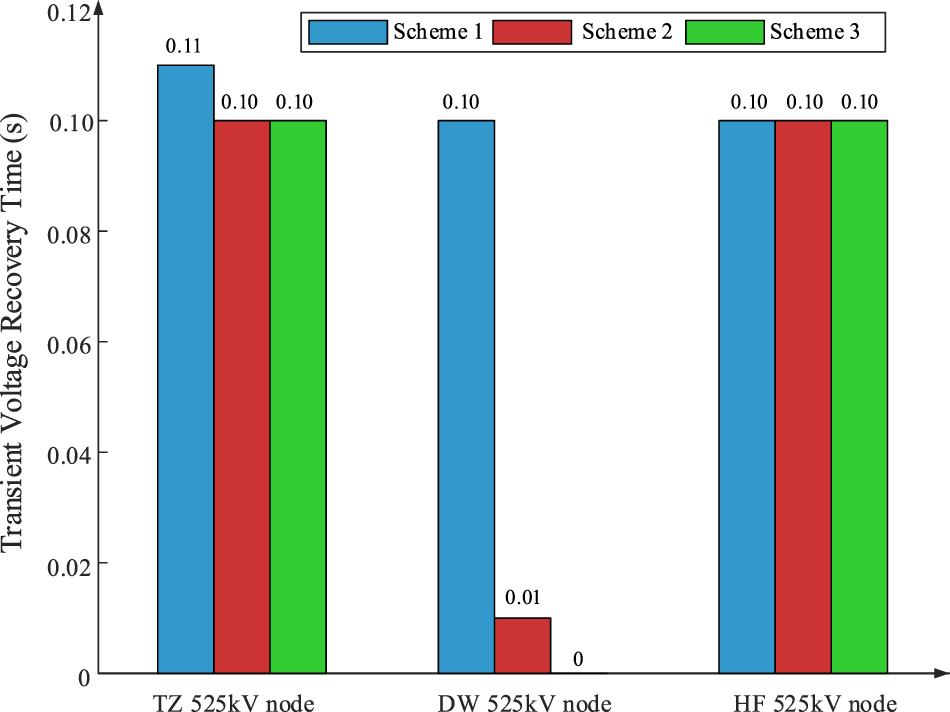
Figure 7: Comparison chart of transient voltage recovery times at certain nodes under different schemes with TZ-FC fault.
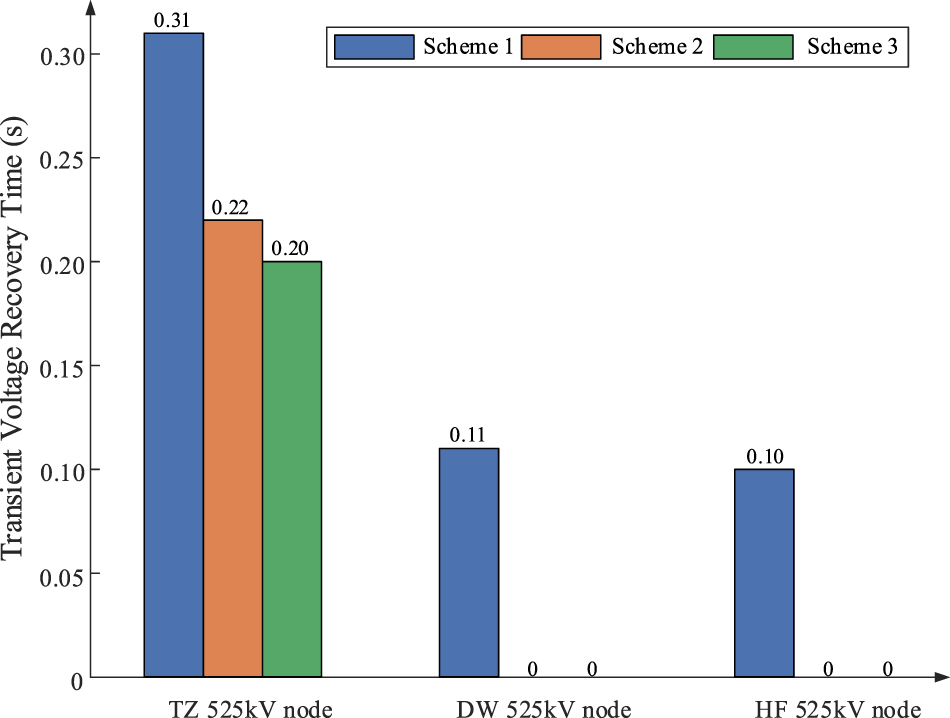
Figure 8: Comparison chart of transient voltage recovery times at certain nodes under different schemes with DW-XX fault.
As can be seen from Figs. 6–8, the transient voltage recovery times of the nodes in Scheme II and Scheme III are relatively short and show little difference. It should be noted that a transient voltage recovery time of 0 indicates that during the fault and the fault recovery process, the voltage of this node remains consistently higher than 0.95 p.u.
5.3 Short-Circuit Current Level
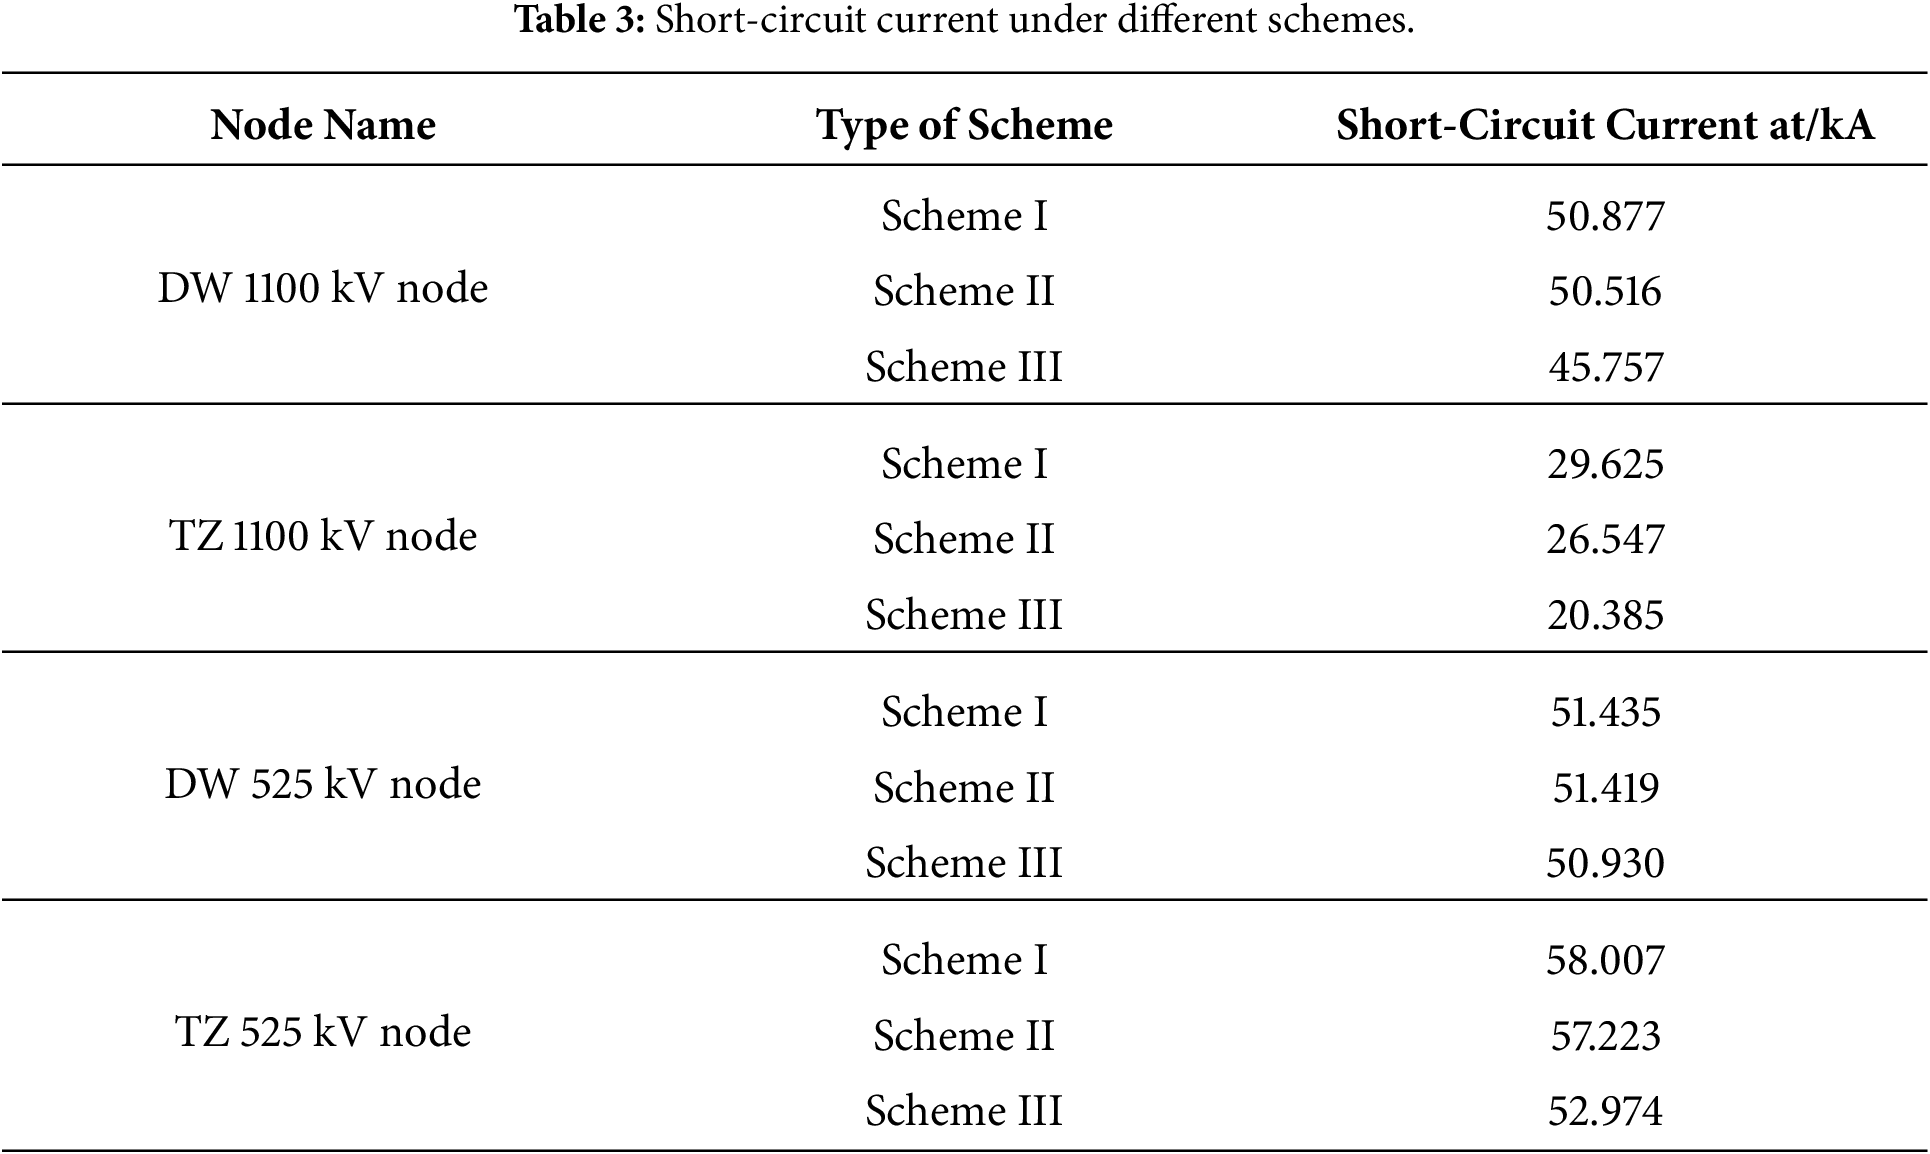
The calculation results of the three-phase short-circuit currents for selected buses under different retrofitting schemes are shown in Table 3. As can be seen from Table 3, under all three retrofitting schemes, the short-circuit currents do not exceed the breaking current limit of the circuit breakers, which is 63 kA. Because Scheme III adopts the full VSC-HVDC mode, its short-circuit current level is the lowest.
Aiming at the bottlenecks faced by traditional UHV AC transmission in outward transmission scenarios of high-proportion renewable energy, such as low corridor utilization rates, difficulty in power flow regulation, and excessive short-circuit currents, this paper proposes three UHV AC corridor retrofitting schemes and conducts rigorous theoretical derivations and simulation evaluations based on the 2040 planning data of the East China Grid.
The main conclusions are as follows:
(1) Traditional direct AC integration of renewable energy is highly prone to causing physical congestion and cannot adapt to the requirements of active regulation. Both theory and simulation indicate that under this scheme, the corridor power flow distribution passively depends on the natural impedance of the network. It not only fails to effectively enhance the utilization rate of the original UHV lines but is also prone to causing local reverse power flows. Meanwhile, strengthening AC interconnections further pushes up the short-circuit current of the system, posing a risk of equipment limit violations.
(2) The single-circuit VSC-HVDC retrofitting provides a certain degree of flexibility but has physical limitations. Although adopting the “AC-DC parallel” structure can introduce active control variables, constrained by the electrical coupling of the parallel AC branches, the power extracted by the DC corridor experiences a “shunting effect.”
(3) The double-circuit full VSC-HVDC retrofitting (Scheme III) is the optimal path to achieve highly efficient renewable energy integration and robust grid operation. This scheme completely severs the AC connections at both ends of the UHV corridor, achieving 100% physical decoupling and global controllability between the transmission power and the grid’s natural parameters. Evaluation results show that Scheme III not only perfectly solves the problem of low corridor utilization but also significantly suppresses the system’s short-circuit current due to the nonlinear high-impedance characteristics of the VSC-HVDC. Furthermore, it releases reactive power during faults to enhance the transient voltage recovery and dynamic support capabilities of the AC grid.
6.1 Qualitative Economic Assessment of Retrofitting Scheme III
While this paper primarily focuses on the technical superiority of the retrofitting schemes, economic feasibility is a crucial determinant for practical engineering applications. Undoubtedly, Scheme III requires the highest initial capital expenditure due to the installation of large-capacity converter stations and associated DC equipment. However, the high costs of Scheme III can be economically justified under specific application scenarios and modern electricity market frameworks.
Firstly, in scenarios with extremely high renewable energy penetration, the existing AC corridors often face severe transmission bottlenecks, leading to massive renewable energy curtailment. The superior power flow capacity of Scheme III can drastically reduce this curtailment, translating the previously wasted clean energy into direct economic revenue.
Secondly, with the continuous development of auxiliary service markets, the advanced control capabilities of VSC-HVDC systems—such as active power flow routing, dynamic reactive power/voltage support, and fast frequency response—can be monetized. Grid operators utilizing Scheme III can participate in these auxiliary markets to obtain substantial long-term economic compensation. Therefore, when factoring in the comprehensive benefits of enhanced renewable integration and auxiliary service revenues, the long-term return on investment of Scheme III is highly promising, particularly for heavily loaded cross-regional transmission corridors.
6.2 Policy and Planning Recommendations
Based on the quantitative evaluations and technical findings of this study, several policy and planning recommendations are proposed to facilitate the sustainable development of high-proportion renewable energy power systems:
(1) Shift in Grid Planning Paradigm: Policymakers and grid operators are advised to adjust traditional grid expansion strategies. Instead of relying solely on acquiring new right-of-ways for transmission lines—which is becoming increasingly difficult—policies should prioritize and incentivize the retrofitting of existing underutilized UHV AC corridors into VSC-HVDC systems to maximize asset utilization.
(2) Market Incentive Mechanisms: The high initial investment of VSC-HVDC retrofitting requires rational cost-recovery channels. It is recommended that energy regulators establish or refine auxiliary service markets. Such markets should financially reward the newly upgraded DC systems for their advanced capabilities, such as active power flow congestion relief, dynamic reactive power support, and short-circuit current suppression, thereby improving the economic feasibility of retrofitting projects.
(3) Standardization of Retrofitting Technologies: Government energy departments and industry committees are recommended to accelerate the formulation of standardized technical guidelines for AC-to-DC grid upgrades. Establishing unified standards for progressive retrofitting schemes will provide crucial regulatory support for future large-scale engineering applications.
6.3 Limitation and Future Direction of the Study
While this paper provides a comprehensive steady-state analysis and evaluation of UHV AC retrofitting schemes, certain limitations remain. First, the current mathematical models and evaluations primarily focus on steady-state power flow distributions and use a relatively long simulation step size, without deeply addressing the complex electromagnetic transient (EMT) dynamics. Second, the detailed technoeconomic feasibility, including the full life-cycle cost-benefit analysis of the VSC-HVDC equipment, was simplified in this technical evaluation.
Therefore, future research directions will focus on two main aspects: (1) conducting detailed EMT simulations to investigate the transient stability, fault ride-through capabilities, and sub-synchronous oscillation risks of the retrofitted hybrid AC/DC ring grids under high-penetration renewable scenarios; and (2) developing coordinated control strategies for multiple VSC-HVDC corridors to optimize both the dynamic resilience and economic efficiency of the future power system.
Acknowledgement: The authors would like to express their sincere gratitude to State Grid Jiangsu Electric Power Co., Ltd. for the generous support for this research.
Funding Statement: This research was funded by Science and Technology Project of the State Grid Electric Power Co., Ltd. Grant number J2024157.
Author Contributions: Conceptualization, Ying Huang; Data curation, Wentao Sun; Formal analysis, Ying Huang; Investigation, Hui Cai; Methodology, Keheng Lou; Project administration, Hui Cai; Resources, Xingning Han; Software, Guoteng Wang and Keheng Lou; Validation, Wanchun Qi; Visualization, Wentao Sun; Writing—original draft, Keheng Lou; Writing—review & editing, Hui Cai and Xingning Han. All authors reviewed and approved the final version of the manuscript.
Availability of Data and Materials: The data presented in this study are included in the article. Further inquiries can be directed to the corresponding author.
Ethics Approval: Not applicable.
Conflicts of Interest: The authors declare no conflicts of interest.
References
1. Shair J, Li H, Hu J, Xie X. Power system stability issues, classifications and research prospects in the context of high-penetration of renewables and power electronics. Renew Sustain Energy Rev. 2021;145:111111. doi:10.1016/j.rser.2021.111111. [Google Scholar] [CrossRef]
2. Chen M, Zhang C, Chen C, Li J, Cui W. Main pathways of carbon reduction in cities under the target of carbon peaking: a case study of Nanjing, China. Sustainability. 2023;15(11):8917. doi:10.3390/su15118917. [Google Scholar] [CrossRef]
3. Fernández-Pérez JC, Echavarren Cerezo FM, Rouco Rodríguez L. Linear power flow algorithm with losses for multi-terminal VSC AC/DC power systems. IEEE Trans Power Syst. 2022;37(3):1739–49. doi:10.1109/TPWRS.2021.3114660. [Google Scholar] [CrossRef]
4. Guo C, Xu L, Yang S, Jiang W. A supplementary damping control for MMC-HVDC system to mitigate the low-frequency oscillation under low inertia condition. IEEE Trans Power Deliv. 2023;38(1):287–98. doi:10.1109/TPWRD.2022.3186940. [Google Scholar] [CrossRef]
5. Bhukya BN, Chinda PR, Rayapudi SR, Bondalapati SR. Congestion management of power transmission line with advanced interline power flow controller. J Mechatron Electr Power Veh Technol. 2025;16(1):52–68. doi:10.55981/j.mev.2025.795. [Google Scholar] [CrossRef]
6. Wang Y, An Z, Peng L. Research on the impact of the interaction between renewable energy and loads on the voltage characteristics of receiving-end grids and control strategies. Electronics. 2024;13(24):4923. doi:10.3390/electronics13244923. [Google Scholar] [CrossRef]
7. Wang Y, Zhen J, Pan H. Ultra-high-voltage construction projects and total factor energy efficiency: empirical evidence on cross-regional power dispatch in China. Sustainability. 2024;16(18):8083. doi:10.3390/su16188083. [Google Scholar] [CrossRef]
8. Normandia Lourenço LF, Iovine A, Damm G, Filho AJS. Nonlinear controller for MMC-HVdc operating in grid-forming mode. IEEE Trans Contr Syst Technol. 2025;33(1):229–44. doi:10.1109/tcst.2024.3467808. [Google Scholar] [CrossRef]
9. Yan M, Huang Y, Wang G, Cai H. Power flow coupling characteristics analysis and coordinated optimization strategy for AC/DC hybrid transmission sections. Electronics. 2026;15(1):66. doi:10.3390/electronics15010066. [Google Scholar] [CrossRef]
10. Tian P, Jin Y, Xie N, Wang C, Huang C. Power flow calculation for VSC-based AC/DC hybrid systems based on fast and flexible holomorphic embedding. J Mod Power Syst Clean Energy. 2024;12(5):1370–82. doi:10.35833/mpce.2024.000185. [Google Scholar] [CrossRef]
11. Nazir M, Enslin JH, McCalley J, Hines E. Multi-terminal HVDC networks for offshore energy integration: technical challenges and grid interfacing strategies. Energies. 2025;18(24):6383. doi:10.3390/en18246383. [Google Scholar] [CrossRef]
12. Xie Q, Huang Y, Cai H, Wang G, Dou F, Sun W. Embedded HVDC system planning methods for typical scenarios in regional power grids. Electronics. 2025;14(16):3292. doi:10.3390/electronics14163292. [Google Scholar] [CrossRef]
13. Faria da Silva F, Irnawan R, Mochamad RF, Zhang Z, Zhang Q. Power-flow for Archipelago-based multi-terminal HVDC grids. Electr Power Syst Res. 2024;231(4):110274. doi:10.1016/j.epsr.2024.110274. [Google Scholar] [CrossRef]
14. Sun P, Wu R, Shen Z, Li G, Khalid M, Town G, et al. Sequential power flow algorithm and post-event steady-state power distribution analysis in hybrid AC/MT-MVDC systems. Int J Electr Power Energy Syst. 2024;157(6):109828. doi:10.1016/j.ijepes.2024.109828. [Google Scholar] [CrossRef]
15. Ai C, Li Y, Li C, Yang Y, Kim M, Liu J. Grid-forming capability transfer and active power flow control in a VSC-HVDC system. In: Proceedings of the 2024 IEEE 10th International Power Electronics and Motion Control Conference (IPEMC2024-ECCE Asia); 2024 May 17–20; Chengdu, China. New York, NY, USA: IEEE; 2024. p. 591–6. doi:10.1109/IPEMC-ECCEAsia60879.2024.10567090. [Google Scholar] [CrossRef]
16. Alajrash BH, Salem M, Swadi M, Senjyu T, Kamarol M, Motahhir S. A comprehensive review of FACTS devices in modern power systems: addressing power quality, optimal placement, and stability with renewable energy penetration. Energy Rep. 2024;11(1):5350–71. doi:10.1016/j.egyr.2024.05.011. [Google Scholar] [CrossRef]
17. Manickam R, Palaniappan SN. Upgrading transmission line capability by AC-DC conversion. Comput Electr Eng. 2018;68(7):616–28. doi:10.1016/j.compeleceng.2018.01.031. [Google Scholar] [CrossRef]
18. Awad H, Bayoumi EHE. Resilient grid architectures for high renewable penetration: electrical engineering strategies for 2030 and beyond. Technologies. 2026;14(2):112. doi:10.3390/technologies14020112. [Google Scholar] [CrossRef]
19. Guo J, Zou L, Zhang N, Jia Y, Pan X, Sun X. Coordinated active and reactive power control of VSC-HVDC for enhancing static voltage stability in AC/DC systems. Energies. 2025;18(23):6127. doi:10.3390/en18236127. [Google Scholar] [CrossRef]
20. Zhang Z, Lee J, Jang G. Improved control strategy of MMC-HVDC to improve frequency support of AC system. Appl Sci. 2020;10(20):7282. doi:10.3390/app10207282. [Google Scholar] [CrossRef]
21. Renedo J, García-Cerrada A, Rouco L, Sigrist L. Coordinated control in VSC-HVDC multi-terminal systems to improve transient stability: the impact of communication latency. Energies. 2019;12(19):3638. doi:10.3390/en12193638. [Google Scholar] [CrossRef]
22. Wang X, Chen Z, Zhang Y, Jiang Q, Li B, He Y, et al. The short-circuit fault current impact mechanism and adaptive control strategy of an MMC-HVDC. Processes. 2023;11(3):837. doi:10.3390/pr11030837. [Google Scholar] [CrossRef]
23. Li J, Xie Y, Wu G, Xiao M, Wang G, Lou K, et al. Planning and evaluation method of MMC-MTEDC network construction of urban power grid. Energy Eng. 2025;122(11):4475–95. doi:10.32604/ee.2025.068711. [Google Scholar] [CrossRef]
Cite This Article
 Copyright © 2026 The Author(s). Published by Tech Science Press.
This work is licensed under a Creative Commons Attribution 4.0 International License , which permits unrestricted use, distribution, and reproduction in any medium, provided the original work is properly cited.
 Downloads
 Citation Tools
