
 Login
Login Register
 Submit a Paper
 Propose a Special lssue
 Open Access
ARTICLE
Modelling and Simulation of Partial Shading Impacts on Grid-Tied Photovoltaic Chains
1 Laboratory of Sciences and Technologies of Information and Communication (STIC), Physics Department, Faculty of Sciences, Chouaib Doukkali University, El Jadida, Morocco
2 Instrumentation and Control Laboratory, CREATE, Department of Mechatronics Engineering, University of Évora, Évora, Portugal
* Corresponding Author: Said Dlimi. Email:
(This article belongs to the Special Issue: Advances in Clean Energy Technologies for a Sustainable Future)
Energy Engineering 2026, 123(11), 9 https://doi.org/10.32604/ee.2026.085033
Received 04 May 2026; Accepted 12 June 2026; Issue published 24 September 2026
 View Full Text
 Download PDF
Abstract
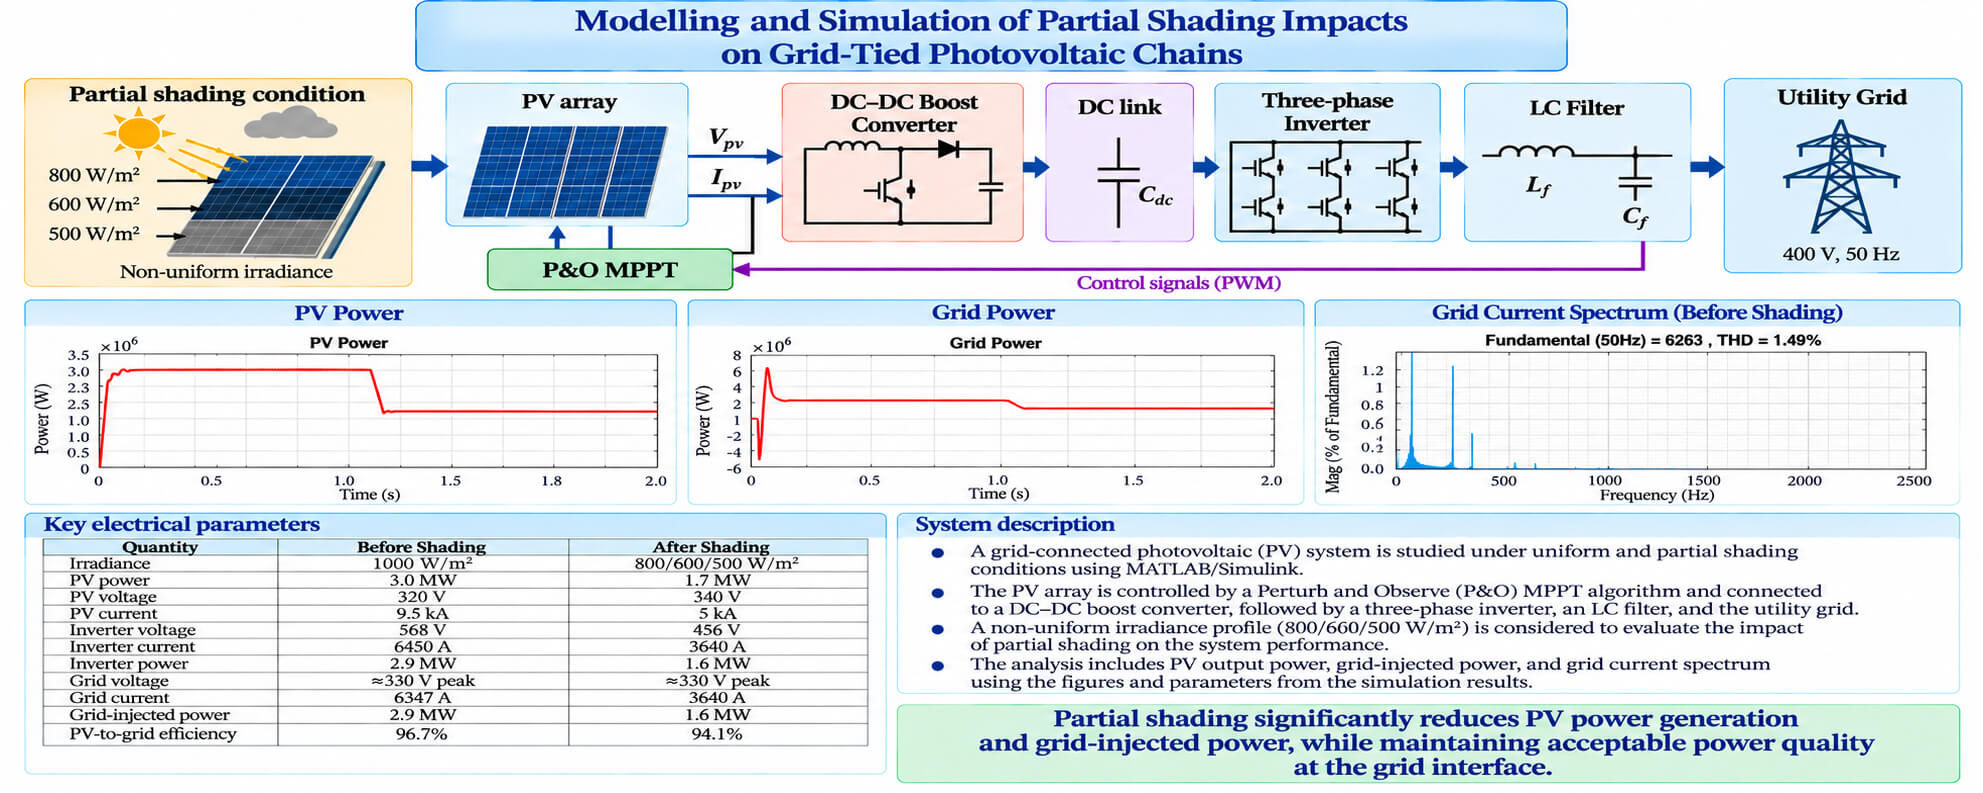
The increasing deployment of grid-connected photovoltaic (PV) systems has made solar energy one of the most promising renewable energy sources for achieving a sustainable and low-carbon energy future. However, the performance of PV systems is strongly influenced by environmental conditions, particularly partial shading caused by clouds, nearby buildings, trees, or other obstacles. Partial shading can lead to significant power losses, reduced energy yield, and potential degradation of system performance. Therefore, evaluating the behavior of PV systems under such operating conditions is essential for improving their reliability and efficiency. This paper presents an analysis of the performance of a grid-connected photovoltaic (PV) system under partial shading conditions using MATLAB/Simulink. The studied system consists of a PV array, a Perturb and Observe (P&O) maximum power point tracking (MPPT) controller, a DC–DC boost converter, a three-phase inverter, a grid-side filter, and the utility grid. The system is first simulated under uniform irradiance conditions of 1000 W/m2 and then under a multi-zone partial shading scenario with irradiance levels of 800, 600, and 500 W/m2. The simulation results indicate that the PV output power decreases from approximately 3.0 to 1.7 MW, representing a reduction of about 43.3%. Similarly, the power injected into the grid decreases from 2.9 to 1.6 MW, while the overall PV-to-grid efficiency drops from 96.7% to 94.1%. Furthermore, the total harmonic distortion (THD) of the grid current remains low, decreasing from 1.49% to 0.45%, which is well below the 5% limit specified by the IEEE 519 standard. These findings confirm that partial shading significantly reduces PV power generation and grid-injected power while maintaining acceptable power quality at the grid interface.Graphic Abstract
Keywords
The solar photovoltaic (PV) generation is increasingly integrated into modern power grids, it brings several technical challenges, with partial shading conditions (PSCs) ranking among the most significant [1]. Partial shading occurs when elements such as buildings, trees, passing clouds, dust deposits, or nearby structures obstruct sunlight, leading to uneven irradiance across PV modules. This non-uniformity can substantially reduce output power, intensify mismatch losses, and impair the overall reliability and efficiency of PV systems [2–5]. Unlike uniform shading, PSCs produce complex operating behavior featuring multiple local maximum power points (LMPPs), which complicates the search for the global maximum power point (GMPP) and increases the likelihood of hotspot formation and consequent damage to PV cells [6].
Partial shading significantly alters the electrical behavior of photovoltaic systems. It affects output current and voltage, reduces the available power, and can lower the quality of the energy delivered to the grid [7]. Numerous studies indicate that the resulting power loss is not directly proportional to the shaded area, but rather depends by factors such as how the shade is distributed, the physical layout of the modules, the electrical interconnection scheme, and the arrangement of bypass diodes [8]. For example, shading a single cell can cut the array power by almost half, while pronounced nonuniform shading may reduce total production by more than 90% [6]. Partial shading can also force cells into reverse bias and trigger localized heating. Hotspots may reach temperatures near 400°C, which accelerates module aging and shortens the overall system lifetime [9].
Several approaches have been proposed to mitigate these issues. Hardware solutions, including bypass diodes, microinverters, and power optimizers, help limit hotspot formation and enhance power harvesting under nonuniform irradiance [10]. However, increasing the number of bypass diodes can shift the location of the maximum power point and make MPPT control more challenging [8]. Another approach focuses on reconfiguring PV arrays by rearranging modules, either physically or electrically, to distribute shading more evenly and limit mismatch losses [2,11,12]. These strategies are commonly categorized as physical, electrical, or hybrid. In addition, alternative interconnection layouts such as total cross-tied (TCT), bridge-linked (BL), honeycomb (HC), and hybrid schemes have shown superior performance under partial shading compared with the conventional series-parallel (SP) structure [1,13,14].
The chosen interconnection topology strongly influences how resilient a PV system is to partial shading. In many cases, TCT arrangements deliver higher output than standard SP layouts across varied shading patterns, although SP remains appealing for its simplicity and lower wiring costs [6,14]. Hybrid interconnections have also produced promising results for maximizing energy extraction under severe and irregular shading conditions [15].
Partial shading generate to a highly nonlinear power-voltage (P-V) curve with several local maxima, which reduces the effectiveness of conventional MPPT methods in locating the global maximum power point [16]. To overcome this limitation, several advanced MPPT methods based on metaheuristic optimization algorithms such as Grey Wolf Optimizer (GWO), Harris Hawks Optimization (HHO), and Water Cycle Algorithm (WCA), as well as artificial neural networks (ANNs), have recently been proposed to improve tracking accuracy and robustness under complex shading conditions [16,17]. Furthermore, hybrid and adaptive MPPT strategies have been introduced to enhance power extraction efficiency and reduce tracking oscillations under rapidly varying irradiance profiles [18].
Partial shading not only decreases the energy yield of PV systems but also affects their operational stability, reliability, and lifetime [19]. Dynamic shading conditions have been shown to affect series-connected and parallel-connected arrays more severely than multi-string configurations [20]. Recent research efforts have focused on intelligent reconfiguration methods, advanced diagnostics, adaptive control strategies, and optimization algorithms to ensure stable and reliable operation of grid-connected PV systems in complex urban environments [17,21]. In parallel, techno-economic evaluations and sustainability analyses are increasingly considered essential for the large-scale integration of photovoltaic systems into modern electrical grids [22].
Despite the considerable progress achieved in the analysis of photovoltaic systems under partial shading conditions, several existing studies mainly focus either on standalone PV systems, MPPT optimization techniques, or static power loss evaluations. Moreover, many review-oriented investigations provide only qualitative comparisons without simultaneously analyzing the combined effects of partial shading on the entire grid-connected conversion chain, including PV array behavior, DC-DC conversion stage, inverter dynamics, and grid-side power quality performance. In addition, limited attention has been devoted to the simultaneous evaluation of mismatch losses, MPPT instability, and harmonic distortion under dynamically varying irradiance conditions.
The originality of this work lies in the development of a complete MATLAB/Simulink model of a grid-connected photovoltaic system operating under non-uniform irradiance conditions. Unlike previous studies mainly focused on PV-side analysis, the proposed approach simultaneously investigates the impact of partial shading on the DC-side electrical characteristics, inverter operation, injected grid current, and total harmonic distortion (THD). The study also highlights the nonlinear reduction of output power caused by mismatch effects and local maximum power point trapping under partial shading conditions.
The main contributions of this paper can be summarized as follows:
• Development of a detailed grid-connected PV system model including PV array, MPPT controller, DC-DC boost converter, inverter, and grid interface;
• Investigation of the influence of multiple partial shading irradiance levels on PV electrical performance;
• Analysis of current, voltage, power behavior, and mismatch losses under non-uniform irradiance conditions;
• Evaluation of inverter-side and grid-side electrical responses, including harmonic distortion behavior;
• Discussion of the operational limitations of the conventional Perturb and Observe (P&O) MPPT technique under partial shading conditions.
2 Modeling of the Photovoltaic System
The electrical behavior of a photovoltaic (PV) cell can be represented by an equivalent circuit composed of a photo-generated current source Iph, a diode representing the PN junction, a series resistance Rs modeling internal losses, and a shunt resistance Rsh representing leakage currents [23–25]. The single-diode model is widely used in photovoltaic system simulations due to its good compromise between modeling accuracy and computational simplicity. The equivalent circuit of the photovoltaic cell is illustrated in Fig. 1.
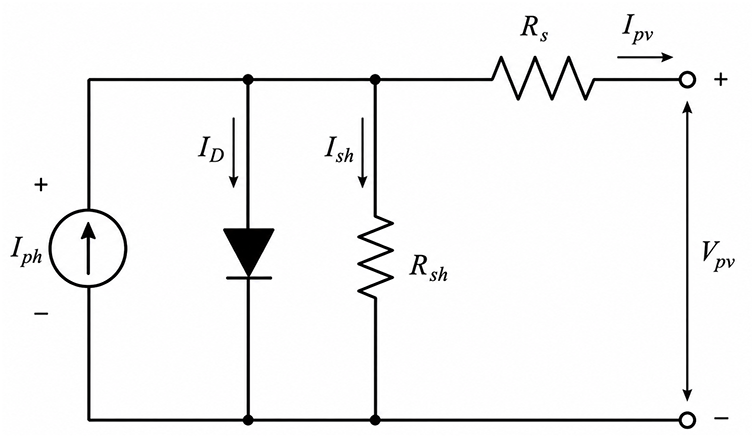
Figure 1: Electrical model of a photovoltaic cell.
The output current of the photovoltaic cell can be expressed by the general current balance equation given in Eq. (1):
where:
• Iph: photo-generated current depending on solar irradiance and cell temperature,
• ID: diode current.
• Ish: shunt resistance current.
The photo-generated current mainly depends on solar irradiance and cell temperature. It can be calculated using Eq. (2) [23,26]:
where:
• Isc: short-circuit current,
• Ki: temperature coefficient of the current,
• Tc: cell temperature,
• Tref: reference temperature,
• E: solar irradiance,
• Eref: reference irradiance under standard test conditions (STC).
The shunt resistance current Ish appearing in Eq. (1) is defined by Eq. (3):
The diode current Id, described by Shockley’s equation, is expressed by Eq. (4) [25]:
where:
•
• q: electron charge (1.6 × 10⁻¹⁹ C).
• K: Boltzmann constant (1.38 × 10⁻²³ J/K).
• B: diode ideality factor.
• Ns: number of cells connected in series.
• Vpv: output voltage of the PV cell.
• Rs and Rsh: series and shunt resistances, respectively.
The reverse saturation current of the diode I0 is calculated using Eq. (5):
where:
• Eg: semiconductor band-gap energy.
• Irs: reverse saturation current at reference temperature.
The reverse saturation current at reference conditions Irs is obtained using Eq. (6):
where:
• Voc: open-circuit voltage.
By substituting Eqs. (2)–(6) into the general current balance relation given by Eq. (1), the final nonlinear current-voltage characteristic of the photovoltaic cell is obtained as expressed in Eq. (7):
To verify the dimensional consistency of Eq. (7), only the argument of the exponential term needs to be checked. The numerator
This nonlinear equation accurately describes the electrical behavior of the photovoltaic cell under varying irradiance and temperature conditions. The inclusion of the series and shunt resistances allows a more realistic representation of conduction losses and leakage current effects compared with the ideal photovoltaic model.
The electrical parameters of the photovoltaic module used in the simulation are summarized in Table 1 [25]:
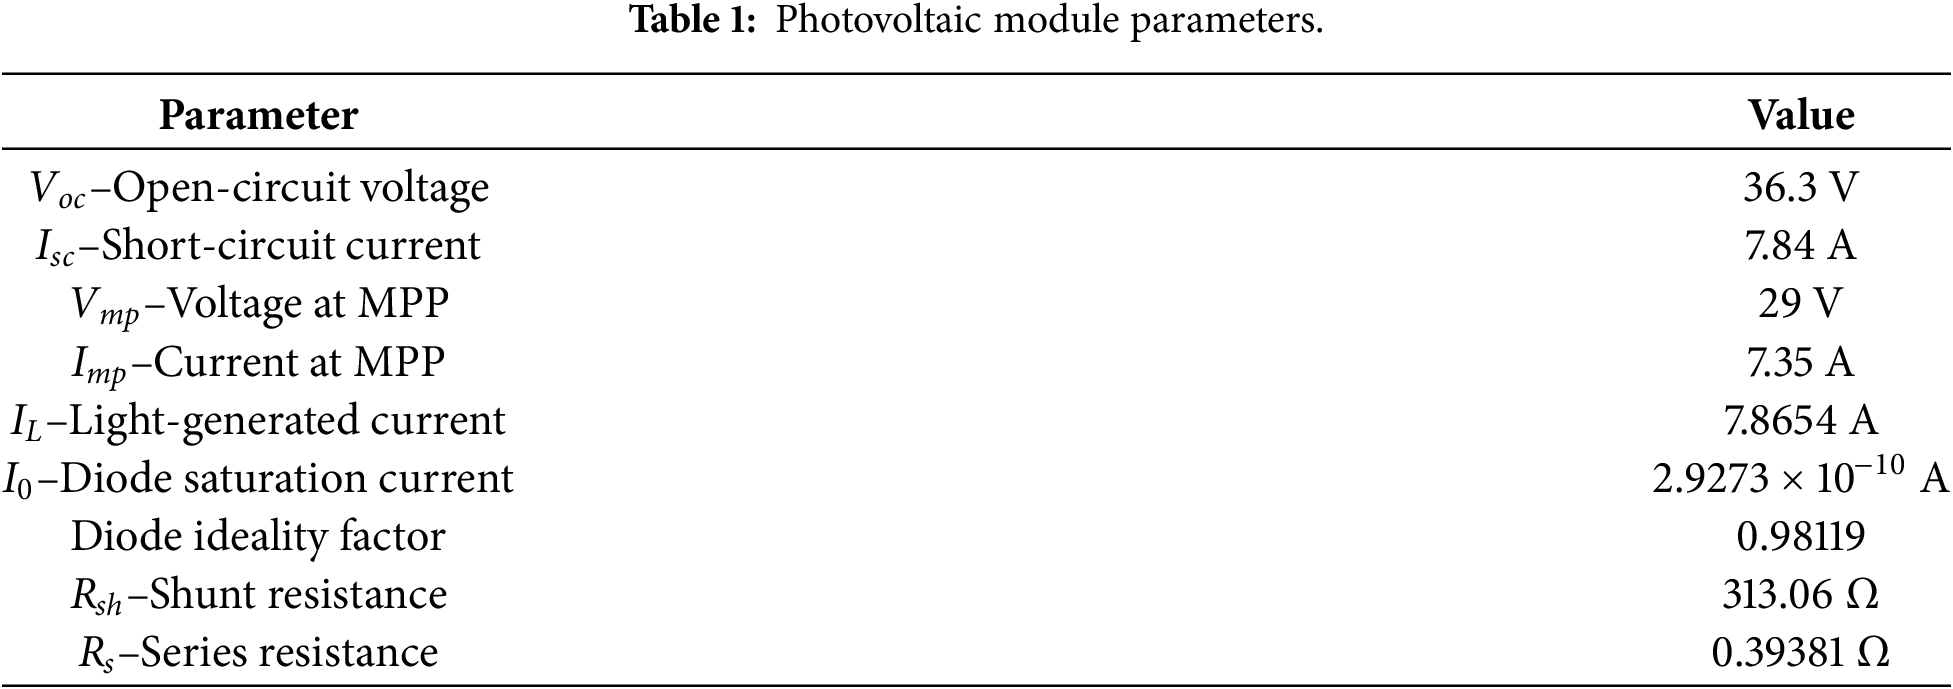
In practice, a photovoltaic generator is composed of several PV modules connected in series and parallel in order to obtain the required voltage and power levels.
In this work, the photovoltaic generator is divided into several PV arrays operating under different irradiance levels in order to reproduce realistic partial shading conditions. Each PV subsystem contains 650 parallel strings connected to identical photovoltaic modules rated at 213.15 W. Depending on the considered subsystem, the number of series-connected modules per string varies between 3 and 4 modules.
Based on the implemented MATLAB/Simulink model, the simulated PV generator is composed of 6 PV arrays. Each array contains 650 parallel strings. Two arrays include three series-connected modules per string, while four arrays include 4 series-connected modules per string. Therefore, the total number of PV modules is 14,300, corresponding to an installed PV power of approximately 3.05 MW under standard test conditions.
This configuration allows the simulation of non-uniform irradiance distributions and mismatch effects between PV groups subjected to different shading levels. The photovoltaic arrays are connected through bypass diodes to protect shaded modules against reverse bias operation and hotspot formation.
Under partial shading conditions, the irradiance applied to different PV groups varies between 1000, 800, 600, and 500 W/m2, which enables the investigation of the electrical behavior of the grid-connected PV system under non-uniform operating conditions.
Based on the module characteristics (Vmpp = 29 V, Impp = 7.35 A), the rated power of one PV module can be calculated as follows:
Considering that each photovoltaic subsystem contains 650 parallel strings composed of three or four series-connected modules, the total generated power becomes significantly high. The use of a large number of parallel branches considerably increases the output current, while the series connection increases the operating voltage. Consequently, the global photovoltaic field is capable of delivering power levels in the megawatt range. Under uniform irradiance conditions (1000 W/m2), the total generated power reaches approximately 3 MW, which corresponds to the combined contribution of all interconnected PV arrays operating simultaneously.
The use of multiple parallel strings significantly increases the generated current and enables megawatt-scale power production suitable for grid-connected applications. Moreover, the variation in the number of series-connected modules between subsystems introduces different voltage levels, thereby reproducing realistic mismatch phenomena observed in large-scale photovoltaic installations under partial shading conditions.
Since the output voltage of the PV arrays remains lower than the required DC-link voltage of the grid-connected inverter, a DC-DC boost converter associated with an MPPT controller is used to increase the PV voltage while ensuring maximum power extraction under varying irradiance conditions.
In the implemented model, the DC-link voltage reference is set to 700 V. The DC-DC boost converter and the three-phase inverter are controlled using PWM signals with a switching frequency of 10 kHz. The inverter is connected to a three-phase grid through an inductive filter, and the grid is modeled with a phase-to-phase RMS voltage of 400 V and a frequency of 50 Hz.
Partial shading of a photovoltaic (PV) installation leads to power loss, but this loss is generally not proportional to the shaded area. The system configuration, module location, irradiance distribution, bypass diode arrangement, and string topology strongly affect the energy loss, making it difficult to directly estimate the reduction in PV output power.
The power loss of a PV module under partial shading is not proportional to the shaded area. Some studies assume a proportional relationship, but this assumption is mainly valid for a single isolated cell. At the PV installation level, the power loss can be much higher than the shaded area ratio, especially in series-connected modules, where the shading of a single cell can significantly reduce the current of the entire string [26,27].
PV system performance is influenced by module type, electrical configuration, bypass diode placement, shade intensity, shade distribution, and string arrangement. Shading can be caused by dust accumulation, moving clouds, trees, buildings, or variations in the solar incidence angle, as shown in Fig. 2. These effects generate current and voltage mismatch losses between PV modules [27,28].
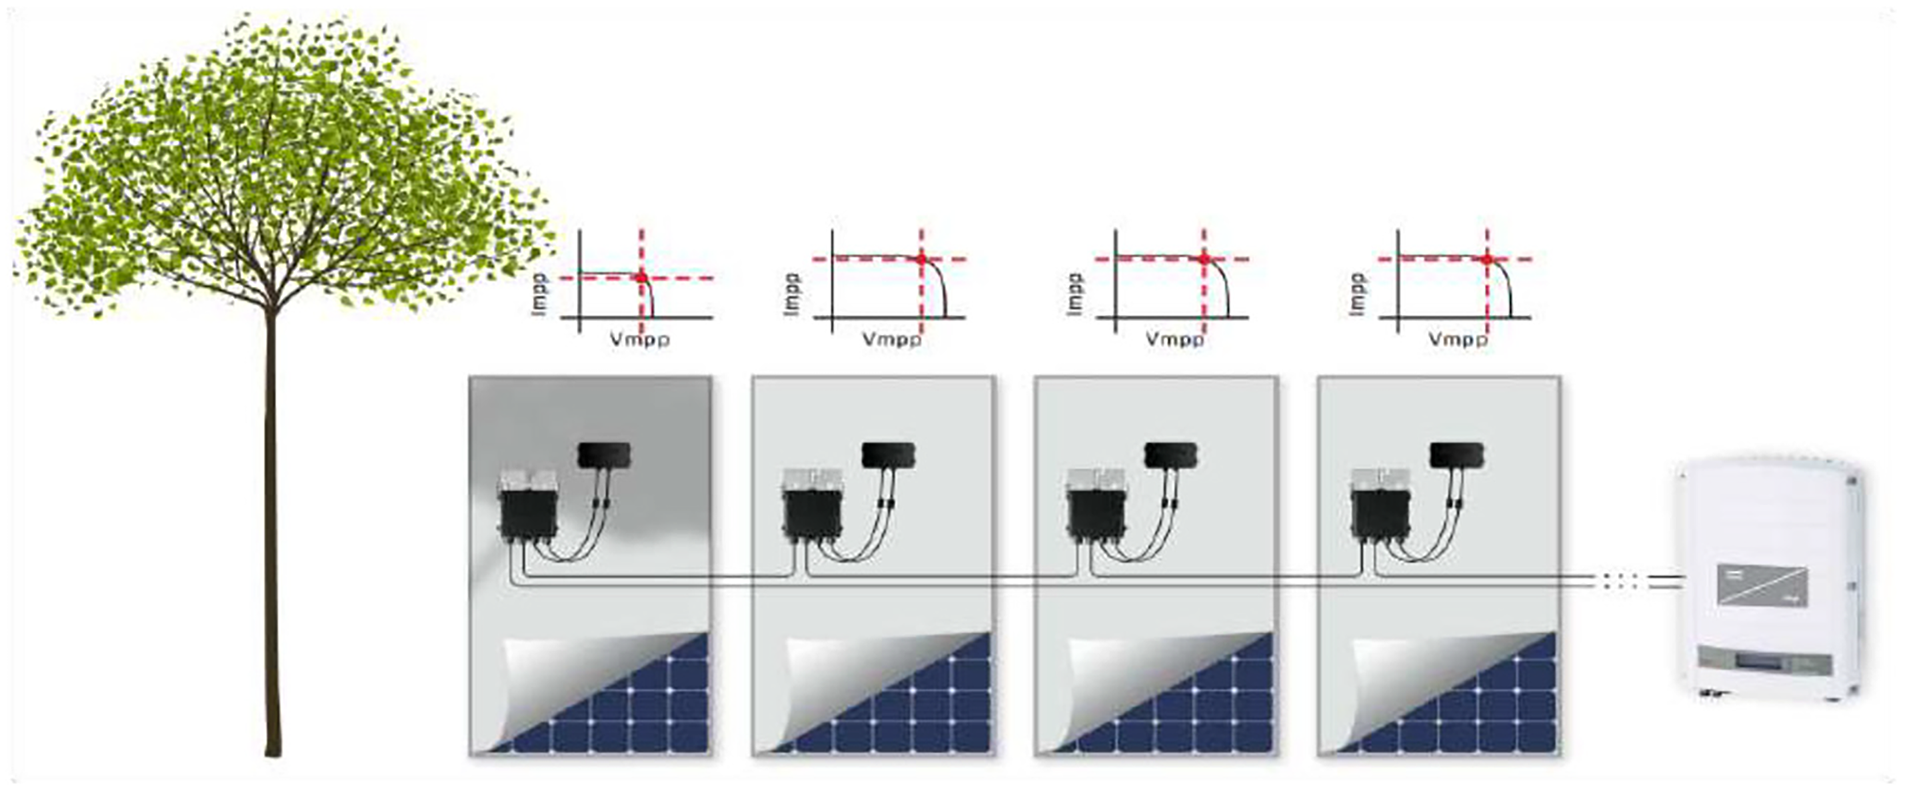
Figure 2: Partial shading of PV modules.
The present simulation focuses on a representative multi-zone non-uniform irradiance profile. Other realistic shading patterns, such as row-wise shading, column-wise shading, dynamic cloud shading, and irregular urban obstruction, are discussed in Table 2 to clarify the practical relevance of the considered shading condition.
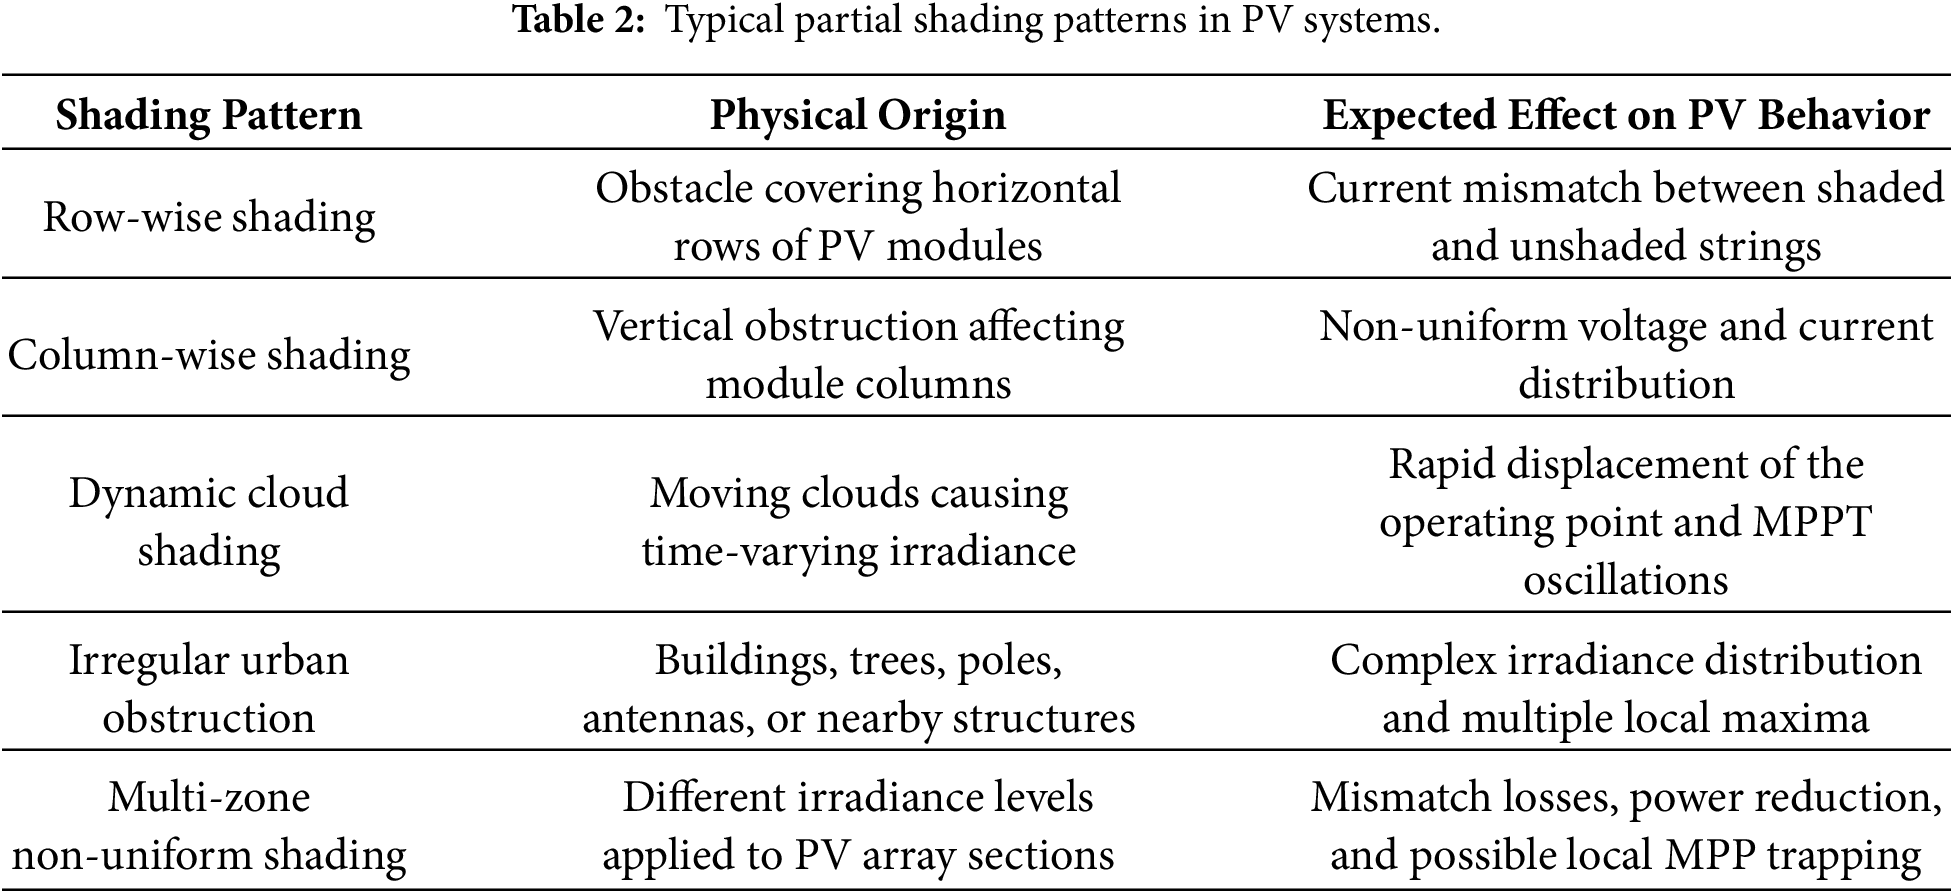
Therefore, the multi-zone irradiance profile used in this work can be considered representative of realistic non-uniform shading conditions encountered in large-scale grid-connected PV systems.
Bypass diodes reduce losses by bypassing shaded cells or groups of cells. However, their effectiveness depends on their number, location, and association with cell substrings. Certain interconnection arrangements, such as total cross-tied and bridge-linked configurations, as well as reconfiguration techniques, can minimize power losses and improve the resistance of PV systems to shading.
Photovoltaic modules are highly sensitive to shading, and in real installations it is nearly impossible to eliminate shadowing entirely. When only part of a module is shaded, its electrical response changes, which distorts the global current-voltage (I-V) and power-voltage (P-V) curves. Under non-uniform irradiance, these characteristics become more intricate because several maximum power points can appear.
Figs. 3 and 4 present I-V and P-V curves that depict the typical electrical behavior of PV arrays under both uniform illumination and partial shading. The results align with the operating points obtained from the MATLAB/Simulink model and are provided to clarify the physical origins of current mismatch, the presence of multiple local maxima, and the resulting limitations for MPPT methods.
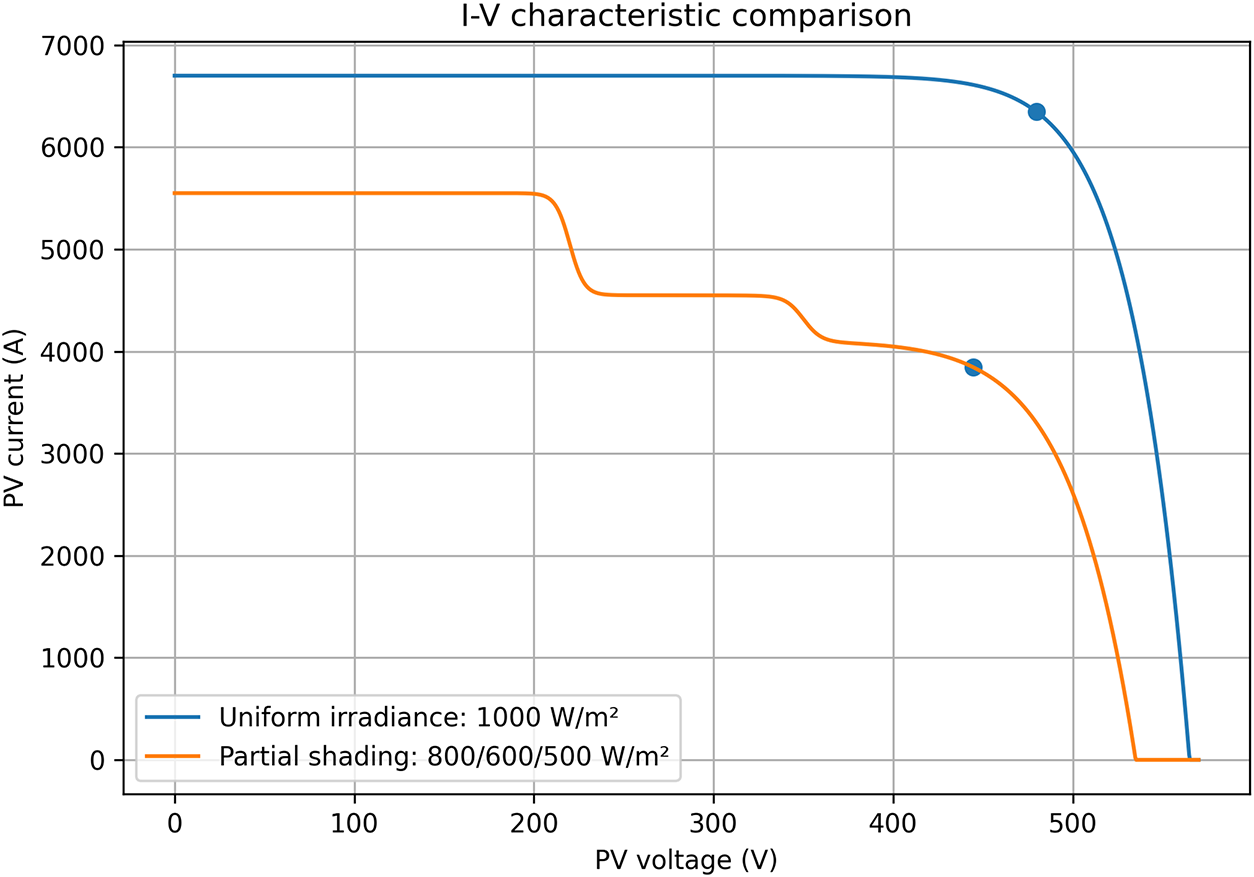
Figure 3: I–V characteristic comparison under uniform irradiance and multi-zone partial shading conditions.
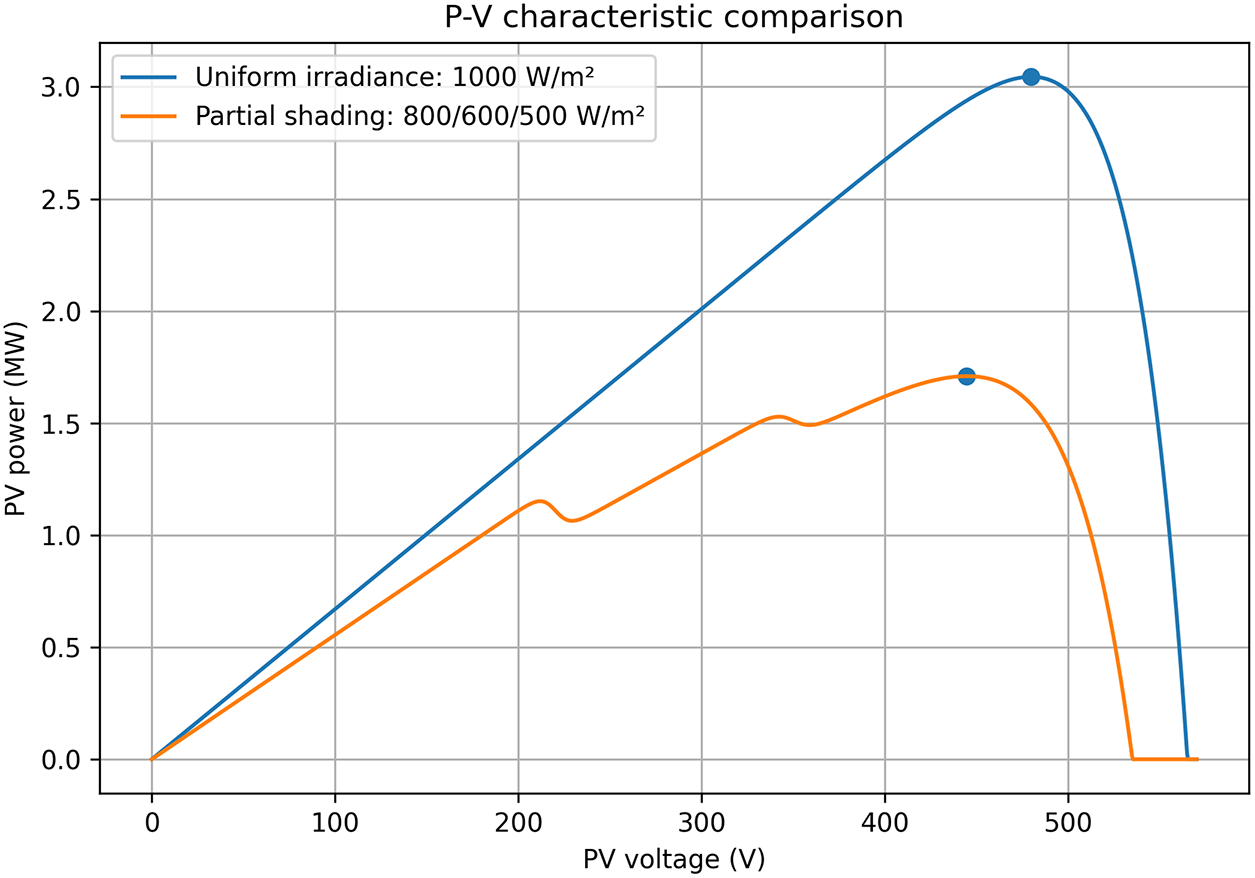
Figure 4: P-V characteristic comparison under uniform irradiance and multi-zone partial shading conditions.
Fig. 3 offers a representative comparison of I-V characteristics for uniform and partially shaded conditions. With uniform irradiance at 1000 W/m2, the array current remains almost constant over a wide voltage interval, then declines abruptly near the open-circuit voltage. Under partial shading, when different sections of the array receive 800, 600, and 500 W/m2, the I-V curve becomes distorted and shows several step-like drops in current. This effect is chiefly due to current mismatch between shaded and unshaded PV groups and to the conduction of the bypass diodes.
Fig. 4 compares the associated P-V characteristics. Under uniform irradiance, the P-V curve displays a single maximum power point, and the extracted power is close to 3.05 MW. When partial shading occurs, the P-V profile becomes nonuniform and shows several local maxima in addition to one global maximum. In the considered shading scenario, the peak available power drops to roughly 1.71 MW, which corresponds to an approximate 43.9% decrease relative to the uniform irradiance case.
Under partial shading, the P-V curve often exhibits several local peaks, which complicates the task of conventional maximum power point tracking algorithms such as Perturb and Observe (P&O) in finding the global maximum. The convergence outcome depends on the initial operating condition and the chosen perturbation direction, so the tracker can settle at a local maximum instead of the global optimum. This distortion of the P-V characteristic indicates that partial shading affects not only the available power but also the stability and accuracy of MPPT performance.
A shadow on a PV module reduces its power output through two main effects: a decrease in incident irradiance and an increase in electrical mismatch losses. Even a small shaded area can cause a notable power drop because the shaded cells restrict the current through series-connected cells. As a result, power loss is not directly proportional to the number of shaded cells or modules. Partial shading also distorts the overall I-V characteristic due to the mismatch between shaded and unshaded modules.
The reverse voltage applied to a shaded cell becomes more critical when a large number of cells are connected in series. A typical solution is to place a bypass diode in parallel with a subset of cells. When that subset is under reverse bias, the diode conducts; during normal operation, it non-conducting.
To limit adverse effects such as hot spots, manufacturers add bypass diodes to protect shaded cells or substrings [29]. Most modules include two to five bypass diodes, usually located in the junction box. Each diode is linked to a defined subgroup of cells. If any cell in the subgroup is shaded, the diode conducts, routing the current through the diode and separating the shaded subgroup from the main current path. Fig. 5 illustrates this protection method.
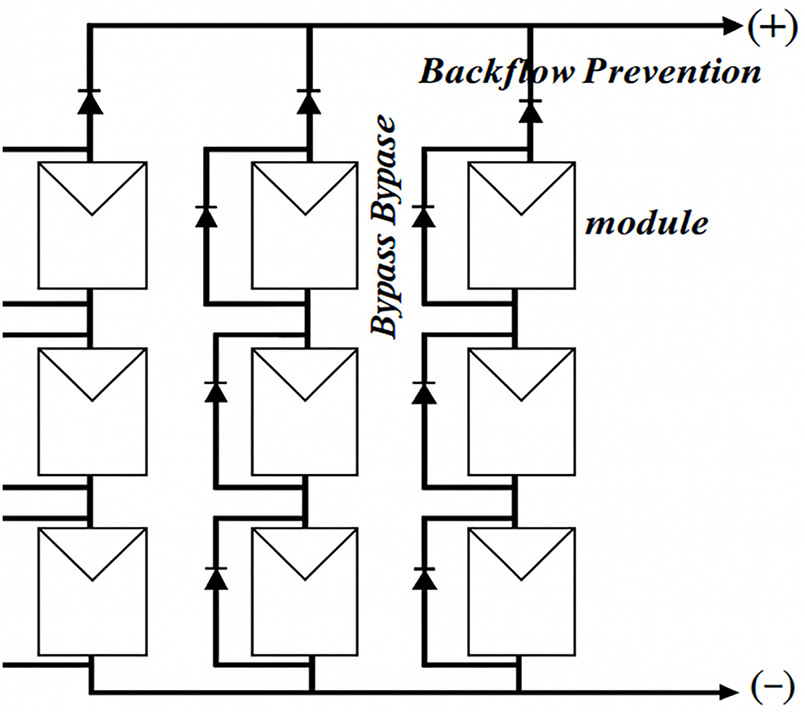
Figure 5: Bypass and blocking diode arrangement in a PV module assembly.
4 Maximum Power Point Tracking (Perturb and Observe (P&O))
Recent Maximum Power Point Tracking (MPPT) techniques enhance the efficiency of solar modules by better coordinating how photovoltaic (PV) panels interact with storage systems or the grid. Serving as a DC-DC conversion stage, an MPPT controller adapts the high voltage delivered by the panels to the level needed for battery charging or grid injection, while continuously seeking the operating point that maximizes power, including under partial shading. Fig. 6 illustrates the overall architecture of the MPPT system for a solar cell.
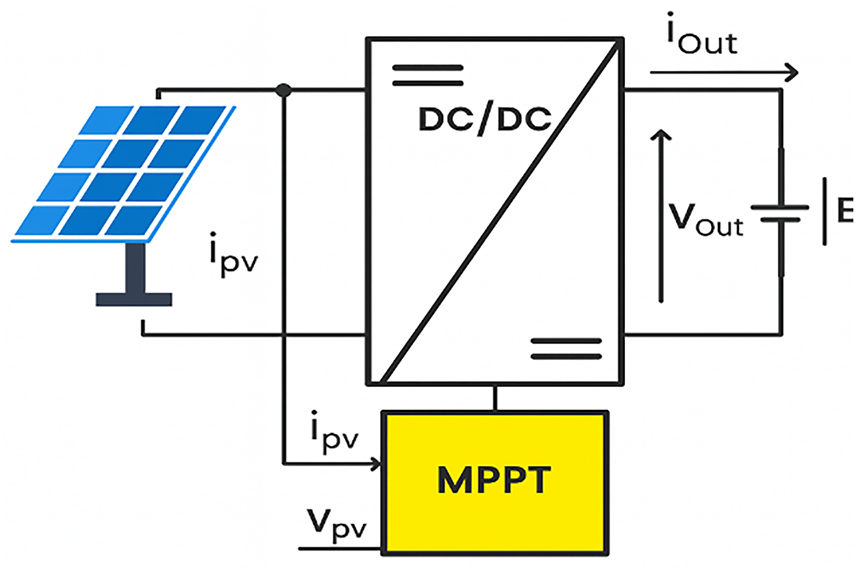
Figure 6: MPPT technique with solar cell.
A broad spectrum of MPPT strategies exists. Traditional methods such as Perturb and Observe (P&O) are valued for their simplicity and low cost, but they tend to oscillate around the maximum power point and react slowly to rapid fluctuations in irradiance [30]. Hybrid and intelligent approaches that integrate artificial intelligence and optimization tools, such as fuzzy logic, neural networks, or evolutionary algorithms, offer higher accuracy and better adaptability, especially under nonuniform shading, though they come with greater complexity and higher implementation costs. The choice of method depends on irradiance conditions and system design: at low irradiance, open-circuit voltage techniques are often preferred for their noise robustness, while iterative methods are generally favored for series-connected cells [31].
The P&O algorithm is one of the most widely used and simplest methods of maximum power point tracking (MPPT) in photovoltaic systems. It is characterized by the fact that it often relies on a single voltage sensor, which helps reduce costs and facilitates its integration into the system. Its mechanism of operation is based on periodically changing the voltage or current of the solar array and then comparing the resulting power with the power recorded in the previous period.
If an increase in power is observed (ΔP > 0), the system continues to disturb in the same direction, indicating that operation is approaching the maximum power point (MPP). If the power decreases (ΔP < 0), the direction of the disturbance is changed because the system has moved away from that point. This method performs well when solar radiation and temperature conditions change slowly, as shown in Fig. 7.
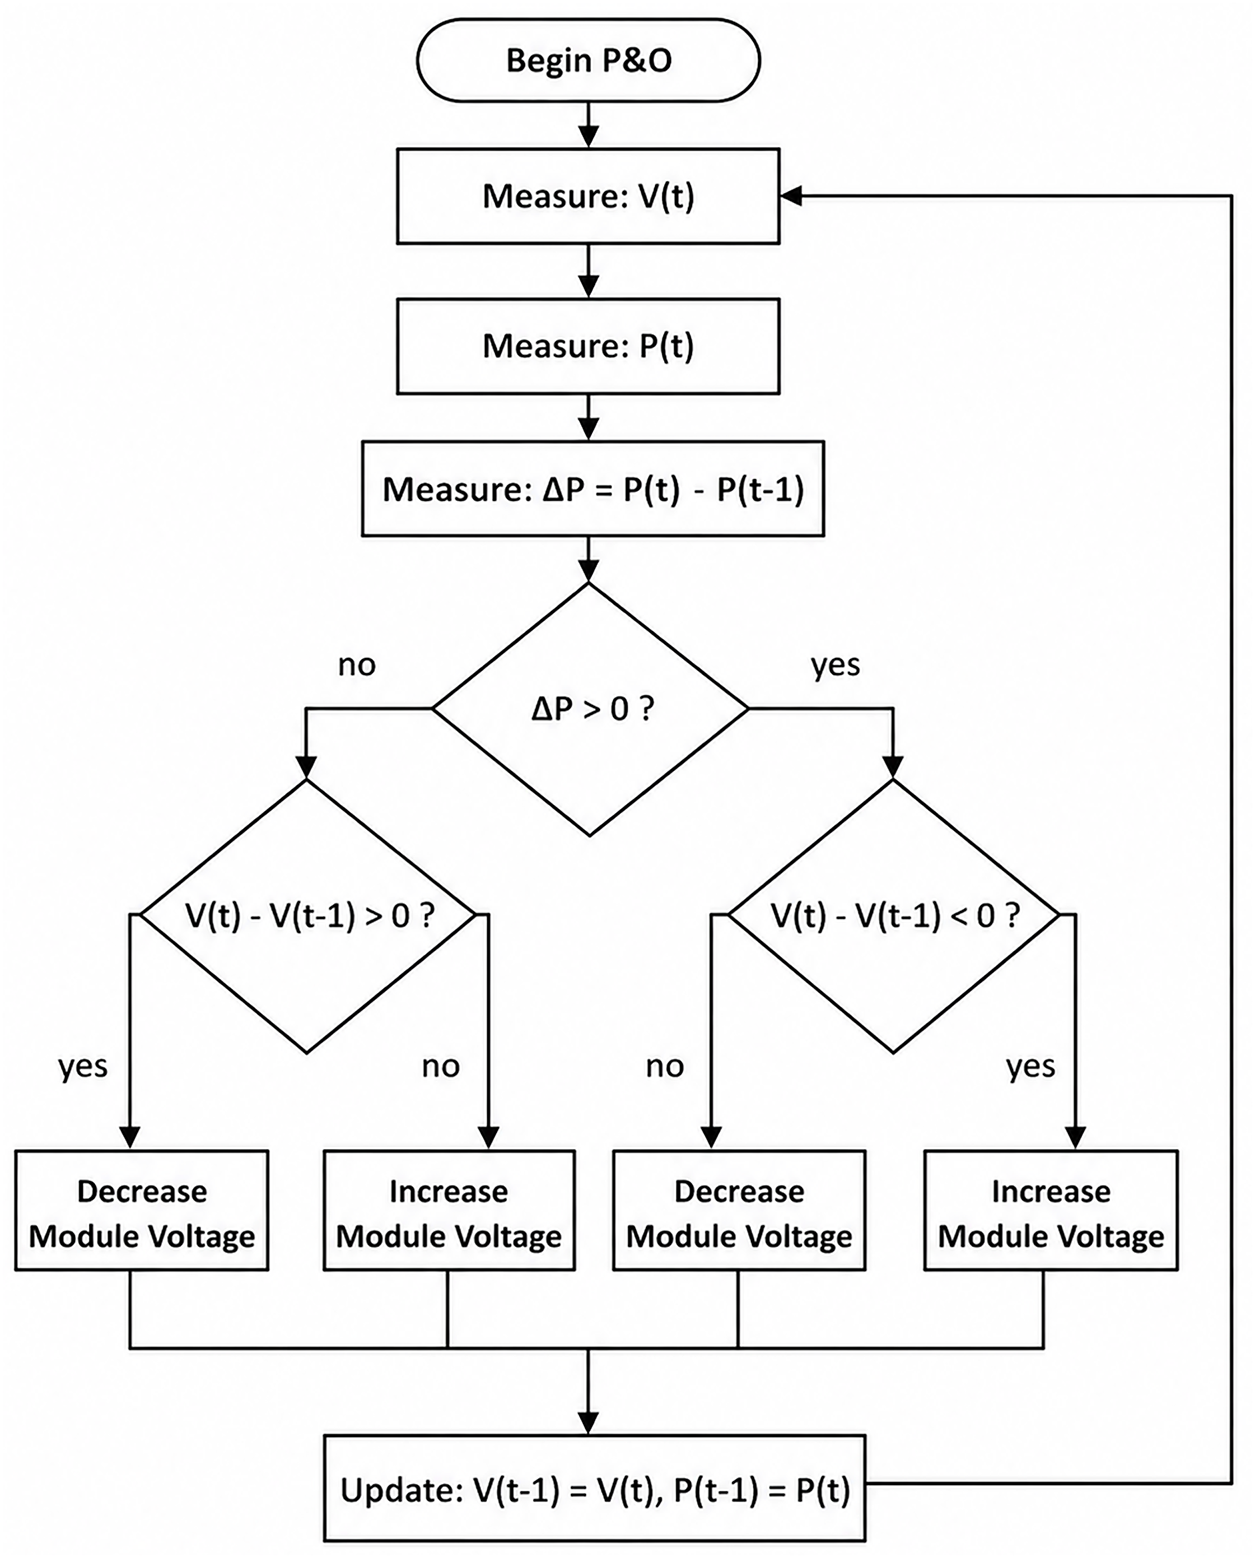
Figure 7: Flowchart of Perturb and Observe (P&O) methods.
However, in the event of rapid changes in climatic conditions, the algorithm may lose its accuracy and ability to correctly track the maximum power point. Furthermore, repeated disturbance in each cycle often leads to fluctuation around the maximum power point, causing a loss of energy.
A boost converter, also called a voltage step-up converter, is a DC-DC converter used to increase the input voltage to a higher output voltage level. It is widely used in renewable energy systems, electric vehicles, and embedded power electronic applications [32,33]. In the proposed grid-connected PV system, the boost converter is placed between the PV generator and the DC-link of the inverter in order to raise the PV voltage and regulate the PV operating point according to the MPPT control signal. The schematic diagram of the boost converter used in this study is shown in Fig. 8. During the switch conduction phase, energy is stored in the inductor. During the switch opening phase, the stored energy is transferred to the output side through the diode and the capacitor.
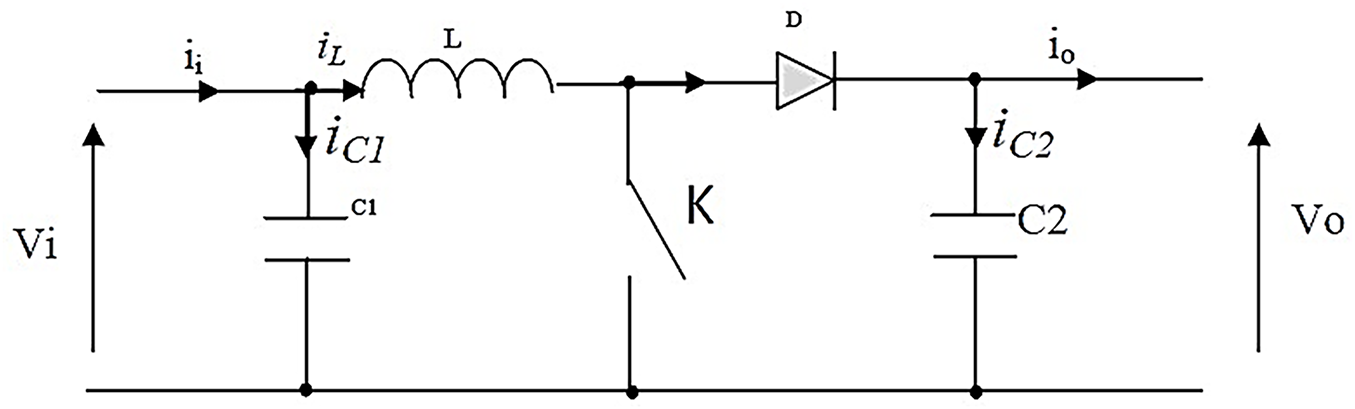
Figure 8: Schéma de principe d’un convertisseur Boost.
The operation of a boost converter can be divided into two configurations in continuous conduction mode according to the state of switch
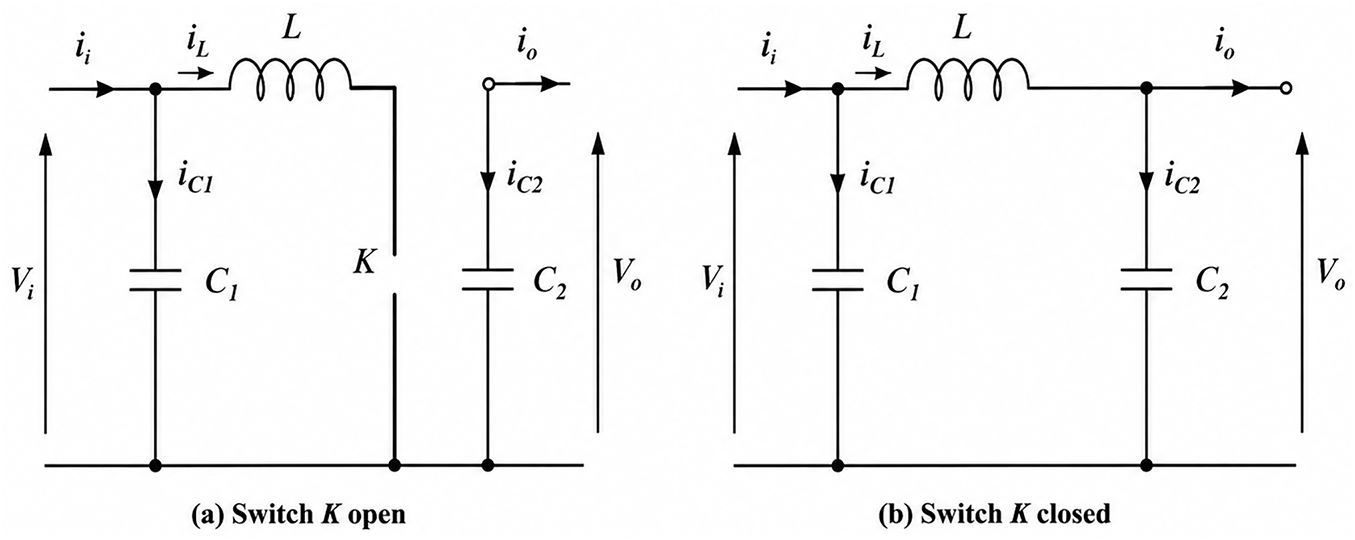
Figure 9: Equivalent diagrams of the boost chopper (a): K closed, (b): K open.
The boost converter is modeled under continuous conduction mode (CCM). The semiconductor devices are assumed to be ideal, and the switching frequency is considered sufficiently high to use an averaged model over one switching period. By applying Kirchhoff’s laws to the two operating states of the boost converter, the following equations are obtained.
• For the switch-closed interval
• For the switch-open interval
The averaged model over one switching period
By applying Eq. (11) to Eqs. (9) and (10), the averaged dynamic model of the boost converter is obtained as shown in Eq. (12):
From the averaged model in Eq. (12), and under steady-state conditions, the voltage gain of the ideal boost converter can be derived as given in Eq. (13):
where
In this work, the boost converter is governed by an MPPT controller that tunes the duty cycle based on the measured PV voltage and current. Under partial shading, nonuniform irradiance across the PV arrays causes the operating point to change quickly. The converter must therefore provide rapid and stable voltage regulation to harvest the maximum available power and keep the DC-link voltage close to its reference. The principal boost converter parameters used in the simulation are presented in Table 3.
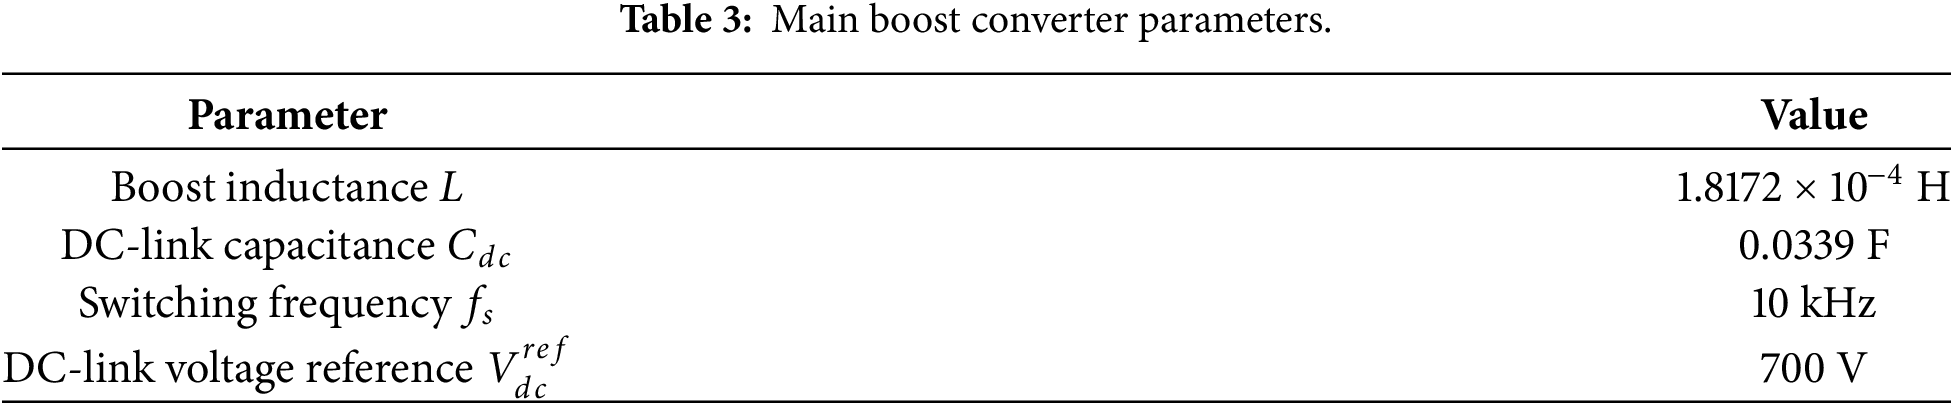
As shown in Table 3, the selected boost converter parameters are used to ensure voltage step-up operation and stable energy transfer between the PV generator and the grid-connected inverter under variable irradiance conditions.
6 Simulation and Results of the Systeme
The grid-connected photovoltaic system was implemented in MATLAB/Simulink, as shown in Fig. 10. The simulated circuit consists of six PV arrays, a Perturb and Observe (P&O) maximum power point tracking (MPPT) controller, a DC-DC boost converter, a DC-link capacitor, a three-phase inverter, an inductive grid-side filter, and a three-phase electrical grid. The boost converter adapts the PV voltage and maintains the required DC-link level, while the inverter converts the extracted DC power into AC power injected into the grid. The PV generator was first operated under uniform irradiance of 1000 W/m2. At t = 1 s, a multi-zone partial shading condition was applied by imposing different irradiance levels of 800, 600, and 500 W/m2 on different PV array sections. The cell temperature was kept constant at 25°C. The DC-link voltage reference was set to 700 V. The switching frequency of both the boost converter and the inverter was 10 kHz. The grid was modeled with a line-to-line RMS voltage of 400 V and a frequency of 50 Hz.
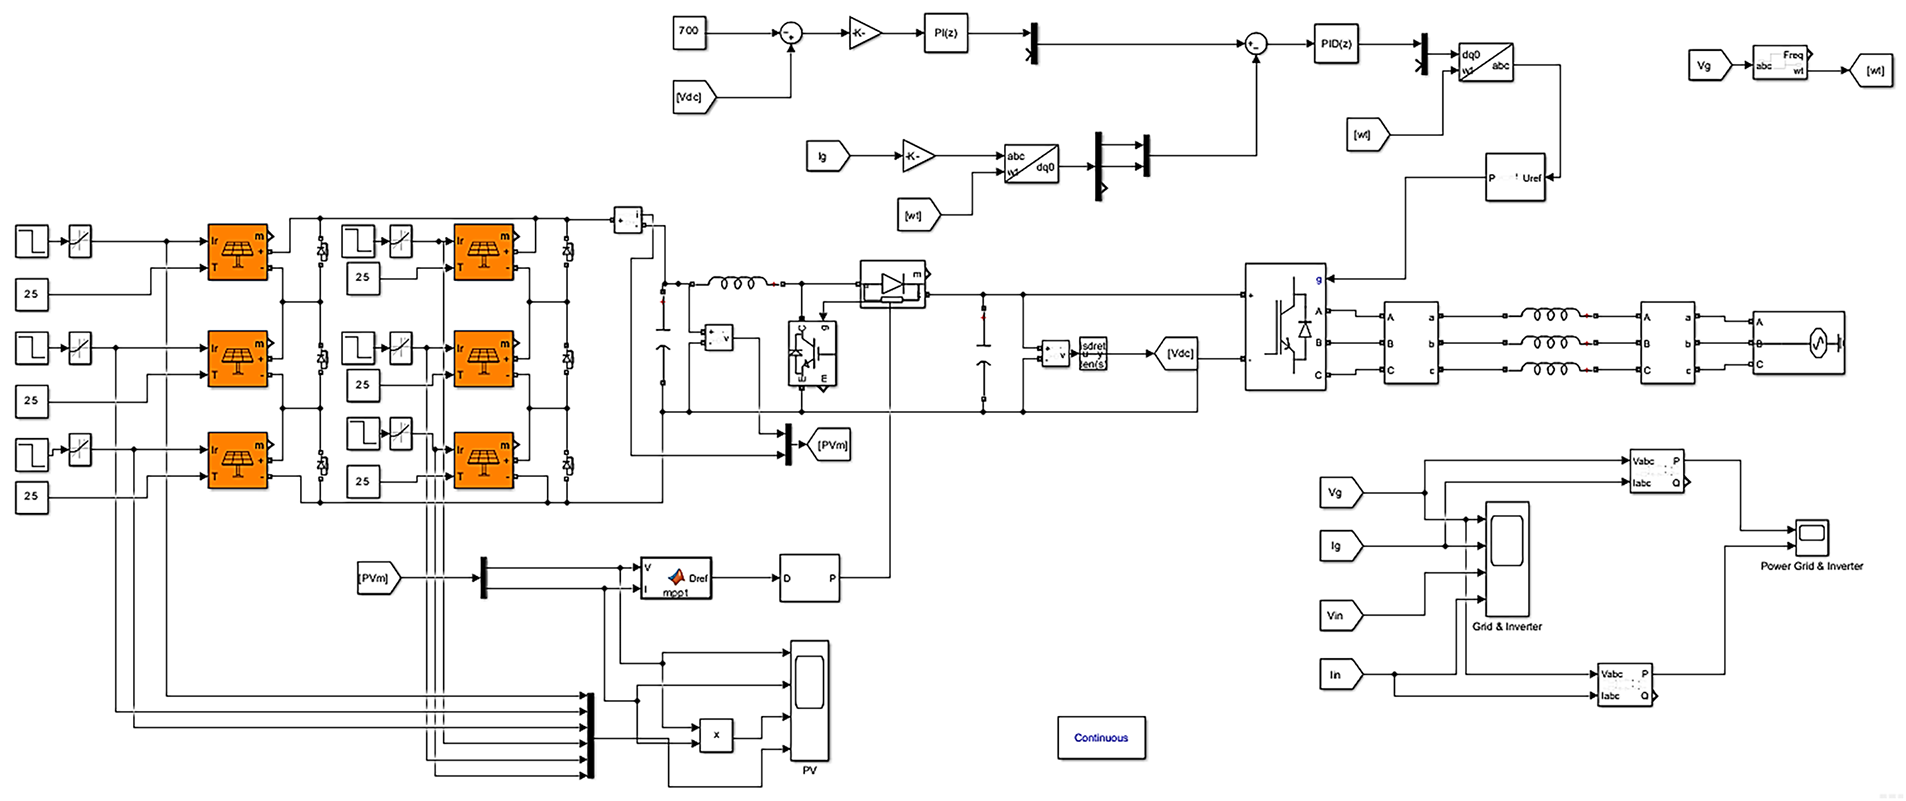
Figure 10: Simulation of the photovoltaic system connected to the electrical grid.
• Simulation of this system gives us the following results:
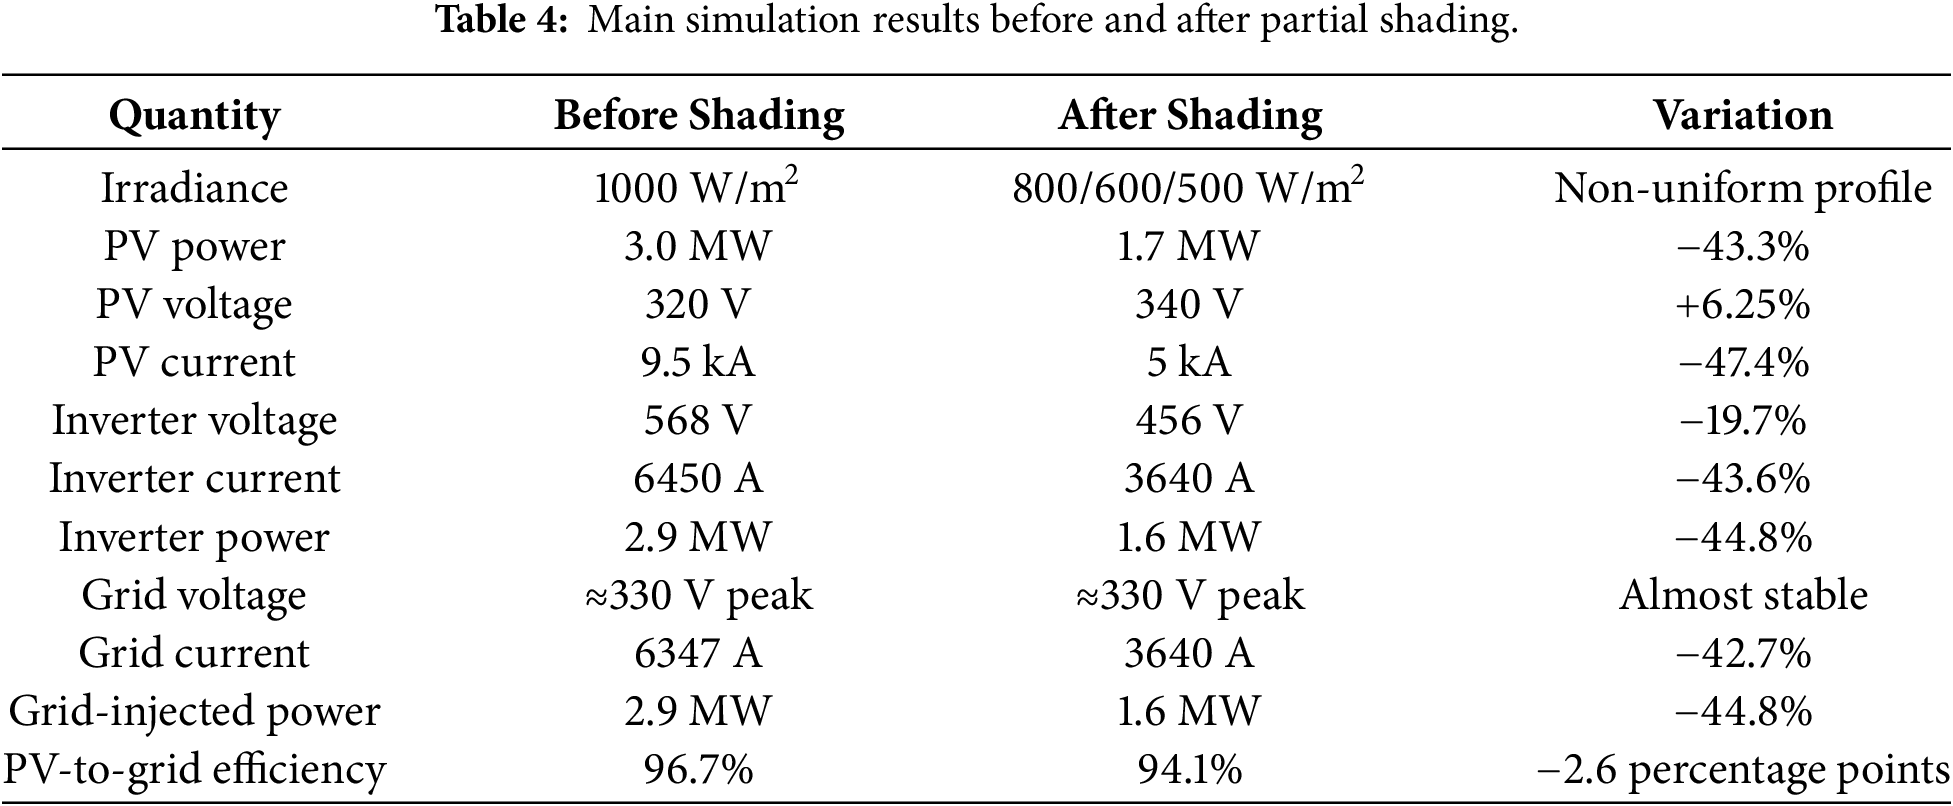
Fig. 11 shows the irradiance profile and the corresponding PV output power. Before t = 1 s, all PV arrays operate under uniform irradiance of 1000 W/m2, and the generated PV power reaches approximately 3.0 MW. After applying the multi-zone partial shading profile at t = 1 s, the PV output power decreases to approximately 1.7 MW, corresponding to a reduction of about 43.3%. This result shows that partial shading causes a severe decrease in the available PV power. These results demonstrate that partial shading leads to a marked decline in the available power from a PV system. This drop is caused not only by the decrease irradiance but also by electrical mismatch between PV arrays operating under different irradiance levels.
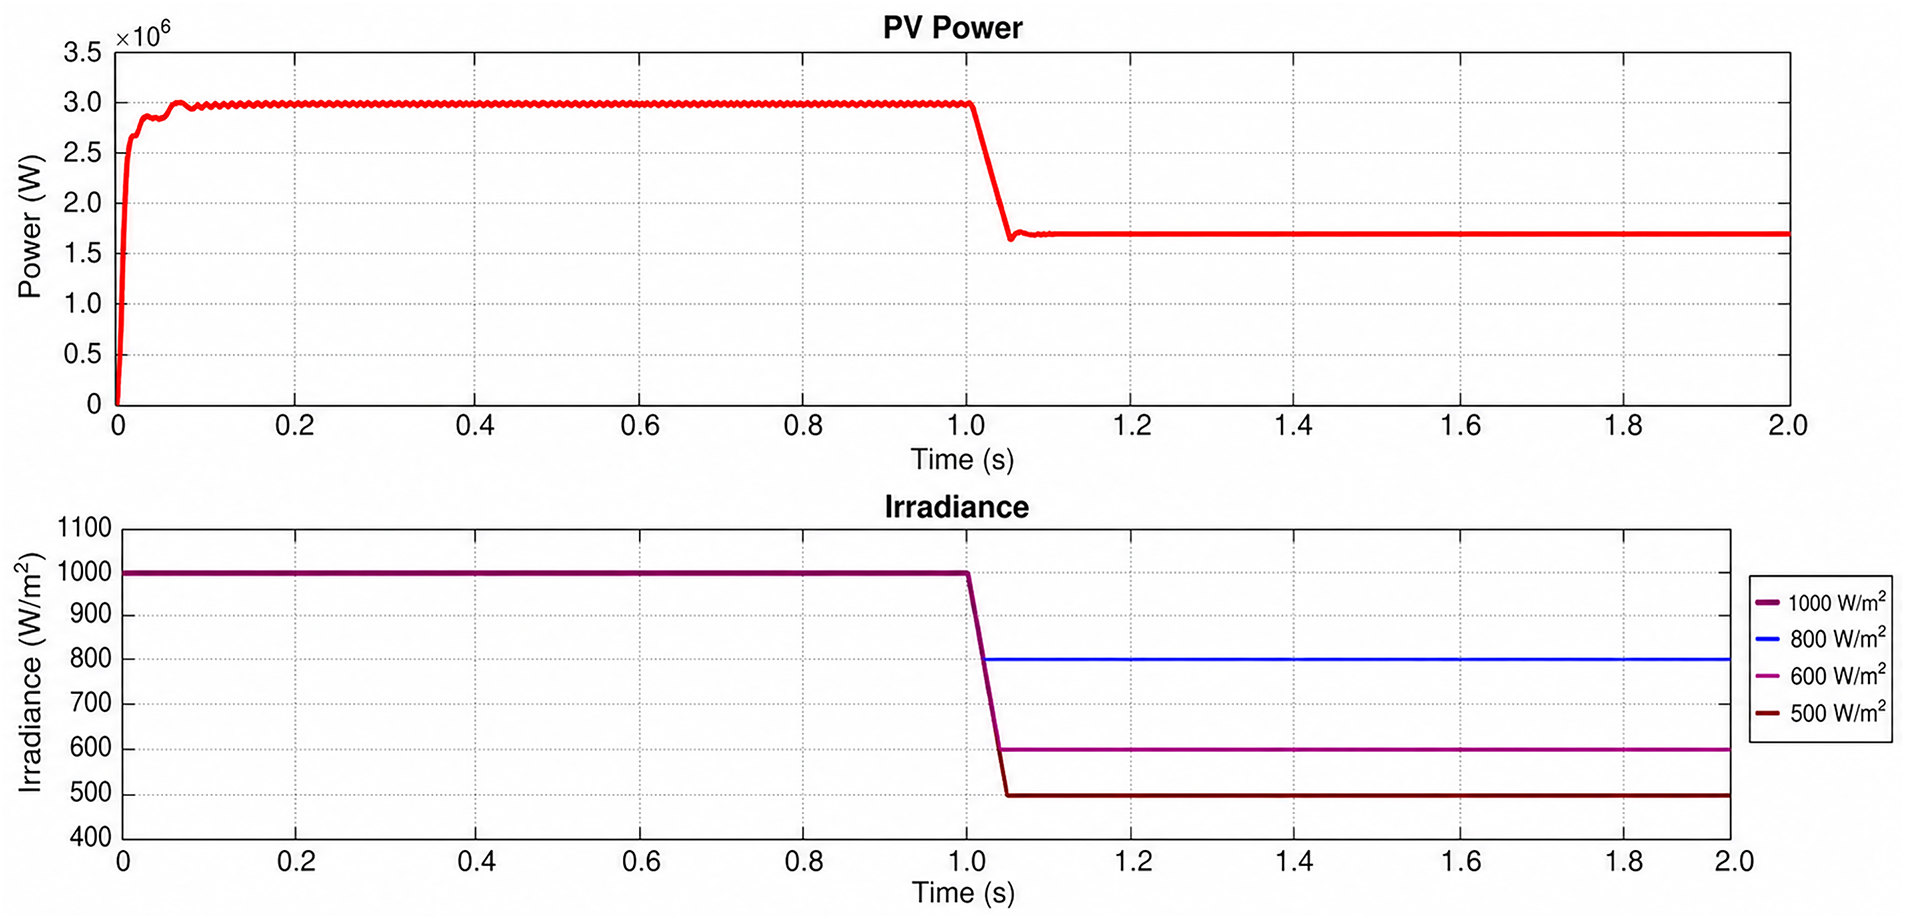
Figure 11: Irradiation and the power of photovoltaic panels.
Fig. 12 depicts the PV voltage and current responses before and after the shading event. Under uniform irradiance, the PV voltage is close to 320 V, while the PV current is about 9.5 kA. Following partial shading, the PV voltage rises slightly to around 340 V, whereas the PV current falls to nearly 5 kA. This corresponds to an approximate 47.4% reduction in current and a 6.25% increase in voltage. These observations show that partial shading affects the PV current far more than the PV voltage. This outcome is expected, since the current produced by PV modules depends strongly on irradiance. With non-uniform irradiance, shaded sections constrain the current supplied by the entire PV generator, while the operating voltage is set by the boost converter under MPPT control.
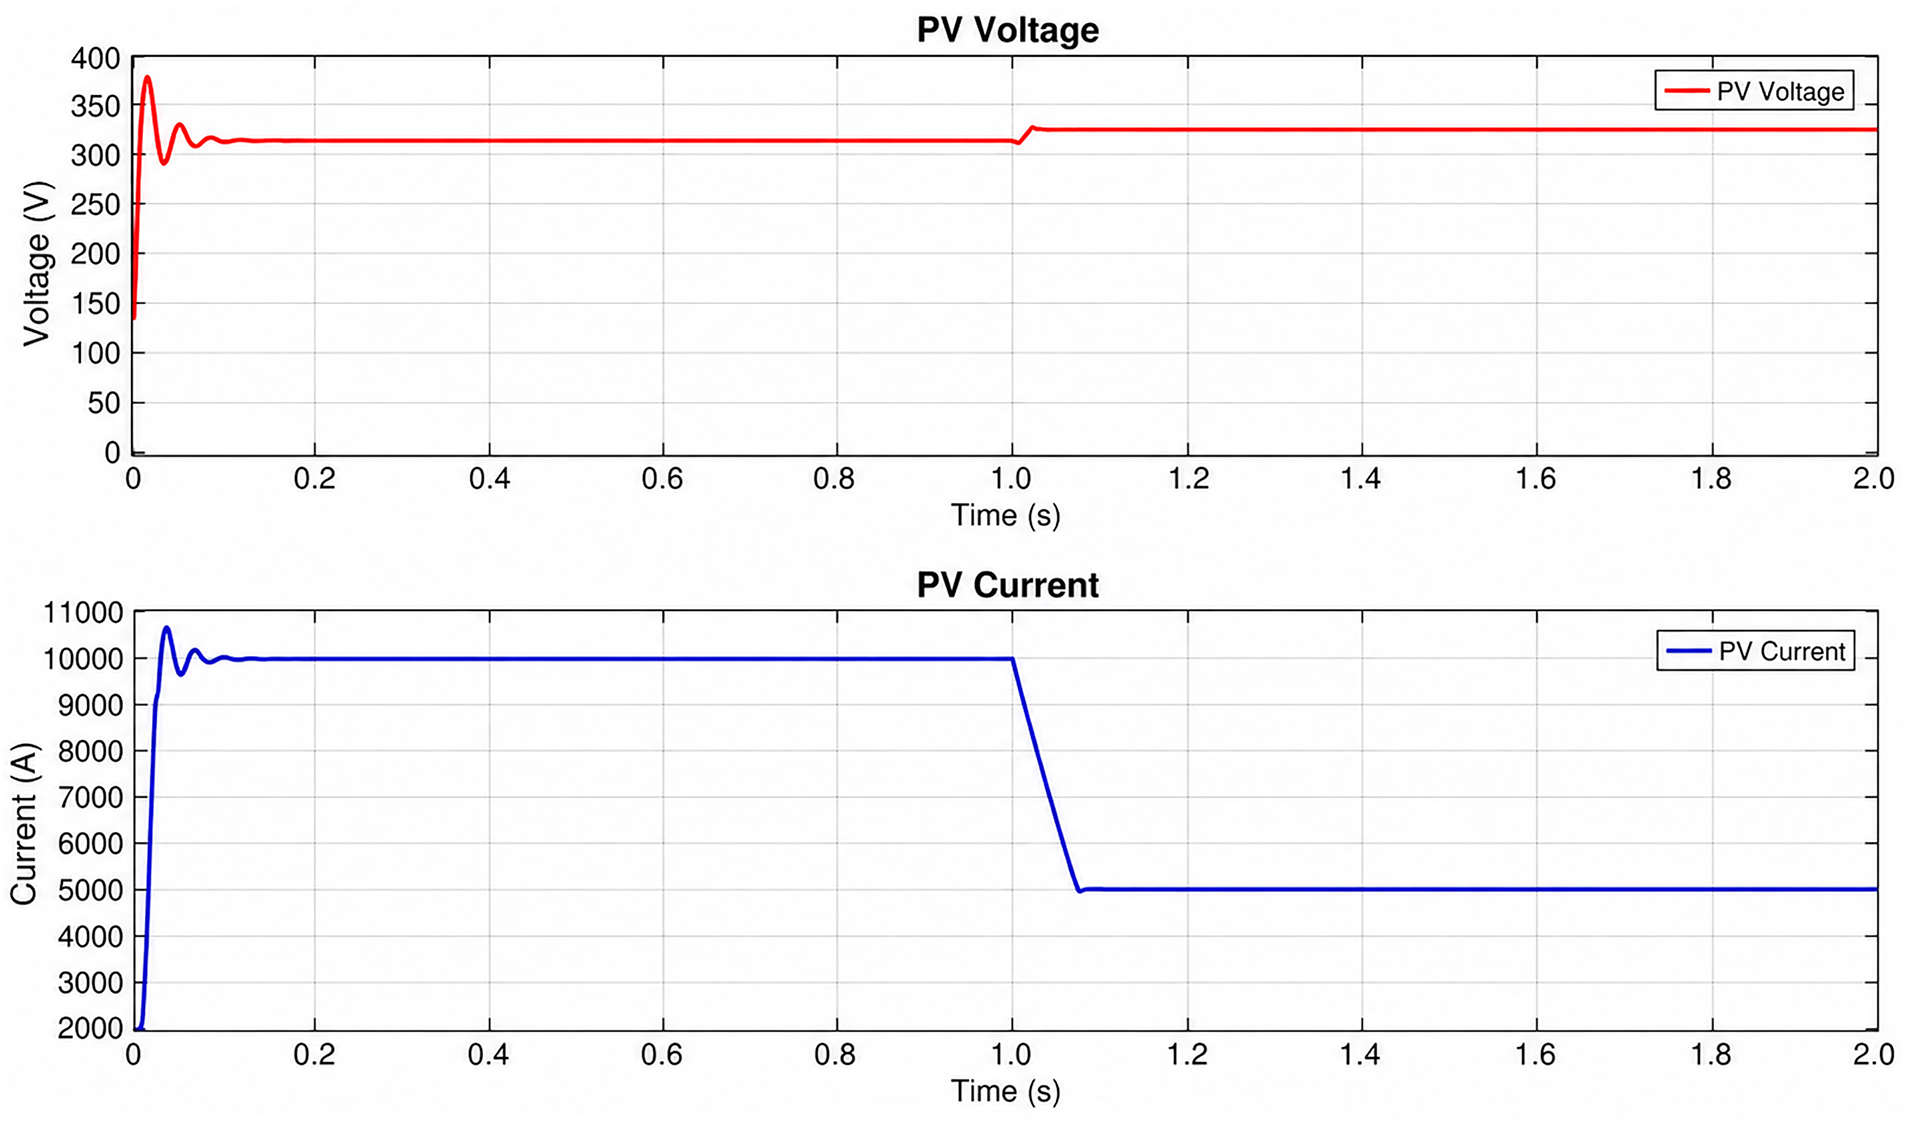
Figure 12: The current and voltage of photovoltaic panels.
Fig. 13 presents the inverter-side voltage and current. Before the shading event, the inverter delivers about 568 V with a current close to 6450 A. When partial shading is introduced, the voltage drops to roughly 456 V and the current falls to around 3640 A. These changes correspond to decreases of approximately 19.7% in voltage and 43.6% in current. The current reduction is directly linked to the lower power produced by the PV generator. With less DC power available after shading, the inverter operates at a reduced power level, which results in a smaller AC current amplitude.
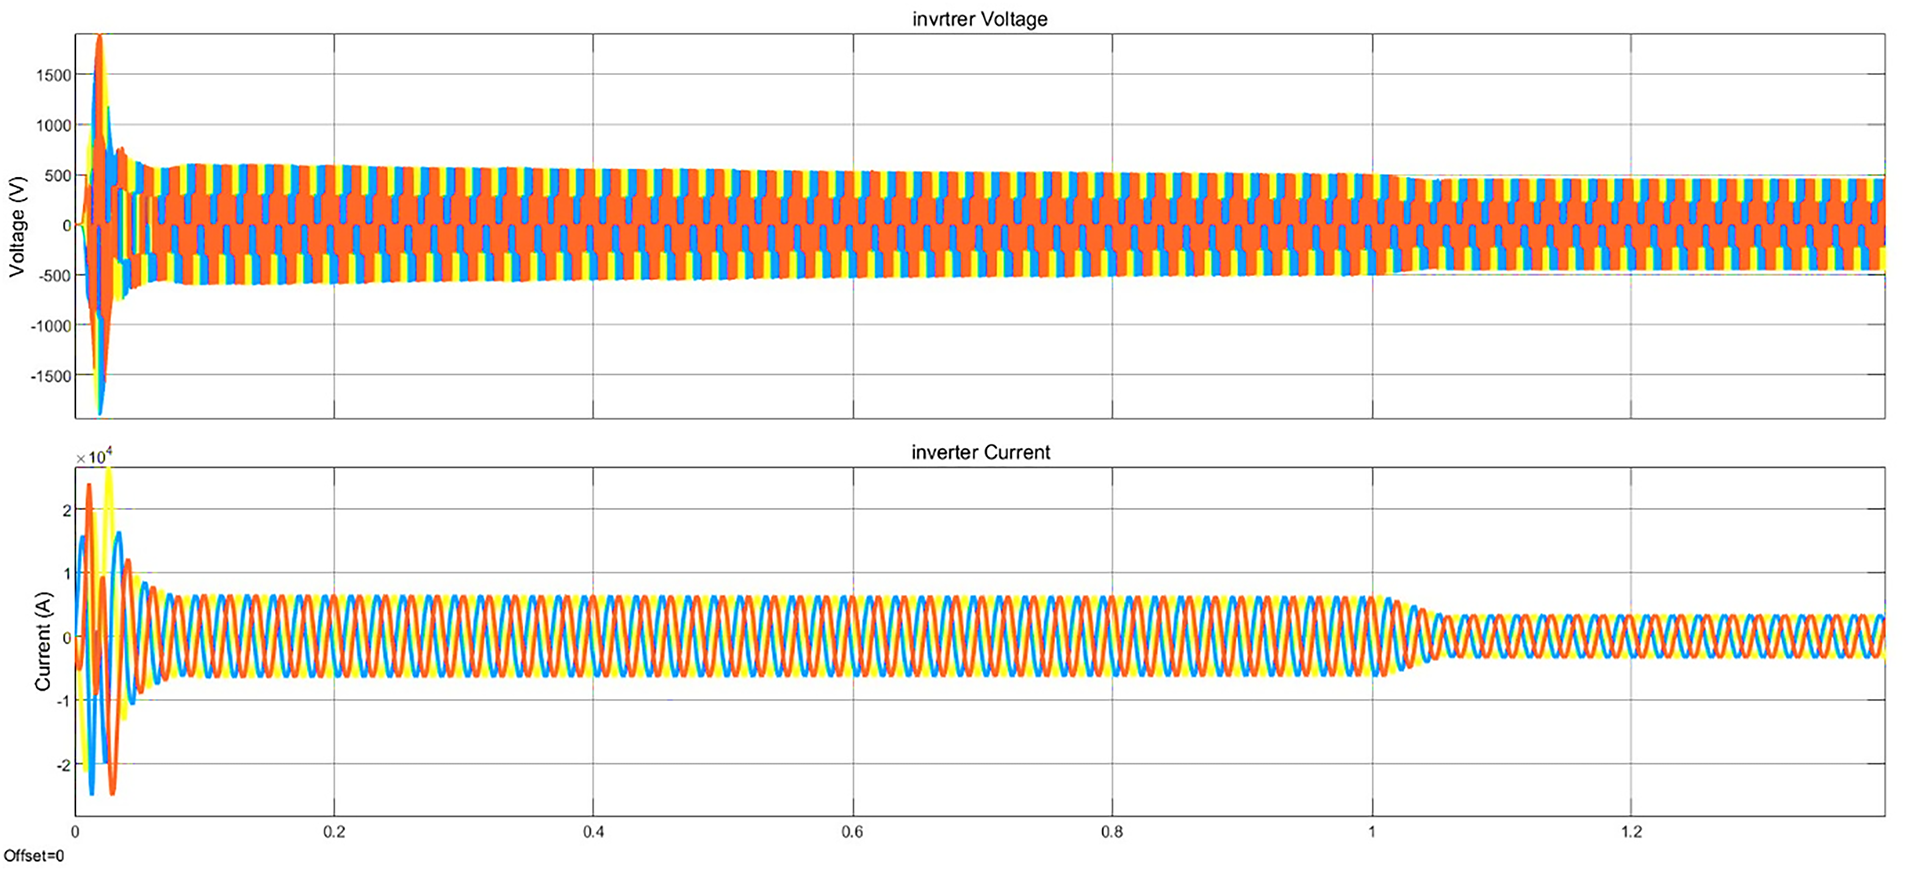
Figure 13: The current and voltage of the inverter.
Fig. 14 shows a zoomed view of the voltage and current waveforms. After the shading transition, the current amplitude diminishes, while the inverter continues to output periodic AC waveforms. This indicates that the inverter remains functional following the shading event, but injects less current due to the reduced PV power.
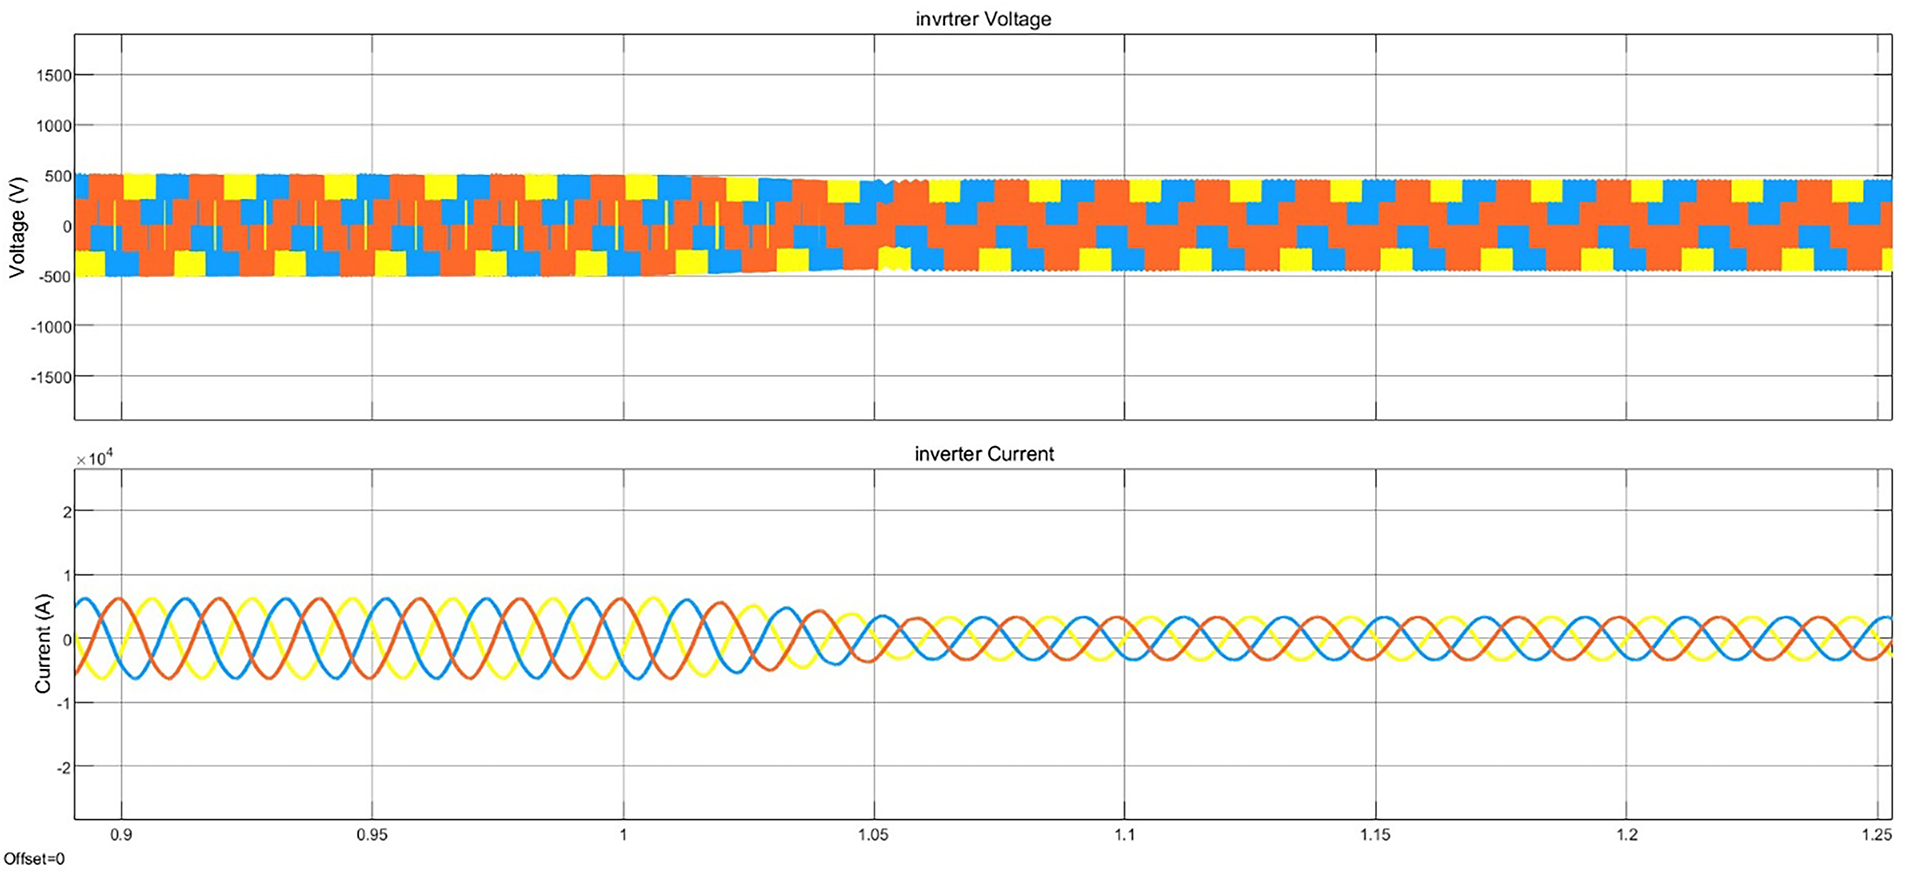
Figure 14: Zoom in on the inverter’s current and voltage.
Fig. 15 presents the grid voltage and the injected grid current. The grid voltage remains almost stable around 330 V peak during the simulation, which corresponds approximately to a 400 V line-to-line RMS grid voltage. The injected grid current decreases from approximately 6347 A before shading to about 3640 A after shading, corresponding to a reduction of about 42.7%. The stability of the grid voltage is due to the fact that the voltage is mainly imposed by the electrical grid. In contrast, the injected current depends on the available PV power. Therefore, when the PV power decreases under partial shading, the grid-injected current also decreases.
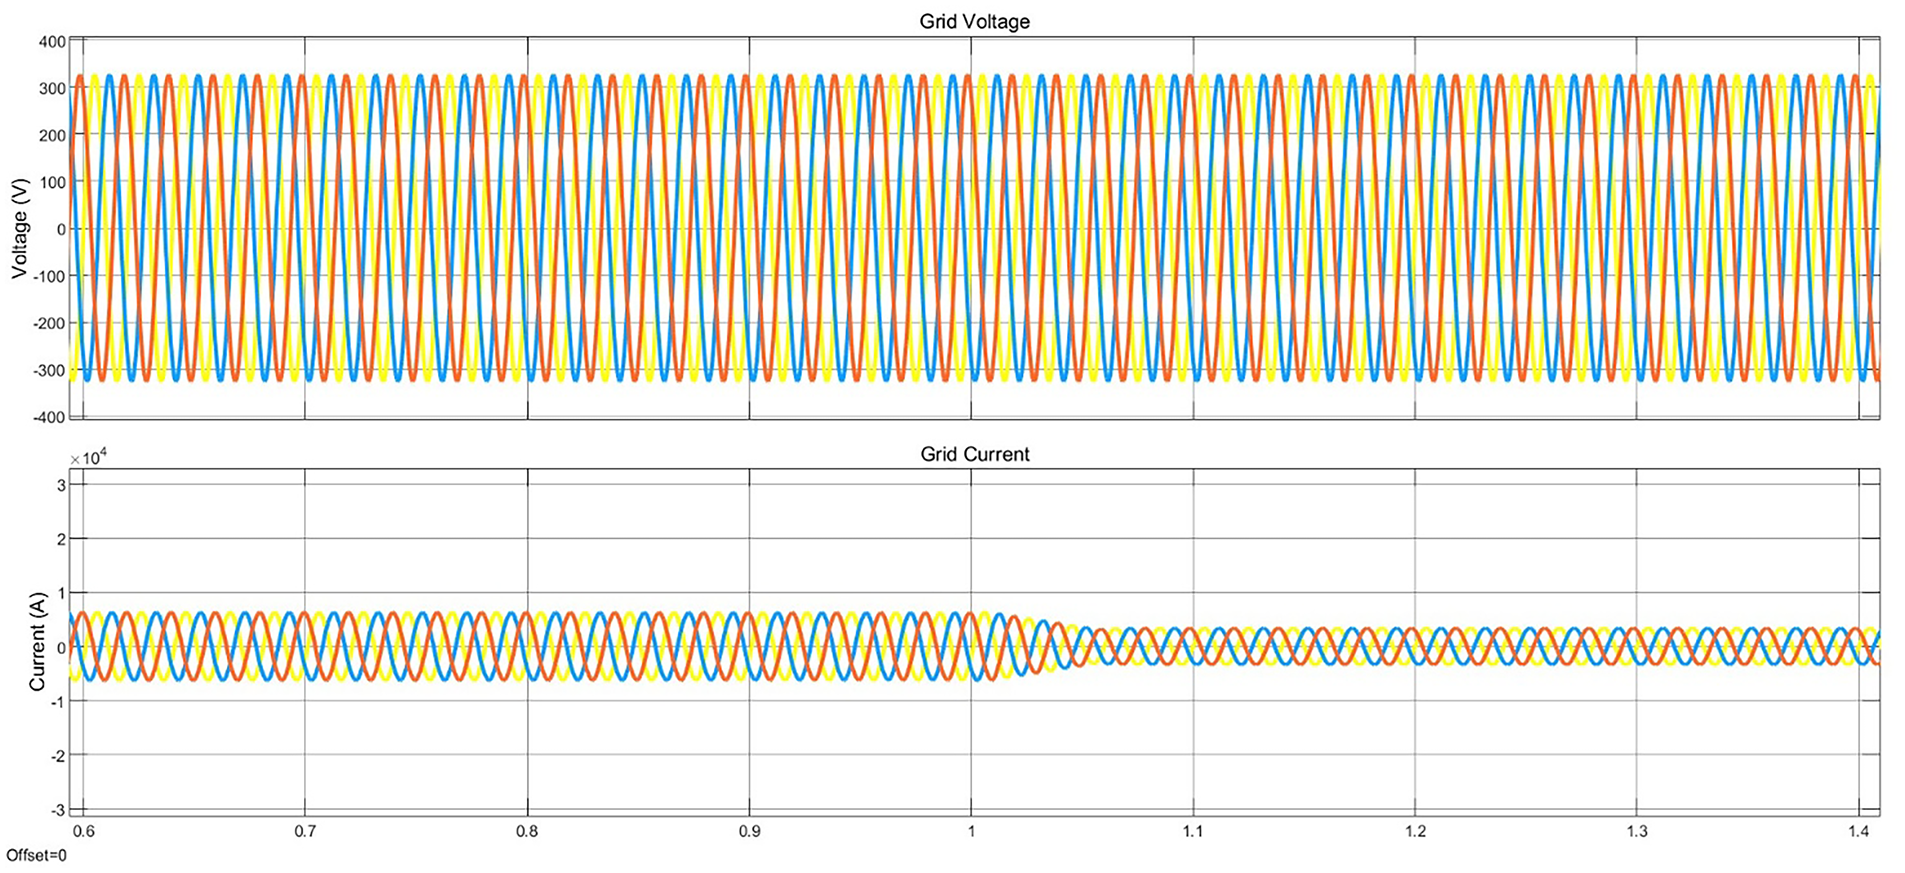
Figure 15: The current and voltage of the grid.
Fig. 16 compares the inverter output power and the power injected into the grid. Before partial shading, both the inverter-side power and the grid-side power are approximately 2.9 MW. After partial shading, both powers decrease to approximately 1.6 MW, corresponding to a reduction of about 44.8%. The close values of inverter power and grid-injected power show that most of the converted power is transferred to the grid. The decrease in both powers after shading confirms that the impact of partial shading propagates from the PV generator to the inverter and finally to the grid.
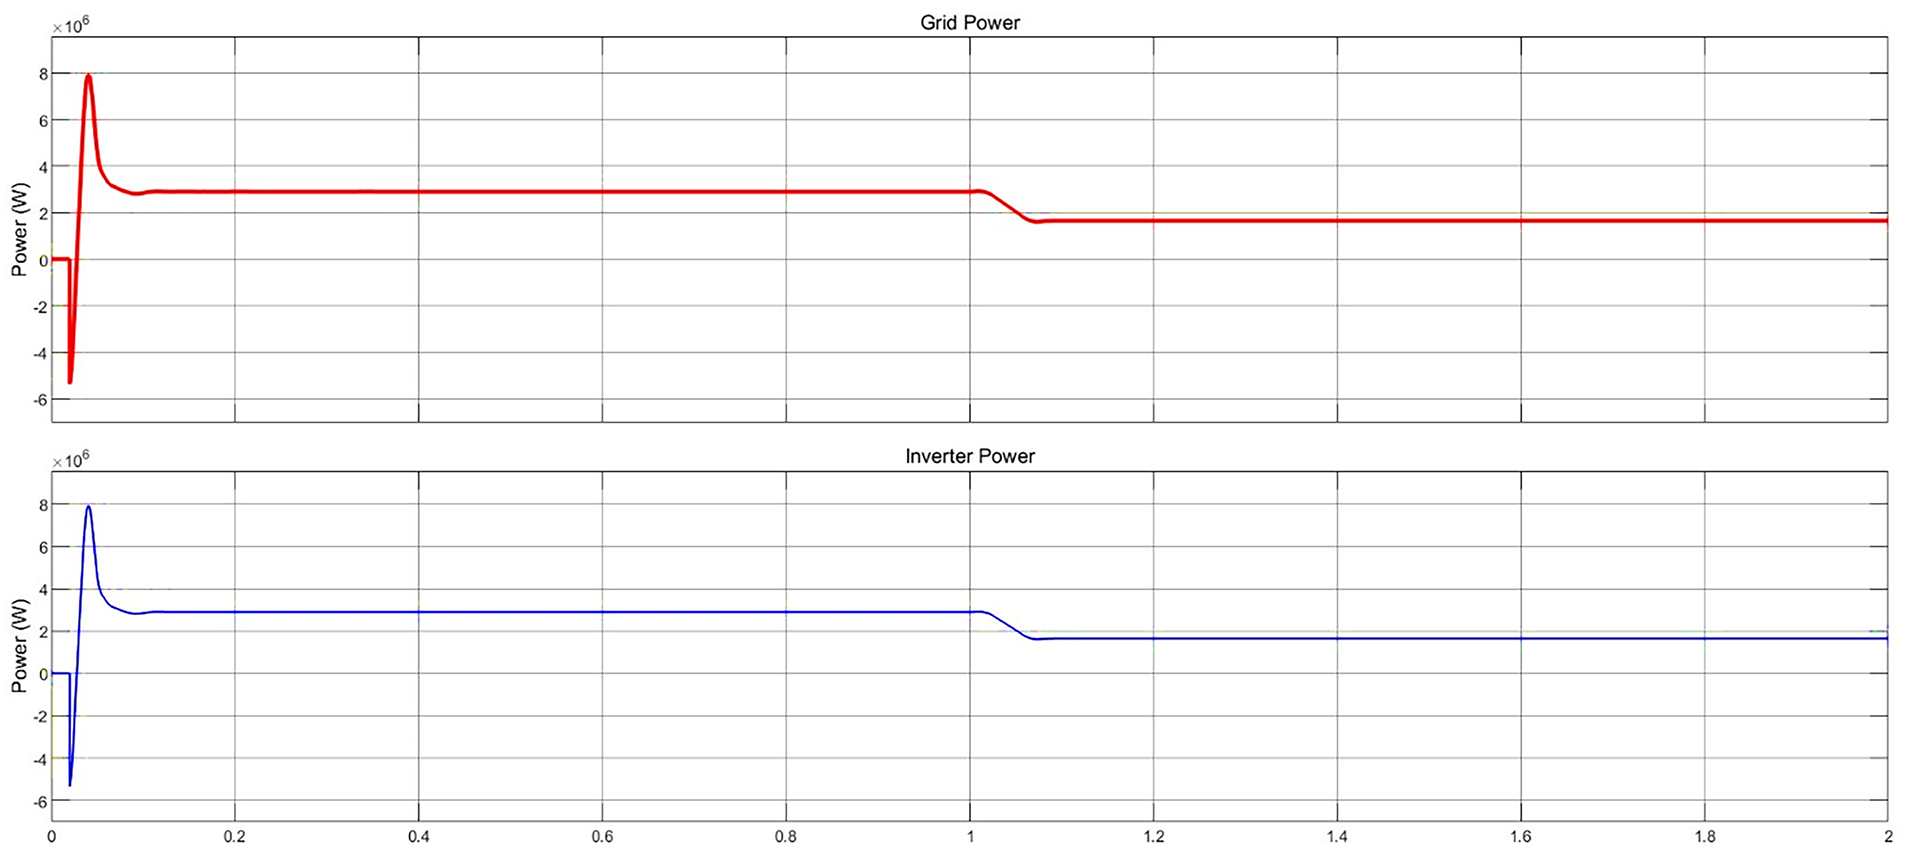
Figure 16: The power of the grid and the inverter.
The approximate PV-to-grid efficiency was evaluated using the ratio between the grid-injected power and the generated PV power. Under uniform irradiance, the efficiency is approximately:
Under partial shading conditions, the efficiency becomes:
Thus, the PV-to-grid efficiency decreases from approximately 96.7% under uniform irradiance to approximately 94.1% under partial shading. This modest decline shows that partial shading influences both the generated PV power and the overall energy transfer efficiency throughout the conversion chain.
We quantified the mismatch loss by contrasting the PV power obtained under partial shading with the power predicted if it scaled only with the mean irradiance. For irradiance values of 800, 600, and 500 W/m2, the average is about 633 W/m2, which corresponds to 63.3% of the uniform-irradiance case. If power followed this proportion, the expected PV output would be around 1.90 MW. In contrast, the simulated power under partial shading is approximately 1.70 MW. The additional shortfall is therefore close to 0.20 MW, representing about 10.5% of the expected power at the average irradiance. This result indicates that the decrease in PV power under partial shading is due not only to the lower average irradiance, but also to mismatch between PV arrays and to a shift of the operating point under non-uniform conditions.
Table 4 presents the main numerical results before and after partial shading.
The harmonic performance of the injected grid current was evaluated using fast Fourier transform (FFT) analysis. Two operating intervals were considered. The first interval corresponds to the uniform irradiance condition before shading, starting at t = 0.5 s over 10 fundamental cycles. The second interval corresponds to the partial shading condition, starting at t = 1.2 s over 10 fundamental cycles. The fundamental frequency was set to 50 Hz, and the maximum frequency considered for FFT analysis was 2500 Hz.
As indicated in Figs. 17 and 18, the FFT results show that the grid current total harmonic distortion (THD) is 1.49% before shading and 0.45% after shading. Both values remain below the 5% reference limit commonly associated with IEEE-519 recommendations.
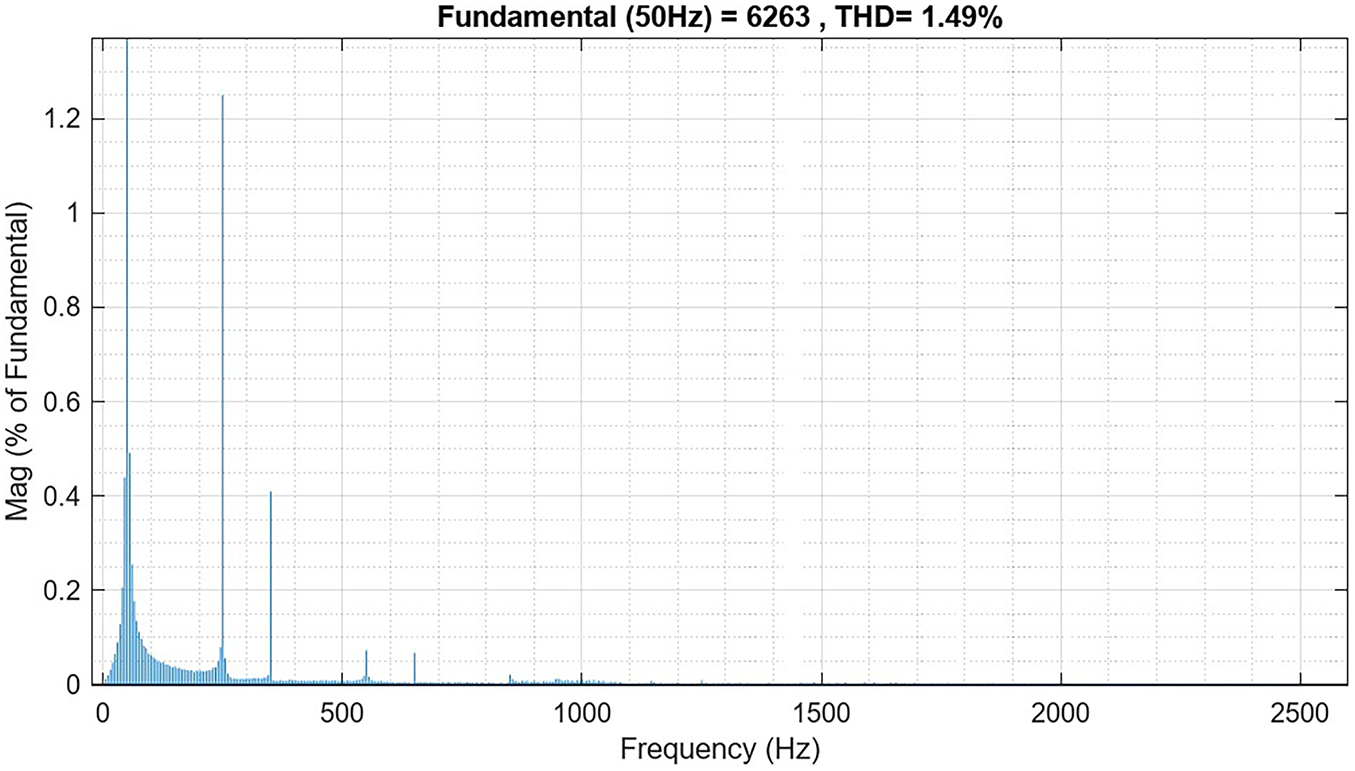
Figure 17: FFT spectrum of the grid-injected current before partial shading.
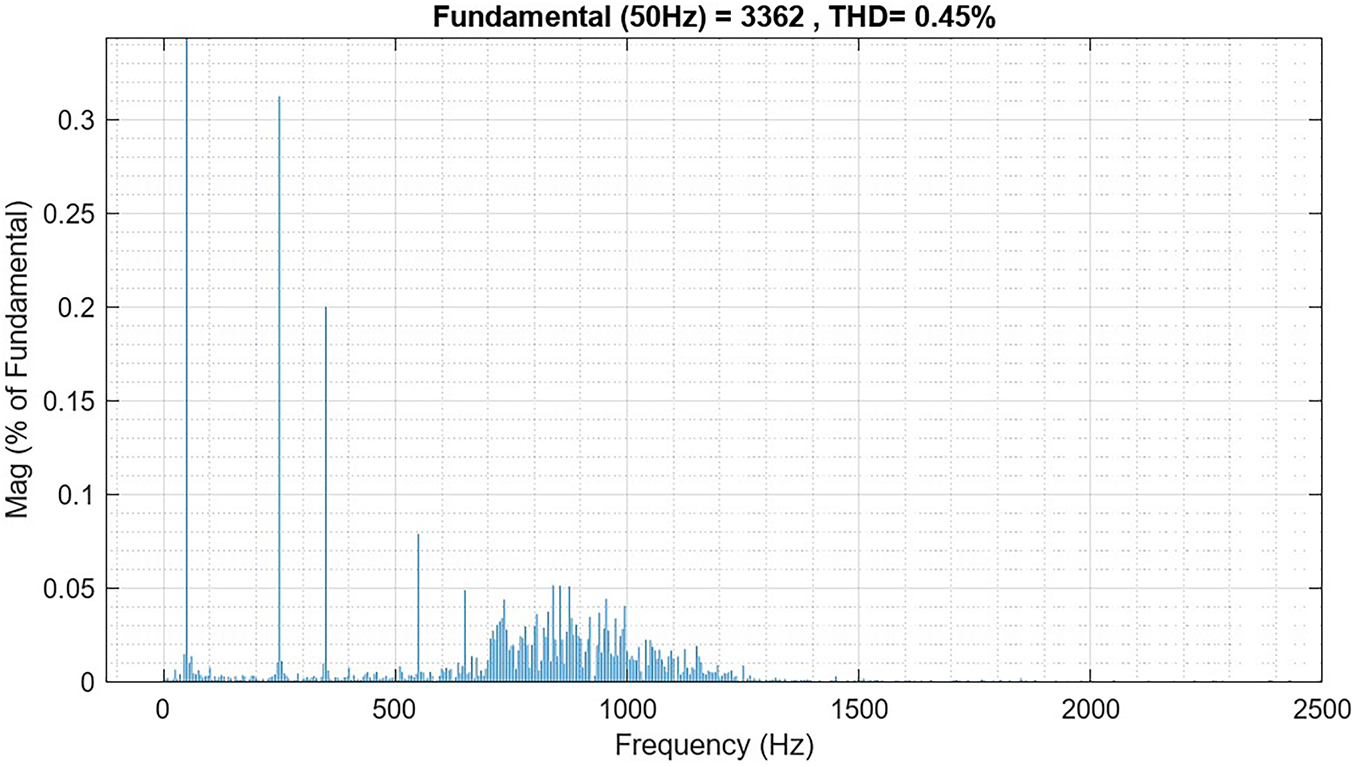
Figure 18: FFT spectrum of the grid-injected current after partial shading.
Following partial shading, the THD decreases because, over the operating range considered, the harmonic components of the injected current fall more sharply than the fundamental component. This indicates that, despite the marked reduction in injected current amplitude and transferred power, the inverter control and the grid-side inductive filter preserve acceptable harmonic performance.
Overall, the results show that partial shading considerably influences the entire grid-connected PV chain. The most pronounced effects concern PV power, PV current, inverter current, and the power delivered to the grid. In contrast, the grid voltage remains nearly constant, and the harmonic distortion of the injected current stays below the IEEE-519 reference limit.
The obtained results confirm that partial shading significantly affects the overall performance of the grid-connected photovoltaic (PV) system. The reduction in photovoltaic power under non-uniform irradiance conditions is considerably higher than that expected solely from the decrease in average irradiance. Although the average irradiance after shading represents approximately 63.3% of the uniform irradiance level, the generated PV power decreases by about 43.3%, while additional mismatch-related losses reach nearly 10.5%. This behavior is mainly caused by electrical mismatch between PV sections operating under different irradiance levels. In series-connected PV strings, the most shaded modules limit the current of the entire array, leading to additional power losses beyond those associated with irradiance reduction alone. Similar behaviors under partial shading conditions have been reported in previous studies on PV mismatch phenomena and bypass diode activation mechanisms [34,35].
The results show that partial shading influences the photovoltaic current much more than the voltage. When shading is applied, the array current falls by about 47.4%, while the terminal voltage rises slightly by roughly 6.25%. This behavior is physically expected because the photocurrent scales with the incident irradiance, whereas the voltage is less sensitive and is largely set by the operating point defined by the MPPT converter. Therefore, under partial shading, the loss of output power is driven mainly by current limitation.
The modest rise in PV voltage after shading reflects a shift of the operating point caused by the non-uniform irradiance distribution. In such conditions, the P-V curve usually develops several local maxima, which complicates MPP tracking. The conventional Perturb and Observe algorithm used here can thus introduce additional losses, as it may settle on a local maximum instead of consistently tracking the global MPP. Similar drawbacks of standard MPPT methods under shading have been reported in studies devoted to GMPPT techniques [5,36].
The effect of partial shading propagates through the entire power conversion chain, from the PV generator to the utility grid. The reduction in available DC power directly decreases the inverter output current and the injected grid current, whereas the grid voltage remains practically constant because it is imposed by the electrical network. In addition, the overall PV-grid efficiency decreases slightly from approximately 96.7% under uniform irradiance to nearly 94.1% under partial shading conditions. This result indicates that the main degradation originates from the photovoltaic generator itself, while the power electronic conversion stages maintain relatively stable operating performance despite fluctuating irradiance conditions.
Harmonic analysis further demonstrates that the inverter control strategy and the grid-side filter maintain acceptable power quality under partial shading conditions. The total harmonic distortion (THD) of the injected current remains well below the 5% limit recommended by the IEEE-519 standard. Interestingly, the THD slightly decreases after shading application. This behavior may be attributed to a greater reduction in harmonic components compared with the fundamental current component when the system operates at lower power levels.
Overall, the obtained results demonstrate that partial shading severely degrades the energy production capability of grid-connected photovoltaic systems through mismatch losses, current limitation effects, and operating point displacement. Nevertheless, the inverter and grid interface preserve stable operation and acceptable power quality. Although the developed MATLAB/Simulink model successfully reproduces the electrical behavior of the PV system under partial shading conditions, the present work remains limited to a simulation-based analysis under a specific multi-zone shading profile. Future work should therefore include experimental validation, investigation of dynamic and irregular shading scenarios, and the implementation of advanced GMPPT or adaptive reconfiguration techniques to further improve power extraction under non-uniform irradiance conditions.
This paper presented a MATLAB/Simulink analysis of a grid-connected photovoltaic system under partial shading conditions. The studied system includes the PV array, P&O MPPT controller, DC-DC boost converter, three-phase inverter, grid-side filter, and electrical grid. Under uniform irradiance of 1000 W/m2, the PV system generated approximately 3.0 MW, with about 2.9 MW injected into the grid. When a multi-zone partial shading profile of 800, 600, and 500 W/m2 was applied, the PV power decreased to 1.7 MW, corresponding to a reduction of about 43.3%. The grid-injected power also decreased to 1.6 MW, while the PV-to-grid efficiency decreased from 96.7% to 94.1%.
The FFT analysis showed that the grid current total harmonic distortion remained low, decreasing from 1.49% under uniform irradiance to 0.45% under partial shading. Both values are below the 5% IEEE-519 reference limit, indicating acceptable grid-side harmonic performance under the studied conditions. These results confirm that partial shading significantly reduces PV generation and grid-injected power, mainly due to irradiance non-uniformity and mismatch effects.
From a practical point of view, these results confirm that partial shading can significantly reduce the energy production of grid-connected PV systems, especially in large-scale installations where different PV sections may receive different irradiance levels. Therefore, accurate modeling, efficient MPPT control, and proper grid-side filtering are important to improve the reliability and power quality of PV systems operating under non-uniform irradiance.
The main limitation of this work is that the analysis is based on simulation and on a specific multi-zone partial shading profile. Future work will focus on experimental validation, dynamic shading scenarios, adaptive PV array reconfiguration, and the integration of advanced global MPPT techniques to improve energy extraction under complex partial shading conditions.
Acknowledgement: Not applicable.
Funding Statement: The authors received no specific funding.
Author Contributions: Hamza Kamel: writing—review & editing, software, investigation, formal analysis. Fatima Id Ouissaaden: software, formal analysis. Yassine Essakali: formal analysis. Fahd Elmourabit: formal analysis. Oumaima Mesbahi: visulalization, formal analysis. Said Dlimi: writing—review & editing, supervision, methodology. All authors reviewed and approved the final version of the manuscript.
Availability of Data and Materials: Data will be made available on request.
Ethics Approval: Ethics approval was not required for this study, as it does not involve human participants, animals, or sensitive personal data.
Conflicts of Interest: The authors declare no conflicts of interest.
References
1. Ali Raza M, Zahra S, Raza S, Altimania MR, Hassan M, Munir HM, et al. Mitigating the impact of partial shading conditions on photovoltaic arrays through modified bridge-linked configuration. Sustainability. 2025;17(3):1263. doi:10.3390/su17031263. [Google Scholar] [CrossRef]
2. Osmani K, Haddad A, Jaber H, Lemenand T, Castanier B, Ramadan M. Mitigating the effects of partial shading on PV system’s performance through PV array reconfiguration: a review. Therm Sci Eng Prog. 2022;31(12):101280. doi:10.1016/j.tsep.2022.101280. [Google Scholar] [CrossRef]
3. Bodkhe NA, Sarkar D, Mal R. Partial shading effect on recent PV array configurations and mismatch loss mitigation techniques: an extensive review. Meas Digit. 2026;6(3):100039. doi:10.1016/j.meadig.2026.100039. [Google Scholar] [CrossRef]
4. Lee KT, Nur-E-Alam M, Islam MA. Partial shading impact analysis on solar PV system performance: a MATLAB/SIMULINK study on optimal array configurations. Eng Res Express. 2025;7(2):025368. doi:10.1088/2631-8695/addfac. [Google Scholar] [CrossRef]
5. Pareek S, Ansari MF, Khurana N, Nezami MM, Alharbi SS, Alharbi SS, et al. Performance comparison of interconnection schemes for mitigating partial shading losses in solar photovoltaic arrays. Sci Rep. 2025;15(1):27787. doi:10.1038/s41598-025-12984-7. [Google Scholar] [PubMed] [CrossRef]
6. Belhachat F, Larbes C. Photovoltaic array reconfiguration strategies for mitigating partial shading Effects: recent advances and perspectives. Energy Convers Manag. 2024;313(2):118547. doi:10.1016/j.enconman.2024.118547. [Google Scholar] [CrossRef]
7. Murkute S, Kulkarni Deodhar VA. New high performance PV system architecture for mitigation of partial shading effects. e-Prime Adv Electr Eng Electron Energy. 2023;5(12):100189. doi:10.1016/j.prime.2023.100189. [Google Scholar] [CrossRef]
8. Alombah NH, Harrison A, Mbasso WF, Belghiti H, Fotsin HB, Jangir P, et al. Multiple-to-single maximum power point tracking for empowering conventional MPPT algorithms under partial shading conditions. Sci Rep. 2025;15(1):14540. doi:10.1038/s41598-025-98619-3. [Google Scholar] [PubMed] [CrossRef]
9. Id Ouissaaden F, Kamel H, Elmourabit F, Essakali Y, Dlimi S. Particle swarm optimization-based global MPPT for a standalone PV water pumping system under partial shading. E3S Web Conf. 2026;698(2):02005. doi:10.1051/e3sconf/202669802005. [Google Scholar] [CrossRef]
10. Sezgin-Ugranlı HG. Photovoltaic system performance under partial shading conditions: insight into the roles of bypass diode numbers and inverter efficiency curve. Sustainability. 2025;17(10):4626. doi:10.3390/su17104626. [Google Scholar] [CrossRef]
11. Kamel H, Dlimi S, Ouissaaden FI, Mesbahi O, El Moutaouakil A. Grid integration of photovoltaic systems: modeling, control strategies, and simulation for enhanced performance. Results Eng. 2026;30(1):110691. doi:10.1016/j.rineng.2026.110691. [Google Scholar] [CrossRef]
12. Satpathy PR, Sharma R. Reliability and losses investigation of photovoltaic power generators during partial shading. Energy Convers Manag. 2020;223(16):113480. doi:10.1016/j.enconman.2020.113480. [Google Scholar] [CrossRef]
13. Alves T, N. Torres JP, Marques Lameirinhas RA, F. Fernandes CA. Different techniques to mitigate partial shading in photovoltaic panels. Energies. 2021;14(13):3863. doi:10.3390/en14133863. [Google Scholar] [CrossRef]
14. Rouani L, Harkat MF, Kouadri A, Mekhilef S. Shading fault detection in a grid-connected PV system using vertices principal component analysis. Renew Energy. 2021;164(10006):1527–39. doi:10.1016/j.renene.2020.10.059. [Google Scholar] [CrossRef]
15. Aljafari B, Satpathy PR, Madeti SRK, Vishnuram P, Thanikanti SB. Reliability enhancement of photovoltaic systems under partial shading through a two-step module placement approach. Energies. 2022;15(20):7766. doi:10.3390/en15207766. [Google Scholar] [CrossRef]
16. Demirci A, Dagal I, Mirza Tercan S, Gundogdu H, Terkes M, Cali U. Enhanced ANN-based MPPT for photovoltaic systems: integrating metaheuristic and analytical algorithms for optimal performance under partial shading. IEEE Access. 2025;13(19):92783–99. doi:10.1109/ACCESS.2025.3572554. [Google Scholar] [CrossRef]
17. Yang B, Ye H, Wang J, Li J, Wu S, Li Y, et al. PV arrays reconfiguration for partial shading mitigation: recent advances, challenges and perspectives. Energy Convers Manag. 2021;247(1):114738. doi:10.1016/j.enconman.2021.114738. [Google Scholar] [CrossRef]
18. Youssuf B, Iqbal SJ. Power quality improvement in grid-connected photovoltaic system under partial shading condition. Aust J Electr Electron Eng. 2024;21(2):101–14. doi:10.1080/1448837X.2024.2307841. [Google Scholar] [CrossRef]
19. Kamel H, Id Ouissaaden F, Essakali Y, Elmourabit F, Dlimi S. Performance evaluation of a fuzzy logic-based MPPT algorithm for solar photovoltaic systems. E3S Web Conf. 2026;698:02004. doi:10.1051/e3sconf/202669802004. [Google Scholar] [CrossRef]
20. Dagal I, Ibrahim AW, Harrison A. Leveraging a novel grey wolf algorithm for optimization of photovoltaic-battery energy storage system under partial shading conditions. Comput Electr Eng. 2025;122(1):109991. doi:10.1016/j.compeleceng.2024.109991. [Google Scholar] [CrossRef]
21. Satpathy PR, Ramachandaramurthy VK. An adaptive column-level smart power optimizer with hybrid sensing and black-winged kite algorithm for rooftop PV systems under non-uniform irradiance. Energy. 2026;352(1):140932. doi:10.1016/j.energy.2026.140932. [Google Scholar] [CrossRef]
22. Kushwaha N, Yadav VK, Saha R. Effect of partial shading on photovoltaic systems performance and its mitigation techniques-a review. Energy Sources Part A Recovery Util Environ Eff. 2023;45(4):11155–80. doi:10.1080/15567036.2023.2254731. [Google Scholar] [CrossRef]
23. Mohamed Hariri MH, Mat Desa MK, Masri S, Mohd Zainuri MAA. Grid-connected PV generation system—components and challenges: a review. Energies. 2020;13(17):4279. doi:10.3390/en13174279. [Google Scholar] [CrossRef]
24. Dlimi S, Id Ouissaaden F, El Moussaoui N, Kamel H, El Moutaouakil A, Baghaz E, et al. Modeling, simulation and efficiency assessment of a direct coupled water pumping PV system in semi-arid coastal areas. Energy Convers Manag X. 2024;23:100626. doi:10.1016/j.ecmx.2024.100626. [Google Scholar] [CrossRef]
25. Adak S, Cangi H, Yilmaz AS, Arifoglu U. Development software program for extraction of photovoltaic cell equivalent circuit model parameters based on the Newton-Raphson method. J Comput Electron. 2023;22(1):413–22. doi:10.1007/s10825-022-01969-8. [Google Scholar] [CrossRef]
26. Abdullah G, Nishimura H, Fujita T. An experimental investigation on photovoltaic array power output affected by the different partial shading conditions. Energies. 2021;14(9):2344. doi:10.3390/en14092344. [Google Scholar] [CrossRef]
27. Abad L, Tamalouzt S, Djermouni K, Mekhilef S, Belkhier Y. Analytical modeling of photovoltaic systems under partial shading conditions incorporating bypass and blocking diodes influence. Int J Energy Res. 2025;2025(1):3384091. doi:10.1155/er/3384091. [Google Scholar] [CrossRef]
28. Simon Merthon Ramahaleomiarantsoa A. Study of the behavior of photovoltaic systems under the influence of shading and various bypass diodes configurations. Int J Sci Res. 2024;13(1):1460–6. doi:10.21275/sr24121061132. [Google Scholar] [CrossRef]
29. Id Ouissaaden F, Dlimi S, Kamel H, Mohssin A, Abdelaziz K. Comparative analysis of P&O and fuzzy logic MPPT techniques for photovoltaic systems under standard and partial shading conditions using DC-DC converters. Int J Eng Res Afr. 2025;75(1):159–73. doi:10.4028/p-n9gkzc. [Google Scholar] [CrossRef]
30. Id Ouissaaden F, Kamel H, Dlimi S. Simulation and performance evaluation of a photovoltaic water pumping system with hybrid maximum power point technique (MPPT) for remote rural areas. Processes. 2025;13(9):2867. doi:10.3390/pr13092867. [Google Scholar] [CrossRef]
31. Kumar M, Panda KP, Rosas-Caro JC, Valderrabano-Gonzalez A, Panda G. Comprehensive review of conventional and emerging maximum power point tracking algorithms for uniformly and partially shaded solar photovoltaic systems. IEEE Access. 2023;11(6):31778–812. doi:10.1109/ACCESS.2023.3262502. [Google Scholar] [CrossRef]
32. Gao L. Review of {DC-DC} converters: analysis and applications of buck and boost converters. Appl Comput Eng. 2025;148(1):14–8. doi:10.54254/2755-2721/2025.22314. [Google Scholar] [CrossRef]
33. Kamel H, Ouissaaden FI, El Khaldi S, Dlimi S, Elmourabit F, Aoutoul M, et al. Control of asynchronous machines by flux regulation. In: Proceedings of the 2024 International Conference on Circuit, Systems and Communication (ICCSC); 2024 Jun 28–29; Fes, Morocco. doi:10.1109/ICCSC62074.2024.10617346. [Google Scholar] [CrossRef]
34. Sarkar S, Rao KU, Prema V, Bhaskar MS, Padmanaban S, Bhargav J. A model for effect of partial shading on PV panels with experimental validation. Energy Rep. 2024;12(1):3460–9. doi:10.1016/j.egyr.2024.09.015. [Google Scholar] [CrossRef]
35. Chalh A, El Hammoumi A, Motahhir S, El Ghzizal A, Derouich A, Masud M, et al. Investigation of partial shading scenarios on a photovoltaic array’s characteristics. Electronics. 2022;11(1):96. doi:10.3390/electronics11010096. [Google Scholar] [CrossRef]
36. Ouissaaden FI, Dlimi S, Kamel H, El Khaldi S, Elmourabit F, Khoukh A. Effect of partial shading on a PV system. In: Proceedings of the 2024 International Conference on Circuit, Systems and Communication (ICCSC); 2024 Jun 28–29; Fes, Morocco. doi:10.1109/iccsc62074.2024.10616956. [Google Scholar] [CrossRef]
Cite This Article
 Copyright © 2026 The Author(s). Published by Tech Science Press.
This work is licensed under a Creative Commons Attribution 4.0 International License , which permits unrestricted use, distribution, and reproduction in any medium, provided the original work is properly cited.
 Downloads
 Citation Tools
