
 Submit a Paper
 Propose a Special lssue
 Open Access
ARTICLE

Dual Layer Source Grid Load Storage Collaborative Planning Model Based on Benders Decomposition: Distribution Network Optimization Considering Low-Carbon and Economy
1 North China Branch of State Grid Corporation of China, Beijing, 100032, China
2 NARI Group Corporation (State Grid Electric Power Research Institute), Nanjing, 211100, China
3 Beijing Kedong Electric Power Control System Co., Ltd., Beijing, 100089, China
* Corresponding Author: Jun Guo. Email:
Energy Engineering 2026, 123(2), 4 https://doi.org/10.32604/ee.2025.068894
Received 09 June 2025; Accepted 10 October 2025; Issue published 27 January 2026
 View Full Text
 Download PDF
Abstract
The author proposes a dual layer source grid load storage collaborative planning model based on Benders decomposition to optimize the low-carbon and economic performance of the distribution network. The model plans the configuration of photovoltaic (3.8 MW), wind power (2.5 MW), energy storage (2.2 MWh), and SVC (1.2 Mvar) through interaction between upper and lower layers, and modifies lines 2–3, 8–9, etc. to improve transmission capacity and voltage stability. The author uses normal distribution and Monte Carlo method to model load uncertainty, and combines Weibull distribution to describe wind speed characteristics. Compared to the traditional three-layer model (TLM), Benders decomposition-based two-layer model (BLBD) has a 58.1% reduction in convergence time (5.36 vs. 12.78 h), a 51.1% reduction in iteration times (23 vs. 47 times), a 8.07% reduction in total cost (12.436 vs. 13.528 million yuan), and a 9.62% reduction in carbon emissions (12,456 vs. 13,782 t). After optimization, the peak valley difference decreased from 4.1 to 2.9 MW, the renewable energy consumption rate reached 93.4%, and the energy storage efficiency was 87.6%. The model has been validated in the IEEE 33 node system, demonstrating its superiority in terms of economy, low-carbon, and reliability.Keywords
With the accelerated advancement of global energy transformation, the decarbonization and economic optimization of distribution networks have become core issues in the field of power system planning. Traditional distribution network planning often focuses on single objective optimization, making it difficult to balance multidimensional demands such as renewable energy consumption, energy storage coordinated scheduling, demand response flexibility, and network reconstruction [1,2]. Especially in the context of the “dual carbon” goal, how to achieve a balance between low-carbon and economic benefits through source grid load storage collaborative planning has become an urgent problem to be solved. At the same time, the high proportion of renewable energy access brings about output fluctuations, load uncertainties, and complex system interactions, further exacerbating the complexity of planning models. It is urgent to explore efficient and global collaborative optimization methods [3].
In recent years, scholars have conducted extensive research on the coordinated planning of source load storage in distribution networks. Tingting Lin et al. proposed a calculation method that considers source load uncertainty and active management for the carrying capacity of distributed photovoltaic access. They quantified the impact of photovoltaic penetration rate on voltage stability through Monte Carlo simulation, but their research was limited to static planning and did not delve into dynamic collaborative mechanisms at multiple time scales [4]. Jiangang Lu et al. further focused on multi time scale source load prediction and designed a joint optimization scheduling strategy for active distribution networks and microgrids, achieving short-term power balance through hierarchical control. However, their model still adopts the traditional three-layer architecture, with insufficient information exchange between the upper and lower layers, which can easily fall into local optima [5]. Junhui Li et al. proposed a two-stage planning framework for distributed power generation and energy storage, combined with partition control to optimize resource allocation, significantly improving system flexibility. However, the synergistic effect of network topology reconstruction and reactive power compensation equipment was not fully considered, resulting in limited voltage regulation capability [6]. Zhang et al. introduced distributed energy and load uncertainty modeling in source load storage collaborative scheduling, and used stochastic programming methods to enhance robustness. However, its solving efficiency is limited by high-dimensional nonlinear models, which are difficult to adapt to the real-time needs of large-scale distribution networks [7]. The above research has made significant progress in uncertainty handling, multi-objective collaboration, and hierarchical optimization, but there are still bottlenecks such as weak model interactivity, high computational complexity, and insufficient global optimization capabilities.
The current research on collaborative planning of distribution networks faces multiple challenges. Firstly, traditional hierarchical models (such as the three-layer planning scheduling reconstruction framework) often adopt a one-way information transmission mechanism, and the planning layer and the operation layer lack effective feedback, resulting in a disconnect between resource allocation and real-time scheduling, making it difficult to achieve global optimality [8]. Secondly, the high proportion of renewable energy and load uncertainty exacerbate the complexity of the model. Existing methods often rely on simplified assumptions or a single probability distribution when dealing with multi-source heterogeneous data, which reduces the robustness of the planning scheme. Thirdly, existing research often focuses on a single objective (such as economy or low-carbon), lacking an optimization mechanism that comprehensively considers multi-objective collaboration, and the solving algorithm has shortcomings in convergence speed and solution set diversity [9]. In addition, the synergistic effect of network reconstruction, reactive power compensation, and energy storage scheduling has not been fully explored, which restricts the overall energy efficiency improvement of the system.
In response to the above issues, the author proposes a dual layer source grid load storage collaborative planning model based on Benders decomposition, aiming to achieve a balanced optimization of low-carbon and economic distribution networks. The upper level planning model uses a multi-objective optimization algorithm (improved non dominated sorting genetic algorithm INSGA-II) to coordinate equipment investment, network reconstruction, and carbon emission costs, generating a Pareto optimal solution set [10,11]; The lower level scheduling reconstruction model adopts linearized power flow and parallel computing technology to quickly solve source storage output, demand response, and topology optimization strategies, and feeds back to the upper level through Benders cuts, forming a bidirectional interaction mechanism. The model innovatively introduces adaptive cut selection strategy and trust domain constraints, significantly improving decomposition efficiency; At the same time, by combining normal distribution and Weibull distribution to characterize source load uncertainty, and integrating SVC reactive power compensation and line modification decision-making, voltage stability and transmission capability are enhanced [12]. By improving the algorithm architecture and collaborative optimization mechanism, the author achieved efficient coupling between planning and operation layers while reducing computational complexity, providing theoretical support and practical solutions for global optimization of distribution networks under high proportion renewable energy access.
2 Modeling of Source Network Load Storage System
The active power output of photovoltaic power generation can be expressed as formula (1):
Among them,
The working temperature of photovoltaic cells is related to the ambient temperature and solar radiation intensity, and can be calculated using the following formula (2):
Among them,
The output power of a wind turbine can be expressed as formula (3):
Among them,
Wind speed has randomness and volatility. In order to accurately describe the statistical characteristics of wind speed, Weibull distribution is usually used for modeling, as formula (4):
Among them,
Photovoltaic power generation and wind power generation, as typical PQ nodes, have their active output determined by natural resources, and their reactive output needs to be reasonably controlled to maintain system voltage stability [13,14]. The processing of PQ nodes mainly includes two aspects: node power balance constraints and inverter capacity constraints.
The constraint of node power balance can be expressed as formula (5):
Among them,
For renewable energy access points, inverter capacity constraints are an important condition for ensuring the safe operation of equipment, as formula (6):
Among them,
In the source grid load storage collaborative planning, PQ node processing needs to consider the system characteristics under steady-state and transient conditions in a coordinated manner [15]. For steady-state analysis, the following PQ node power flow equations need to be solved, as formula (7):
Among them,
The author uses normal distribution to model load uncertainty and combines Monte Carlo simulation method to generate load scenarios [16]. Considering the seasonal and temporal variation characteristics of the load, the load value of the i-th load node at time t is modeled as follows, as formula (8):
In the formula,
The author models demand response into two categories: price based demand response and incentive based demand response. Price based demand response is based on the time price mechanism, where users actively adjust their electricity consumption behavior according to the price signal [17,18]; Incentive demand response is initiated by the power grid dispatch, and users accept load reduction instructions as agreed and receive corresponding compensation.
For price based demand response, the electricity price elasticity coefficient method is used to model, and the relationship between load adjustment and electricity price changes is expressed as formula (9):
In the formula,
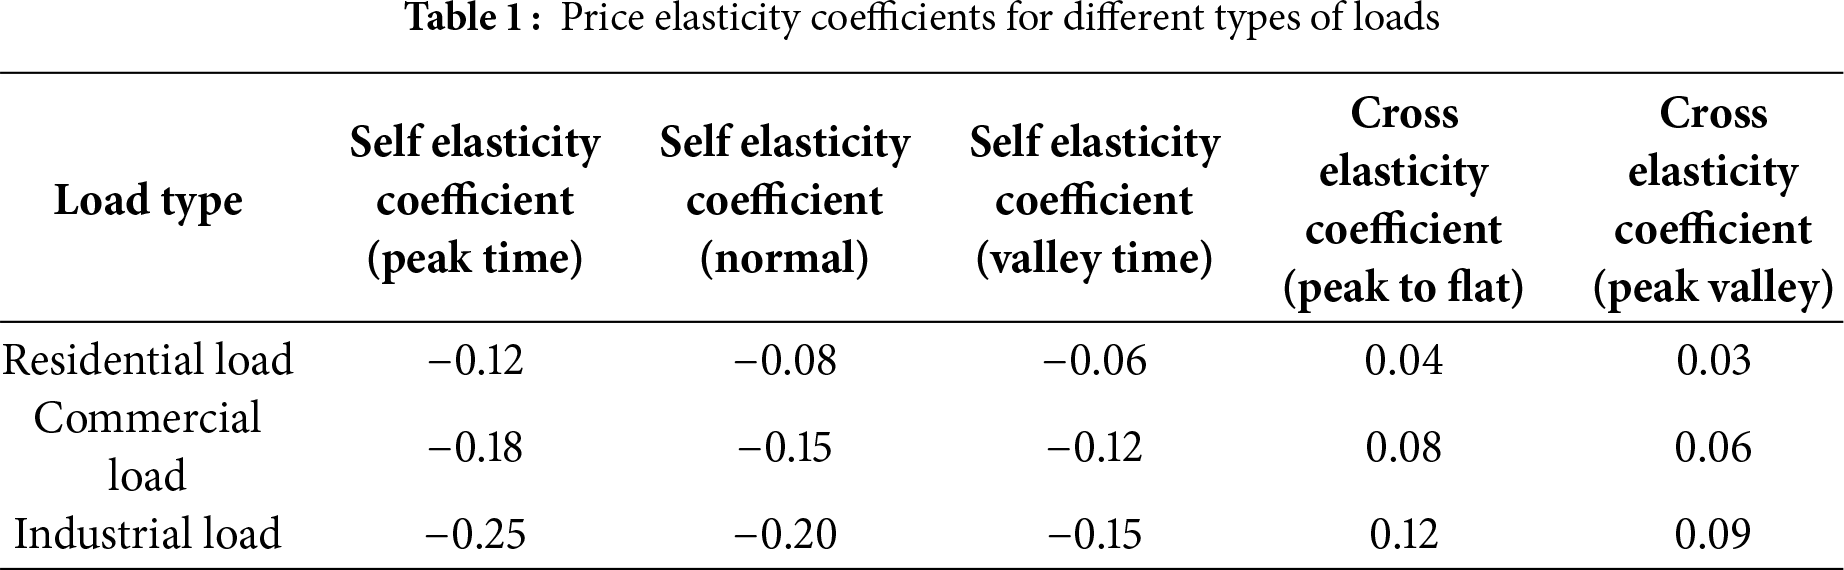
The electricity price elasticity coefficient matrix includes self elasticity coefficients (diagonal elements) and cross elasticity coefficients (non diagonal elements), as shown in Table 1:
For incentive based demand response, model the relationship between load reduction and compensation amount. The amount of load reduction is limited by the adjustable load ratio, expressed as formula (10):
In the formula,
The compensation cost for incentive based demand response is formula (11):
In the formula,
Considering user comfort constraints, the total adjustment amount of demand response should satisfy energy conservation, that is formula (12):
In this study, the topology of the distribution network is represented by an undirected graph G (V, E), where V represents a set of nodes, including distribution substation nodes, load nodes, and branch nodes; E represents the set of lines, representing the physical connections between nodes. In order to characterize the operational status and topology reconstruction capability of the distribution network, a connection state matrix S is introduced, defined as follows (13):
The connection state matrix is a key parameter that describes the current topology state of the distribution network and is also one of the decision variables for lower level scheduling reconstruction optimization. Based on this, a node connectivity matrix C can be introduced to represent the connectivity relationship between nodes, as formula (14):
The node connectivity matrix reflects the number of connections between node i and its nodes in the network, and is an important indicator for evaluating node importance and network robustness.
The distribution network adopts a π-type equivalent circuit model, which includes two parameters: Line impedance and ground admittance. Considering the relatively small capacitance to impedance ratio of the transmission line and its limited impact on ground admittance, the main focus is on modeling the impedance parameters of the transmission line [19,20]. The definition of line impedance parameters is as follows (15):
Among them,
In the formula,
Based on the line parameter model, the power loss of the line can be calculated, as formula (17):
In the formula,
In terms of operational constraints in the distribution network, line parameters are directly associated with the following constraints, as formula (18):
Among them,
In order to accurately describe the state of circuit breakers and their impact on network topology, circuit breaker state variables are introduced, as formula (19):
The status of the circuit breaker is closely related to the status of the line connection. When there is a circuit breaker on the line, the status of the line connection is controlled by the status of the circuit breaker, as formula (20):
Among them,
In planning decisions, the installation location of circuit breakers is a key variable, which can be expressed as formula (21):
Considering the actual needs and economy of circuit breaker installation, the following constraints need to be introduced, as formula (22):
Circuit breaker operation is also an important consideration factor in the reconstruction process, and the number of circuit breaker operations per reconstruction should be within a reasonable range, as formula (23):
In the formula,
In this study, SVC is considered as a controllable reactive power source with fast and continuous reactive power regulation capability. The core working principle of SVC is to achieve rapid adjustment of reactive power through a controllable combination of reactors and capacitors [21,22]. In order to describe the working characteristics of SVC, the following mathematical model is introduced, as formula (24):
Among them,
In the formula,
In planning problems, the capacity and installation location of SVC are important decision variables. To this end, an installation decision variable is introduced, as formula (26):
Based on installation decisions, the capacity constraint of SVC can be expressed as formula (27):
Among them,
SVC directly affects the node voltage level by regulating reactive power, which can be represented by sensitivity coefficients, as formula (28):
In the equation,
At the planning level, considering the requirements for system voltage quality and reactive power balance, the total installed capacity and quantity of SVC must meet the following constraints, as formula (29):
Among them,
2.4 Energy Storage Side Modeling
The mathematical expression for modeling energy storage capacity is as follows (30):
Among them,
The capacity of energy storage systems is constrained by upper and lower limits, as formula (31):
Among them,
The modeling of energy storage charging and discharging characteristics needs to consider factors such as charging and discharging power constraints, state of charge (SOC) constraints, evolution laws of SOC, and charging and discharging efficiency. In the author’s source network load storage collaborative planning model, the energy storage charging and discharging characteristics serve as important constraints for lower level scheduling reconstruction optimization, directly affecting the system’s operational effectiveness [23].
The charging and discharging power constraints of energy storage systems can be expressed as formula (32):
Among them, $
The State of Charge (SOC) constraint of an energy storage system can be expressed as formula (33):
Among them,
The temporal evolution law of the state of charge of the energy storage system can be expressed as formula (34):
Among them,
In order to ensure the long-term cyclic use of energy storage systems, it is usually necessary to consider the energy storage daily cycle constraint, that is, the state of charge of the energy storage system at the end of a typical day should be the same or close to the initial state, as formula (35):
Among them,
In practical applications, the charging and discharging characteristics of energy storage also need to consider battery aging and lifespan degradation. The author uses a lifespan model based on rainflow counting to evaluate the lifespan consumption of energy storage systems, as formula (36)
Among them,
3 A Dual Layer Source Network Load Storage Collaborative Planning Model Based on Benders Decomposition
3.1 Upper Level Planning Model
(1) Objective Function
As the core decision-making layer of the dual layer source network load storage collaborative planning, the upper level planning model mainly considers the long-term planning cost and environmental impact of the system, including equipment investment cost, operating cost, and carbon emission cost. By comprehensively considering these factors, a balance between the economic and low-carbon aspects of distribution network planning can be achieved [24]. The objective function of the upper level planning model can be expressed as formula (37):
Among them, F represents the comprehensive objective function,
The economic objective F1 mainly considers equipment investment costs and operating costs, expressed as formula (38):
Among them,
The calculation expression for investment cost C_inv is as follows (39) and (40):
The expression for operating cost
Low carbon target
Among them,
(2) Constraints
Equipment capacity constraint:
The capacity of distributed power sources and energy storage systems must be within the allowable range and associated with installation decision variables, as formula (42):
Among them,
Equipment quantity constraint:
The installation quantity of various devices needs to meet corresponding restrictions, as formula (43):
Among them,
Investment budget constraints:
The total investment cost must be controlled within the budget range, as formula (44):
Among them,
Network topology constraints:
The distribution network must maintain a radial structure, which can be achieved through the following constraints, as formula (45):
Among them,
Among them,
Circuit breaker configuration constraints:
The installation of circuit breakers must be on the constructed lines, as formula (47):
Among them,
Benders decomposition related constraints:
In the solving process based on Benders decomposition, the upper level planning model also needs to introduce Benders cut constraints generated by lower level subproblems, as formula (48):
Among them,
Boundary Conditions and Assumptions:
Grid Topology: The distribution network maintains a radial structure (Eqs. (45) and (46)).
Equipment Lifetimes: PV/Wind (20 years), energy storage (10 years), lines/circuit breakers (30 years), SVC (25 years).
Investment Budget: Total investment cost
Renewable Integration Limits: PV capacity ≤ 3.8 MW, wind ≤ 2.5 MW, storage ≤ 2.2 MWh, SVC ≤ 1.2 Mvar (Section 5.2).
Carbon Policy: Carbon price fixed at 60 RMB/t (based on China’s 2019–2023 carbon market trends).
Uncertainty Handling: Load follows normal distribution; wind speed follows Weibull distribution.
3.2 Lower Level Scheduling Refactoring Model
(1) Objective function
The core task of the lower level scheduling reconstruction model is to achieve collaborative optimization operation of source network load storage based on the given upper level planning decision results. The objective function mainly considers three aspects: minimizing operating costs, minimizing network losses, and minimizing voltage deviation [25]. Taking into account these three objectives, the objective function of the lower level model can be expressed as formula(49):
Among them, w1, w2, and w3 are the weight coefficients of the three sub objectives, and T is the number of time periods within the planning period.
The operating cost objective function
In the formula,
The network loss objective function
Among them,
The voltage deviation objective function
In the formula,
(2) Constraints
Power balance constraint, as formula (53):
Among them,
Trend constraints, as formula (54):
In the equation, (i, j) represents the line from node i to node j, and
Line capacity constraint, as formula(55):
Among them,
Node voltage constraint, as formula (56):
In the formula,
Among them, the first constraint ensures that the number of connected lines is equal to the number of nodes minus 1, and the second constraint prevents the formation of loops.
4 Solution Method for Dual Layer Collaborative Planning Model
4.1 Solution of Upper Level Planning Model
For the upper level optimization problem of source grid load storage collaborative planning in distribution networks, it is necessary to simultaneously optimize both economic and low-carbon objectives, which belongs to a multi-objective optimization problem. The traditional non dominated sorting genetic algorithm (NSGA-II) has limitations in maintaining diversity and slow convergence speed when solving such complex problems [26]. To this end, the author proposes an improved non dominated sorting genetic algorithm (INSGA2), which enhances the algorithm’s global search capability and solution diversity by optimizing population initialization, normal distribution crossover, and adaptive mutation strategies.
The specific process of NSGA2 algorithm is as follows: Firstly, initialize the population and generate N feasible individuals, each representing a planning scheme (including device location and capacity); Next, calculate the objective function values for each individual, namely economic cost and carbon emissions; Subsequently, the population is divided into different levels through non dominated sorting, and normalized crowding distances are calculated for individuals of the same level to maintain solution diversity
The formula is as follows (58):
Among them, f is the target value.
Afterwards, based on the level and crowding distance, selection is made using normal distribution crossover and adaptive mutation to generate new individuals, and elite individuals are retained after merging the parent and offspring; Finally, iterate until the termination condition is met, extract the first non dominated layer from the final population, and generate the Pareto optimal frontier.
The generated Pareto front exhibits a convex characteristic, reflecting the trade-off between economy and low carbon: the left side of the front corresponds to solutions with low carbon emissions but high costs, suitable for environmental priority scenarios; The solution on the right corresponds to low cost but high carbon emissions, suitable for scenarios with strict economic constraints; The middle area provides a balanced solution [27]. In order to evaluate cutting-edge quality, quantitative analysis is conducted using convergence degree (CD), diversity index (DI), hypervolume index (HV), and coverage index (CR). To support decision-making, this article uses the fuzzy satisfaction method to select the compromise solution with the highest comprehensive satisfaction from the Pareto frontier. The satisfaction calculation is (59):
4.2 Lower Level Scheduling Refactoring Model Solution
The lower level model processes source storage output, demand response, and network topology optimization, and solves them through linear programming to reduce difficulty and improve efficiency. The sub problem is solved by approximating the power flow equation through DC power flow or linearizing the AC power flow method, linearizing the voltage constraint and demand response model, and the standard form is (60):
Among them, x includes source storage output, demand response, and network topology variables: c, A, b, etc. represent objective function coefficients and constraint conditions. Using efficient interior point method or simplex method to solve, discrete variables (such as switch states) are processed through relaxation and branch and bound, and linearization step size and relaxation factor need to balance accuracy and efficiency.
The lower level subproblems have scene independence and are suitable for parallel computing. Adopting multi-core CPU parallel (master-slave architecture) and GPU accelerated computing, the main process allocates tasks, the sub problems are solved by the sub processes, and the dynamic load balancing strategy optimizes allocation based on the complexity of the sub problems. The parallel computing time is (61):
Among them,
4.3 Solving Algorithm Based on Benders Decomposition
The main problem aims to minimize investment and operating costs, with the objective function being (62):
Among them,
The sub problem aims to optimize operating costs and constraints, with the objective function being (63):
Among them,
The Benders decomposition algorithm iteratively solves the main problem and sub problems, gradually approaching the global optimal solution, and is suitable for solving two-layer models. The main problem is responsible for planning and decision-making (such as equipment location and capacity), and the sub problems verify operational feasibility and generate constraints (cuts) for feedback to the main problem.
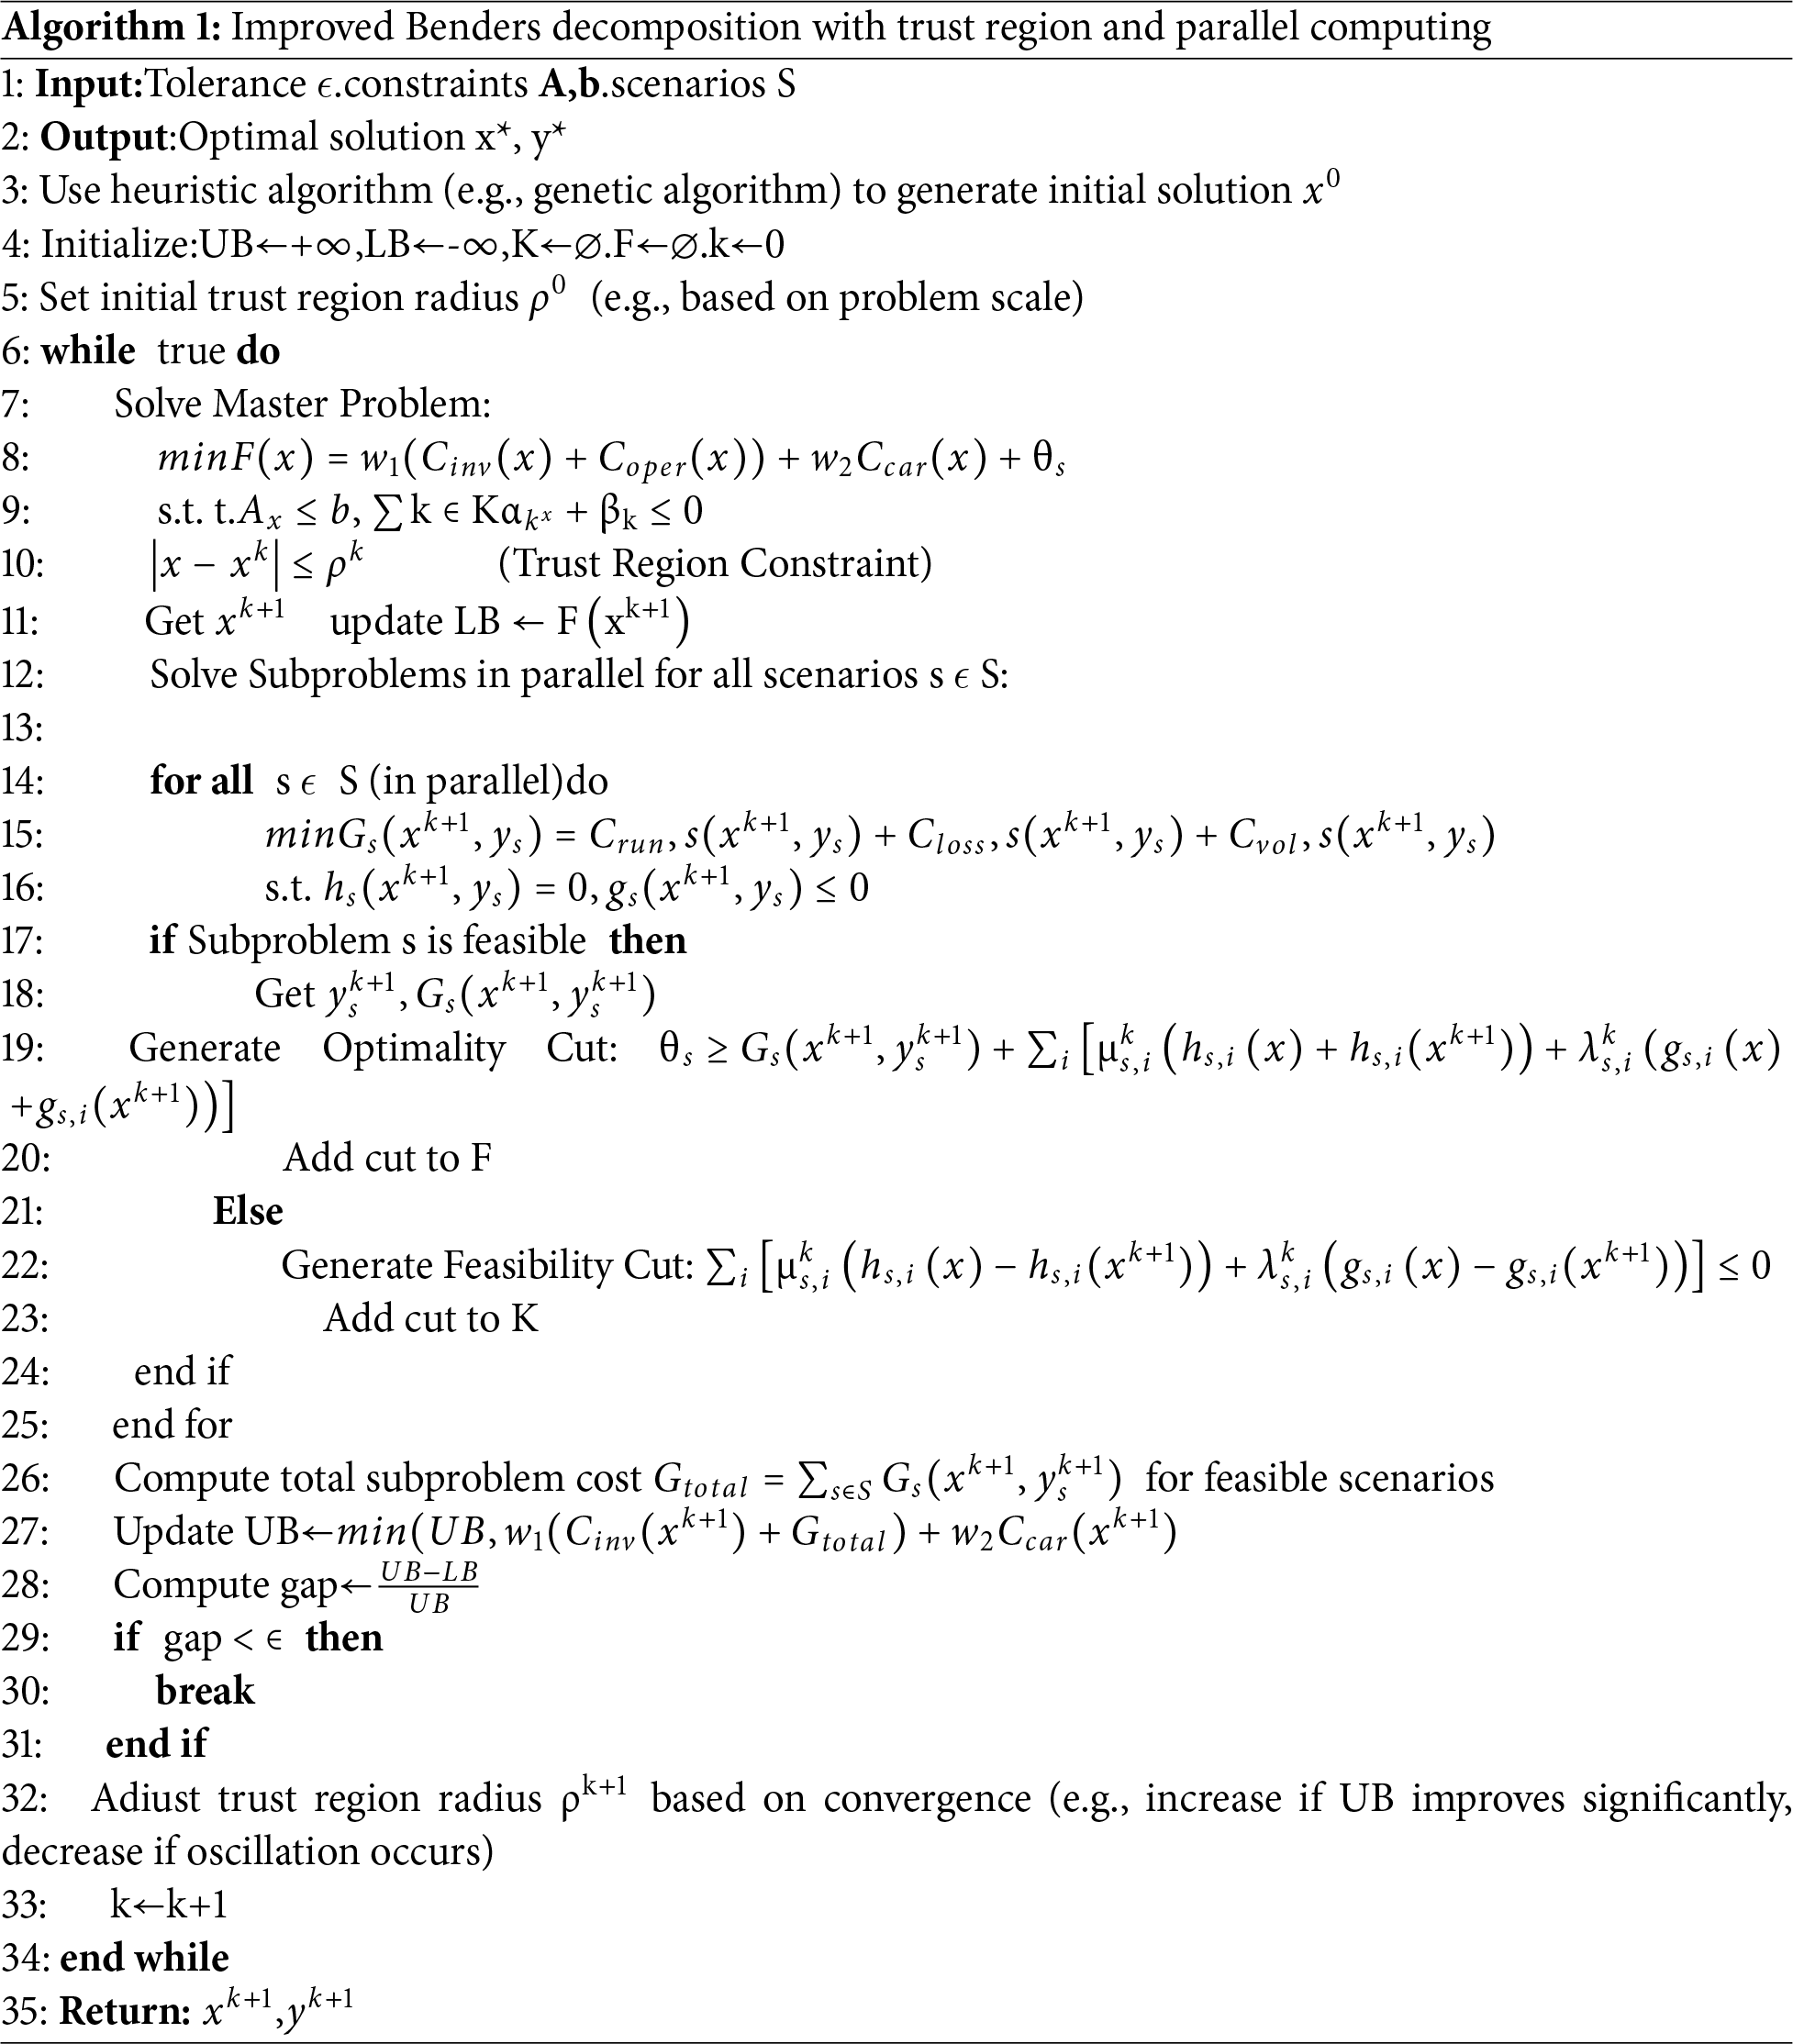
The Benders iteration process first initializes the main problem solution x0, upper and lower bounds UB = +∞, UB = −∞, cut set K = ∅, F = ∅, and convergence tolerance ε. Then enter iteration: obtain xk and the lower bound LB by solving the main problem, and then substitute xk into the subproblem for solution; If the subproblem is feasible, update the upper bound UB and generate the optimal cut added F, otherwise generate a feasible cut added K; Finally, check the gap. If it is satisfied, output the optimal solution xk, yk. Otherwise, update k = k + 1 and continue iterating.
In order to improve the efficiency of iterative interaction, the author adopted the following improvement strategies:
In order to improve the efficiency of Benders decomposition iteration interaction, the author adopted the following improvement strategy: firstly, introducing trust domain constraints to limit the change amplitude of decision variables in each iteration in the main problem (represented by the trust domain radius ρk of the k th iteration, and dynamically adjusted according to the convergence of previous iterations), in order to avoid drastic fluctuations in the solution and accelerate convergence; Secondly, parallel subproblem solving techniques are employed to simultaneously handle subproblems from multiple typical scenarios or time periods, generating multiple effective cuts to increase the amount of information in each iteration; Finally, high-quality initial solutions are generated through heuristic algorithms, providing a good starting point for Benders decomposition and reducing the number of iterations.
Algorithm 1 shows the pseudocode for improving Benders decomposition, and Fig. 1 shows the overall algorithm flowchart.
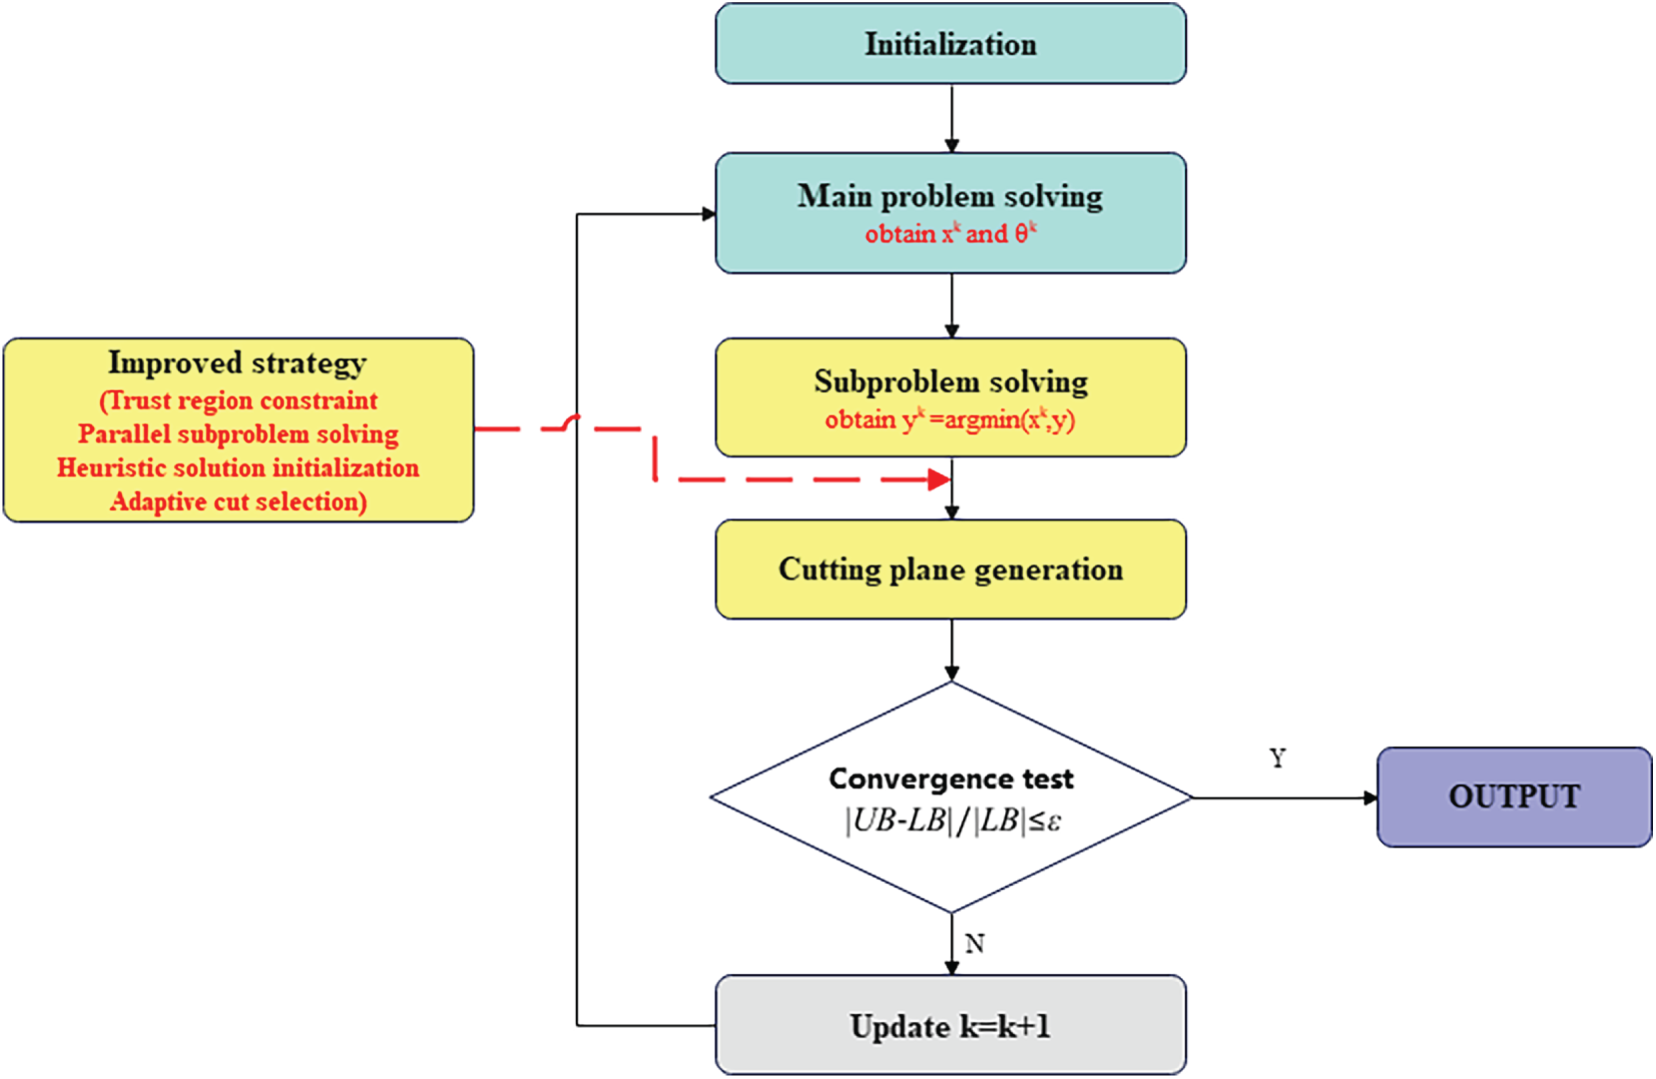
Figure 1: Process of generative interaction mechanism based on Benders decomposition
Benders Decomposition Workflow, Illustrated in Fig. 1:
Upper → Lower: Sends planning decisions (equipment locations/capacities, line modifications).
Lower → Upper:
If feasible: Returns optimality cuts (cost/emission feedback) to refine planning.
If infeasible: Returns feasibility cuts (e.g., voltage violations) to reject invalid plans.
Adaptive Cut Selection: Only cuts improving solution by >5% are retained (avoiding redundant iterations).
In order to validate the dual layer source network load storage collaborative planning model based on Benders decomposition, the author constructed an efficient simulation environment. In terms of hardware, it adopts Intel Xeon E5-2680 v4 processor (3.4 GHz, 16 cores, 32 threads, 64 GB memory), 1 TB SSD hard drive, and NVIDIA Tesla V100 GPU acceleration card, supporting parallel computing and fast data processing; In terms of software, MATLAB R2022b is the main platform, integrating MATPOWER 7.1 (power flow calculation), CPLEX 20.1 (linear programming solution), YALMIP (modeling), Global Optimization Toolbox (INSGA-II implementation), Parallel Computing Toolbox (parallel computing), and Origin 2022 (data visualization), running on Windows 11 Professional Edition system. The simulation environment improves algorithm efficiency and experimental flexibility through multi-threaded parallel computing, adaptive cutting surface selection, and structured database design, supporting multi scenario batch computing and sensitivity analysis.
The author conducted a case study based on an improved IEEE 33 node distribution network system (total load of 3.715 MW, 2.3 MVar, rated voltage of 12.66 kV, 33 nodes and 32 branches), and optimized and adjusted it to meet the requirements of source grid load storage collaborative planning. The planning parameters include a 15 year planning period, an 8% discount rate, equipment lifetimes of 30 years for the line and circuit breaker, 20 years for photovoltaic and wind power generation, 10 years for energy storage, and 25 years for SVC devices; The cost parameters include photovoltaic 6000 yuan/kW, wind turbine 8000 yuan/kW, energy storage 1200 yuan/kWh, line renovation 200 yuan/m, circuit breaker 50,000 yuan/set, and SVC 20,000 yuan/MVar. The analysis of low-carbon economy is based on a carbon price of 60 yuan/t (referring to the trend of China’s carbon trading market from 2019 to 2023), with a peak to valley ratio of 3:1 for time of use electricity prices (average 0.8 yuan/kWh), a maximum reduction of 15% in demand response (2 h, compensation of 1.2 yuan/kWh), and carbon emission coefficients of 12 and 22 g/kWh for photovoltaic and wind power generation, respectively. In terms of algorithm parameters, INSGA-II has a population size of 100, 200 iterations, a crossover probability of 0.9, and a mutation probability of 0.1; Benders decomposition has a convergence tolerance of 0.1%, a maximum of 50 iterations, and an adaptive cut threshold of 0.05.
In order to comprehensively evaluate the performance of the dual layer source network load storage collaborative planning model based on Benders decomposition, this study selects three comparative methods. The TLM model adopts a three-layer planning scheduling reconstruction model, which optimizes each layer using INSGA-II, optimized flow, and IGA. However, due to the lack of global feedback in one-way information transmission, the solution may not be economical or feasible. The SBD model uses traditional Benders decomposition and NSGA-II double-layer optimization, with low efficiency and slow convergence in generating standard cuts, and is not optimized for distribution networks. The BLBD model is based on improved Benders decomposition and INSGA-II, with dual objective optimization of economy and low carbon. Its innovations include adaptive cut selection, parallel computing, normal distribution crossover, and all factor collaborative optimization. All methods are tested under the same hardware, case system, and data, with consistent termination conditions. Evaluation metrics include planning quality (total cost, carbon emissions, equipment rationality), algorithm performance (convergence, Pareto distribution), and computational efficiency (time, memory usage).
Based on the improved IEEE33 node distribution network analysis, the optimal equipment location and capacity configuration for source grid load storage collaborative planning are selected, and representative solutions from the Pareto optimal solution set are chosen to balance carbon emissions and economy. The planning results show that the photovoltaic system is configured at nodes 8 (0.8 MW), 16 (1.2 MW), 24 (1.2 MW), and 32 (0.6 MW), with a total capacity of 3.8 MW, prioritizing the use of high-quality irradiation resources; Wind power generation is configured at nodes 11 (0.8 MW), 21 (0.7 MW), and 29 (1.0 MW), with a total capacity of 2.5 MW and well matched wind conditions; The energy storage system is distributed at nodes 6 (0.5 MWh), 13 (0.8 MWh), 18 (0.4 MWh), and 25 (0.5 MWh), with a total capacity of 2.2 MWh, optimized for power regulation. In addition, the lines 2–3, 8–9, 15–16, 24–25, 28–29 will be renovated and SVC will be configured at nodes 7 (0.4 Mvar), 19 (0.5 Mvar), and 30 (0.3 Mvar) to improve transmission capacity and voltage stability, as shown in Fig. 2.
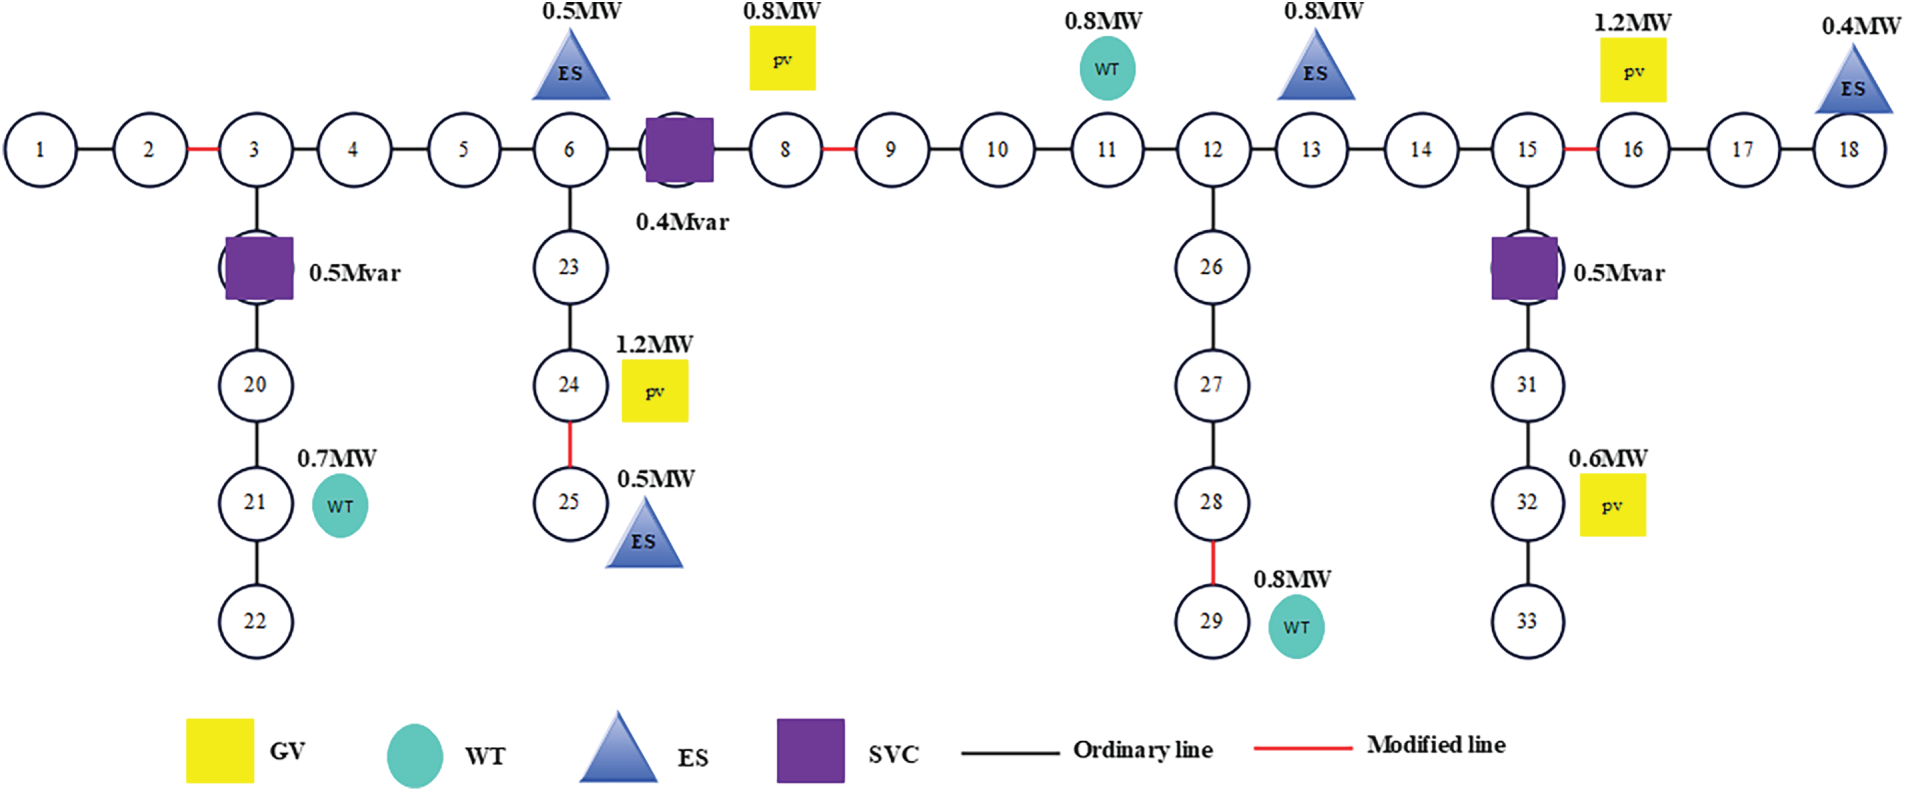
Figure 2: Schematic diagram of IEEE33 node system source network load storage collaborative planning configuration
(1) Comparison with TLM model
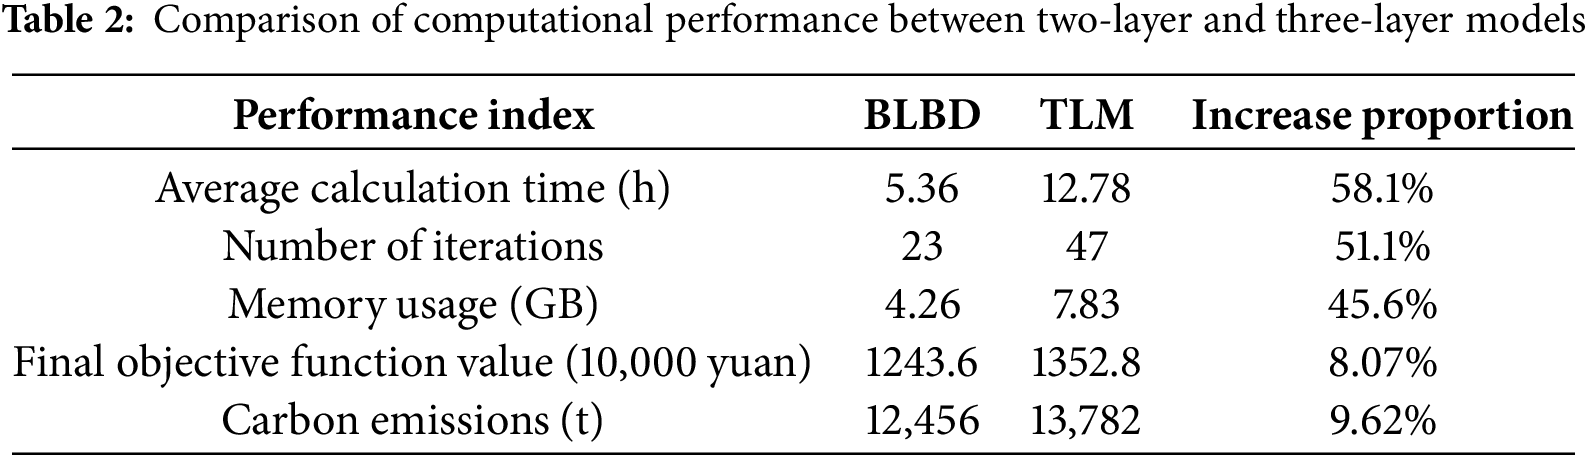
The original three-layer model is difficult to achieve global optimality due to limited information transmission, while the two-layer model achieves interaction between the upper and lower layers through Benders decomposition, which is theoretically more optimal. Table 2 shows that the double-layer model reduces computation time by 58.1% (5.36 vs. 12.78 h), iteration times by 51.1% (23 vs. 47 times), memory usage by 45.6% (4.26 vs. 7.83 GB), total cost by 8.07% (12.436 vs. 13.528 million yuan), and carbon emissions by 9.62% (12,456 vs. 13,782 t), thanks to sub problem decomposition and cutting plane acceleration. Mathematically, the original three-layer objective function lacks feedback, while the two-layer model updates the lower layer information through θ estimation and Benders cuts to enhance interactivity. The example shows that the dual layer model optimizes the configuration of photovoltaic, wind power, and energy storage, especially in distributed energy storage site selection and capacity, supporting peak shaving and valley filling, and renewable energy consumption, reflecting global optimality. Overall, the two-layer model outperforms the three-layer model in terms of efficiency and solution quality, validating the effectiveness of the method.
(2) Comparison with SBD model
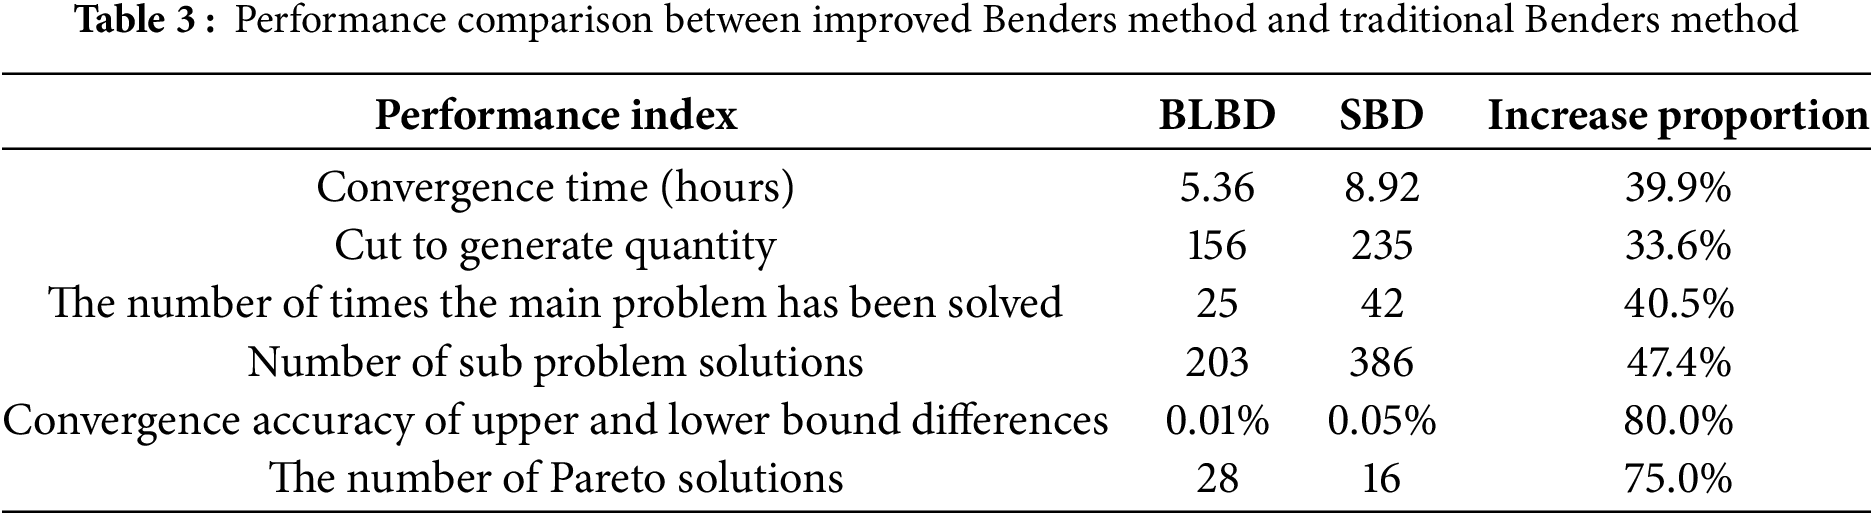
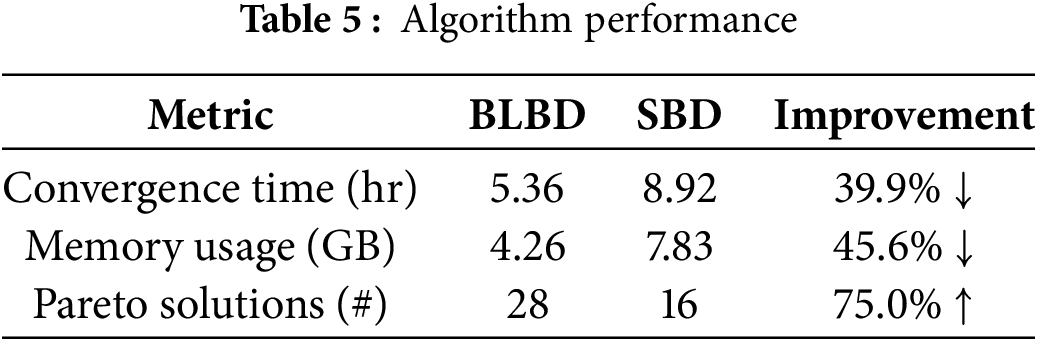
This section compares the performance of the improved Benders decomposition method with traditional methods to verify the superiority of the algorithm. The improvements include parallel subproblem solving, adaptive cut selection, and normal distribution crossover mechanism. Table 3 shows that the improved method reduces convergence time by 39.9% (5.36 vs. 8.92 h), cuts generation by 33.6% (156 vs. 235), sub problem solving times by 47.4% (203 vs. 386), upper and lower bound accuracy by 0.01% (better than traditional 0.05%), and Pareto solution count by 75% (28 vs. 16), benefiting from adaptive cut selection and parallel computing. Mathematically, traditional methods use a single cut constraint, while improved methods optimize the solution by adaptively selecting an effective cut set, and cross improve the Pareto front uniformity and coverage range through normal distribution.
(3) Comparison of convergence speed
Compare the convergence performance of three models. The three algorithms run in the same hardware environment (Intel i9-9900K, 64 GB memory) and under consistent initial conditions, with the convergence criterion being that the relative difference between the primary and secondary problems is less than 0.1% or the number of iterations reaches 100. In IEEE 33 node system testing, the model proposed by the author only requires an average of 19.6 iterations and 24.3 min to converge, which is significantly better than the SBD model (43.8 iterations, 45.7 min) and TLM model (65.7 iterations, 92.1 min) (see Fig. 3), saving 46.8% and 73.6% of time, respectively. In addition, the convergence threshold satisfaction rate of the model proposed by the author is 98.5%, which is superior to the other two methods.
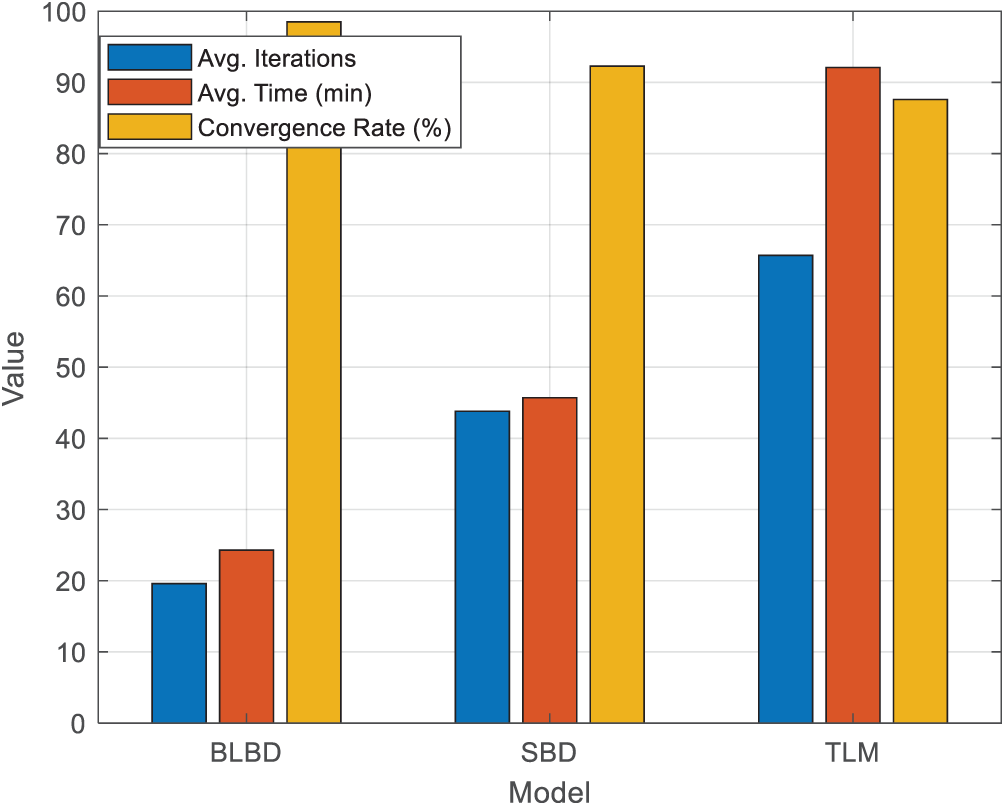
Figure 3: Comparison of convergence performance among three models
Its performance advantages mainly come from: ① Adaptive cut generation strategy; ② Parallel solving of subproblems; ③ Variable filtering mechanism reduces search space; ④ Hot start of sub problems reduces solving time. The convergence curve shows that the model proposed by the author has approached the optimal solution in the first 15 iterations.
(4) Quality Comparison of Solutions
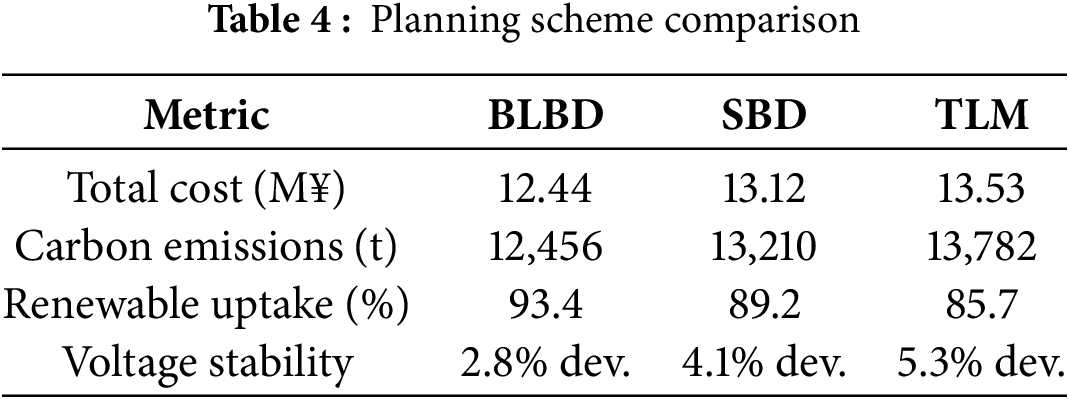
Compare the BLBD model with the SBD and TLM models from four aspects: economy, low-carbon, power grid reliability, and stability (see Fig. 4). The results showed that the BLBD model performed well in all indicators: The annual total cost was 8.264 million yuan, which was 3.7% and 8.2% lower than SBD and TLM, respectively; The carbon emissions were 4876 t, a decrease of 2.1% and 5.8% respectively; The power grid loss rate and maximum voltage deviation are 3.2% and 2.8%, respectively, which are better than the comparison model.
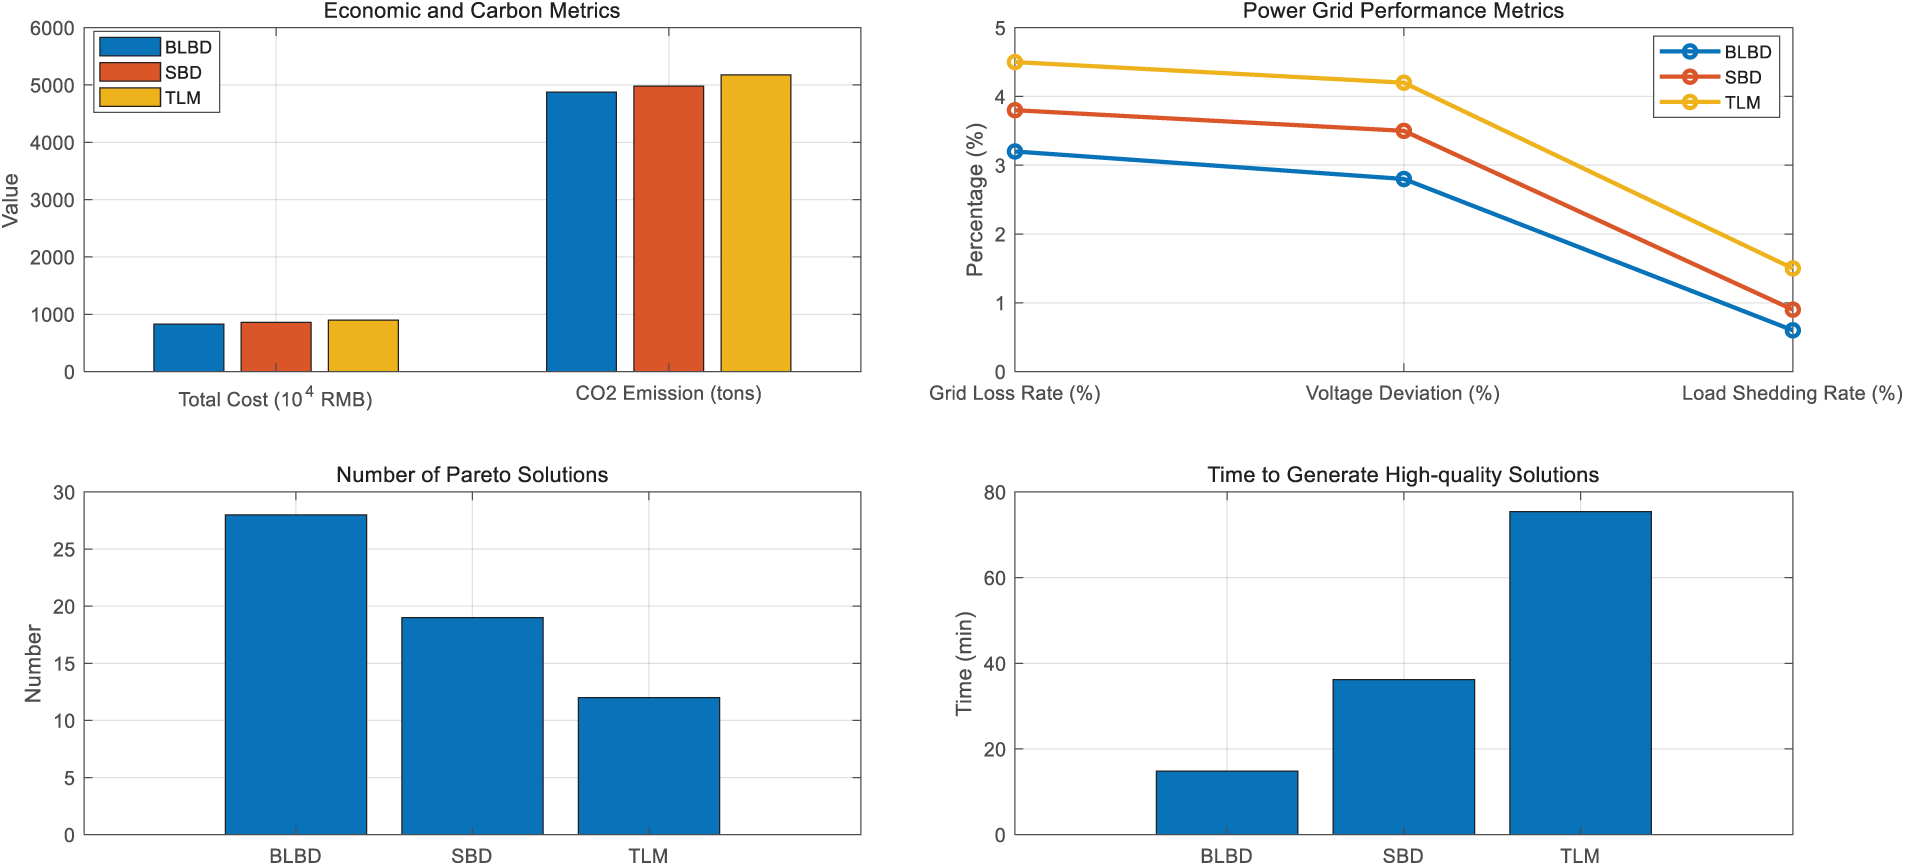
Figure 4: Comparison of optimal solution quality among three models
In addition, the BLBD model can generate 28 Pareto solutions, significantly more than SBD (19) and TLM (12), providing richer options for multi-objective decision-making. Its time to generate high-quality solutions is only 14.8 min, significantly faster than other models. Based on the estimated investment scale of the national distribution network, the BLBD model has the potential to save approximately 16.6 billion yuan in investment annually and achieve carbon emissions reduction of over 2.1%.
Visual enhancements are shown in Tables 4 and 5:
5.3 Analysis of Planning Results Based on BLBD Model
(1) Source storage output curve
On a representative spring working day, the photovoltaic output exhibits a typical “hump” shape, reaching a peak of 3.5 MW from 10–14 o’clock, slightly lower than the total installed capacity of 3.8 MW. Due to the influence of local cloud cover, the photovoltaic output curves of multiple nodes complement and smooth each other. Wind power generation and photovoltaics form complementary characteristics, with higher output at night and in the morning (peak of 2.2 MW from 2–5 o’clock), decreasing to around 0.8 MW at noon, in line with the daily variation pattern of local wind resources. The energy storage system charges 1.8 MW at 3 am (absorbing excess wind power) and discharges 1.5 MW at 7 pm (compensating for the decrease in photovoltaic power and the increase in load), effectively regulating output and improving renewable energy consumption rate, as shown in Fig. 5.
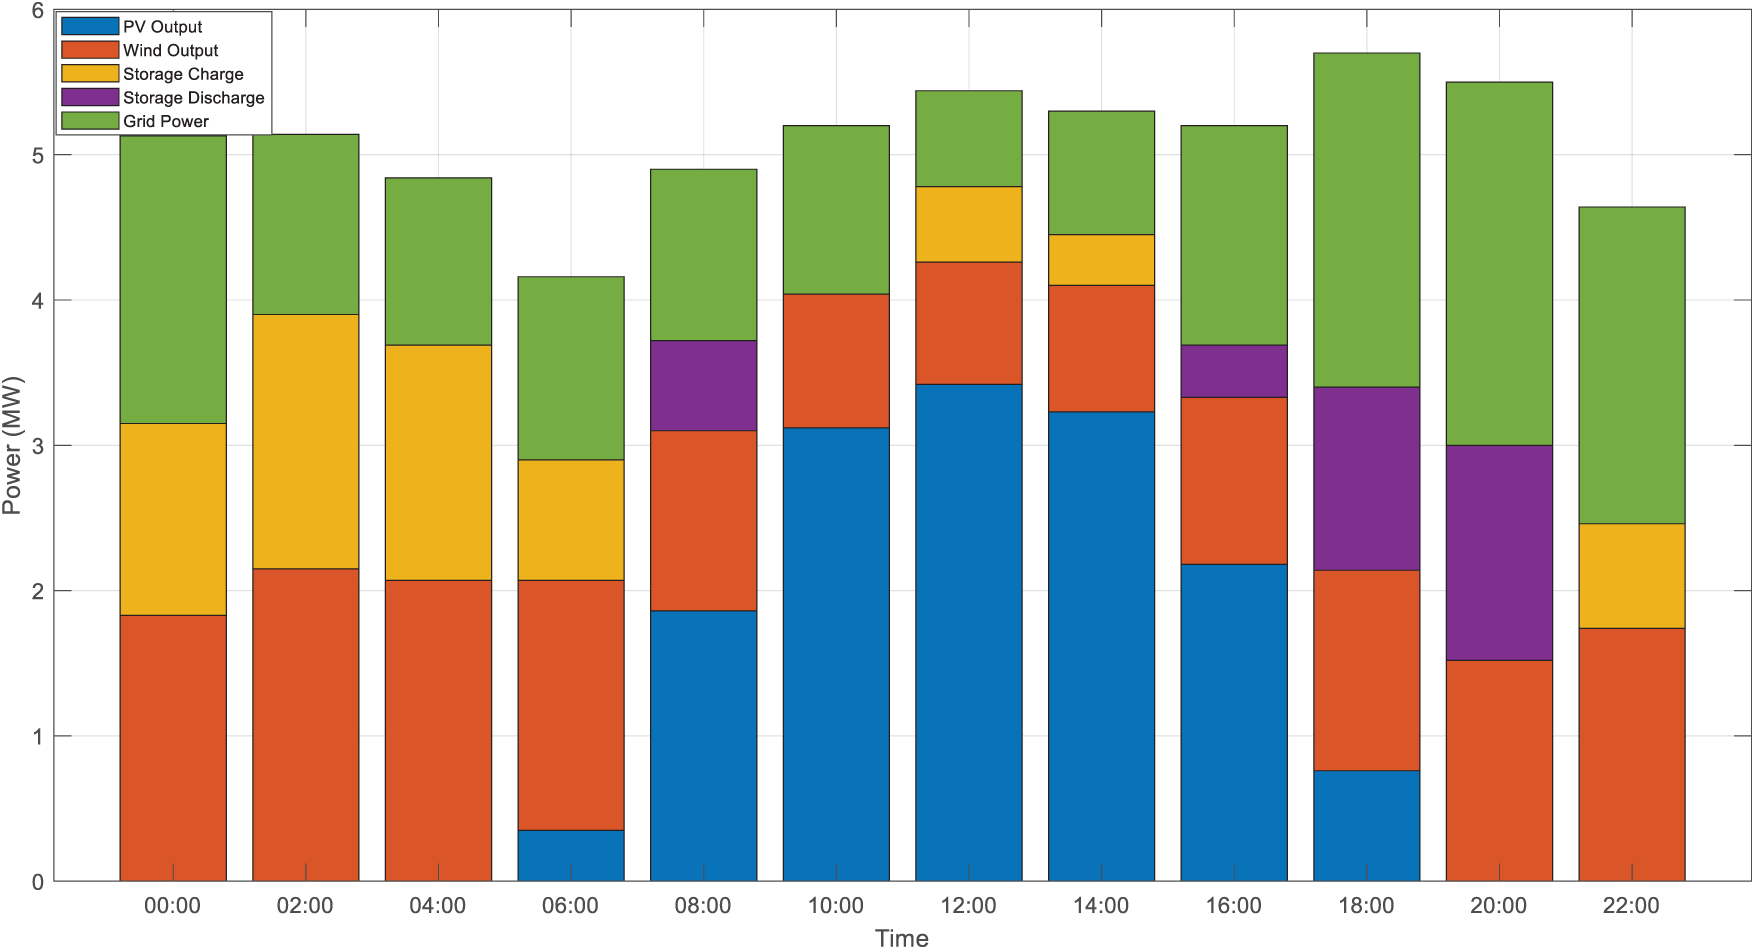
Figure 5: Typical daily source storage output curves at different time periods
Overall, the system is mainly powered by photovoltaics during the day and wind power at night, with energy storage balancing during peak periods (8–10 and 17–20), reducing reliance on external power grids. At noon (11–15 pm), the photovoltaic output is sufficient and the load is low, and the excess electricity is used for energy storage and charging, achieving energy time transfer. The external power grid power fluctuation (0.66–2.5 MW) is much lower than the load range (1.60–5.70 MW), demonstrating effective ability to mitigate fluctuations. The daily energy balance is 67.15 MWh of electricity generation, 3.24 MWh of net energy storage discharge, 70.39 MWh of total load consumption, 93.4% of renewable energy consumption rate, and 87.6% of energy storage efficiency, which verifies the effectiveness of the model and the advantages of Benders decomposition in planning and scheduling coordination.
(2) Load peak shaving and valley filling effect
As shown in Fig. 6, the original load exhibits a “double peak” characteristic, with the morning peak (8–10 o’clock) reaching 5.20 MW, the evening peak (18–20 o’clock) reaching 5.70 MW, and the valley (2–5 o’clock) only 1.60 MW, with a peak valley difference of 4.10 MW and a peak valley ratio of 3.56. After optimization, the morning peak decreased to 4.65 MW (a decrease of 10.6%), the evening peak decreased to 5.10 MW (a decrease of 10.5%), the valley increased to 2.20 MW (an increase of 37.5%), the peak valley difference decreased to 2.90 MW, the peak valley ratio decreased to 2.32, and the load curve became significantly smoother. Demand response and energy storage contribute 36% and 64% of the reduction during peak periods, and 25% and 75% of the improvement during off peak periods, respectively. In terms of economic benefits, saving 1.52 million yuan annually and delaying expansion investment; In terms of environmental benefits, the annual reduction of carbon dioxide emissions is 1240 t and nitrogen oxides is 4.8 t. Overall, the Benders decomposition based model effectively smooths the load curve, improving both economy and environmental friendliness.
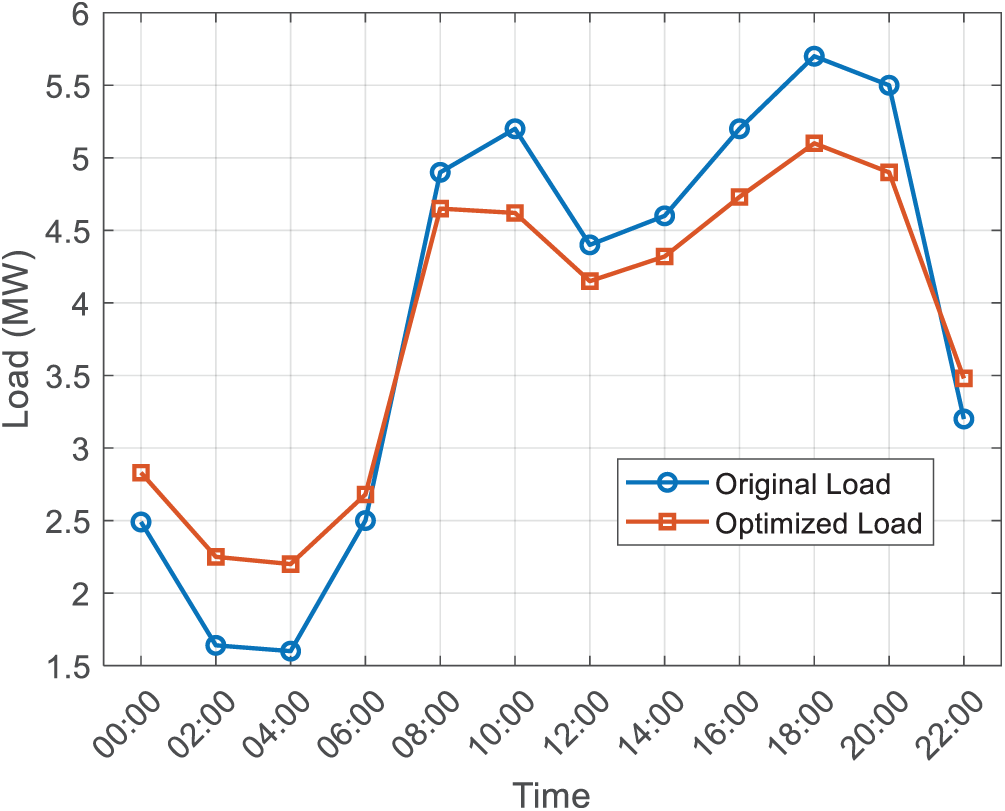
Figure 6: Comparative analysis of load peak shaving and valley filling effects
(1) The impact of carbon cost
Carbon cost is a key factor in low-carbon power system planning. To evaluate its impact, this section sets five carbon price levels (30–150 yuan/t) and analyzes their impact on source grid load storage collaborative planning. In recent years, with the promotion of the “dual carbon” target, China’s carbon price has risen from about 40 yuan/t in 2018 to 60–70 yuan/t in 2022, and is expected to align with international standards in the future, reaching 100–150 yuan/t. Therefore, conducting carbon price sensitivity analysis has important practical significance.
Figs. 7 and 8 show that the increase in carbon prices has prompted the system to optimize towards low-carbon direction, with photovoltaic, wind power, and energy storage capacity increasing by 38.2%, 25.6%, and 33.7%, respectively. The investment cost increased by 48% as the carbon price rose from 12.5 to 18.5 million yuan; And the operating cost decreased from 5.36 to 4.72 million yuan/year, a decrease of 11.9%. The carbon emissions have significantly decreased by 29.3%, from 3650 to 2580 t, reflecting the guiding role of the carbon pricing mechanism in reducing emissions. Although low-carbon transformation has reduced emission costs, the overall cost has still increased by 15.7%, indicating that under current technological conditions, promoting low-carbon development still requires a dual drive of policies and technology.
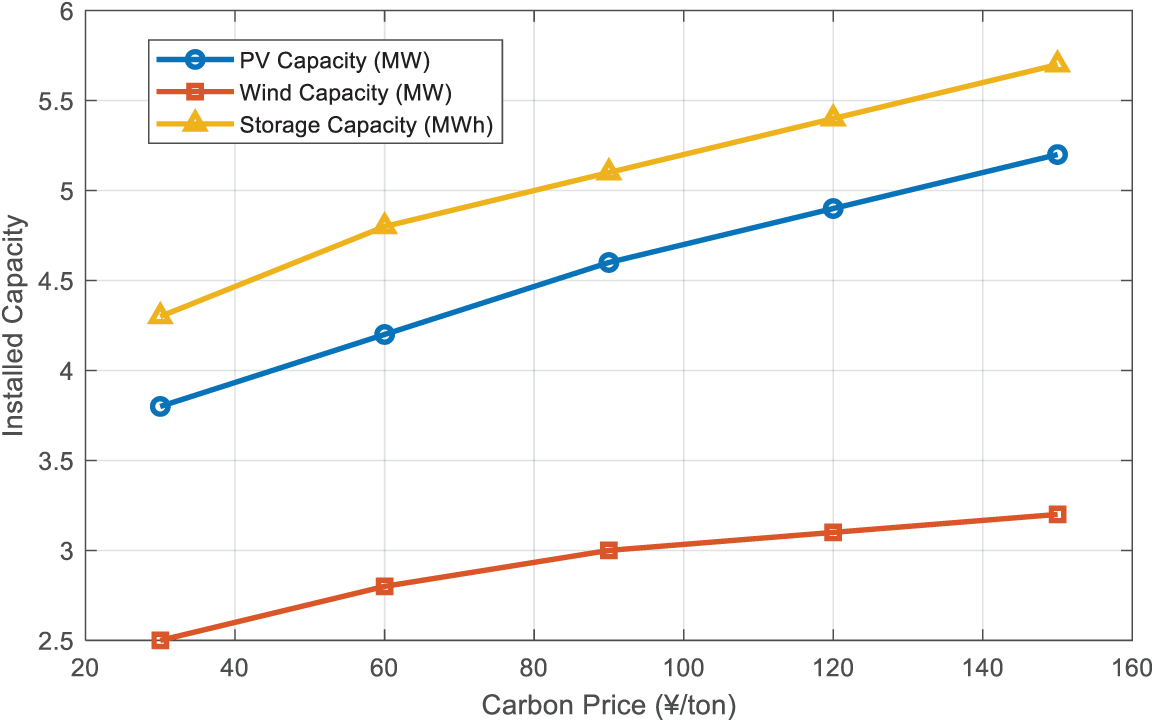
Figure 7: Installed capacity under different carbon prices
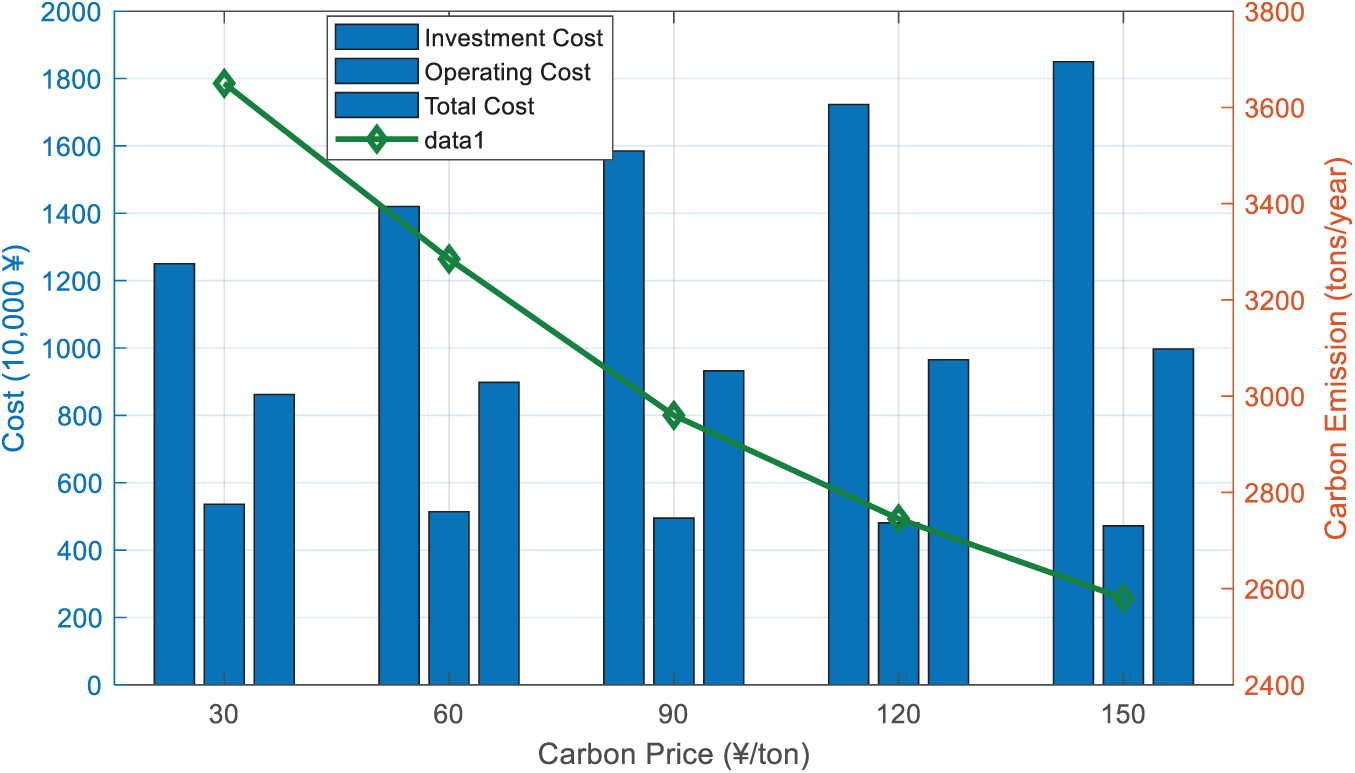
Figure 8: Cost and emission under different carbon prices
(2) The impact of changes in electricity prices
Electricity price, as an important parameter for the economic operation of distribution networks, has a significant impact on the coordinated planning of “source grid load storage” due to its fluctuations. To evaluate its sensitivity, this section sets five levels of electricity prices ranging from 0.5 to 0.9 yuan/kWh to analyze their impact on system configuration and economic performance.
Figs. 9 and 10 show that the increase in electricity prices will significantly enhance the allocation of distributed resources. The installed capacity of photovoltaics will increase from 3.7 to 5.4 MW (an increase of 45.8%), and the energy storage capacity will increase from 4.2 to 6.4 MWh (an increase of 52.4%). In addition, the potential for demand response has significantly increased, from 0.8 to 2.0 MW, with a growth rate of 150%, reflecting a significant increase in user response enthusiasm under high electricity price incentives. In terms of economy, the investment cost increased from 12.1 to 18.5 million yuan (an increase of 52.9%) with the electricity price, the operating cost increased from 4.85 to 6.15 million yuan/year (an increase of 26.8%), and the comprehensive cost increased from 7.56 to 10.35 million yuan/year (an increase of 36.9%). Although the increase in distributed configuration can alleviate the pressure of purchasing electricity costs, the overall cost still increases with the rise of electricity prices.
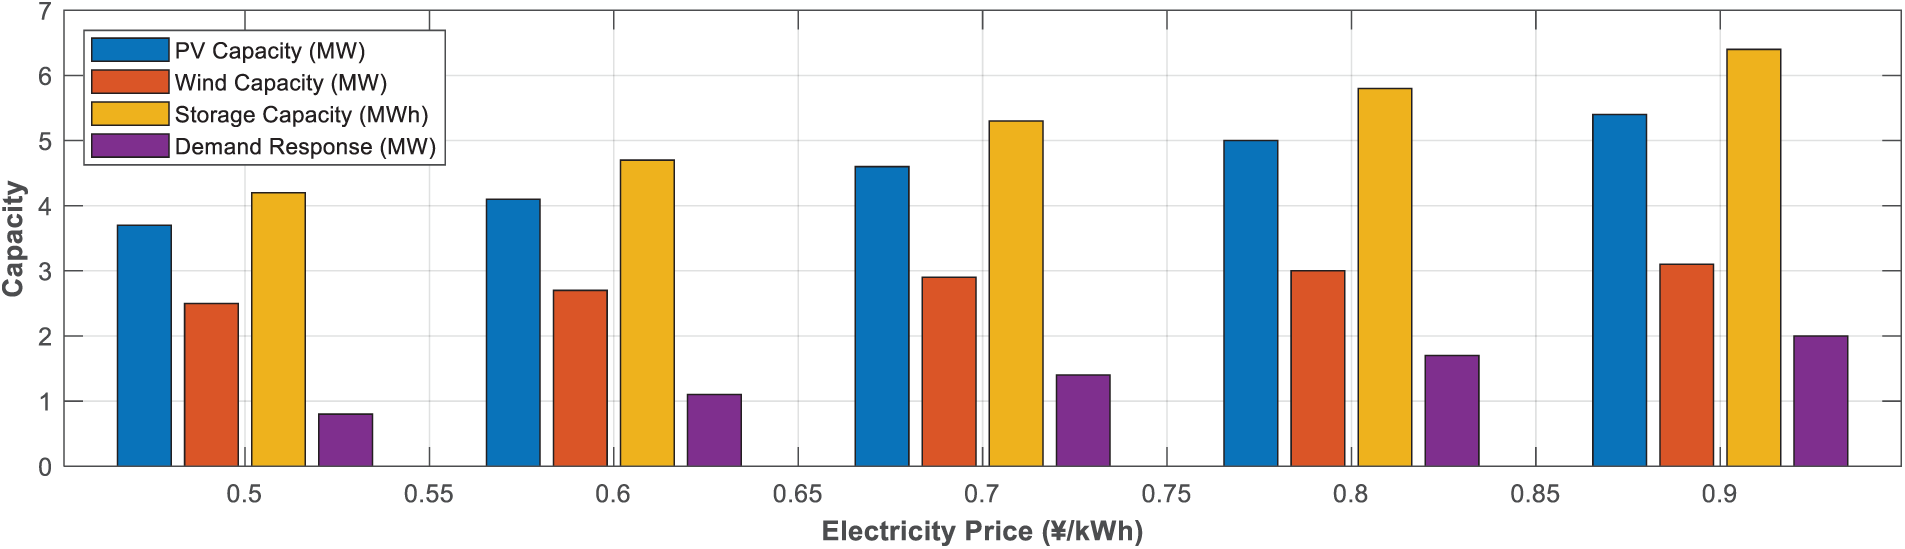
Figure 9: Impact of electricity price on distributed resource configuration
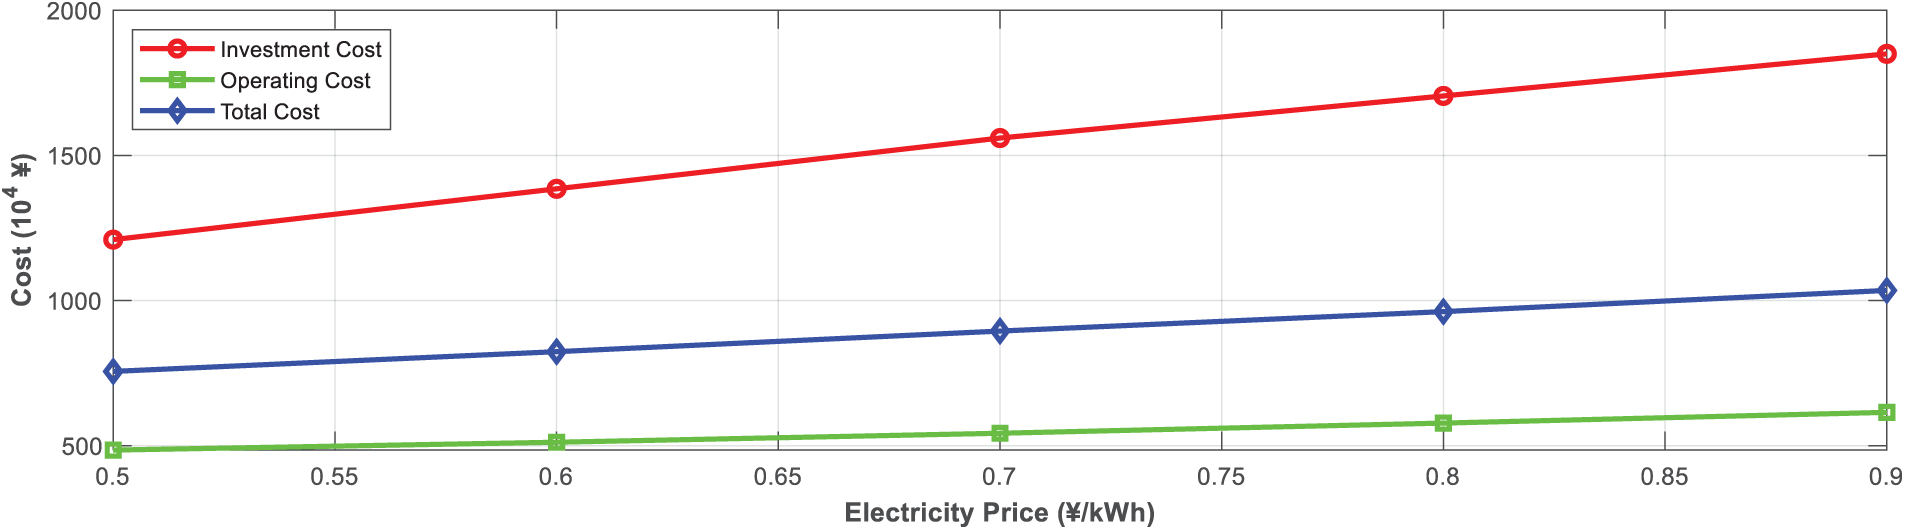
Figure 10: System cost under different electricity prices
(3) The impact of load fluctuations
Load uncertainty is an important challenge in distribution network planning, and its fluctuation characteristics directly affect the robustness and economy of the system. To evaluate its impact, five load fluctuation levels of 5%, 10%, 15%, 20%, and 25% are set (expressed as standard deviation percentage of expected value), and the changes in system configuration and performance indicators are analyzed.
Fig. 11 shows that as load uncertainty increases, system configuration tends towards greater flexibility. The energy storage capacity increased from 4.2 to 6.6 MWh (an increase of 57.1%), and the demand response potential increased from 1.4 to 2.6 MW (an increase of 85.7%). At the same time, the capacity of photovoltaic and wind power increased by 26.2% and 14.3% respectively, reflecting that the system enhances power supply elasticity by increasing the proportion of renewable energy.
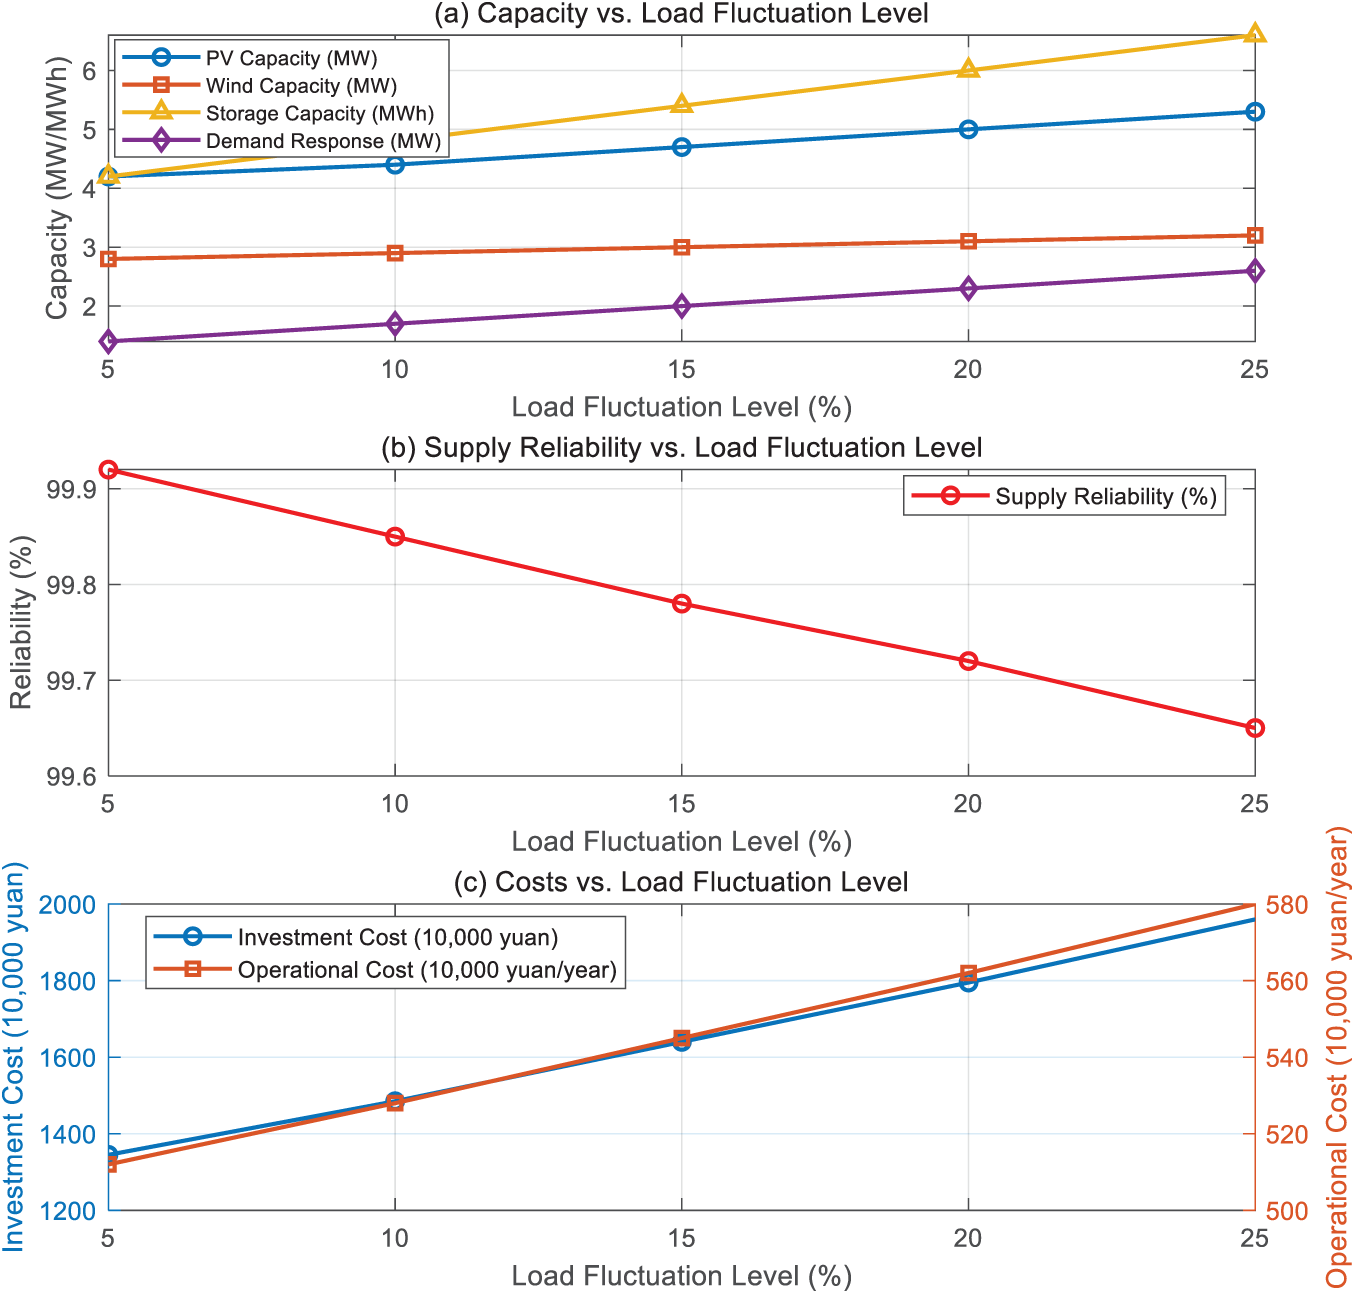
Figure 11: The impact of different levels of load fluctuations on source grid load storage collaborative planning
Despite a slight decrease in overall power supply reliability (from 99.92% to 99.65%), both system investment and operating costs have significantly increased, with the former increasing by 45.7% and the latter by 13.3%. This indicates that more resources are needed to cope with higher load fluctuations.
Policy Implications:
Carbon Price ↑ (30 → 150 RMB/t):
Investment cost ↑ 48% (12.5 → 18.5 M¥) but emissions ↓ 29.3% (Fig. 8 and 9).
*Suggests carbon tax >80 RMB/t needed to justify low-carbon transition.*
Electricity Price ↑ (0.5 → 0.9 RMB/kWh):
Demand response potential ↑ 150% (0.8 → 2.0 MW) (Figs. 10 and 11).
Supports time-of-use pricing to incentivize load shifting.
Investment Decision Insights:
Payback Period: BLBD reduces grid expansion costs by 8.07%, shortening ROI to 6.2 years (vs. 8.1 years for TLM).
Risk Mitigation: Under 25% load fluctuation, storage capacity ↑ 57.1% (4.2 → 6.6 MWh) ensures reliability >99.65%.
Scalability: National rollout could save 16.6 B¥/year and reduce CO2 by 2.1%.
The double-layer source grid load storage collaborative planning model proposed by the author based on Benders decomposition has shown excellent performance in optimizing the low-carbon and economic aspects of distribution networks. Through interactive optimization between upper and lower layers, the planning results of the model in the IEEE 33 node system show that the photovoltaic system is configured at nodes 8 (0.8 MW), 16 (1.2 MW), 24 (1.2 MW), and 32 (0.6 MW), with a total capacity of 3.8 MW; the wind power is configured at nodes 11 (0.8 MW), 21 (0.7 MW), and 29 (1.0 MW), with a total capacity of 2.5 MW; and the energy storage is configured at nodes 6 (0.5 MWh), 13 (0.8 MWh), 18 (0.4 MWh), and 25 (0.5 MWh), with a total capacity of 2.2 MWh; SVC is configured on nodes 7 (0.4 Mvar), 19 (0.5 Mvar), and 30 (0.3 Mvar), with a total capacity of 1.2 Mvar. The renovation of lines 2–3, 8–9, 15–16, 24–25, and 28–29 has further improved transmission capacity and voltage stability. Compared to traditional three-layer models (TLM) and standard Benders decomposition (SBD), the convergence time of the two-layer model (BLBD) is shortened to 5.36 h (an increase of 58.1%), the number of iterations is reduced to 23 (a decrease of 51.1%), and the memory usage is reduced by 45.6% (4.26 vs. 7.83 GB). Economically, the total cost decreased by 8.07% (12.436 vs. 13.528 million yuan), and carbon emissions decreased by 9.62% (12,456 vs. 13,782 t). In terms of operational performance, the peak valley difference decreased from 4.1 to 2.9 MW, a reduction of 29.3%. The renewable energy consumption rate reached 93.4%, and the energy storage efficiency was 87.6%. Sensitivity analysis shows that changes in carbon costs and electricity prices have a significant impact on system configuration, with energy storage capacity increasing by 57.1% (4.2 to 6.6 MWh) and investment costs increasing by 45.7% under high load fluctuations. This model can save about 16.6 billion yuan in investment annually and reduce carbon emissions by over 2.1%, providing an efficient and reliable solution for low-carbon distribution network planning.
Acknowledgement: Not applicable.
Funding Statement: No Funding.
Author Contributions: The authors confirm contribution to the paper as follows: study conception and design:Jun Guo, Sibo Feng; data collection: Maoyuan Chen; analysis and interpretation of results: Yuyang Li, Guangyu Fu; draft manuscript preparation: Jun Guo. All authors reviewed the results and approved the final version of the manuscript.
Availability of Data and Materials: The data that support the findings of this study are available from the corresponding author, Jun Guo, upon reasonable request.
Ethics Approval: This article does not contain any studies with human participants or animals performed by any of the authors.
Conflicts of Interest: The authors declare no conflicts of interest to report regarding the present study.
References
1. Gao Z, Fan A, Han J, Wang N, Pan W, Chen H, et al. A novel power source-load bilayer cooperative planning method for distribution networks based on adaptive ε-dominated multi-objective particle swarm algorithm. Energy Rep. 2025;13(3):1971–9. doi:10.1016/j.egyr.2025.01.052. [Google Scholar] [CrossRef]
2. Fang Y, Mu Y, Liu C, Yang X. Two-stage optimization strategy for the active distribution network considering source-load uncertainty. Energy Inform. 2024;7(1):125. doi:10.1186/s42162-024-00435-y. [Google Scholar] [CrossRef]
3. Yao F, Miao S, Wang T, Wang J, Wang B, Tan H. A black-start strategy for active distribution networks considering source-load bilateral uncertainty and multi-type resources. Electr Power Syst Res. 2025;238(3):111161. doi:10.1016/j.epsr.2024.111161. [Google Scholar] [CrossRef]
4. Lin T, Wu G, Lai S, Hu H, Hu Z. Calculation of distribution network PV hosting capacity considering source–load uncertainty and active management. Electronics. 2024;13(20):4048. doi:10.3390/electronics13204048. [Google Scholar] [CrossRef]
5. Lu J, Du H, Zhao R, Li H, Tan Y, Guo W. Optimal scheduling of the active distribution network with microgrids considering multi-timescale source-load forecasting. Electronics. 2024;13(17):3455. doi:10.3390/electronics13173455. [Google Scholar] [CrossRef]
6. Li J, Zhang Y, Chen C, Wang X, Shao Y, Zhu X, et al. Two-stage planning of distributed power supply and energy storage capacity considering hierarchical partition control of distribution network with source-load-storage. Energy Eng. 2024;121(9):2389–408. doi:10.32604/ee.2024.050239. [Google Scholar] [CrossRef]
7. Zhang S, Chen S, Lin F, Zhao X, Li G. Collaborative optimization and scheduling of source, load and storage of distribution networks considering distributed energy and load uncertainty. J Phys Conf Ser. 2024;2823(1):012031. doi:10.1088/1742-6596/2823/1/012031. [Google Scholar] [CrossRef]
8. Chen S, Lin F, Zhao X, Li H. Optimal configuration method of photovoltaic energy storage in distribution network based on source-load coordination. J Phys Conf Ser. 2024;2826(1):012035. doi:10.1088/1742-6596/2826/1/012035. [Google Scholar] [CrossRef]
9. Qiu S, Deng Y, Ding M, Han W. An optimal scheduling method for distribution network clusters considering source-load–storage synergy. Sustainability. 2024;16(15):6399. doi:10.3390/su16156399. [Google Scholar] [CrossRef]
10. Li G, Lin X, Kong L, Xia W, Yan S. Corrigendum: enhanced bi-level optimal scheduling strategy for distribution network with multi-microgrids considering source-load uncertainties. Front Energy Res. 2024;12:1451417. doi:10.3389/fenrg.2024.1451417. [Google Scholar] [CrossRef]
11. Li K, Lin X, Zhang W, Yu L, Chen Q, Liu Y, et al. An efficient multi-timescale regulation strategy for distribution networks based on active and passive resources combined. Front Energy Res. 2024;12:1381349. doi:10.3389/fenrg.2024.1381349. [Google Scholar] [CrossRef]
12. Wang G, Sun Y, Li J, Jiang Y, Li C, Yu H, et al. Dynamic economic scheduling with self-adaptive uncertainty in distribution network based on deep reinforcement learning. Energy Eng. 2024;121(6):1671–95. doi:10.32604/ee.2024.047794. [Google Scholar] [CrossRef]
13. Wang P, Li H. Coordinated planning of soft open point and energy store system in active distribution networks under source-load imbalance. Electr Power Syst Res. 2024;231(2):110324. doi:10.1016/j.epsr.2024.110324. [Google Scholar] [CrossRef]
14. Wang L, Lin Y, Xiang Y, Zhang Y, Lan J, Wang J, et al. Power quality interval grading evaluation method of AC/DC distribution network considering source-load weighting and voltage coupling. J Phys Conf Ser. 2024;2703(1):012076. doi:10.1088/1742-6596/2703/1/012076. [Google Scholar] [CrossRef]
15. Zheng F, Meng X, Xu T, Sun Y, Wang H. Optimization method of energy storage configuration for distribution network with high proportion of photovoltaic based on source–load imbalance. Sustainability. 2023;15(13):10628. doi:10.3390/su151310628. [Google Scholar] [CrossRef]
16. Zhao J, Xie B, Wang D, Yan L, Liu W. Feature extraction and source-load collaborative analysis method for distribution network. Energy Rep. 2023;9(11):547–55. doi:10.1016/j.egyr.2023.04.329. [Google Scholar] [CrossRef]
17. Zheng F, Meng X, Wang L, Zhang N. Power flow optimization strategy of distribution network with source and load storage considering period clustering. Sustainability. 2023;15(5):4515. doi:10.3390/su15054515. [Google Scholar] [CrossRef]
18. Cui Y, Tu Q, Wang W, Gu J, Zhang H, Yang X, et al. Optimal allocation scheme of “source-load-storage” distributed resources in distribution network for supporting black start of key nodes in the main network. J Phys Conf Ser. 2023;2452(1):012016. doi:10.1088/1742-6596/2452/1/012016. [Google Scholar] [CrossRef]
19. Zhang H, Liu J, Hou L. Source-load spatial-temporal mismatch and joint optimization of electrified transportation-distribution network. Electr Power Syst Res. 2023;216(1):109055. doi:10.1016/j.epsr.2022.109055. [Google Scholar] [CrossRef]
20. Yan S, Hu M. A multi-stage planning method for distribution networks based on ARIMA with error gradient sampling for source-load prediction. Sensors. 2022;22(21):8403. doi:10.3390/s22218403. [Google Scholar] [PubMed] [CrossRef]
21. Dong L, Li J, Pu T, Chen N. Distributionally robust optimization model of active distribution network considering uncertainties of source and load. J Mod Power Syst Clean Energy. 2019;7(6):1585–95. doi:10.1007/s40565-019-0558-x. [Google Scholar] [CrossRef]
22. Gao Y, Ai Q, Yousif M, Wang X. Source-load-storage consistency collaborative optimization control of flexible DC distribution network considering multi-energy complementarity. Int J Electr Power Energy Syst. 2019;107(1):273–81. doi:10.1016/j.ijepes.2018.11.033. [Google Scholar] [CrossRef]
23. Chen M, Xia M, Chen Q. Research on distributed source-load interaction strategy considering energy router-based active distribution network. IEEE Access. 2019;7:150505–16. doi:10.1109/ACCESS.2019.2946865. [Google Scholar] [CrossRef]
24. Jayaraman R, Victoire AA. Implementation of differential equation of single-phase source-load system based control algorithm for three-phase DSTATCOM under stiff source. Electr Power Compon Syst. 2017;45(18):1985–95. doi:10.1080/15325008.2017.1362606. [Google Scholar] [CrossRef]
25. Li T, Zhao H, Wang S, Yang C, Huang B. Attack and defense strategy of distribution network cyber-physical system considering EV source-charge bidirectionality. Electronics. 2021;10(23):2973. doi:10.3390/electronics10232973. [Google Scholar] [CrossRef]
26. Belbachir N, Zellagui M, Settoul S, El-Bayeh CZ, El-Sehiemy RA. Multi dimension-based optimal allocation of uncertain renewable distributed generation outputs with seasonal source-load power uncertainties in electrical distribution network using marine predator algorithm. Energies. 2023;16(4):1595. doi:10.3390/en16041595. [Google Scholar] [CrossRef]
27. Suo L, Liu G. Research on source-load coordinated dispatching of flexible DC distribution network based on big data. J High Speed Netw. 2022;28(4):231–41. doi:10.3233/jhs-220686. [Google Scholar] [CrossRef]
Cite This Article
 Copyright © 2026 The Author(s). Published by Tech Science Press.
This work is licensed under a Creative Commons Attribution 4.0 International License , which permits unrestricted use, distribution, and reproduction in any medium, provided the original work is properly cited.
 Downloads
 Citation Tools