
 Submit a Paper
 Propose a Special lssue
 Open Access
ARTICLE

Impact of Shockwave on Condensation Efficiency of Supersonic Nozzle during Natural Gas Purification
1 General Oil and Gas Gathering and Transporting Plant, Sinopec Shengli Oilfield Company, Dongying, 257000, China
2 Technical Inspection Center, Sinopec Shengli Oilfield Company, Dongying, 257000, China
3 Polytechnic Institute, Zhejiang University, Hangzhou, 310015, China
4 School of Petroleum Engineering, Yangtze University, Wuhan, 430100, China
* Corresponding Author: Jiang Bian. Email:
(This article belongs to the Special Issue: Green and Low-Carbon Pipeline Transportation Theory and Technology for Petroleum, Natural Gas, and Unconventional Media)
Energy Engineering 2026, 123(2), 13 https://doi.org/10.32604/ee.2025.070290
Received 12 July 2025; Accepted 29 August 2025; Issue published 27 January 2026
 View Full Text
 Download PDF
Abstract
Shock waves in the nozzle during supersonic separation under different conditions can disrupt the flow field’s thermodynamic equilibrium. While it contributes to the recovery of pressure energy, it also leads to the dissipation of mechanical energy. This study aimed to investigate the effects of changes in back pressure on the shock wave position and its subsequent impact on the refrigeration performance of nozzles. A mathematical model for the supersonic gas in a nozzle was established and evaluated via experiments. The results show that when the back pressure is less than 0.2 MPa, no shock wave is generated in the nozzle, and high refrigeration and liquefaction efficiency can be ensured while effective pressure recovery is achieved. When the back pressure (pb) is increased from 0.3 to 0.6 MPa, the refrigeration efficiency of the nozzle decreases, and the shock wave position (x shock) is advanced from 157 to 118 mm. The maximum Mach number (Ma) that can be reached by the fluid in the nozzle is reduced from 1.97 to 1.27. When the back pressure is increased from 0.2 to 0.6 MPa, the minimum temperature is increased by 55.18 K. When the back pressure is greater than 0.3 MPa, the Mach number upstream of the shock wave is reduced from 1.97 to 1.27, the shock wave intensity is weakened, and the thickness of the boundary layer separation caused by the shock wave is also decreased accordingly. Therefore, to ensure refrigeration efficiency, measures should be taken to control the back pressure within a reasonable range.Keywords
Nomenclature
| Cμ | A viscosity-related parameter (–) |
| E | Total energy (J kg−1) |
| k | Turbulent kinetic energy (J) |
| keff | Effective thermal conductivity (W m−1 K−1) |
| Ma | Mach number (–) |
| p | Pressure (Pa) |
| Rein | Reynolds number (–) |
| S | Deformation tensor (–) |
| Sε | User defined item (–) |
| t | Time (s) |
| T | Temperature (K) |
| u | Velocity (m s−1) |
| Greek Symbols | |
| γ | Adiabatic index (–) |
| ε | The turbulent dissipation rate (m2 s−3) |
| μ | Effective dynamic viscosity (N s m−2) |
| ρ | Density (kg m−3) |
| τeff | Effective stress tensor (–) |
| ν | Kinematic viscosity (m2 s−1) |
| Subscripts | |
| 1 | Indicates the gas before the shock wave |
| 2 | Indicates the gas after the shock wave |
| b | Outlet of the Laval nozzle |
| i | x axis |
| j | y axis |
Natural gas is widely recognized as an environmentally friendly and highly efficient energy resource that has gained significant prominence within the global energy industry [1]. The success of shale gas extraction has significantly contributed to advancements in natural gas production [2,3]. From production to consumption, natural gas travels through two major stages: purification and transportation. Water vapor, heavy hydrocarbons, and acidic gases (including CO2 and H2S) in natural gas from the wellhead decrease the heating value of the gas and damage pipelines and process equipment [3]. Hence, the purification of natural gas is recognized as an essential treatment process. The most common methods of separation and purification include absorption [4], adsorption [5], membrane separation [6], and supersonic separation [7].
The utilization of supersonic separation technology represents an advanced approach in the process of separating mixed gases [8]. Scholars have focused on supersonic separation technology because of its small construction, safety and dependability, unattended, energy-saving, and environmental protection properties. The technology combines the theories of gas dynamics, engineering thermodynamics, and fluid mechanics, including expansion refrigeration and cyclonic gas/liquid separation. The specific structure and principle are shown in Fig. 1 [9].
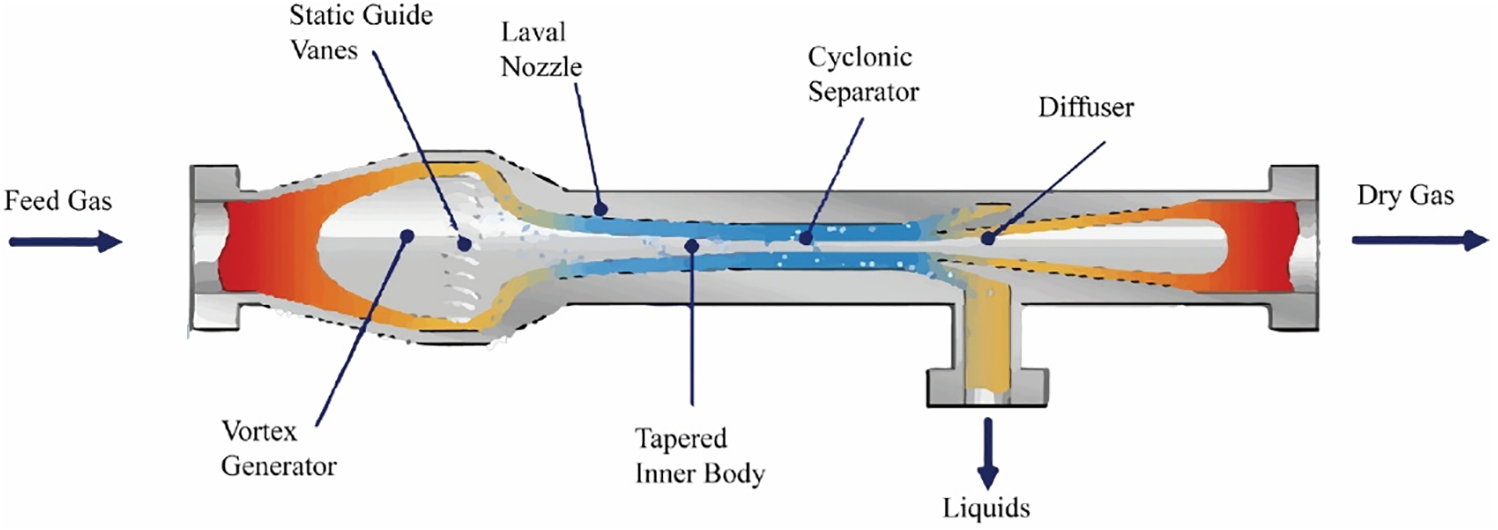
Figure 1: The specific structure and principle of supersonic separation technology
Scholars have continued to innovate and expand on the benefits of supersonic separators, making significant advances in natural gas dehydration. Ding et al. [10] analyzed the feasibility of carbon dioxide capture based on supersonic decarburization technology. The findings indicated that modifying the inlet parameters of the Laval nozzle resulted in a natural gas liquefaction rate of less than 10%. Bian et al. [11] numerically simulated the homogeneous condensation process of CH4-C2H6 and clarified the condensation mechanism of the mixture. Jassim et al. [12,13] performed a numerical simulation to investigate the gas-phase flow properties of high-pressure natural gas within a supersonic separator. Researchers have examined the impact of real gas behavior and nozzle geometry on the supersonic flow field. Karimi and Abdi [14] employed numerical simulations to assess the basic characteristics of the internal flow field of a supersonic separator. Malyshkina [15] used the Eulerian model to simulate the vortex characteristics of natural gas in a cyclonic front separator and analyzed the effects of gas velocity and temperature on the condensation parameters and pressure recovery capacity.
Pressure energy recovery (PER) is a significant advantage offered by supersonic separators in the domain of natural gas purification, in contrast to conventional throttling cooling devices (J-T valves). However, the aerodynamic shock wave that develops during PER lowers the liquefaction efficiency of the nozzle [16]. Yang et al. [17] investigated the relationship between the influence of various adiabatic exponents on the pressure recovery coefficient of Laval nozzle by using CFD numerical simulation and reported that the greater the Mach number (Ma > 1.3) inside the nozzle was, the greater the impact of the adiabatic index on the pressure recovery coefficient. Niknam et al. [18] designed a cyclone front-placed supersonic separator device and carried out a low-pressure dehydration experiment, discovering that lowering the pressure ratio between the outlet and the inlet from 0.8 to 0.6 can increase the dehydration efficiency by approximately 5%. Liu et al. [19] studied the impact of a shock train in Laval and reported that when the efficiency of the PER improved from 30% to 80%, the boundary layer separation length decreased. Ma et al. [20] developed a cone-core supersonic separation device and conducted structural optimization design studies on several Laval nozzle configurations. By organically combining multiple processes, supersonic separation technology has advantages over traditional natural gas treatment technology and has achieved good results in natural gas treatment [21].
The efficiency of the PER is a crucial factor in the performance of a supersonic separator. It directly impacts the refrigeration effect of the system, which in turn is closely linked to the separation efficiency of the supersonic separator. Therefore, clarifying the location and generation mechanism of shock waves with different back pressures (pb) during PER can provide references for designing and optimizing the Laval nozzle, thus improving its refrigeration performance. In this work, a mathematical model for the supersonic gas in a nozzle was established and confirmed via experiments. The shock wave position (xshock) in the nozzle and its influence on the refrigeration performance under different pb values were studied. The boundary layer separation phenomenon under the action of the shockwave and the interaction mechanism between the boundary layer and the shockwave are discussed.
Back pressure is a key factor triggering shockwaves, and shockwaves directly affect the condensation and separation process of natural gas components by altering flow field parameters (such as pressure, temperature, and flow velocity). However, existing studies have not clearly clarified the quantitative relationship between the changes in shockwave intensity and position under different back pressures and separation efficiency, nor have they specified the ways in which shockwaves influence separation efficiency (e.g., interfering with droplet nucleation or disrupting the stability of the swirl flow field). This makes it impossible to achieve precise optimization of separation efficiency by regulating back pressure. Therefore, it is essential to establish and verify the reliability of a mathematical model for supersonic gas flow in the nozzle. This study aims to clarify the shockwave position under different back pressures and the influence law of shockwaves on refrigeration performance, as well as to reveal the boundary layer separation phenomenon induced by shockwaves and the interaction mechanism between shockwaves and the boundary layer. Ultimately, it will provide a theoretical reference for the design optimization of Laval nozzles, thereby improving the refrigeration performance and separation efficiency of supersonic separators.
2 Structure Design of the Laval Nozzle
The designed nozzle structure and various parameters are shown in Fig. 2. The diameter of the throat is 10 mm. The diameter of the straight section is 7 times greater than the diameter of the throat, whereas the length of the straight section is 10 times greater than the diameter of the throat. Bi-cubic curves are used in the design of the divergent section, while arcs and straight lines are used in the design of the divergent section to reduce vortex formation.
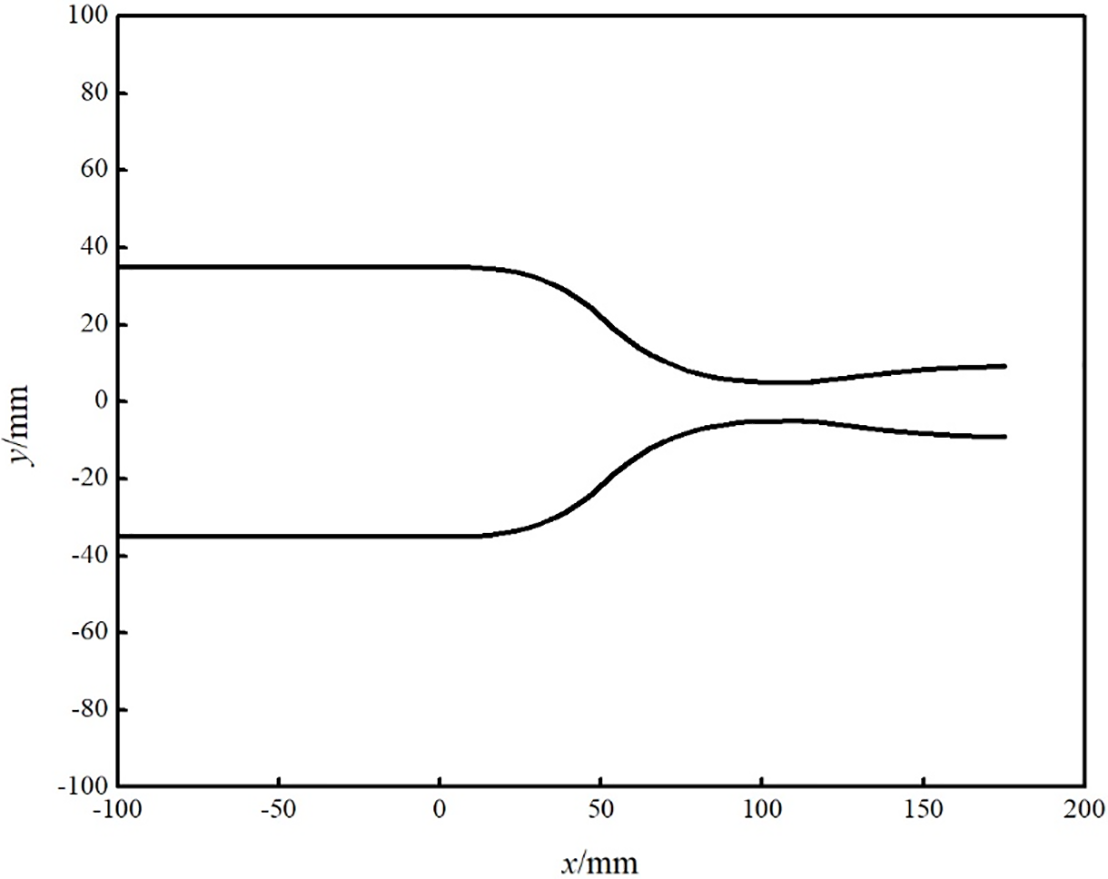
Figure 2: Nozzle structure diagram
3.1 Relationship between Ma Upstream and Downstream of the Shockwave
Shockwaves are significant physical phenomena in supersonic fluid flow fields during the pressure energy recovery process [22]. A powerful disturbance propagates through a gas at a rate that surpasses the local sound speed of the mixed gas and manifests as a sharp discontinuity in the flow parameters. The categorization of shockwaves can be based on their respective shapes, which include positive shockwaves, oblique shockwaves, and curved shockwaves [23]. The density, pressure, and temperature all increase significantly after the shockwave, but the velocity decreases substantially. Owing to the tiny thickness of the shockwave [24], the physical processes in the gas are extremely complicated and intense. Consequently, an analysis is conducted on the relationship between the gas properties before and after the shockwave, neglecting the internal factors of the shockwave. The change in the parameter that occurs in a fluid after the shockwave follows a certain pattern, and the strength of the shockwave is directly related to the strength of the gas flow.
The calculation formulas for the ratios of various parameters of the compressible ideal gas before and after the normal shockwave are (1)–(5):
The continuity, momentum, and energy equations govern the natural gas flow in a supersonic separator, and their general forms are as follows:
Continuity equation:
Momentum equation:
Energy equation:
The RNG k-ε turbulence model is employed to adjust the turbulent viscosity to incorporate the impact of swirl. The equations for k and ε are presented as follows [25]:
The core of a fully developed duct flow [26]:
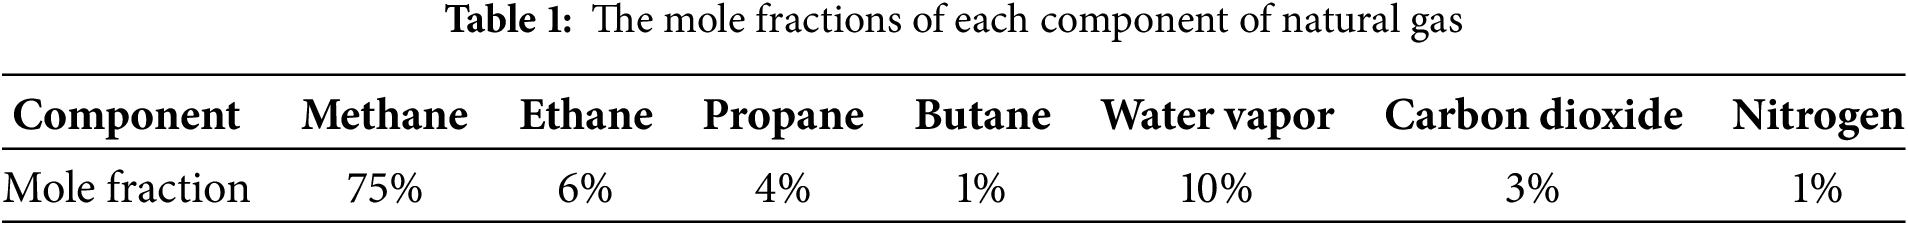
The FLUENT 15.0 software was employed for the computation of the gas flow patterns within the Laval nozzle. The density of natural gas during flow in the Laval nozzle was computed via the ideal gas equation of state, and the inlet total pressure of the nozzle was set to 0.7 MPa. To investigate the xshock within the nozzle under different pb values and its influence on refrigeration performance, the inlet temperature was set to 303 K, and the pb was adjusted to 0.1~0.6 MPa. The mole fractions of each component of natural gas were are listed in Table 1. The no-slip and adiabatic boundary conditions were specified for the walls.
Gambit software was used to generate a two-dimensional (2D) Laval nozzle grid (Fig. 3). The 2D domain was meshed using unstructured grids, which are more flexible to complicated boundaries. As shown in Fig. 4, the temperature profiles obtained with the 19,470 cell grid showed negligible deviation from those obtained with the finer 24,410 cell grid, indicating grid convergence. Thus, the 19,470 cell grid was chosen for computational efficiency. As a result, a grid number of 19,470 was eventually chosen for the numerical simulation to reduce processing effort while ensuring calculation accuracy.
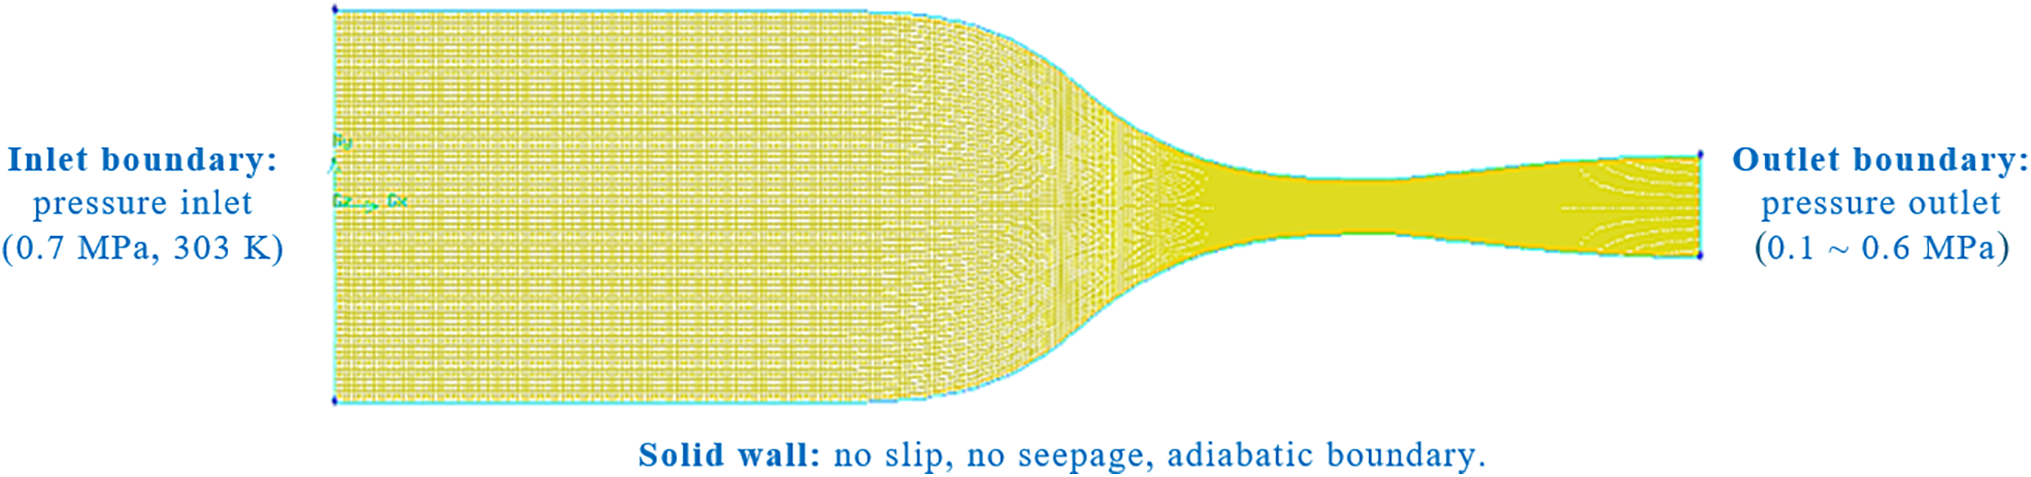
Figure 3: Mesh methodology for Laval nozzle
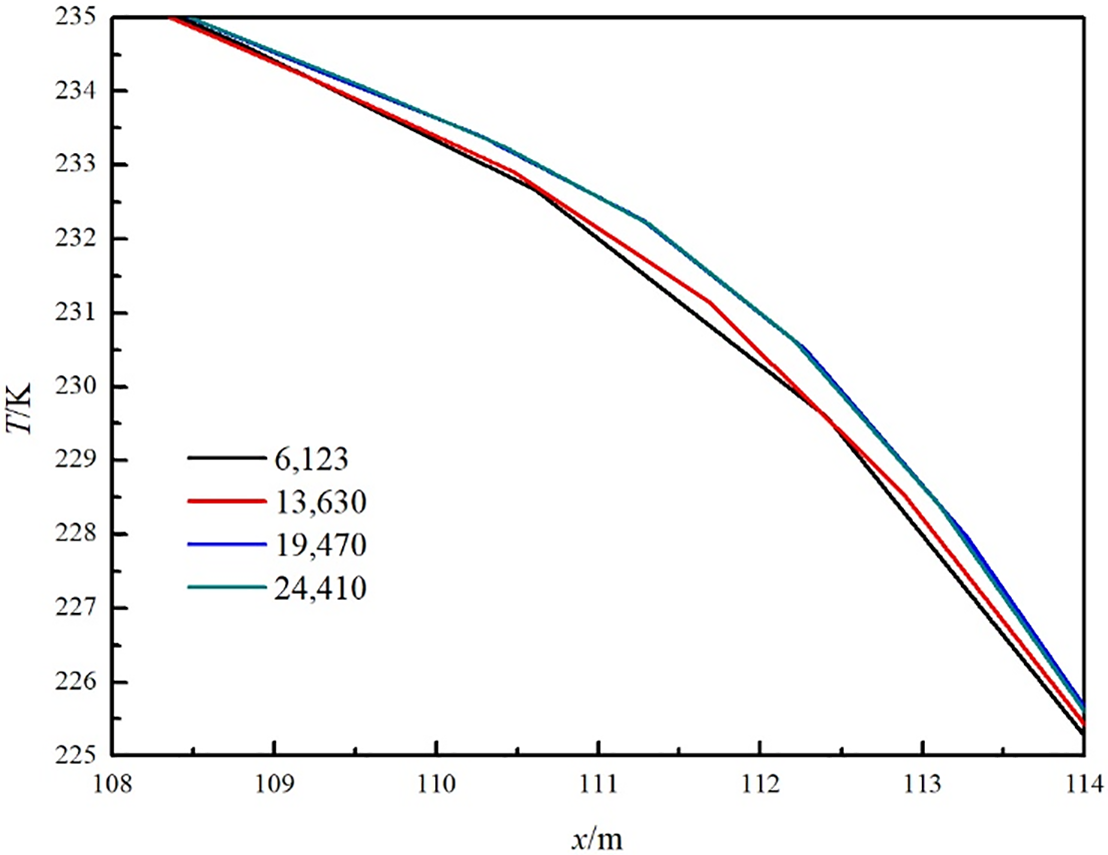
Figure 4: Simulation results for temperatures with different numbers of cells
The verification of the CFD model was conducted via a comparison with experimental data reported by Wyslouzil et al. [27]. The experimental nozzle was a rectangular structure with an area ratio of 1.58 (outlet area/throat area) and a rectangular throat size of 12.7 mm × 5.0 mm. Since natural gas is a multi-component mixture (containing methane, ethane, propane, water vapor, nitrogen, etc.), using real natural gas directly would lead to interactions between components—such as the co-condensation of heavy hydrocarbons and water vapor—thereby increasing the complexity of simulations and causing significant interference to the research. In contrast, the “water vapor-nitrogen mixture” is a highly simplified simulation system: nitrogen only acts as a “carrier gas” to transfer energy during flow and does not interfere with the phase change behavior of water vapor. In undehydrated natural gas, the partial pressure of water vapor is generally low (usually below 5 kPa), as a high partial pressure would cause premature condensation during transportation; a water vapor partial pressure of 1 kPa corresponds to the typical state of “low-water-content natural gas” and matches the actual operating conditions of “natural gas to be dehydrated” that requires supersonic separation. Therefore, with an input pressure of 60 kPa, an inlet temperature of 286.7 K, and a partial pressure of 1 kPa of water vapor, the nozzle inlet gas mixture was water vapor-nitrogen. The comparison results between the simulation and experiments were presented in Fig. 5. The observed trends of the two variables exhibited a high degree of consistency. Therefore, the mathematical model for the supersonic gas in a nozzle established in this study can predict supersonic flow with high accuracy.
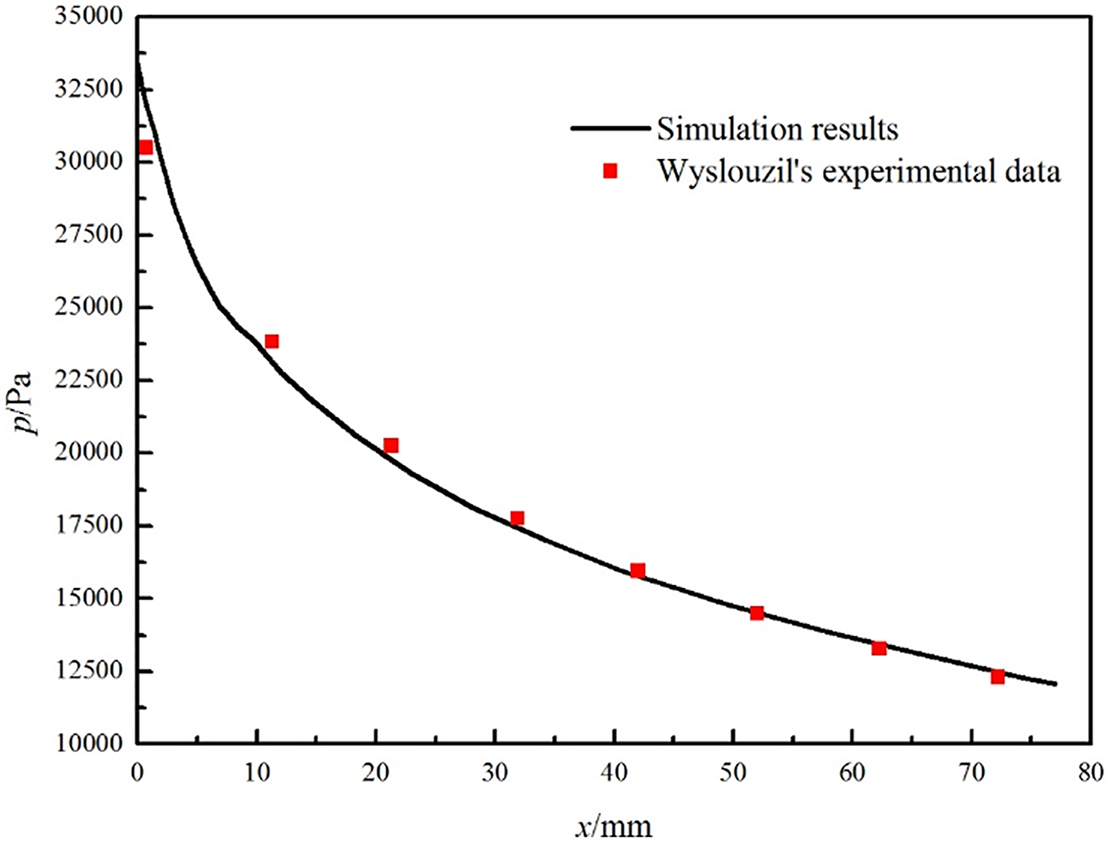
Figure 5: Results of comparisons between simulations and experiments [27]
4.2 Effects of Shockwaves on the Supersonic Flow Field
The flow characteristics (such as pressure, temperature, and Ma) of the nozzle vary when pb increases from 0.1 to 0.6 MPa, as illustrated in Figs. 6–8.
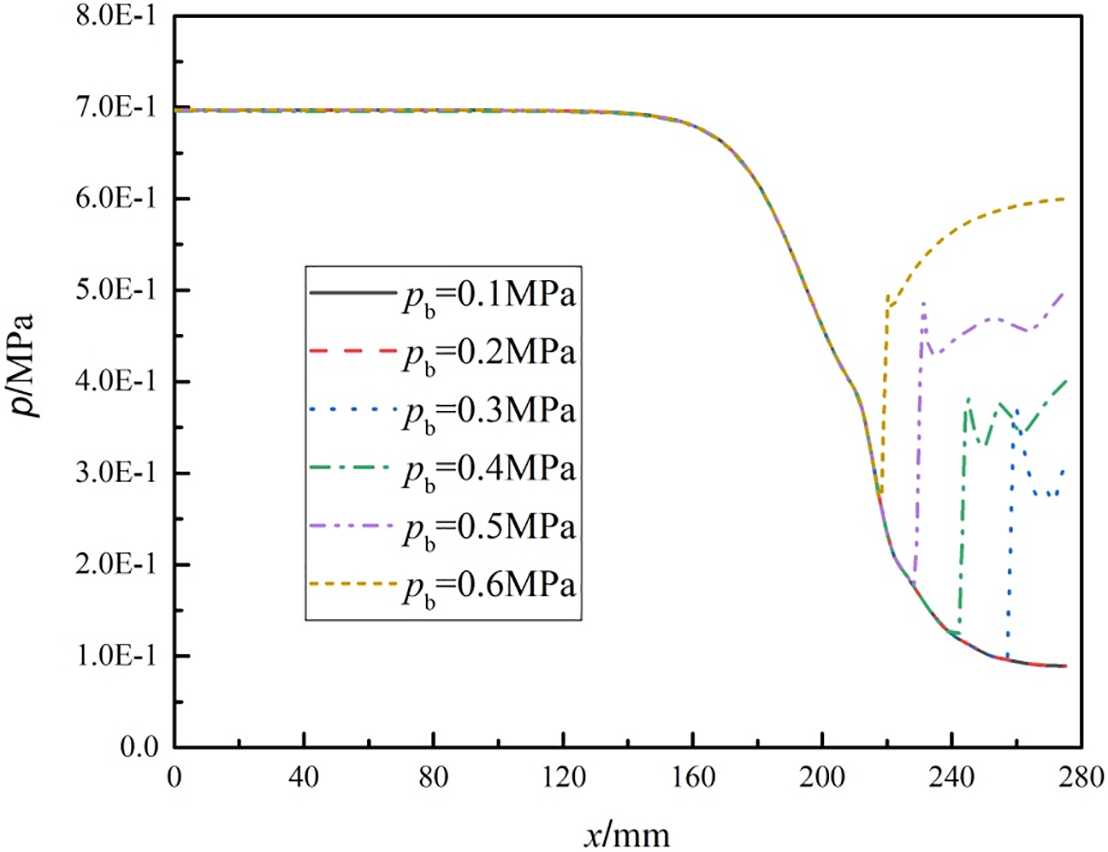
Figure 6: Pressure change on the central axis (y = 0) under different back pressures
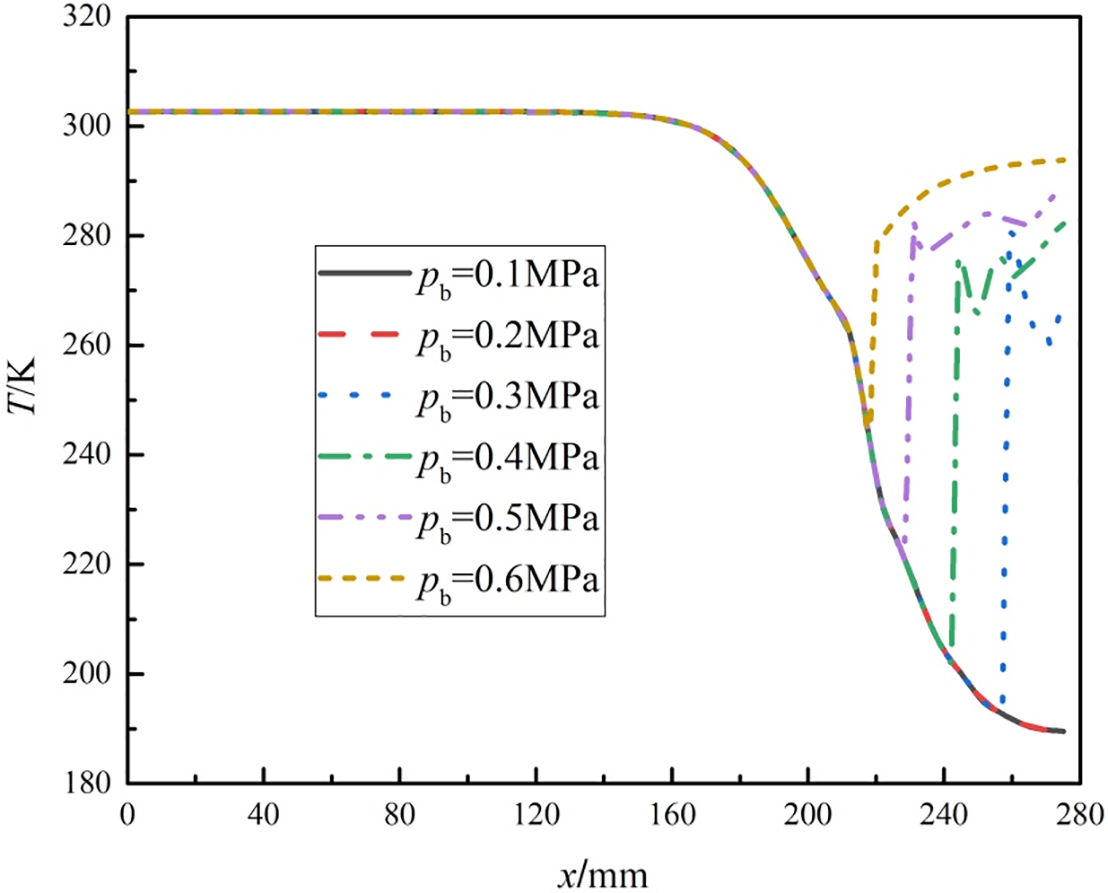
Figure 7: The temperature change on the central axis (y = 0) under different back pressures
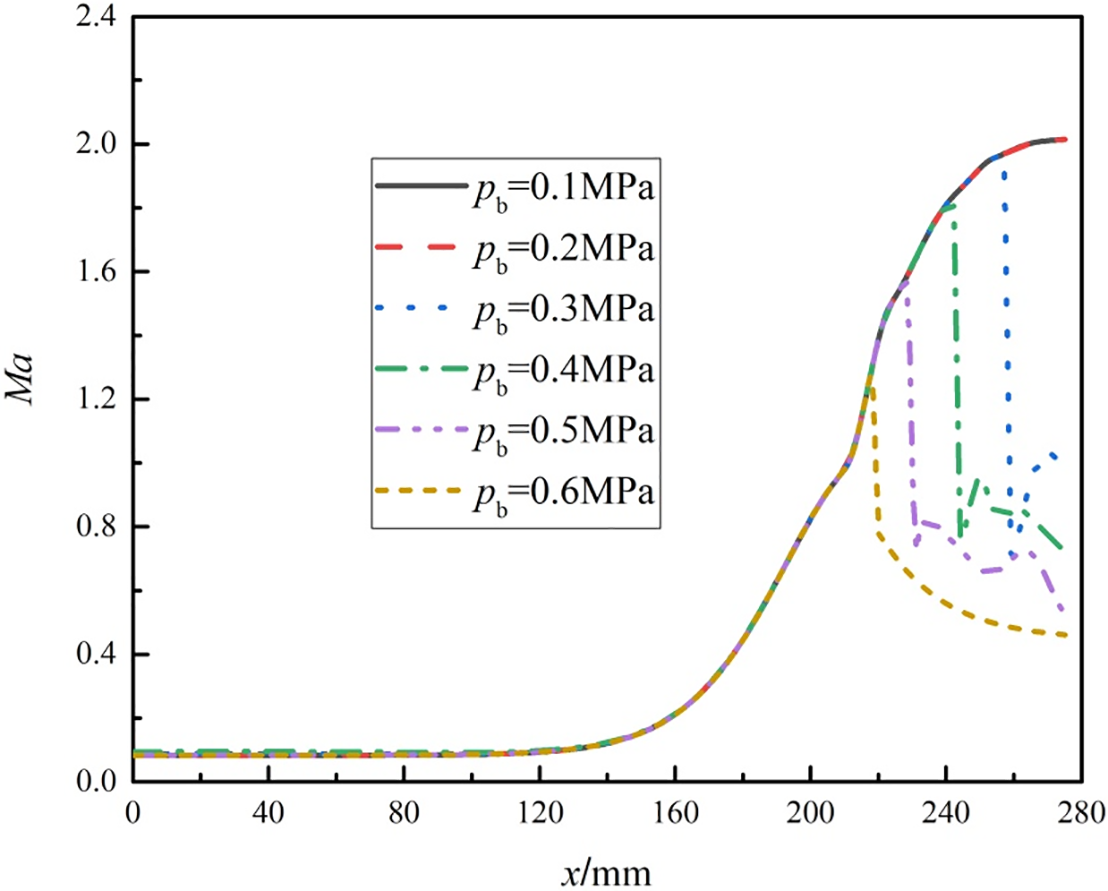
Figure 8: Mach number change on the central axis (y = 0) under different back pressures
Fig. 6 shows that the absence of a shockwave occurs at pb values of 0.1 and 0.2 MPa in a Laval nozzle. As pb increases, the shockwave gradually shifts in the direction of the nozzle inlet from the nozzle outlet. The shockwave was observed at different pb values. At a pb of 0.3 MPa, the xshock is 157 mm. Similarly, at pb values of 0.4, 0.5, and 0.6 MPa, the xshock values are 142, 128, and 118 mm, respectively. Additionally, the throat position is observed to be at x = 112 mm when pb is 0.6 MPa. Under this condition (pb = 0.6 MPa), the shockwave is located near the throat.
The flow characteristics of the Laval nozzle are closely related to the back pressure. At low back pressures (such as 0.1 and 0.2 MPa), the fluid inside the nozzle can expand and accelerate sufficiently without forming a shock wave. As the back pressure increases, the inhibitory effect of the external back pressure on the internal flow of the nozzle is enhanced, causing the shock wave to gradually move towards the inlet. When the back pressure reaches 0.6 MPa, the shock wave is close to the throat. At this time, the flow state near the throat has a particularly significant impact on the overall performance of the nozzle. The formation of a shock wave here will lead to an increase in energy loss, which in turn affects the refrigeration efficiency of the nozzle. Therefore, in practical applications, it is necessary to strictly control the back pressure to avoid the formation of shock waves near the throat, thereby optimizing the performance of the nozzle.
The temperature of the gas flow inside the nozzle significantly increased after the shockwave, as shown in Fig. 7. Moreover, an increase in pb results in a corresponding increase in the minimum temperature reached by the gas within the nozzle. At pb values of 0.1 and 0.2 MPa, the gas within the nozzle can achieve a minimum temperature of 189.53 K. With an increase in pb from 0.3 to 0.5 MPa, there is an increase in the minimum achievable temperature from 192.65 to 220.86 K. Despite a pb of 0.6 MPa, the gas temperature within the nozzle cannot fall below 244.71 K. However, the temperature of the gas at the nozzle outlet has increased to 293.80 K, suggesting that in the case of pb equal to 0.6 MPa, the refrigeration efficiency of the nozzle is almost negligible. The results indicate that an increase in pb has a negative effect on the refrigeration performance of the nozzle.
The formation of a shock wave is an irreversible process, which leads to the total pressure loss and entropy increase of the gas flow, thereby increasing the gas temperature. At low back pressures (such as 0.1 and 0.2 MPa), the gas inside the nozzle can expand sufficiently, and the temperature reduction effect is significant. As the back pressure increases, the obstruction effect of the external back pressure on the internal flow of the nozzle is enhanced, causing the shock wave to form earlier. The energy loss of the gas during the expansion process increases, thereby increasing the minimum temperature. When the back pressure reaches 0.6 MPa, the shock wave is close to the throat, and the expansion of the gas near the throat is severely restricted, making it impossible to reach a lower temperature, resulting in a significant decrease in refrigeration efficiency.
Fig. 8 shows that in the nozzle convergent section, Ma in the nozzle gradually increases. When pb increases from 0.1 to 0.6 MPa, Ma at the throat reaches 1 (sonic velocity), and the flow subsequently accelerates to supersonic velocities in the diverging section. As pb increases, the shockwave experiences displacement toward the interior portion of the nozzle. The shockwave has an impact on Ma, leading to a reduction in the maximum Ma. There is no shockwave when pb is between 0.1 and 0.2 MPa, and the maximum Ma that the gas in the nozzle can attain is 2.01. When pb increases from 0.3 to 0.6 MPa, the maximum Ma in the nozzle decreases from 1.97 to 1.27. After the shockwave, Ma decreases suddenly, and the gas flow state changes to subsonic flow.
The design principle of a Laval nozzle is to utilize its convergent-divergent structure to accelerate the fluid to supersonic speeds. In the convergent section, the fluid velocity increases gradually, and the throat serves as the sonic point (where the velocity equals the speed of sound). At low back pressures, the fluid can accelerate sufficiently in the divergent section, forming a supersonic flow. As the back pressure rises, the obstruction effect of the external back pressure on the fluid intensifies, leading to the earlier formation of shock waves. The formation of shock waves causes a loss of fluid kinetic energy, thereby reducing the maximum Mach number. When the back pressure reaches 0.6 MPa, the shock wave is close to the throat, severely restricting the acceleration of the fluid in the divergent section. As a result, the fluid cannot reach a high Mach number, and the flow state transitions to subsonic.
Figs. 4–6 indicate that after a shockwave, the gas pressure and temperature rise dramatically, and Ma decreases sharply. Other physical properties of the gas also fluctuate following these rapid changes. The positive shockwave within the nozzle causes changes in multiple physical properties of the gas, and as the shockwave location advances, the region inside the nozzle where the gas can undergo expansion cooling shrinks. Originally, the gas could continue to expand and cool after the shockwave. However, the premature occurrence of the shockwave compresses the subsequent expansion process, leading to the gas failing to reach a sufficiently low final temperature and thus reducing the refrigeration efficiency of the nozzle.
4.3 Interaction Mechanism between the Boundary Layer and Shockwave
Contour plots of various physical characteristics of the natural gas flow field may be used to evaluate the interaction between the shockwave and boundary layer as well as to determine the type of shockwave that is generated there. When pb is 0.1~0.6 MPa, the contour plots are shown in Figs. 9–12.
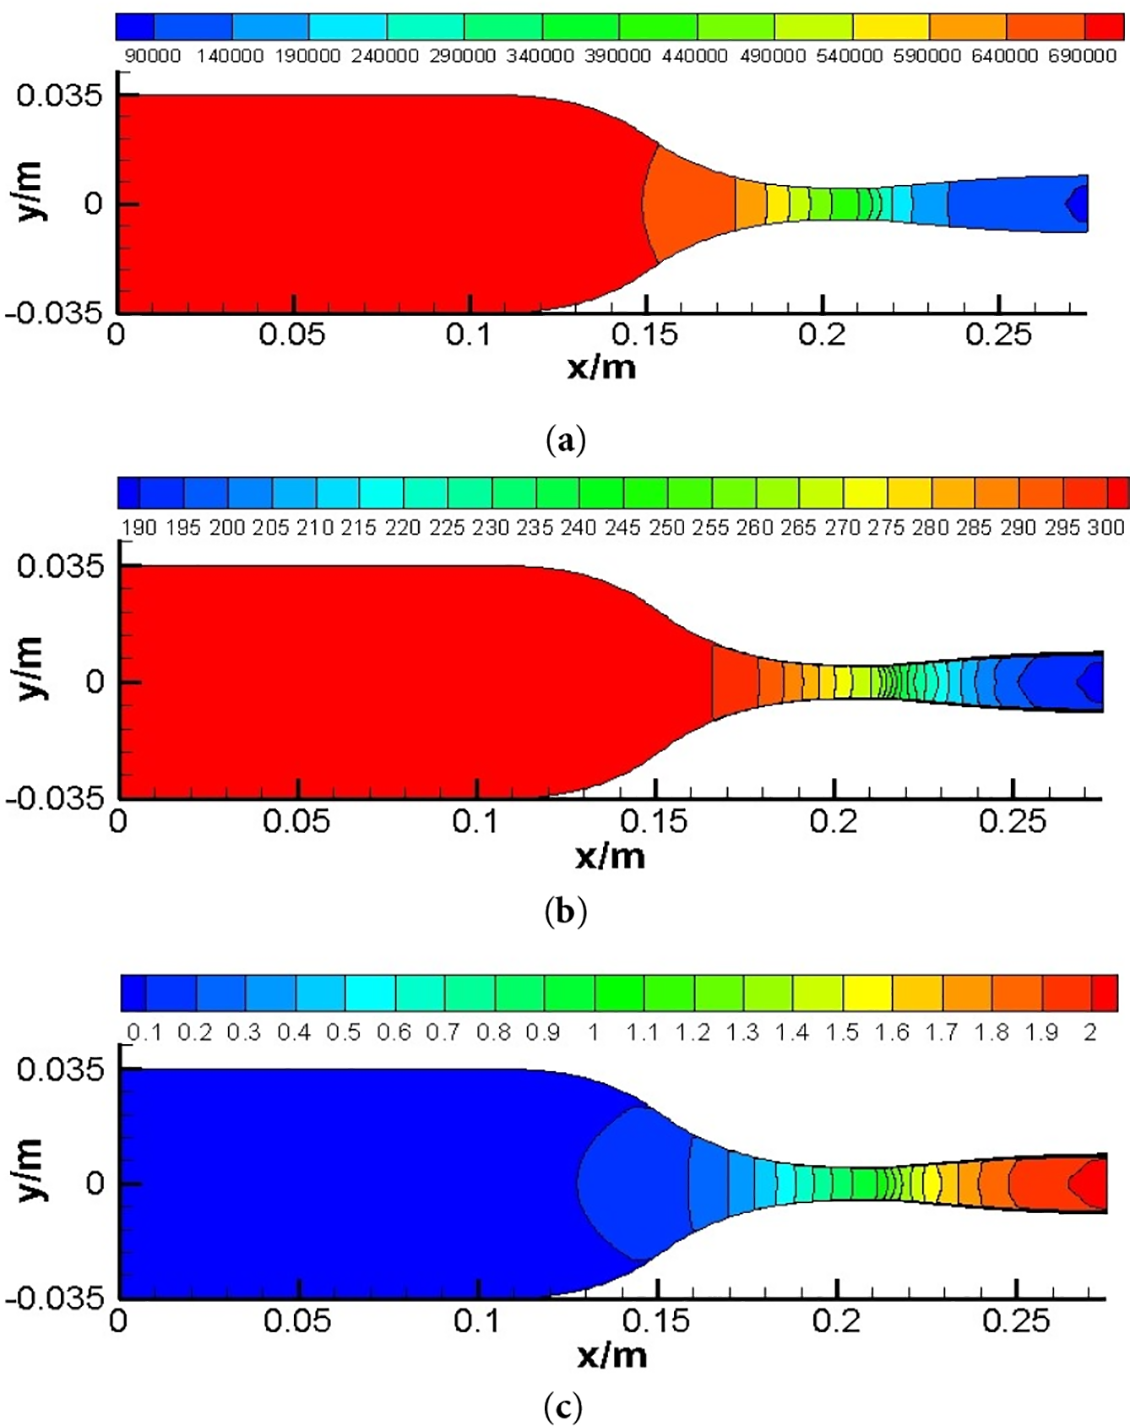
Figure 9: Gas flow field in the nozzle under back pressures of 0.1 MPa. (a) Pressure (Pa); (b) Temperature (K); (c) Mach number (-)
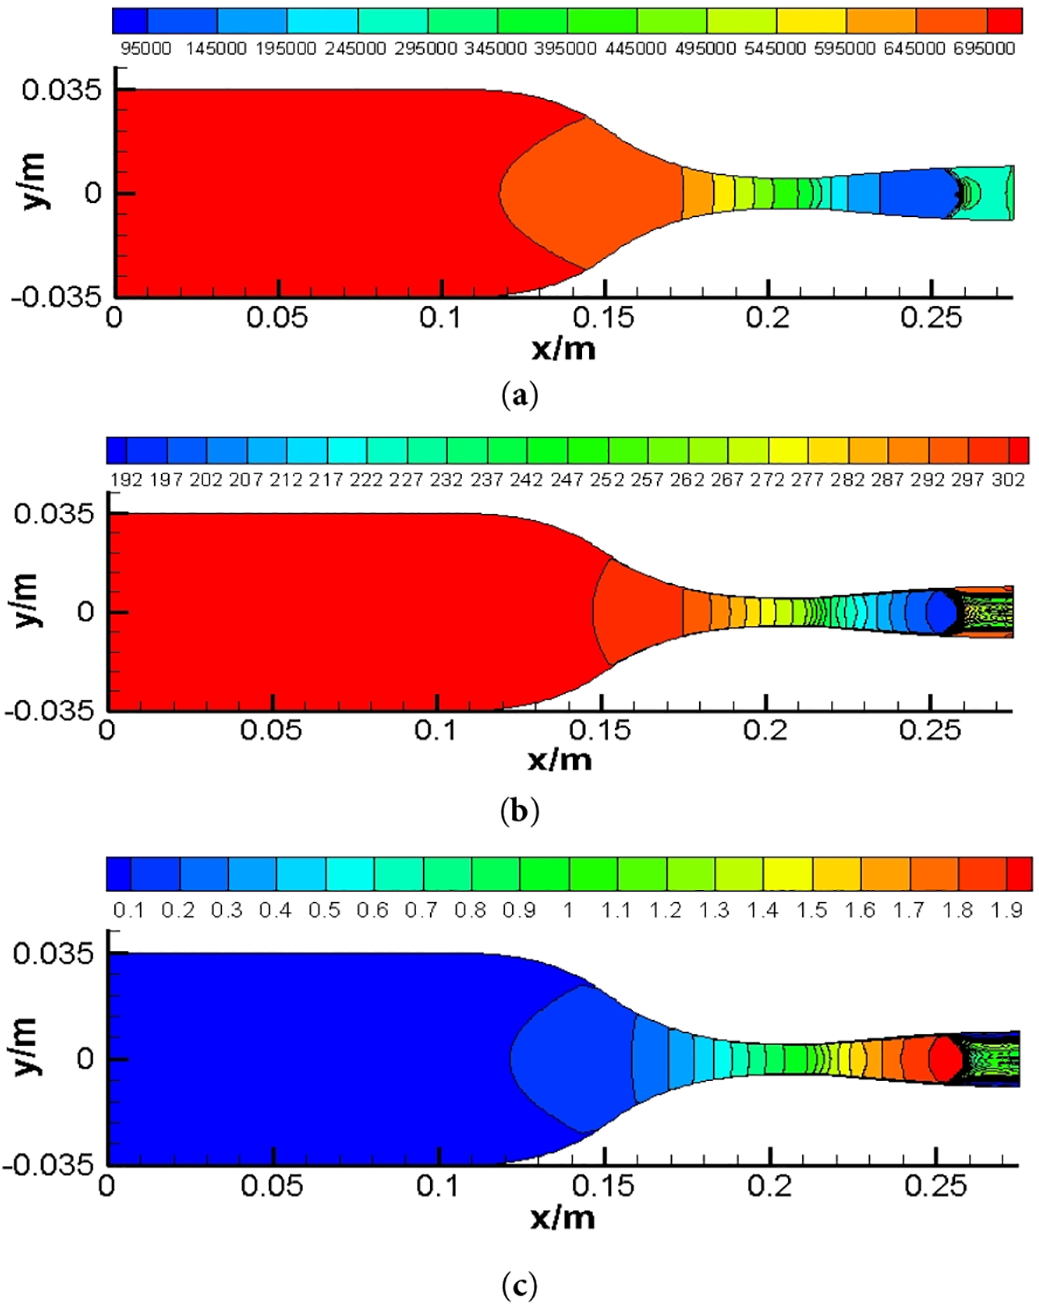
Figure 10: Gas flow field in the nozzle under a back pressure of 0.3 MPa. (a) Pressure (Pa); (b) Temperature (K); (c) Mach number (-)
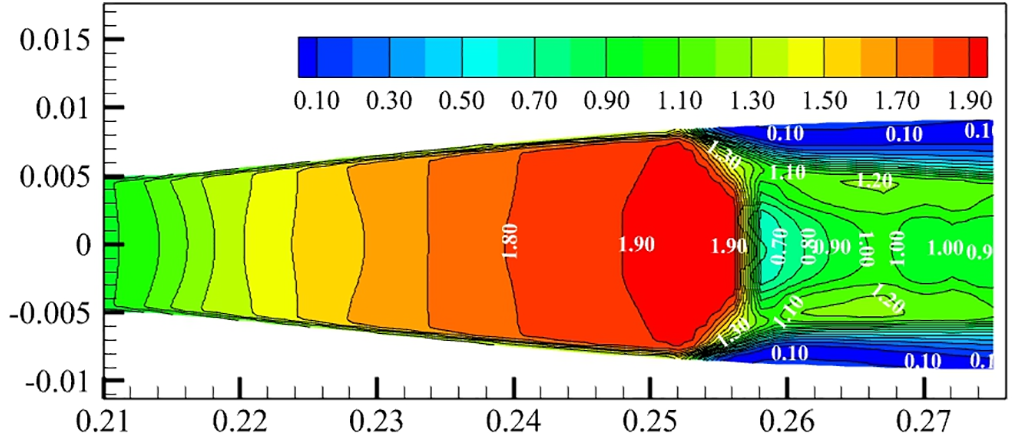
Figure 11: Local Mach number contour plot generated by the shockwave under a back pressure of 0.3 MPa

Figure 12: Local Mach number contour plots generated by the internal gas flow field in the nozzle. (a) pb = 0.4 MPa; (b) pb = 0.5 MPa; (c) pb = 0.6 MPa
As shown in Fig. 9, no shockwave occurs in the nozzle when pb is 0.1 MPa. The results indicate that when the back pressure is low, the gas inside the nozzle can expand sufficiently, forming a stable supersonic flow. In this case, the distribution of physical parameters (pressure, temperature, Mach number) in the flow field is relatively uniform, and there is no sudden change caused by shock waves. This shows that under low back pressure conditions, the performance of the nozzle is relatively stable, and it can effectively accelerate the gas to supersonic speed.
Fig. 10 shows that when the back pressure is 0.3 MPa, a distinct shock wave is visible, with a sudden pressure increase across the shock front (Fig. 10a). Post-shock temperature rises sharply, consistent with shock wave-induced energy dissipation (Fig. 10b). The Ma decreases rapidly over a relatively short distance after passing through the shockwave. Furthermore, the boundary layer near the wall separates under the impact of the shockwave, and the decrease in Ma near the wall is more dramatic than the downward trend on the central axis, whereby the intensity of the shockwave gradually decreases from the central axis to the wall, so the intensity of the shockwave on the central axis position is the greatest (Fig. 10c). The dominating flow is subsonic within the boundary layer and supersonic beyond the boundary layer. Shockwaves develop only in a supersonic field. When the shockwave is formed, the inverse pressure gradient traveling from downstream to upstream of the shock plane considerably modifies the condition of the boundary layer upstream of the shockwave.
The thickness of the boundary layer adjacent to the wall in close proximity to the shockwave significantly increases, as depicted in Fig. 11. Additionally, the reverse pressure gradient alters the local configuration of the shockwave within the near-wall region. The presence of the supersonic zone in close proximity to the boundary layer can result in the incidence of shockwaves generated in the main stream upon the boundary layer. Furthermore, the structure of these shockwaves undergoes modification subsequent to reflection by the boundary layer. The complex flow in the nozzle is a consequence of the interaction mechanism between the shockwave and the boundary layer.
Fig. 12 shows the Ma contour plots within the nozzle at pb values of 0.4, 0.5, and 0.6 MPa. Furthermore, as the magnitude of pb increases from 0.3 to 0.6 MPa, the location of the shockwave produced advances. The Ma upstream of the shockwave decreases from 1.97 to 1.27, whereas the Ma downstream of the shockwave changes more gradually, indicating a decrease in the shockwave intensity. Simultaneously, the thickness of the boundary layer separation caused by the shockwave decreases.
An increase in back pressure leads to the forward movement of the shock wave position. The decrease in Mach number upstream of the shock wave and the gentle change in Mach number downstream of the shock wave reflect the weakening of the shock wave intensity. This is because the increase in back pressure reduces the pressure ratio when the shock wave is formed, thereby reducing the energy loss caused by the shock wave. The reduction in the thickness of boundary layer separation indicates that as the back pressure increases, the influence of the adverse pressure gradient on the boundary layer weakens, thereby reducing the degree of flow separation.
The present study aimed to elucidate the precise location and generation mechanism of shockwaves in a nozzle. To achieve this objective, a mathematical model was developed to describe the behavior of supersonic gas in the nozzle. Subsequently, simulations were conducted to investigate the flow characteristics and refrigeration performance of a natural gas mixture subjected to the interaction of shockwaves and the boundary layer in the nozzle. The findings indicate the following conclusions:
(1) When the back pressure is less than 0.2 MPa, there is no shockwave in the nozzle, and effective pressure recovery is achieved while ensuring efficient refrigeration and liquefaction efficiency.
(2) The refrigeration efficiency of the nozzle decreases when pb increases from 0.3 to 0.6 MPa, and the xshock moves from 157 to 118 mm. The maximum Ma that the fluid can reach in the nozzle is reduced from 1.97 to 1.27. The minimum temperature increases by 55.18 K as pb increases from 0.2 to 0.6 MPa. To ensure refrigeration efficiency, measures should be taken to restrain pb within a reasonable range.
(3) When pb is greater than 0.3 MPa, the boundary layer near the wall separates under the action of the shockwave. The intensity of the shockwave decreases as Ma before the shockwave decreases from 1.97 to 1.27, as does the thickness of the boundary layer separation caused by the shockwave.
This study examines the disturbance to the internal thermodynamic equilibrium caused by shockwaves in Laval nozzles. The effectiveness of liquefaction inside the nozzle may be impacted by the presence of the shockwave because it causes some mechanical energy to be transformed into internal energy and causes the temperature to rise. Therefore, determining a reasonable pressure ratio can guide the nozzle to improve the pressure energy recovery and liquefaction efficiency.
Acknowledgement: Thanks to the State Key Laboratory of Low Carbon Catalysis and Carbon Dioxide Utilization for supporting this work.
Funding Statement: This work was supported by the National Science and Technology Major Project of China (2025ZD1406703) and the Open Fund of Key Laboratory of Oil & Gas Equipment, Ministry of Education (Southwest Petroleum University) (Grant No. OGE20230206).
Author Contributions: The authors confirm contribution to the paper as follows: study conception and design: Lei Zhao, Jiang Bian; data collection: Lihui Ma, Jiang Bian; analysis and interpretation of results: Junwen Chen, Jiang Bian; draft manuscript preparation: Lei Zhao, Pan Zhang, Jiang Bian; revision: Dong Sun, Jiang Bian. All authors reviewed the results and approved the final version of the manuscript.
Availability of Data and Materials: The datasets generated during and/or analyzed during the current study are available from the corresponding author on reasonable request.
Ethics Approval: Not applicable.
Conflicts of Interest: The authors declare no conflicts of interest to report regarding the present study.
References
1. Qin F, Tong M, Huang Y, Zhang Y. Modeling, prediction and analysis of natural gas consumption in China using a novel dynamic nonlinear multivariable grey delay model. Energy. 2024;305(1):132105. doi:10.1016/j.energy.2024.132105. [Google Scholar] [CrossRef]
2. Feijoo F, Iyer GC, Avraam C, Siddiqui SA, Clarke LE, Sankaranarayanan S, et al. The future of natural gas infrastructure development in the United States. Appl Energy. 2018;228(7):149–66. doi:10.1016/j.apenergy.2018.06.037. [Google Scholar] [CrossRef]
3. de Freitas VH, Restrepo JC, Simões-Moreira JR. Prediction of non-equilibrium condensation onset in a methane-carbon dioxide gas mixture flow through a supersonic separator nozzle and its operational parameters. Appl Therm Eng. 2025;278(1):127199. doi:10.1016/j.applthermaleng.2025.127199. [Google Scholar] [CrossRef]
4. Zhang W, Xie P, Li Y, Teng L, Zhu J. Hydrodynamic characteristics and mass transfer performance of rotating packed bed for CO2 removal by chemical absorption: a review. J Nat Gas Sci Eng. 2020;79:103373. doi:10.1016/j.jngse.2020.103373. [Google Scholar] [CrossRef]
5. Rashidi NA, Yusup S. Potential of palm kernel shell as activated carbon precursors through single stage activation technique for carbon dioxide adsorption. J Clean Prod. 2017;168:474–86. doi:10.1016/j.jclepro.2017.09.045. [Google Scholar] [CrossRef]
6. Han Y, Ho WSW. Polymeric membranes for CO2 separation and capture. J Membr Sci. 2021;628:119244. doi:10.1016/j.memsci.2021.119244. [Google Scholar] [CrossRef]
7. Wang S, Wang C, Ding H, Li S. Evaluation of dynamic behaviors in varied swirling flows for high-pressure offshore natural gas supersonic dehydration. Energy. 2024;300:131498. doi:10.1016/j.energy.2024.131498. [Google Scholar] [CrossRef]
8. Lakzian E, Yazdani S, Salmani F, Mahian O, Kim HD, Ghalambaz M, et al. Supersonic separation towards sustainable gas removal and carbon capture. Prog Energy Combust Sci. 2024;103(1):101158. doi:10.1016/j.pecs.2024.101158. [Google Scholar] [CrossRef]
9. Ding H, Zhang Y, Sun C, Yang Y, Wen C. Numerical simulation of supersonic condensation flows using Eulerian-Lagrangian and Eulerian wall film models. Energy. 2022;258:124833. doi:10.1016/j.energy.2022.124833. [Google Scholar] [CrossRef]
10. Ding H, Zhang Y, Dong Y, Wen C, Yang Y. High-pressure supersonic carbon dioxide (CO2) separation benefiting carbon capture, utilisation and storage (CCUS) technology. Appl Energy. 2023;339(3):120975. doi:10.1016/j.apenergy.2023.120975. [Google Scholar] [CrossRef]
11. Bian J, Cao X, Yang W, Song X, Xiang C, Gao S. Condensation characteristics of natural gas in the supersonic liquefaction process. Energy. 2019;168:99–110. doi:10.1016/j.energy.2018.11.102. [Google Scholar] [CrossRef]
12. Jassim E, Abdi MA, Muzychka Y. Computational fluid dynamics study for flow of natural gas through high-pressure supersonic nozzles: part 1. Real gas effects and shockwave. Petrol Sci Technol. 2008;26(15):1757–72. doi:10.1080/10916460701287847. [Google Scholar] [CrossRef]
13. Jassim E, Abdi MA, Muzychka Y. Computational fluid dynamics study for flow of natural gas through high-pressure supersonic nozzles: part 2. Nozzle geometry and vorticity. Petrol Sci Technol. 2008;26(15):1773–85. doi:10.1080/10916460701304410. [Google Scholar] [CrossRef]
14. Karimi A, Abdi MA. Selective dehydration of high-pressure natural gas using supersonic nozzles. Chem Eng Process Process Intensif. 2009;48(1):560–8. doi:10.1016/j.cep.2008.09.002. [Google Scholar] [CrossRef]
15. Malyshkina MM. The procedure for investigation of the efficiency of purification of natural gases in a supersonic separator. High Temp. 2010;48(2):244–50. doi:10.1134/S0018151X10020161. [Google Scholar] [CrossRef]
16. Liu Y, Cao X, Yang J, Li Y, Bian J. Energy separation and condensation effects in pressure energy recovery process of natural gas supersonic dehydration. Energy Convers Manag. 2021;245(1):114557. doi:10.1016/j.enconman.2021.114557. [Google Scholar] [CrossRef]
17. Yang Y, Wen C, Wang S, Feng Y. Theoretical and numerical analysis on pressure recovery of supersonic separators for natural gas dehydration. Appl Energy. 2014;132(5):248–53. doi:10.1016/j.apenergy.2014.07.018. [Google Scholar] [CrossRef]
18. Niknam PH, Mortaheb HR, Mokhtarani B. Dehydration of low-pressure gas using supersonic separation: experimental investigation and CFD analysis. J Nat Gas Sci Eng. 2018;52(2):202–14. doi:10.1016/j.jngse.2017.12.007. [Google Scholar] [CrossRef]
19. Liu Y, Cao X, Guo D, Cao H, Bian J. Influence of shock wave/boundary layer interaction on condensation flow and energy recovery in supersonic nozzle. Energy. 2023;263:125662. doi:10.1016/j.energy.2022.125662. [Google Scholar] [CrossRef]
20. Ma Q, Hu D, He G, Hu S, Liu W, Xu Q, et al. Performance of inner-core supersonic gas separation device with droplet enlargement method. Chin J Chem Eng. 2009;17(6):925–33. doi:10.1016/S1004-9541(08)60298-0. [Google Scholar] [CrossRef]
21. Chen J, Wang T, Li A, Huang Z, Jiang W, Xi G. Effect of wall thermal condition on the nonequilibrium condensation of CO2 in supersonic flows. Int J Therm Sci. 2024;195:108650. doi:10.1016/j.ijthermalsci.2023.108650. [Google Scholar] [CrossRef]
22. Xu J, Zhao C. Two-dimensional numerical simulations of shock waves in micro convergent-divergent nozzles. Int J Heat Mass Transf. 2007;50(11–12):2434–8. doi:10.1016/j.ijheatmasstransfer.2006.11.036. [Google Scholar] [CrossRef]
23. Fang X, Shen C, Sun M, Hu Z. Effects of oblique shock waves on turbulent structures and statistics of supersonic mixing layers. Phys Fluids. 2018;30(11):116101. doi:10.1063/1.5051015. [Google Scholar] [CrossRef]
24. Patel A, Singh M. Exact solution of shock wave structure in a non-ideal gas under constant and variable coefficient of viscosity and heat conductivity. Shock Waves. 2019;29(3):427–39. doi:10.1007/s00193-018-0855-8. [Google Scholar] [CrossRef]
25. Tang Y, Liu Z, Li Y, Zhao F, Fan P, Chua KJ. Mixing process of two streams within a steam ejector from the perspectives of mass, momentum and energy transfer. Appl Therm Eng. 2021;185(113925):116358. doi:10.1016/j.applthermaleng.2020.116358. [Google Scholar] [CrossRef]
26. Ding H, Li Y, Lakzian E, Wen C, Wang C. Entropy generation and exergy destruction in condensing steam flow through turbine blade with surface roughness. Energy Convers Manag. 2019;196(3–4):1089–104. doi:10.1016/j.enconman.2019.06.066. [Google Scholar] [CrossRef]
27. Wyslouzil BE, Heath CH, Cheung JL, Wilemski G. Binary condensation in a supersonic nozzle. J Chem Phys. 2000;113(17):7317–29. doi:10.1063/1.1312274. [Google Scholar] [CrossRef]
Cite This Article
 Copyright © 2026 The Author(s). Published by Tech Science Press.
This work is licensed under a Creative Commons Attribution 4.0 International License , which permits unrestricted use, distribution, and reproduction in any medium, provided the original work is properly cited.
 Downloads
 Citation Tools