
 Submit a Paper
 Propose a Special lssue
 Open Access
ARTICLE

Harvesting Wave Energy: An Economic and Technological Assessment of the Coastal Areas in Sarawak
1 Faculty of Engineering, Computing and Science, Swinburne University of Technology, Jalan Simpang Tiga, Kuching, 93350, Sarawak, Malaysia
2 College of Engineering, Faculty of Computing, Engineering and the Built Environment, Birmingham City University, Birmingham, B4 7XG, West Midlands, UK
* Corresponding Author: Hadi Nabipour Afrouzi. Email:
(This article belongs to the Special Issue: Artificial Intelligence-Driven Advanced Wave Energy Control Technology)
Energy Engineering 2026, 123(2), 10 https://doi.org/10.32604/ee.2025.070501
Received 17 July 2025; Accepted 09 October 2025; Issue published 27 January 2026
 View Full Text
 Download PDF
Abstract
Wave energy is a promising form of marine renewable energy that offers a sustainable pathway for electricity generation in coastal regions. Despite Malaysia’s extensive coastline, the exploration of wave energy in Sarawak remains limited due to economic, technical, and environmental challenges that hinder its implementation. Compared to other renewable energy sources, wave energy is underutilized largely because of cost uncertainties and the lack of local performance data. This research aims to identify the most suitable coastal zone in Sarawak that achieves an optimal balance between energy potential, cost-effectiveness, and environmental impact, particularly in relation to infrastructure and regional development. The findings indicate that wave energy generation in Sarawak is technically feasible based on MOGA analysis. Among the studied sites, Bintulu emerged as the most balanced option, with a levelized cost of electricity (LCOE) of 0.778–0.864 USD/kWh and a CO2 emission factor as low as 0.019–0.020 CO2/kWh. Miri, while producing lower emissions than Sematan, recorded a higher LCOE of 1.045 USD/kWh with moderate emissions at 0.029 CO2/kWh. Sematan, characterized by weaker wave conditions and higher installation penalties, resulted in the least favorable outcome, with an LCOE of 3.735 USD/kWh. Bintulu’s strategic location reduces CAPEX requirements, making it the most suitable site for large-scale wave energy deployment in Sarawak.Keywords
The urgency to transition away from fossil fuels has placed marine renewable energy at the forefront of global clean energy strategies. Among the various ocean-based resources, wave energy stands out due to its consistency, predictability, and high energy density. Harnessing the kinetic and potential energy of ocean waves provides a sustainable pathway for electricity generation, particularly for coastal nations that seek to diversify their energy mix and reduce dependence on fossil fuels.
Although wave energy is often regarded as an emerging technology, it is not entirely new. Countries such as the United Kingdom, Portugal, and Denmark have been pioneers in advancing research and development on wave energy converters (WECs), with many devices tested under real-world marine conditions [1]. However, despite these advancements, the commercialization of wave energy continues to face significant challenges. One of the challenges is that wave energy has high capital expenditures (CAPEX) associated with the installation of offshore infrastructure. This will automatically lead to high operational expenditures (OPEX) because it needs to be operated in a harsh marine environment, which will increase the overall cost of energy production. These financial hurdles have made the Levelized Cost of Energy (LCOE) for wave energy higher than more mature renewable sources like wind and solar [2].
Nevertheless, the global potential of wave energy is substantial. Studies estimate that wave energy could generate up to 32,000 TWh annually which is equivalent to more than twice the world’s current electricity consumption [3]. This immense resource has driven continued global interest in its development. For Malaysia, and particularly for Sarawak, this represents an untapped opportunity. Sarawak’s coastline, which is directly exposed to the South China Sea, provides favorable conditions for testing and deploying wave energy technologies. Coastal regions such as Miri and Bintulu stand out as potential sites, not only due to their open-sea exposure but also because of their alignment with the state’s broader renewable energy ambitions under the Sarawak Corridor of Renewable Energy (SCORE) initiative. By leveraging both local conditions and global advancements in wave energy technology, Sarawak could position itself as a regional leader in marine renewable energy.
This study aims to conduct a comprehensive investigation into the economic model of wave energy development along Sarawak’s coastal areas, focusing on identifying the most suitable WEC for the coastal region’s marine conditions by doing MOGA optimization. By allowing for the simultaneous evaluation of key criteria such as LCOE, CO2 emissions, and installation feasibility, it will help in defining the techno-economic analysis. This study will also seek to evaluate and recommend the most efficient WEC technologies that not only optimize power generation under Sarawak’s wave characteristics but also ensure high durability and minimal environmental disruption, aligning with the region’s commitment to clean and resilient energy solutions. This approach helps to find a balanced decision-making process to determine the most feasible wave energy solution for Sarawak.
Despite the promising potential, research on wave energy implementation in Sarawak remains limited. This study, therefore, seeks to fill a critical knowledge gap by evaluating the economic feasibility of wave energy and identifying technologies most compatible with Sarawak’s coastal conditions. This study also focuses on identifying wave energy technologies that are best suited to Sarawak’s coastal conditions, with the aim of optimizing their performance for sustainable energy generation.
2.1 Economics and Technological Studies of Wave Energy
The concept of wave energy dates to 1799, when Girard and his son received the first patent for wave energy conversion. In 1910, Busso Belasek constructed a 1 kW pneumatic wave power station in France. The first commercial application came in the 1940s when Yoshio Masuda developed oscillating water column (OWC) buoys in Japan. By 1965, these buoys, generating 60–500 W, were widely exported [4].
The 1970s oil crisis prompted international research, with contributions from Salter (UK), Budal (Norway), and McCormick (USA). Japan’s “Hamming” test ship generated 190,000 kWh/year, while China tested a 1 kW buoy in 1975 and a kilowatt-level OWC in 1978 [4]. Despite a reduction in funding during the 1980s due to declining oil prices, wave energy development has evolved. In the 1980s–1990s, projects like TAPCHAN (350–500 kW, Norway), LIMPET (500 kW, UK), and Pico Plant (400 kW, Portugal) pushed the field forward [5].
Modern systems include Denmark’s Wave Dragon (5.9 MW), Japan’s Mighty Whale, and Sweden’s OWEL (350 kW). In 2015, China deployed the 120 kW Wanshan project, and in 2022, the UK’s AWS unit achieved 80 kW under moderate conditions [4].
These milestones reflect a transformative evolution in WEC technology, positioning wave energy as a promising and strategic contributor to the global renewable energy framework, with the potential to deliver consistent, grid-integrated power from the ocean’s untapped resources.
Europe continues to lead global wave energy development, having installed a cumulative total of 13.3 MW since 2010. However, much of this capacity, which amounted to approximately 12.3 MW, has been decommissioned following the completion of demonstration phases. Despite this, the sector is getting more advanced, as evidenced by the installation of 595 kW of new capacity in 2023. This improvement highlights a growing technology with notable projects such as CorPower Ocean’s C4 installation in Portugal and Simply Blue’s 5 MW wave farm in Ireland reflect the sector’s transition toward industrialization [6].
In Asia, China has strategically incorporated wave energy into its national energy planning through dedicated five-year plans and financial incentives such as high feed-in tariffs. This has led to the development of several projects, most notably a 1 MW wave energy system in Guangdong led by the Guangzhou Institute of Energy Conversion. Meanwhile, in North America, the United States has shown a growing commitment to the sector, with the federal government allocating $120 million in 2023 alone and a total of $520 million since 2019. These funds have supported significant initiatives, including the deployment of Oscilla Power’s Triton point absorber in Maine and OPT’s MOSWEC project in New Jersey [6].
Wave energy has the highest LCOE, where its estimated value ranges between EUR 0.30/kWh and EUR 1.20/kWh. However, it is still the highest LCOE even if it is measured in different currencies, where it ranges between USD 0.18–0.87/kWh. Even if it is compared to other renewable energy sources like solar energy, which ranges from USD 0.06/kWh to USD 0.38/kWh, while offshore wind energy ranges from USD 0.10/kWh to USD 0.56/kWh, wave energy still has the greatest amount of LCOE than the other renewable energy sources [7].
Table 1 below shows several WEC types that have been developed globally, each was installed according to different sea conditions:
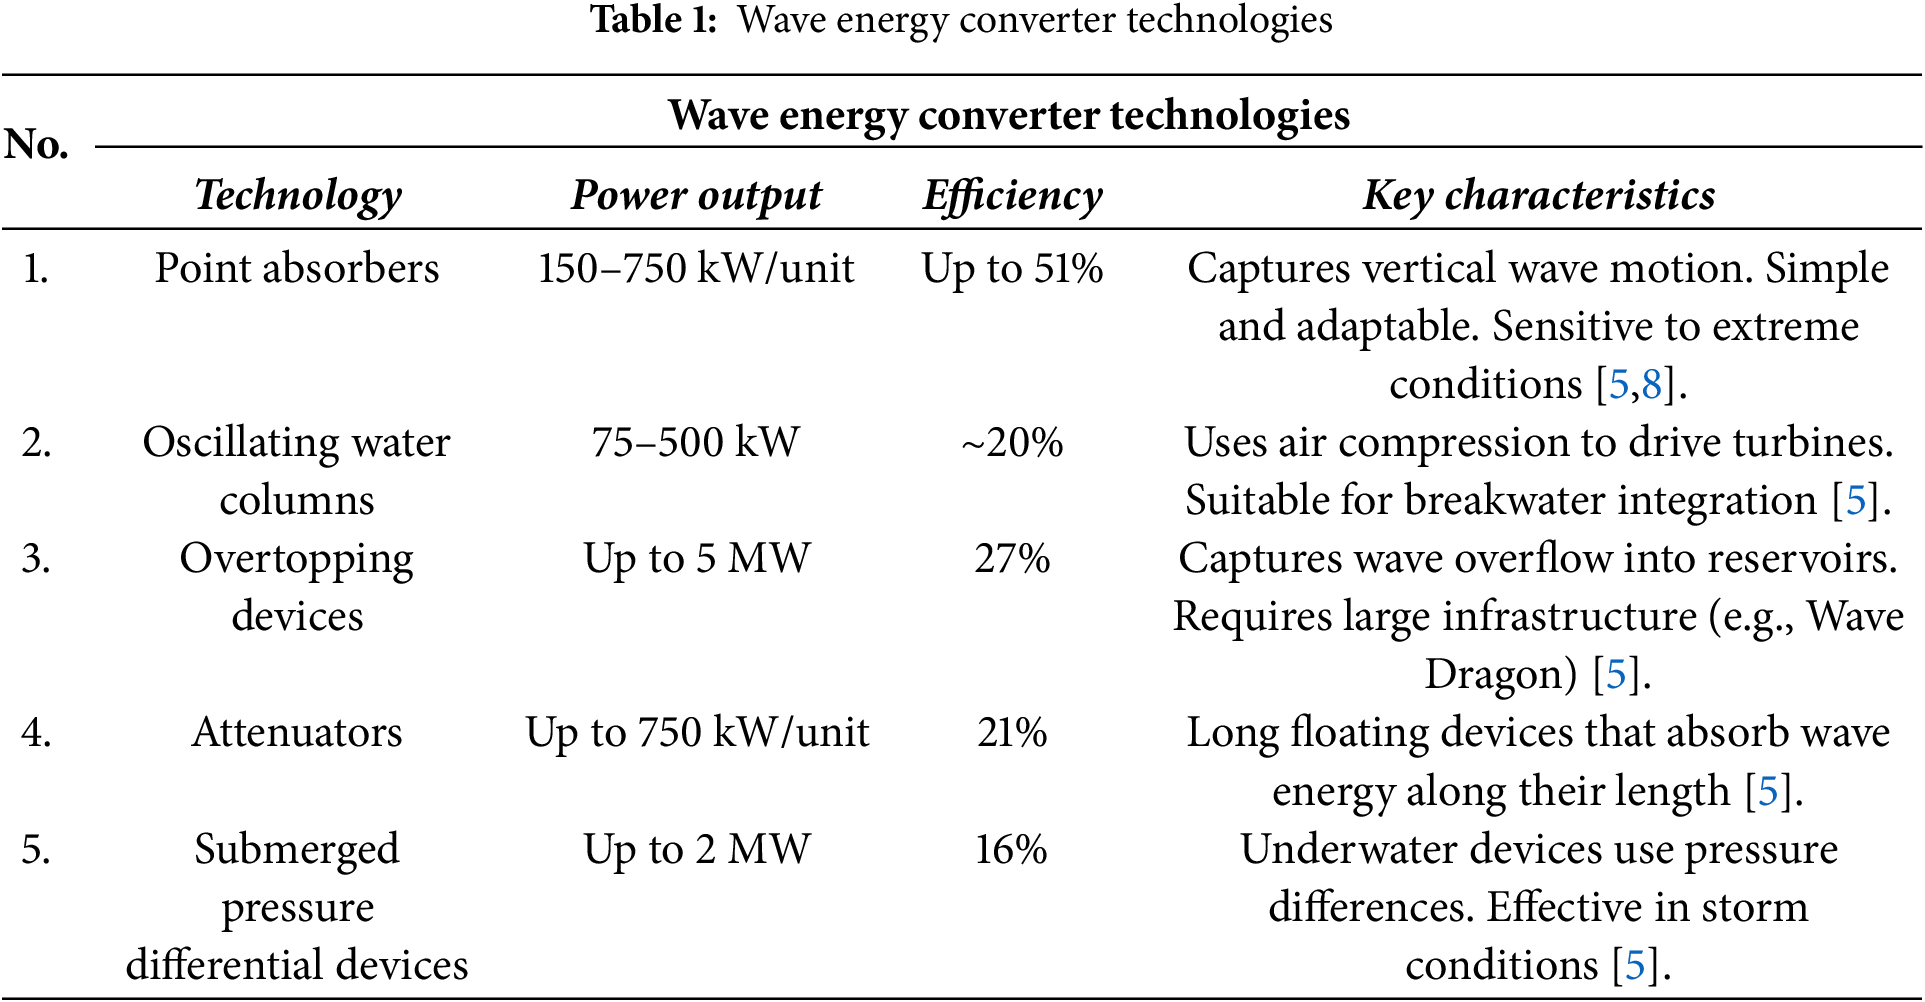
The choice of electrical generator and its control system is important in determining the efficiency and scalability of wave energy conversion systems, as highlighted in Table 1. In recent years, Linear Permanent Magnet Generators (LPMGs) have gained significant technology, particularly in point absorber WECs, due to their ability to directly convert the vertical heaving motion of waves into electricity without relying on gearboxes or hydraulic linkages [4]. These generators operate on Faraday’s Law of Electromagnetic Induction, where the vertical movement of a translator embedded with permanent magnets through a stator coil induces an electromotive force (EMF). The absence of mechanical intermediaries not only reduces energy loss but also improves reliability in the harsh marine environment [4].
LPMGs offer high energy efficiency, often exceeding 80%, and are well-suited to the slow, oscillatory nature of wave motion. Their design supports bidirectional movement, enabling energy harvesting from both the crest and trough of each wave cycle [5]. Materials like NdFeB magnets and advanced coil configurations such as Halbach arrays are often used to improve flux concentration and output power density [4]. Furthermore, Permanent Magnet Synchronous Generators have been widely used in rotational and hybrid WEC designs. These generators provide high torque at low speeds and are typically integrated with Voltage Source Converters (VSCs) that perform AC–DC–AC conversion. The first VSC rectifies the generator’s output to DC, and the second VSC inverts it back to synchronized AC for grid compatibility [7,9]. This configuration ensures stable frequency and voltage, which is critical for utility-scale grid integration, especially under the variable and intermittent conditions inherent to wave energy systems.
In terms of overall electrical energy flow, the process of the conversion of AC–DC–AC is needed as the oceanic wave was harvested directly from the ocean, which will vary the AC output. Thus, the linear generator cannot be installed directly on the grid [10]. As a result, the variable nature of the wave energy generation will produce a fluctuating wave motion, which makes a non-uniform electrical output. Hence, to make it stable, the AC output will be converted to DC by using a rectifier to ensure a steady electrical flow. Lastly, the stabilized DC power will be converted back to AC by using an inverter to make the voltage and frequency compatible with the grid standards [11]. The power flow of wave energy is shown in Fig. 1.
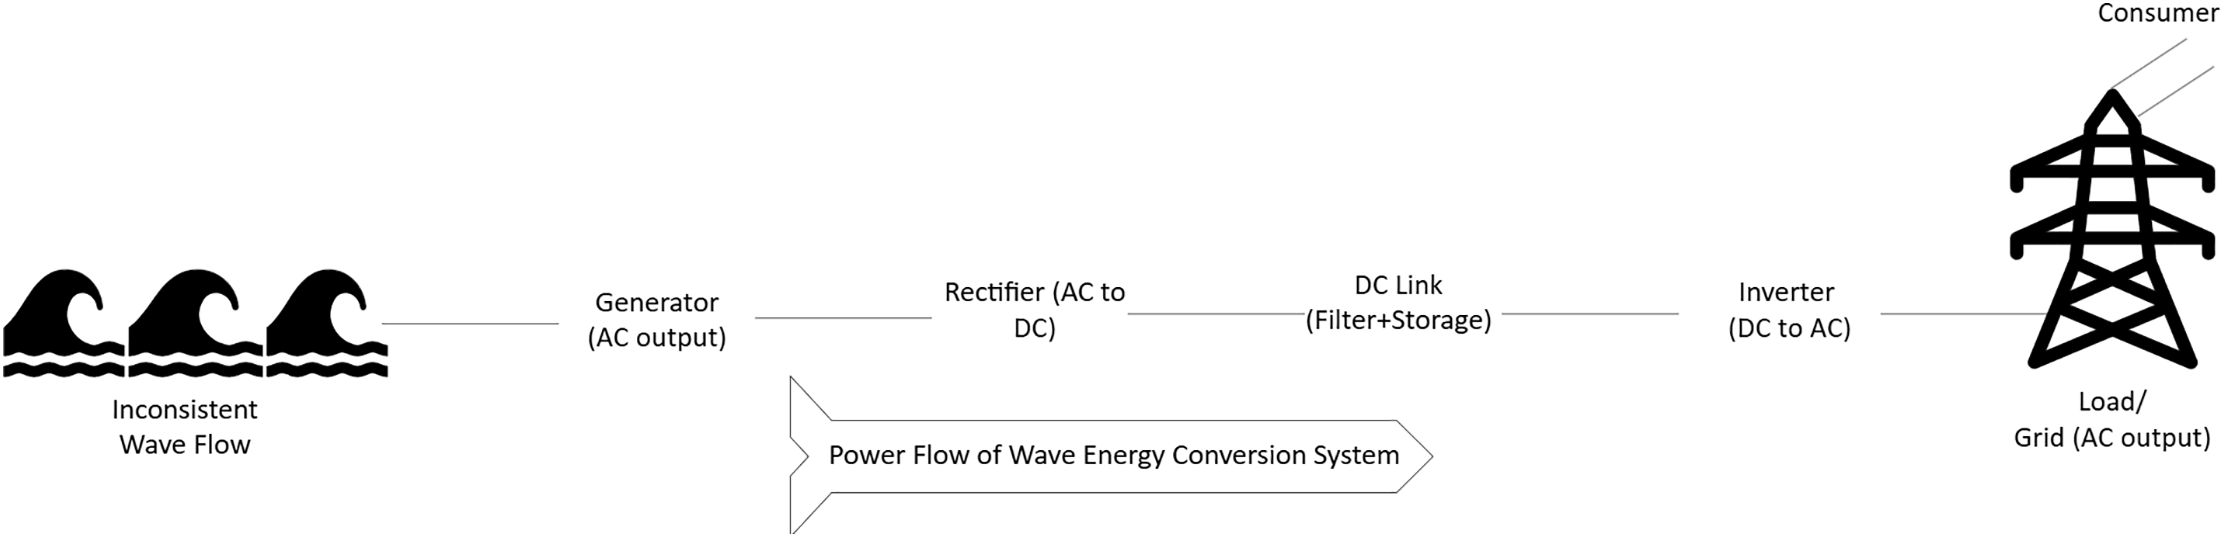
Figure 1: Power flow of wave energy conversion
This research directly supports SDGs, with a particular focus on clean energy, climate action, and sustainable marine infrastructure. By assessing wave energy potential in three coastal areas of Sarawak, which were Bintulu (Similajau), Miri, and Sematan. The study contributes to the global agenda for sustainable development in the energy sector. SDG 7 in this work contributes to increasing the share of renewable energy in Malaysia’s energy mix by identifying viable marine energy resources and proposing a techno-economic framework for wave energy implementation. The identification of Miri as a high-potential site with 2323.51 kW/m power density and Bintulu for scalable deployment supports national and regional efforts to diversify sustainable energy sources.
2.2 Recent Advances in Wave Energy Research
In recent years, wave energy research has progressed rapidly, with a growing focus on optimisation frameworks, advanced control strategies, and realistic validation methods. These state-of-the-art approaches not only improve the technical performance of WECs but also strengthen their economic competitiveness and deployment feasibility. Several recent studies provide valuable insights that directly align with this work, particularly in the areas of multi-objective optimisation, inertial and multi-axis device design, hardware-in-the-loop validation, and control-driven energy maximisation.
Shadmani et al. (2024) presented an adaptive systematic optimisation framework for multi-axis wave energy converters that combines the Boundary Element Method solver with a many-objective evolutionary algorithm. Their study evaluated four different buoy geometries, which were cylindrical, triangular, quadrilateral, and octagonal that is across varying draft, radius, and height to reflect realistic design scenarios. Performance was assessed under multiple objectives in hydrodynamic energy absorption, structural loads, device spacing, LCOE, and Net Present Value (NPV). Through iterative optimisation, they found that cylindrical and octagonal devices consistently achieved higher capture efficiency and more attractive economic performance, while triangular geometries underperformed due to limited hydrodynamic interaction. The significance of this result lies not only in identifying “better” geometries, but also in showing that evolutionary optimisation can systematically filter out poor designs and deliver Pareto fronts that reveal trade-offs between cost and performance tools [12].
Carapellese et al. (2023) applied Non-Dominated Sorting Genetic Algorithm II (NSGA-II) optimisation which unlike conventional Inertial Sea Wave Energy Converter (ISWEC) devices, can absorb energy from multi-directional wave scatter. The study varied parameters such as gyroscopic inertia, take-off system (PTO) damping, and operational settings, then simulated device performance under wave conditions from two test sites: Pantelleria (Italy, mild directional seas) and the North Sea (Denmark, harsher directional seas). Objectives included annual energy production (AEP), NPV, and LCOE, allowing NSGA-II to produce Pareto fronts that captured the tension between maximizing output and minimizing costs or loads. Results showed that the Swinging Omnidirectional Wave Energy Converter offered higher energy absorption than ISWEC in directional seas, but at the cost of larger internal loads and higher material demands. The benefit of NSGA-II here is that it identified “sweet spots” where the energy gain was worth the extra cost, avoiding overdesign. This structured multi-objective method proved superior to traditional deterministic design, which typically optimises one objective at a time and risks overlooking viable compromises [13].
Gaspar et al. (2023) provided a comprehensive review of hardware-in-the-loop (HIL) simulations for WECs and PTO systems, classifying them into three categories which were simulated subsystems (hydrodynamics reproduced in software), real subsystems (physical PTOs or controllers under test), and interface subsystems (actuators, emulators, and sensors bridging the two). HIL allows developers to test PTO dynamics, control algorithms, and grid converters in real time using virtual waves, avoiding the cost and risk of premature sea trials. Case studies in the review showed that HIL experiments revealed nonlinear damping, actuator saturation, and unexpected controller–hardware mismatches. Factors that pure numerical models overlooked prove that HIL produces results closer to field reality and thus reduces uncertainty in techno-economic predictions [14]. In parallel, Li et al. (2023) advanced hierarchical Model Predictive Control (MPC) for a Wavestar-like device. Their system combined a Kalman filter to estimate wave excitation, an Extended Kalman Filter to extract amplitude and frequency, and Gaussian Process models to forecast excitation and reference velocity. A low-level MPC then tracked this optimal velocity to maximise absorbed power. Compared to conventional resistive or passive damping controls, this hierarchical approach achieved significantly higher energy extraction while keeping PTO forces within safe operational limits [15]. This demonstrates that intelligent control can directly improve yield and reduce LCOE, providing a compelling case for including advanced control strategies in techno-economic optimisation frameworks like yours.
2.3 Fundamentals of Wave Energy Systems
A linear generator is a type of electromagnetic generator between a magnetic field and a conductor that will generate electricity, which differs from the conventional rotary generators as it uses the linear motion of the buoy or any other WECs devices that move in response to wave action.
The mechanical motion of the system can be modeled as a spring-mass-damper system, driven by wave forces and resisted by electromagnetic forces, where
For the wave forces, its hydrodynamic force acted on the buoy with the sum of excitation, radiation, and hydrostatic forces, which can be derived as in Eq. (3).
Next, the mechanical dynamics of the linear generator system that is modelled as a spring mass damper system will be derived as Eq. (4).
Then, the electromagnetic dynamics behind the linear generator where the EMF will be generated were described based on Kirchhoff’s Voltage Law.
After that, the electromagnetic force on the linear generator will be expressed as Eq. (6), where the force is proportional to the velocity of the translator
Wave energy can be derived through the wave energy flux equation, which is directly related to the wave height and the wave period. The wave’s power is proportional to its height and directly proportional to the wave’s period. It follows measures of wave energy, which will increase with increased wave height and increased wave period. Eq. (6) below can be applied only in areas with deep water [8].
where:
•
•
•
•
•
Sarawak’s coastline along the South China Sea presents varying levels of wave energy potential across three main sites, which are Bintulu, Miri, and Sematan. These locations are evaluated based on wave power density, infrastructure accessibility, and suitability for WEC deployment. By considering all the evaluated criteria, Miri emerges as the location with the highest potential for wave energy generation due to its optimal wave characteristics, although accompanied by specific industrial and economic challenges. Bintulu also provides a promising option, particularly in terms of scale and existing infrastructure support, whereas Sematan remains suitable for smaller, demonstrational wave energy projects.
In conducting this study, a structured methodology was adopted to comprehensively evaluate and implement wave energy projects along the coast of Sarawak. The initial step involved the identification of suitable locations through geographic and oceanographic analysis. This process utilizes detailed online resources such as Google Maps, Surf-forecast.com, Surfline.com, and tides4fishing.com, providing detailed data including wave height, wave period, and potential power generation capabilities. These criteria were essential in determining optimal locations for wave energy farms, specifically focusing on Bintulu, Miri, and Sematan.
A detailed equipment cost breakdown formed the subsequent phase of the research. According to the techno-economic guidance, CAPEX was systematically divided into specific categories, including Structure and PTO, Mooring and Foundation, Installation and Commissioning, Grid Connection, Operations and Maintenance (O&M), and Project Management. Each of these categories was evaluated using standardized costing methods and validated against international benchmarks such as those provided by Têtu and Fernandez Chozas [16]. The cost of installing WEC is calculated based on the following formula.
For
The submarine cable that was used in wave energy implementation was based on 33 kV three-phase high voltage. The cost of submarine cable installation and material was evaluated using two separate equations [1]. According to Guidi and Fosso [17], the cable material cost depends on the length of the cable, voltage rating, and the specific construction that includes conductor size and insulation condition. The
By referring to [18], Eq. (11) was used to find the inverter installation costs where
Eq. (12) was used to calculate the total cost of the rectifier, where
From [17], the equation to find the cost of installation of the generator has been derived as below:
Decommissioning was a cost that referred to the process of safely removing and disposing of the infrastructure of the wave energy converter after it had reached the project lifespan. This is important for environmental sustainability, reduces potential risks, and handles the final disposal of equipment in a responsible way. This includes the removal of all physical structures, such as turbines, WECs, subsea cables, substations, and any other associated infrastructure. This incident is often seen at the reverse operation of the installation and during the commissioning process. It has 10% of the CAPEX estimated cost [16].
The balance of the plant is important in the wave energy installation because it includes all the infrastructure necessary based on the power take-off system (PTO). PTO was known as a mechanism that captures and converts mechanical energy from ocean waves into electrical energy. The PTO system and mooring will be needed for a successful installation, where their cost is included with the installation of the electrical for the grid utilization. BoP is important as it has the second biggest impact on CAPEX. It has a 33% cost estimated for the CAPEX [16].
A series of payments distributed over time was transformed from the initial investment, and the discount rate
This method will help to make sure that the comparisons of costs and revenues across different time periods will be fair enough to account for the time value of money [7].
3.1.8 Levelized Cost of Energy
According to Tetu [16], the equation of the LCOE above presents a value of the average minimum price of the electricity produced, which can be sold to break even based on the lifetime of the wave energy project. CAPEX is known for capital expenditure, while OPEX is known for operational expenditure.
The numerator of the t represents the year, while AEP stated above is the annual electricity output at year t. The numerator of r represents the discount rate, while n is known as the terminal year of the lifespan of the wave energy project.
3.1.9 Scenarios of Three Locations in Sarawak
Before deciding on each location to be a potential wave energy farm implementation. The study explored through Google Maps, Surf-forecast.com, Surfline.com, and tides4fishing.com to find the suitability and economic viability of wave energy implementation. Then, all the procedure for finding a suitable wave height, wave period, and water depth was figured out to recognize a suitable wave energy farm in Sarawak. Below is what has been found throughout the findings.
Table 2 might have some limitations, as it was collected through a website and not from official meteorology. This result was just obtained by a calculation using Eq. (7) based on its wave height and period. From what can be concluded above, it is shown that higher wave heights and optimal wave periods are prioritized to maximize energy capture.
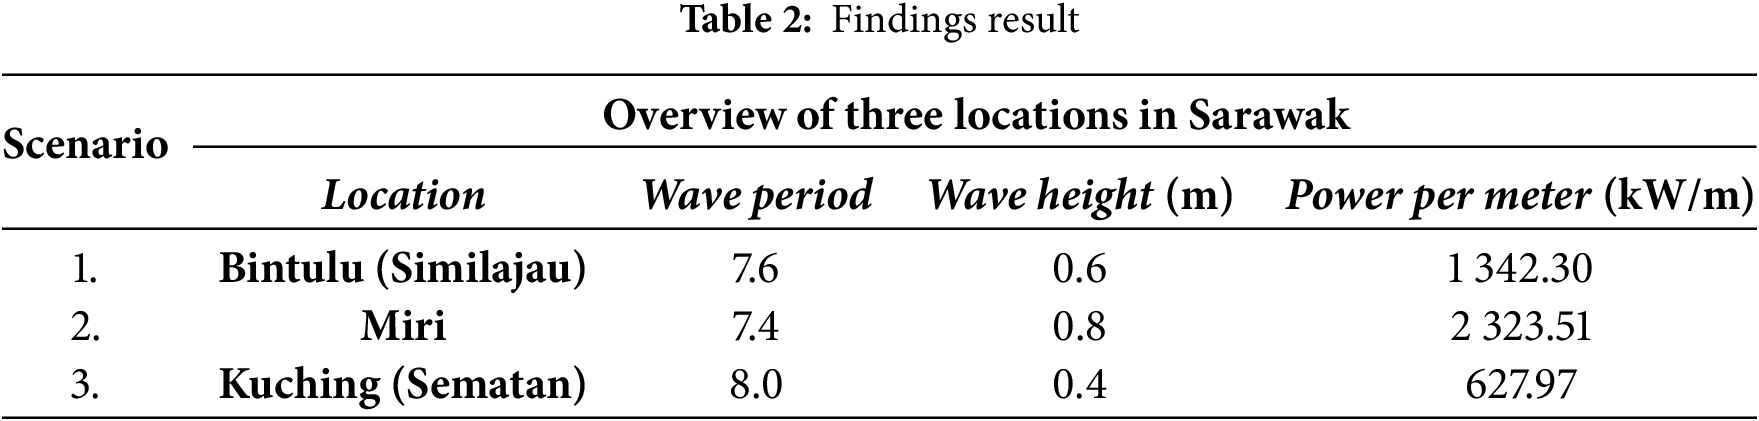
Overall discussion of the wave power, Miri is the best location in terms of raw energy potential, which makes it the most promising site for wave energy deployment, capable of supporting high-capacity systems. However, Miri’s infrastructure limitations must be considered in cost assessments. While for Bintulu offers a strong balance between output and infrastructure, suggesting strong potential for medium to large-scale installations since Bintulu benefits from existing infrastructure under the SCORE, which can reduce transmission and development costs. Sematan is suitable for small-scale or pilot wave energy projects. While the location may not yield high energy output, its proximity to shore and shallow waters makes it economically viable for demonstration or community-level applications.
Next, the distance from shore and its water depth were also important to implement a wave energy farm. The distance from shore was important to optimize the installation feasibility, cabling costs, and operational maintenance logistics. Closer installations are cheaper but yield less energy, whereas farther offshore placements offer higher yields but significantly increased costs and engineering complexity. While the water depth of each location was selected based on engineering feasibility, with deeper waters enhancing energy yield but increasing cost and complexity. It will also directly impact installation complexity, mooring costs, and structural demands. Table 3 details the distance from shore and water depth for the three locations in Sarawak.
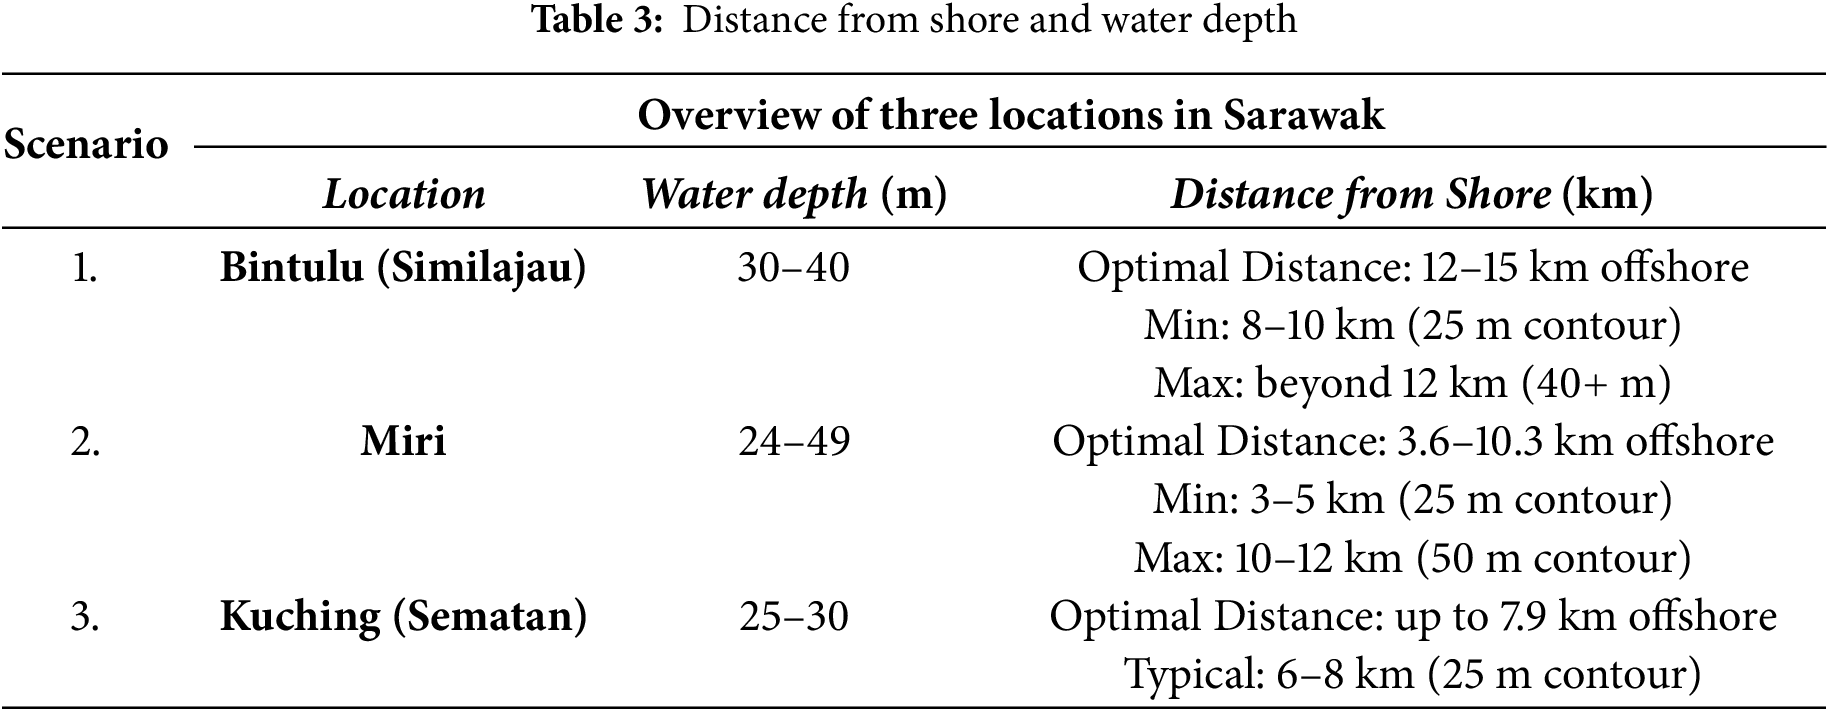
In conclusion, Miri is ideal for scalable and high-capacity projects due to its depth and distance profile. The presence of deeper waters at relatively shorter distances supports efficient energy capture while keeping cabling and mooring within feasible limits. Whereas Bintulu supports medium to large-scale deployment with strong infrastructure support. Although the deeper waters are suitable for high energy extraction, the relatively greater distance from shore implies higher costs for installation. However, Bintulu’s well-developed energy infrastructure can help offset these additional costs. Next, Sematan is best suited for low-cost, small-scale applications due to its shallow and accessible waters. The limited depth and shorter distance make it suitable for small-scale or pilot installations.
3.1.10 Multi-Objective Genetic Algorithm
Genetic Algorithm (GA) is widely recognized as one of the most effective population-based methods for addressing multi-objective optimization problems. A modified version of the single-objective GA can successfully identify a range of non-dominated solutions. Its main advantage over other methods lies in its ability to explore a diverse set of potential solutions in complex problems characterized by discontinuities, multimodal landscapes, and non-convex search spaces. The crossover mechanism plays a critical role, as it allows promising solution structures to generate new non-dominated candidates across multiple objectives. Additionally, GA’s performance in multi-objective scenarios is largely unaffected by user-defined weights, scaling, or priority settings for objectives. These features contribute to GA’s widespread adoption in solving complex optimization and multi-objective design problems.
After that, MOGA optimization will be used to find the most suitable location in Sarawak. The algorithm optimized two critical objectives simultaneously, which minimize the LCOE and reduce CO2 emissions. This work might have some limitations due to simplified assumptions, limited socio-environmental factors, and computational constraints
The Multi-Objective Genetic Algorithm (MOGA) was employed in this study to optimize the selection of suitable coastal locations for wave energy deployment in Sarawak. Unlike conventional single-objective approaches, MOGA enables the simultaneous evaluation of multiple objectives, generating a set of non-dominated solutions that represent trade-offs between competing criteria.
In this research, the algorithm optimized two critical objectives:
• Minimization of the LCOE, which accounts for CAPEX, OPEX, and energy output over the project lifetime.
• Minimization of CO2 emissions, which reflects the environmental performance of each site.
The decision variables incorporated in the optimization were the number of WEC units deployed, the capacity of each unit, and the site-specific wave resource characteristics (wave height, period, and power density, as outlined in Tables 2 and 3). Constraints included feasible installation depth (25–50 m) and practical offshore cable distance (3–15 km).
The MOGA process began with an initial population of candidate solutions randomly distributed across the three study sites (Bintulu, Miri, and Sematan). Through iterative selection, crossover, and mutation, the algorithm progressively evolved solutions toward the Pareto-optimal front. The resulting Pareto front provides a visual representation of the trade-offs between LCOE, CO2 emissions, and annual energy output. Convergence and diversity of solutions were validated using the average spread metric, which confirmed that optimization achieved stable and well-distributed solutions.
This approach ensures that location selection is not based on a single criterion but reflects a balanced compromise between techno-economic feasibility and environmental sustainability. The optimization results, discussed in Section 4, show that Bintulu consistently occupies the densest region of the Pareto front, confirming its suitability as the most viable site for wave energy deployment in Sarawak.
By going through SDG 9, the proposed methodology includes a full cost breakdown and infrastructure design for WEC systems, incorporating advanced technologies such as LPMG and inverter–rectifier systems. This innovative approach promotes sustainable infrastructure planning and technological advancement in the marine renewable sector.
3.2 Technological and Economical Analysis
3.2.1 Estimated Capital Cost of 5 MW Installation
Table 4 presents the total estimated capital cost in Malaysian Ringgit (MYR) for installing 5 MW of wave energy capacity using two technologies, which were OWC and Point Absorber. The locations assessed are Bintulu, Miri, and Sematan, which differ in terms of wave energy potential, proximity to infrastructure, and environmental conditions, and are tabulated in Table 4.
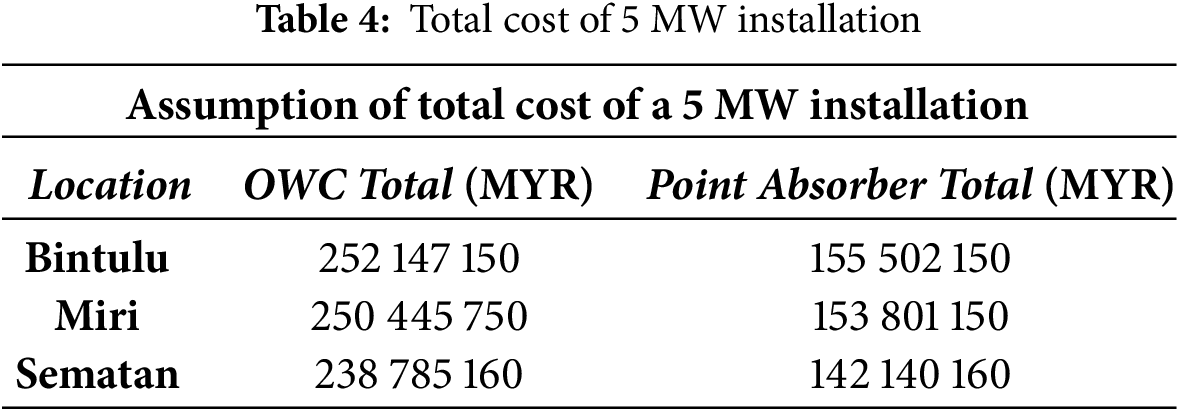
For each location, the Point Absorber configuration consistently demonstrates a lower capital cost when compared to OWC. In Bintulu, the Point Absorber installation costs MYR 155.5 million, approximately 38.3% cheaper than the OWC installation at MYR 252.1 million. While in Miri, the difference is similarly significant, with Point Absorber costing MYR 153.8 million, vs. MYR 250.4 million for OWCs. The lowest overall installation cost is found in Sematan, which uses Point Absorbers costing around MYR 142.1 million, while the highest is in Bintulu with OWC systems. These results suggested that Point Absorbers are more economically efficient WEC, regardless of site-specific conditions. The average cost saving across the three locations is approximately MYR 96.6 million per 5 MW installation.
The higher cost of OWC systems can be attributed to structural complexity, which OWCs often use shore-based or nearshore concrete chambers and turbines construction, which will increase the civil engineering and construction costs. Fixed deployment limitations for OWCs are typically installed near the shoreline, limiting site flexibility, which directly increases the land use and permitting challenges. Other than that, installation and BoP costs for OWCs will be needed for custom foundations, air turbines, and protective structures increase the installation duration and cost. OWC turbines of mechanical PTO components are sensitive to marine fouling, corrosion, and pressure variability, often necessitating more sophisticated and costly components.
In contrast, Point Absorbers have a modular and scalable design, which makes them easier to transport, deploy, and maintain. It has a simplified installation, with buoy-based designs requiring minimal seabed anchoring and no onshore infrastructure. Furthermore, Point Absorbers have the flexibility in deployment location, allowing optimal placement in deeper, more energetic waters. The design of the lower structure of the Point Absorber gives a mechanical complexity that can be translated into lower material, fabrication, and logistics costs.
For industrial zones like Bintulu and Miri, where grid infrastructure and logistics are more strategic, the installation of Point Absorbers presents a cost-effective path to large-scale deployment. For rural or pilot-scale applications in areas such as Sematan, the cost advantage of Point Absorbers may prove decisive given limited infrastructure and lower energy demand. Given these considerations, the economic analysis of Point Absorbers is economically viable in all three locations, supporting their selection as the preferred WEC type for future developments in Sarawak.
3.2.2 CAPEX of Wave Energy Breakdown
Fig. 2 illustrates the capital cost breakdown for a wave energy project in Sarawak, emphasizing the distribution of key expenditure components involved in system deployment. The WEC system dominates the capital investment at 40%, reflecting the high cost of core generation technology, including the device structure, power take-off components, and onboard systems.
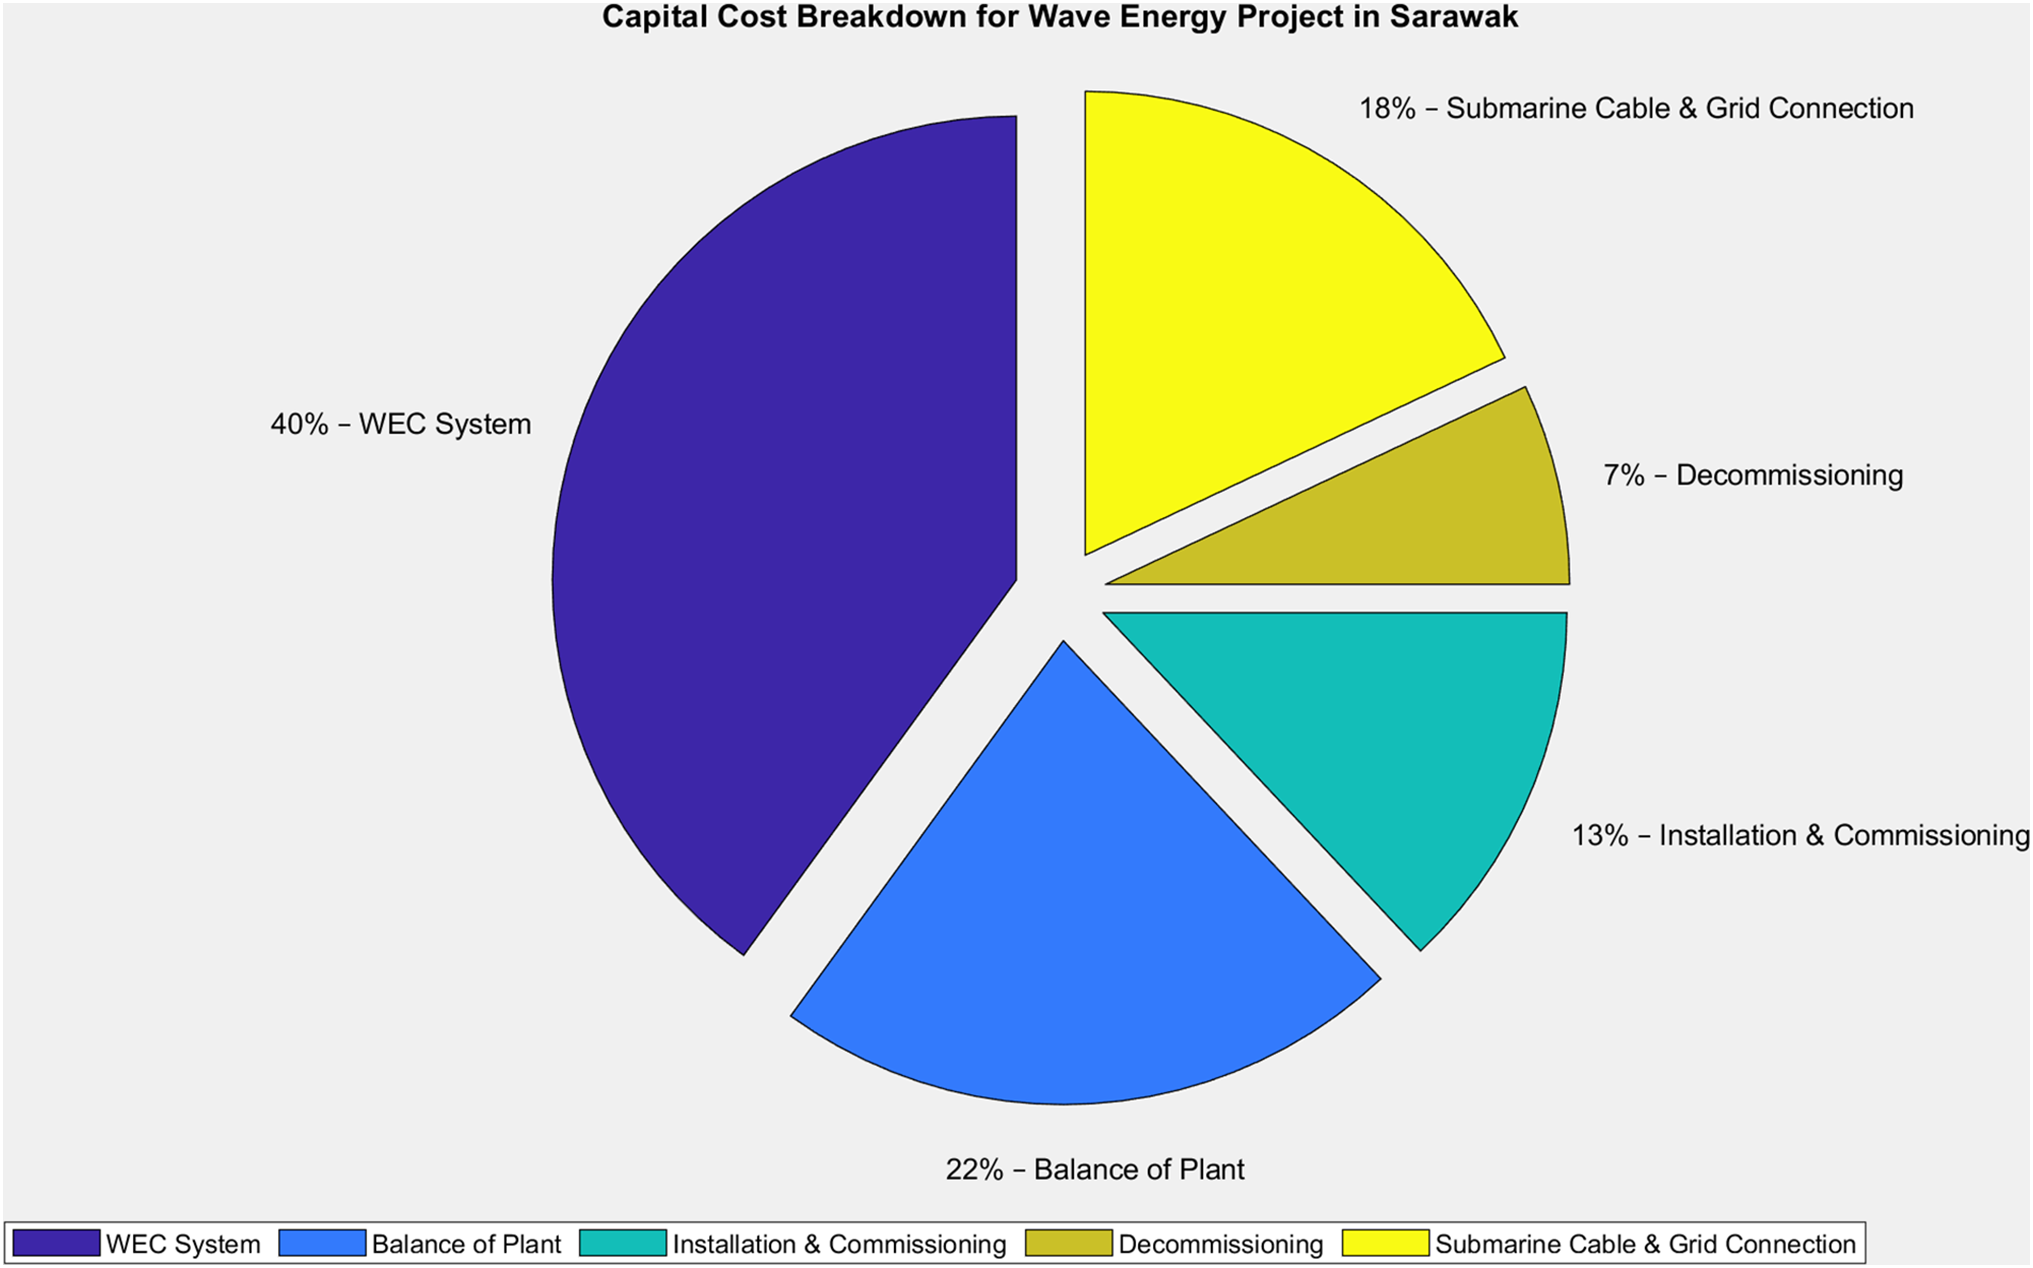
Figure 2: Capital cost breakdown of wave energy installation in Sarawak
The Balance of Plant (BoP), which includes supporting infrastructure like mooring systems and onshore facilities, accounts for 22%, marking it as the second most significant cost element. While for submarine cable and grid connection follows closely at 18%, highlighting the financial impact of offshore distance and electrical interconnection.
The Installation and Commissioning, encompassing vessel mobilization, labour, and testing, contributes 13% to the total cost. Lastly, decommissioning is essential for lifecycle planning and environmental compliance, which comprises 7% for ensuring provisions of safe removal and disposal at project end-of-life.
However, the LCOE calculations in this study were based primarily on assumed CAPEX and did not explicitly account for separate cost components such as installation and commissioning, decommissioning, mooring and foundation, BoP, O&M, and project management. These cost elements were not modelled individually due to data availability constraints and were represented through assumptions derived from the latest techno-economic literature and it may under- or overestimate total life cycle costs.
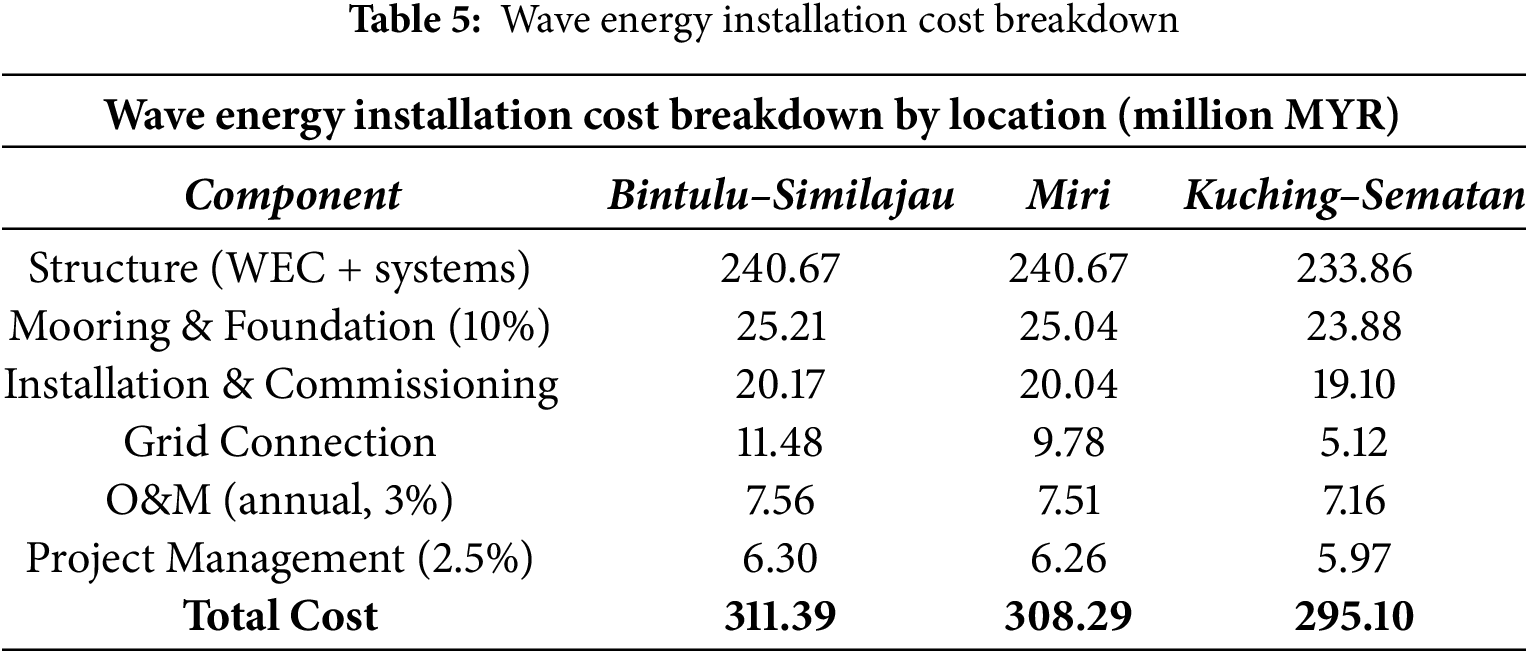
Fig. 3 provides a detailed breakdown of wave energy installation costs at three locations in Sarawak.
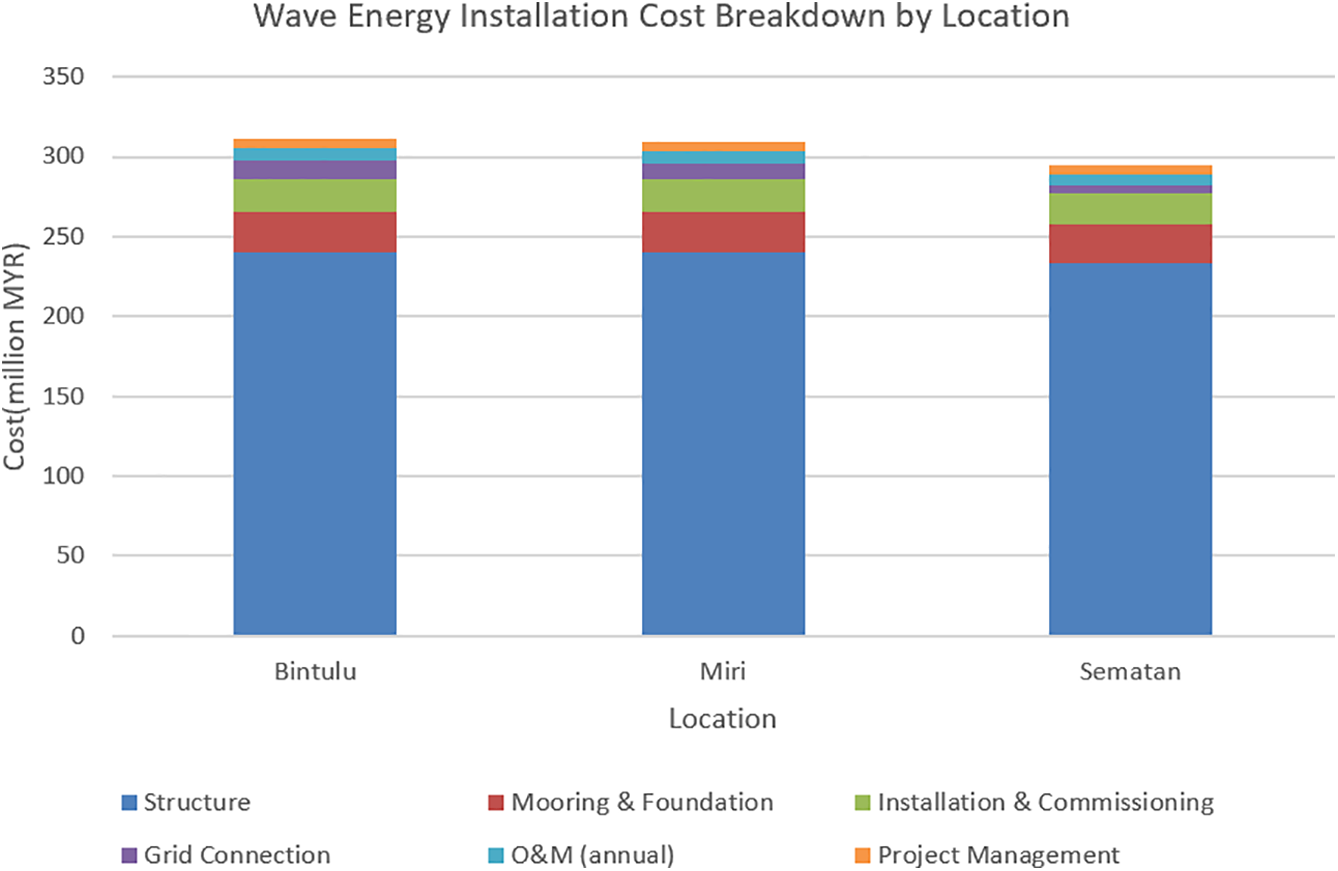
Figure 3: Wave energy installation cost breakdown
In Table 5, despite Sematan showing the lowest total installation cost of RM 295.10 million, its energy yield of 1.87 GWh per year is insufficient to support economic viability. While Miri has a comparable CAPEX to Bintulu which amounts to RM 308.29 million, it generates only 4.09 GWh/year. Hence, even though Bintulu has the highest CAPEX of RM 311.39 million, it delivers the best energy output around 6.91 GWh/year, leading to the lowest LCOE and making it the most feasible candidate for wave energy implementation.
The application of MOGA produced a three-dimensional Pareto front, which is shown in Fig. 4, illustrating the trade-offs among LCOE, CO2 emissions, and annual energy output across the three candidate sites. Each point on the surface represents a non-dominated solution, providing a spectrum of optimal choices rather than a single result. The convergence and average spread trends shown in Fig. 4 confirm that the algorithm successfully reached stable and well-distributed solutions, ensuring both reliability and diversity in the optimization process.
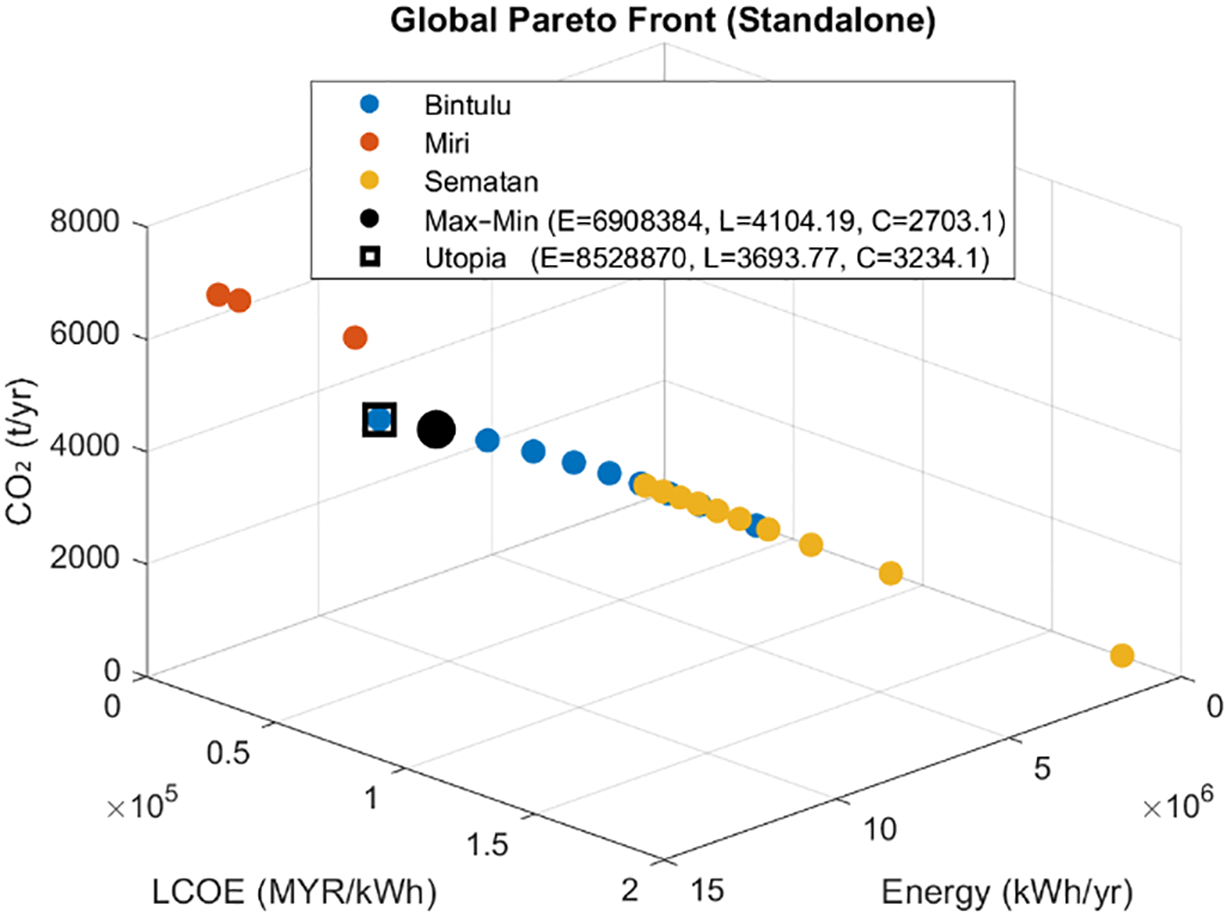
Figure 4: MOGA optimization of 3 different locations
From the Pareto front, Bintulu forms a dense cluster of solutions located in the region of lowest LCOE and moderate CO2 emissions, while still maintaining high energy output. This indicates that Bintulu offers the best compromise among the competing objectives. Miri, while yielding higher energy output due to favorable wave conditions, is associated with higher costs and emissions. Sematan, in contrast, occupies the least favorable region of the Pareto surface with high costs and low energy yield, making it the least suitable option.
A blue dot above indicates that Bintulu consistently forms a dense and well-balanced region on the Pareto front, exhibits high energy yield, moderate CO2 emissions, and the lowest LCOE among all three locations. The black circular marker represents the Chebyshev Max–Min solution, which indicates the best overall candidates, and it is clearly located within the Bintulu cluster. This showed that Bintulu provides the most optimal balance among the others.
While Miri, which is in the orange dot, displays points that generally offer high energy outputs due to its superior wave power characteristics, like a higher wave height of 0.8 m and a higher power density of 2323.51 kW/m, but these are associated with higher CO2 emissions and LCOE compared to Bintulu. Although Miri is technically viable, its constraint is the limited availability of direct grid infrastructure, which increases deployment and connection costs.
Based on Sematan, which is in yellow, was clustered toward the lower-energy, higher-cost corner of the Pareto surface, reflecting its low wave height, which is around 0.4 m and has a limited energy output. Despite having the lowest CO2 emissions, Sematan produces very high LCOE and low energy productivity, rendering it the least suitable location for full-scale implementation.
Overall, Bintulu is selected as the most feasible location not merely due to its wave characteristics, but also because of strategic advantages such as existing energy infrastructure under the SCORE with offshore depth around 30–40 m, and optimal cable distances with 12–15 km. These factors significantly reduce infrastructure and grid connection costs, thereby lowering the overall LCOE. The MOGA optimization thus confirms that Bintulu strikes the best candidates for the implementation of a wave energy farm between technical performance, economic feasibility, and environmental impact, making it the best site for wave energy development in Sarawak.
The convergence and average spread trend for MOGA is portrayed in Fig. 5. In addition to the Pareto front, the performance of the optimization was evaluated using the average spread metric. This metric quantifies the distribution and diversity of solutions along the Pareto front. A smaller spread indicates that the algorithm has achieved stable convergence, while a larger spread reflects greater variation among solutions.
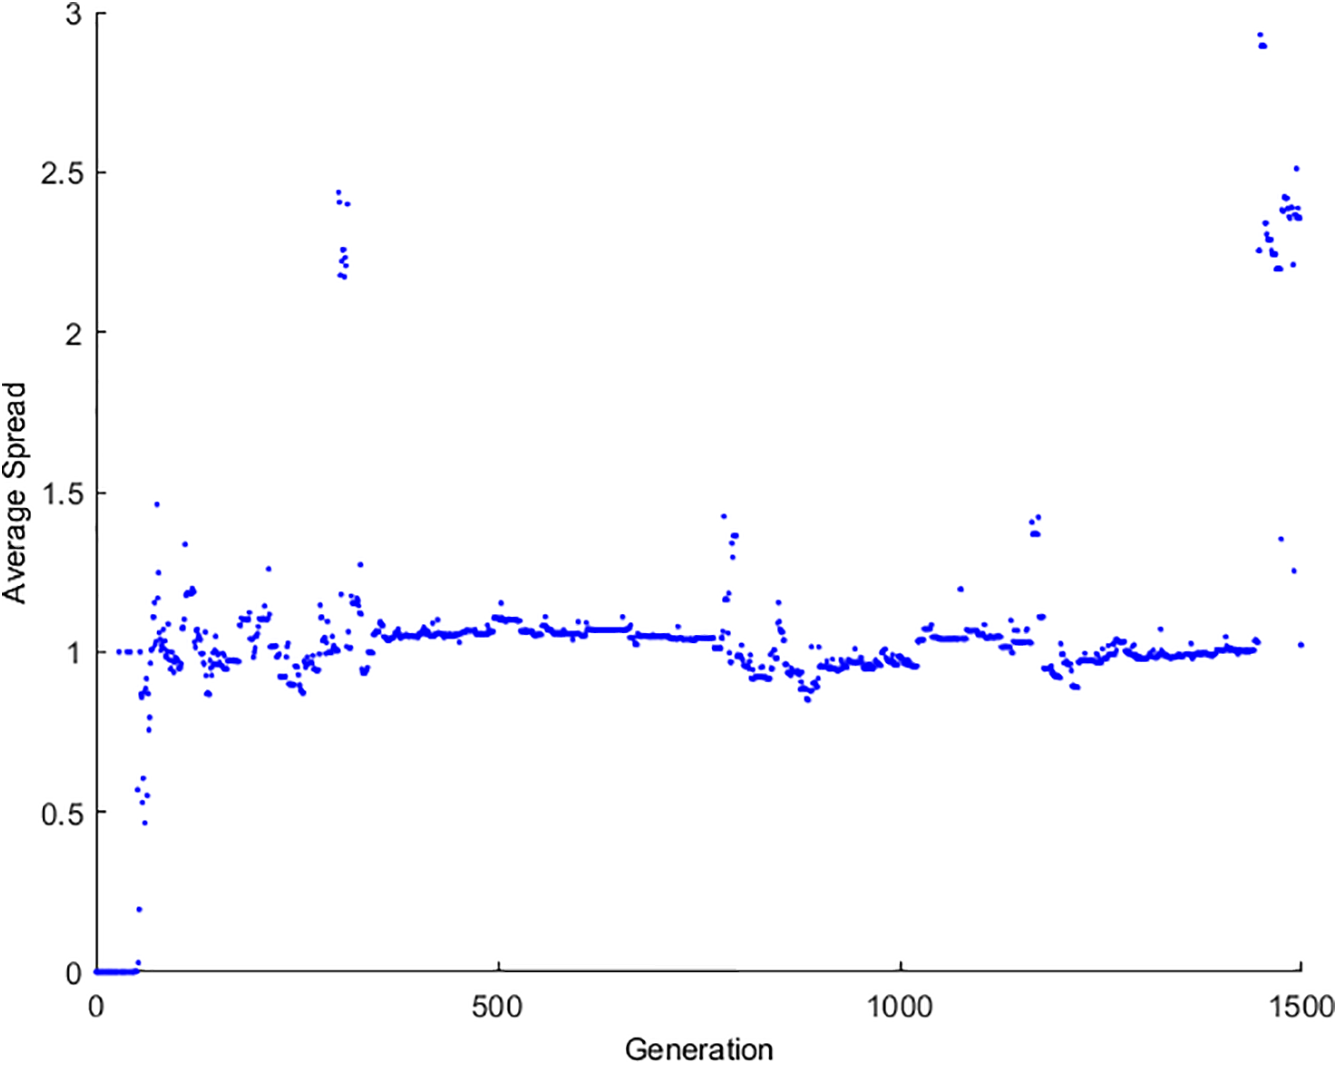
Figure 5: Average spread of MOGA
In this study, the average spread values gradually decreased with successive generations, confirming that the MOGA successfully converged toward a stable set of Pareto-optimal solutions. At the same time, the spread remained sufficiently wide to capture diverse trade-offs between LCOE, CO2 emissions, and energy output. This ensures that the optimization results are not only convergent but also representative of different feasible scenarios, allowing decision-makers to balance cost, environmental performance, and energy yield when selecting the most suitable site.
Findings Result
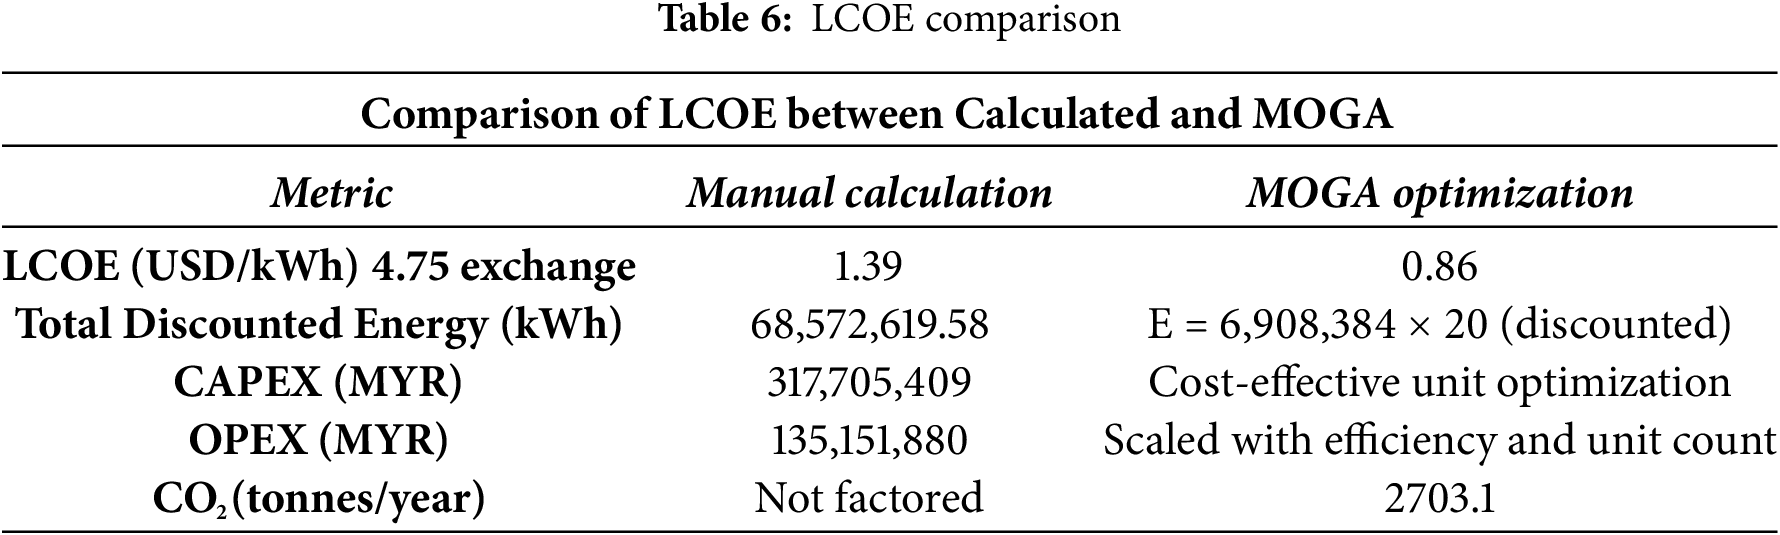
The findings from both the MOGA optimization and the manually calculated LCOE were compared to the techno-economic feasibility of deploying wave energy in Sarawak. Among the three assessed locations, which were Bintulu (Similajau), Miri, and Kuching (Sematan), Bintulu emerged as the most optimal site based on its balance of energy output, LCOE, and CO2 emissions. This preference is driven by several strategic advantages, including existing energy infrastructure, a rural area which is under SCORE with an offshore depth of around 30–40 m, and optimal cable distances ranging from 12–15 km, which will directly reduce the overall cost of deployment. By using the provided assumptions, CAPEX, OPEX, discount rate of 8%, and 20-year project life, the manual LCOE calculated for Bintulu is MYR 6.60 per kWh, or USD 1.39 per kWh using an exchange rate of 4.75. In contrast, the MOGA optimization result for Bintulu indicates a significantly lower LCOE of MYR 4104.19 per MWh, which translates to MYR 4.10 per kWh, or approximately USD 0.86 per kWh. This difference in LCOE values, which was 1.39 USD calculated while MOGA produced LCOE in 0.86 USD, showed a discrepancy in the assumption of the manual calculation. Specifically, the manual model applies a flat 3% OPEX rate and constant annual output, whereas the MOGA integrates dynamic cost scaling, wave resource variability, and optimized unit configurations per location. Additionally, the MOGA includes CO2 emissions and site-specific constraints, making it more reflective of wave energy implementation in Sarawak.
From Table 6, the 0.53 USD/kWh differences from the manual approach are due to applying fixed costs and generalized energy assumptions, whereas MOGA dynamically adapts deployment based on units, costs, and wave profile to optimize both output and expenditures. Even though the manually calculated LCOE provides a useful baseline, the MOGA-optimized result better captures the real deployment scenario and proves Bintulu to be the most viable location for wave energy implementation in Sarawak. The lower LCOE in MOGA is supported by infrastructure synergy and cost-efficient unit configuration. The findings reinforce the importance of integrated modeling for accurate investment planning and sustainable marine energy deployment.
In terms of environmental benefits, Table 7 shows that Bintulu achieves an annual CO2 emission of 2703.1 tonnes, which is ~57% lower than equivalent coal-based energy production. It avoids over half the emissions compared to coal generation for the same output, reinforcing environmental sustainability. This significant emission reduction strengthens its alignment with SDG 13: Climate Action and reinforces the value of wave energy in Malaysia’s decarbonization strategy. While Sematan has the lowest emissions overall (827.9 t/yr), its low power output diminishes its impact per tonne of CO2 avoided.
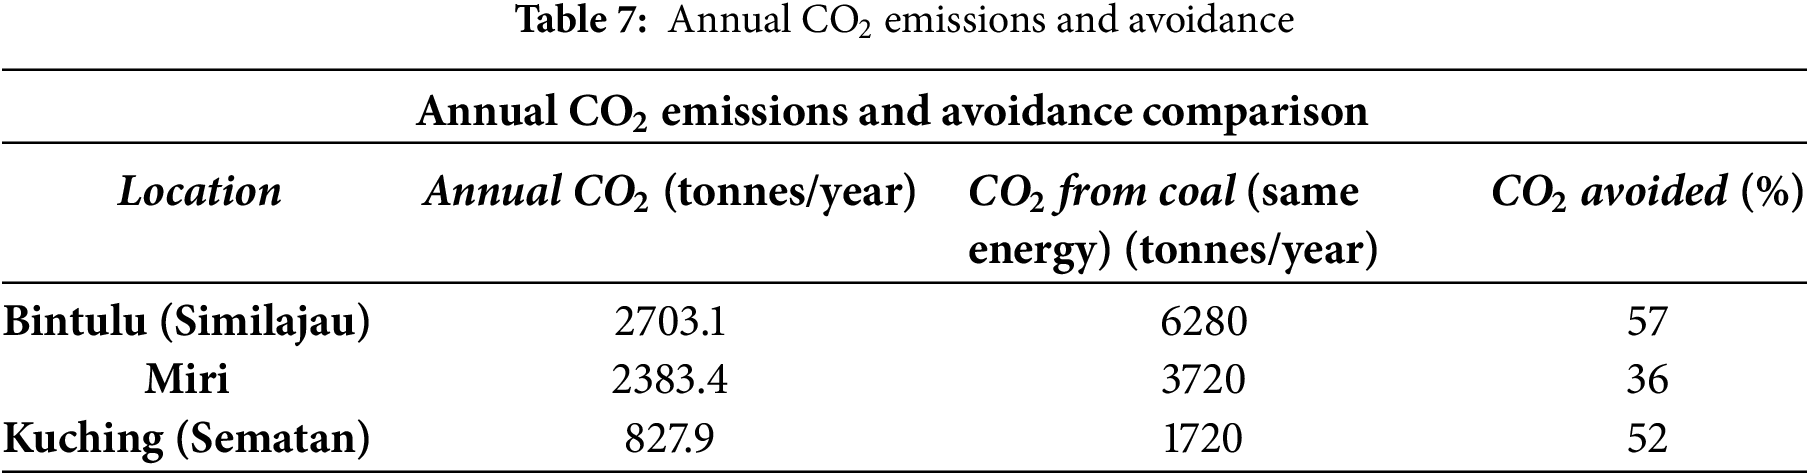
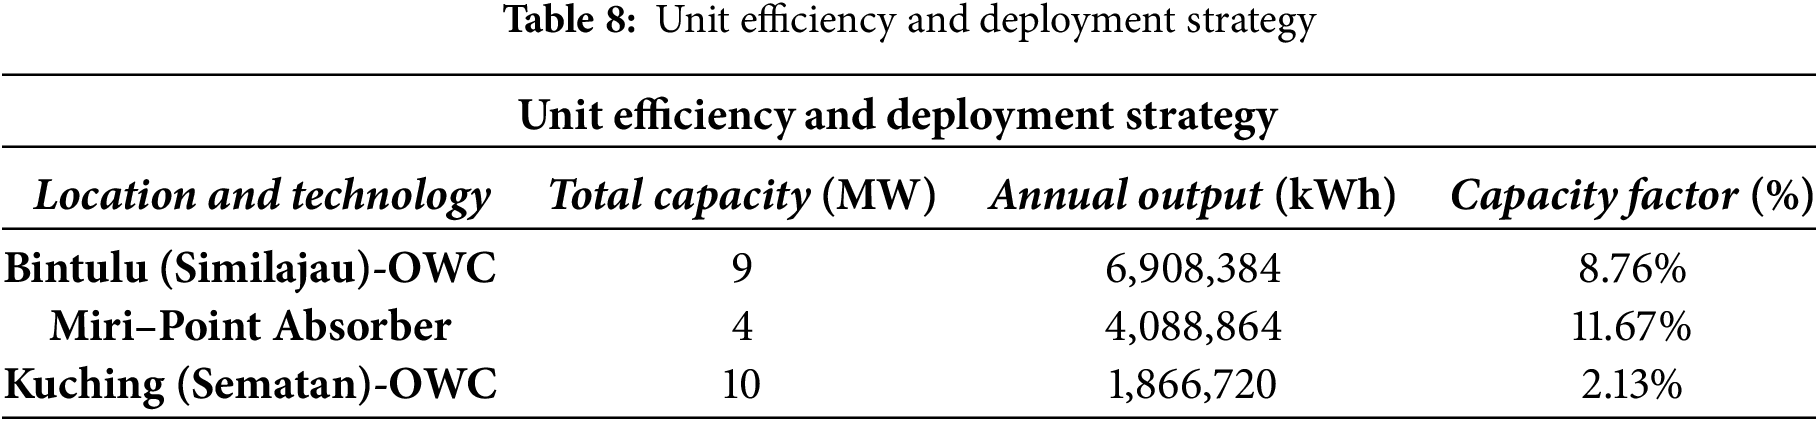
Table 8 reveals the technical performance and operational efficiency of each location. While Miri demonstrates the highest capacity factor around 11.67%, it has a smaller total annual energy yield amounted 4.09 million kWh/year due to a lower number of units deployed, which were 4 units. In contrast, Bintulu achieves the highest annual energy output at 6.91 million kWh/year with 9 units, resulting in a balanced compromise between efficiency and scalability. While Sematan, despite deploying the most units, which is 10 units, only reaches a capacity factor of 2.13%, making it the least productive option.
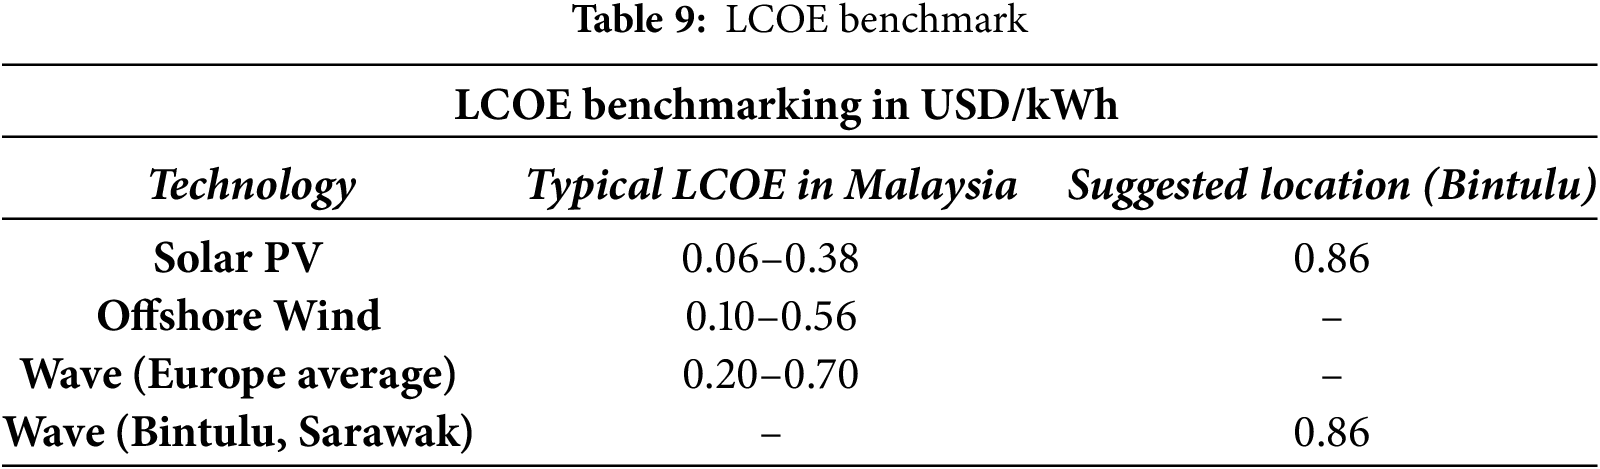
Lastly, Table 9 shows a LCOE benchmarking places the LCOE of Bintulu’s wave energy system at USD 0.86/kWh, which is higher than other renewable options like solar PV (USD 0.06/kWh to USD 0.38/kWh) or offshore wind (USD 0.10/kWh to USD 0.56/kWh) [8]. However, wave energy offers higher reliability and energy density in marine regions, making it an ideal renewable energy source. The LCOE for Bintulu is still within the plausible range for early-stage wave projects and can be improved through future scale economies, government incentives, and local manufacturing.
This study evaluated the techno-economic feasibility of wave energy deployment across three coastal locations in Sarawak, applying a MOGA to optimize trade-offs between energy output, LCOE, and CO2 emissions. The findings highlight Bintulu as the most viable deployment site, achieving the best overall balance with an annual energy output of 6.91 GWh, a minimized LCOE of MYR 4.10/kWh (USD 0.86/kWh), and moderate emissions of 2703.1 tCO2/year. By presenting a practical pathway for integrating marine renewable energy in East Malaysia, this research contributes to both decarbonization and sustainable coastal development. Nonetheless, the study is subject to several limitations. The MOGA framework assumes static wave conditions and economic parameters, without incorporating seasonal variability or long-term performance degradation of technology. Furthermore, environmental and social considerations such as biodiversity sensitivity, maritime navigation conflicts, and public acceptance were not explicitly modelled. The LCOE results are based on generalized cost assumptions and may differ depending on site-specific procurement, logistics, and labor conditions.
Acknowledgement: The authors would like to express her heartfelt gratitude to Swinburne University of Technology Sarawak Campus and Birmingham City University for unwavering encouragement, and endless support throughout this research. The supervisory team expertise and dedication have been instrumental in the successful completion of this study.
Funding Statement: This work was supported by Swinburne University of Technology Sarawak Campus and Birmingham City University. The funders had no role in the study design, data collection, analysis, or decision to publish.
Author Contributions: Dexiecia Anak Francis: Conceptualization, methodology, writing—original draft, data curation, formal analysis, visualization, investigation, writing—editing & review. Jalal Tavalaei: Review, supervision, editing. Hadi Nabipour Afrouzi: Review, supervision, project administration. All authors reviewed the results and approved the final version of the manuscript.
Availability of Data and Materials: The authors confirm that the data used in this study is available on request.
Ethics Approval: Not applicable.
Conflicts of Interest: The authors declare no conflicts of interest to report regarding the present study.
References
1. Shao Z, Gao H, Liang B, Lee D. Potential, trend and economic assessments of global wave power. Renew Energy. 2022;195(5):1087–102. doi:10.1016/j.renene.2022.06.100. [Google Scholar] [CrossRef]
2. Kai LY, Sarip S, Kaidi HM, Ardila-Rey JA, Samsuddin NM, Muhtazaruddin MN, et al. Current status and possible future applications of marine current energy devices in Malaysia: a review. IEEE Access. 2021;9:86869–88. doi:10.1109/access.2021.3088761. [Google Scholar] [CrossRef]
3. Robertson B. Wave energy: resources and technologies. In: Comprehensive renewable energy. Amsterdam, The Netherlands: Elsevier; 2022. p. 10–24. doi:10.1016/b978-0-12-819727-1.00087-x. [Google Scholar] [CrossRef]
4. Li H, Sun X, Zhou H. Wave energy: history, implementations, environmental impacts, and economics. In: 2nd International Conference on Materials Chemistry and Environmental Engineering (CONF-MCEE 2022); 2022 May 19–25; Online; 2022. 21 p. doi:10.1117/12.2646119. [Google Scholar] [CrossRef]
5. Aderinto T, Li H. Ocean wave energy converters: status and challenges. Energies. 2018;11(5):1250. doi:10.3390/en11051250. [Google Scholar] [CrossRef]
6. Ocean Energy Europe. Ocean Energy: Stats and Trends 2023. Brussels, Belgium: Ocean Energy Europe; 2024. [Google Scholar]
7. Afrouzi HN. Design and techno-economic analysis of a hydrogen-based micro hydro-solar hybrid energy system for sustainable energy access: a case study in Sri aman. Sarawak Int J Electr Electron Eng Telecommun. 2024;13(1):33–44. doi:10.18178/ijeetc.13.1.33-44. [Google Scholar] [CrossRef]
8. Rusu E, Onea F. A review of the technologies for wave energy extraction. Clean Energy. 2018;2(1):10–9. doi:10.1093/ce/zky003. [Google Scholar] [CrossRef]
9. Guo B, Ringwood JV. A review of wave energy technology from a research and commercial perspective. IET Renew Power Gener. 2021;15(14):3065–90. doi:10.1049/rpg2.12302. [Google Scholar] [CrossRef]
10. Rahman A, Farrok O, Islam MR, Xu W. Recent progress in electrical generators for oceanic wave energy conversion. IEEE Access. 2020;8:138595–615. doi:10.1109/access.2020.3012662. [Google Scholar] [CrossRef]
11. Ahamed R, McKee K, Howard I. A review of the linear generator type of wave energy converters’ power take-off systems. Sustainability. 2022;14(16):9936. doi:10.3390/su14169936. [Google Scholar] [CrossRef]
12. Shadmani A, Nikoo MR, Gandomi AH. Adaptive systematic optimization of a multi-axis ocean wave energy converter. Renew Sustain Energy Rev. 2024;189:113920. doi:10.1016/j.rser.2023.113920. [Google Scholar] [CrossRef]
13. Carapellese F, De Clerck V, Sirigu SA, Giorgi G, Bonfanti M, Faedo N, et al. Multi-objective optimization of an inertial wave energy converter for multi-directional wave scatter. Machines. 2024;12(10):736. doi:10.3390/machines12100736. [Google Scholar] [CrossRef]
14. Gaspar JF, Pinheiro RF, Mendes MJGC, Kamarlouei M, Guedes Soares C. Review on hardware-in-the-loop simulation of wave energy converters and power take-offs. Renew Sustain Energy Rev. 2024;191:114144. doi:10.1016/j.rser.2023.114144. [Google Scholar] [CrossRef]
15. Li D, Patton R. Model predictive energy-maximising tracking control for a wavestar-prototype wave energy converter. J Mar Sci Eng. 2023;11(7):1289. doi:10.3390/jmse11071289. [Google Scholar] [CrossRef]
16. Têtu A, Fernandez Chozas J. A proposed guidance for the economic assessment of wave energy converters at early development stages. Energies. 2021;14(15):4699. doi:10.3390/en14154699. [Google Scholar] [CrossRef]
17. Guidi G, Fosso OB. Investment cost of HVAC cable reactive power compensation off-shore. In: 2012 IEEE International Energy Conference and Exhibition (ENERGYCON); 2012 Sep 9–12; Florence, Italy; 2012. p. 299–304. doi:10.1109/EnergyCon.2012.6347771. [Google Scholar] [CrossRef]
18. Giglio E, Petracca E, Paduano B, Moscoloni C, Giorgi G, Sirigu SA. Estimating the cost of wave energy converters at an early design stage: a bottom-up approach. Sustainability. 2023;15(8):6756. doi:10.3390/su15086756. [Google Scholar] [CrossRef]
Cite This Article
 Copyright © 2026 The Author(s). Published by Tech Science Press.
This work is licensed under a Creative Commons Attribution 4.0 International License , which permits unrestricted use, distribution, and reproduction in any medium, provided the original work is properly cited.
 Downloads
 Citation Tools