
 Submit a Paper
 Propose a Special lssue
 Open Access
ARTICLE

An Electricity-Carbon Synergy-Driven Optimization Method for Low-Carbon Operation of Multi-Energy Parks
1 State Grid Tianjin Economic Research Institute, Tianjin, 300171, China
2 State Key Laboratory of Smart Power Distribution Equipment and System, Tianjin University, Tianjin, 300072, China
* Corresponding Author: Hao Yu. Email:
Energy Engineering 2026, 123(2), 2 https://doi.org/10.32604/ee.2025.070715
Received 22 July 2025; Accepted 17 September 2025; Issue published 27 January 2026
 View Full Text
 Download PDF
Abstract
In the pursuit of carbon peaking and neutrality goals, multi-energy parks, as major energy consumers and carbon emitters, urgently require low-carbon operational strategies. This paper proposes an electricity-carbon synergy-driven optimization method for the low-carbon operation of multi-energy parks. The method integrates multi-energy complementary scheduling with a tiered carbon trading mechanism to balance operational security, economic efficiency, and environmental objectives. A mixed-integer linear programming model is developed to characterize the coupling relationships and dynamic behaviors of key equipment, including photovoltaic systems, ground-source heat pumps, thermal storage electric boilers, combined heat and power units, and electrical energy storage systems. Furthermore, a tiered carbon trading model is established that incorporates carbon quota allocation and tiered carbon pricing to internalize carbon costs and discourage high-emission practices. Multi-scenario comparative analyses demonstrate that the electricity-carbon synergy scenario achieves a 42.64% reduction in carbon emissions compared to economy-oriented operation, while limiting the increase in operational costs to 20.85%. The carbon-prioritized scenario further reduces emissions by 9.7%, underscoring the inhibitory effect of the tiered carbon pricing mechanism on high-carbon activities. Sensitivity analyses confirm the model’s robustness against fluctuations in energy load, uncertainty in renewable generation, and variations in carbon price. This optimization method provides theoretical support for multi-energy coordinated scheduling and carbon responsibility allocation in industrial parks, offering valuable insights for promoting green transformation initiatives.Keywords
In recent years, global industrialization acceleration has intensified challenges posed by rising carbon emissions. According to the Global Carbon Budget 2024, global carbon dioxide (CO2) emissions in 2024 were approximately 41.6 billion tons, with fossil fuel CO2 emissions accounting for about 37.4 billion tons. Without large-scale energy system decarbonization, global temperatures are projected to continue rising over the next two decades. China accounts for approximately one-third of global emissions [1], facing significant decarbonization challenges. As key energy consumption and production sites, multi-energy parks are critical to national decarbonization goals, consuming 69% of China’s energy and generate 78% of its carbon emissions. Despite rapid growth in renewable energy capacity, fossil fuels still dominate park operations due to integration barriers [2]. Renewable intermittency and high integration costs cause persistently high curtailment rates, sustaining fossil fuel dependence. Consequently, a key technical challenge is utilizing park features—integrated “generation-grid-storage-load” systems [3], multi-energy complementarity, and coordinated supply-demand—to enhance reliability, reduce emissions, and increase renewable penetration.
Electricity-carbon synergy integrates carbon emission constraints into multi-energy park scheduling frameworks, shifting traditional security-economic paradigms to models where minimizing operational carbon footprint becomes a core objective. The synergy utilizes the characteristics of multi-energy coordination and source-grid-storage-load synergy in parks during operation to enhance system flexibility, improve renewable energy consumption and reduce emissions. Therefore, electricity-carbon synergy poses a critical research challenge for park operation optimization. It requires scheduling algorithms to manage multi-energy conversions under complex equipment constraints while internalizing carbon costs via tiered pricing mechanisms.
Park operation optimization leverages multi-energy coordination and source-grid-storage-load synergy for enhanced energy utilization rate. Reference [4] demonstrated demand response’s carbon reduction capability and the impact of PV penetration; Reference [5] developed a Stackelberg game-based optimization method for energy storage power stations and the integrated energy multi-microgrid alliance, which enhanced energy consumption rates and reduced energy costs; Reference [6] established a spatiotemporally flexible demand response architecture; Reference [7] confirmed cost reductions through electric-heating-cooling load coupling; Reference [8] develops a many-objective optimization model utilizing electric vehicles as distributed storage to improve grid peak shaving and battery economy; Reference [9] optimized district heating across multiple market timescales. While these studies address specific aspects of scheduling, coupling, and markets, a critical gap remains: current approaches lack a unified method that simultaneously integrates refined modeling of equipment dynamics with the internalization of tiered carbon pricing costs into operational decisions.
Electricity-carbon synergy research encompasses carbon accounting, carbon trading, and low-carbon technologies. In carbon accounting, Reference [10] quantified emission factors using lifecycle assessment to build an energy category database. Reference [11] refined methods to track carbon flows for shared PV and storage systems. Reference [12] developed a three-layer market structure based on carbon accounting for optimized energy management. For carbon trading. Reference [13] discussed the potential relationship between coupling capability of various heterogeneous energy sources and carbon emissions on the basis of constructing a tiered carbon trading reward and punishment model. Reference [14] focused on coupling electricity-carbon-green certificate markets and assessing market effects. Low-carbon technology advances include Reference [15], which coupled CCS with P2G to transform carbon costs into profits; Reference [16] demonstrated hydrogen refinement and blending with natural gas reduces emissions via scheduling models; Reference [17] established a multi-timescale model proving diversified hydrogen utilization outperforms P2G in cutting emissions.
Existing research primarily focuses on advancing carbon accounting methods, market coupling mechanisms, and exploring specific low-carbon technologies to enhance the energy efficiency of parks. However, these efforts overlook refined modeling of multi-energy equipment dynamics during scheduling and the internalization of tiered carbon pricing impacts in operational decisions. Consequently, an integrated optimization method embedding detailed equipment constraints and dynamically internalizing carbon costs is urgently needed. This approach provides theoretical and practical foundations for multi-energy parks to balance security, economic viability, and low-carbon objectives.
To bridge these gaps, this paper proposes an electricity-carbon synergy-driven optimization method for low-carbon operation in multi-energy parks. The approach integrates a mixed-integer programming model describing equipment dynamics with a tiered carbon trading mechanism for carbon costs internalization. Multi-scenario analysis is employed to quantitatively validate the method’s effectiveness. The method achieves a reduction in carbon emissions while limiting operational cost increases, empirically demonstrating the suppressive effect of tiered carbon pricing on high-emission activities. The main contributions of this paper are summarized as follows:
(1) An operation model for multi-energy parks was developed using a mixed-integer programming framework that integrates photovoltaic (PV) systems, ground-source heat pumps (GSHP), thermal storage electric boilers (TSEB), combined heat and power (CHP) units, and electrical energy storage (EES) devices. The operation model accurately characterizes multi-energy conversion relationships and dynamic equipment constraints, thereby establishing a foundation for optimizing scheduling decisions in complex energy systems.
(2) A tiered carbon trading model was designed based on the “energy type-carbon intensity-quota allocation” principle, incorporating mechanisms for carbon quota allocation and tiered carbon pricing. This model internalizes carbon emission costs into operational decisions and imposes economic penalties on high-emission activities, enhancing carbon responsibility and promoting low-carbon operation in multi-energy parks.
(3) The effectiveness of the proposed electricity-carbon synergy is demonstrated by multi-scenario comparative analysis. By implementing tiered carbon pricing mechanisms, a 42.64% reduction in emissions is achieved compared to economy-oriented operation models, demonstrating carbon abatement potential.
This paper centers on optimizing low-carbon operation strategies for parks. The paper is structured into five sections: Section 1 reviews the research background, and clarifies the objectives and significance of this study. Section 2 models the park’s energy supply equipment, providing the foundation for the optimization model. Section 3 constructs the low-carbon operation optimization model for park. Section 4 validates the model’s effectiveness through case studies and sensitivity analysis. Section 5 summarizes the research findings.
2 Modeling of Park Energy Supply Equipment
Building on the research background and current status of electricity-carbon synergy and park operation optimization presented previously, the core objective of this paper is the electricity-carbon synergy-driven optimization method for multi-energy parks. This section analyzes operating modes of park equipment and energy flow characteristics.
2.1 Overview of Park Operation
This paper constructs a framework for a typical park operation model as shown in Fig. 1. Its operational logic can be described in four parts:
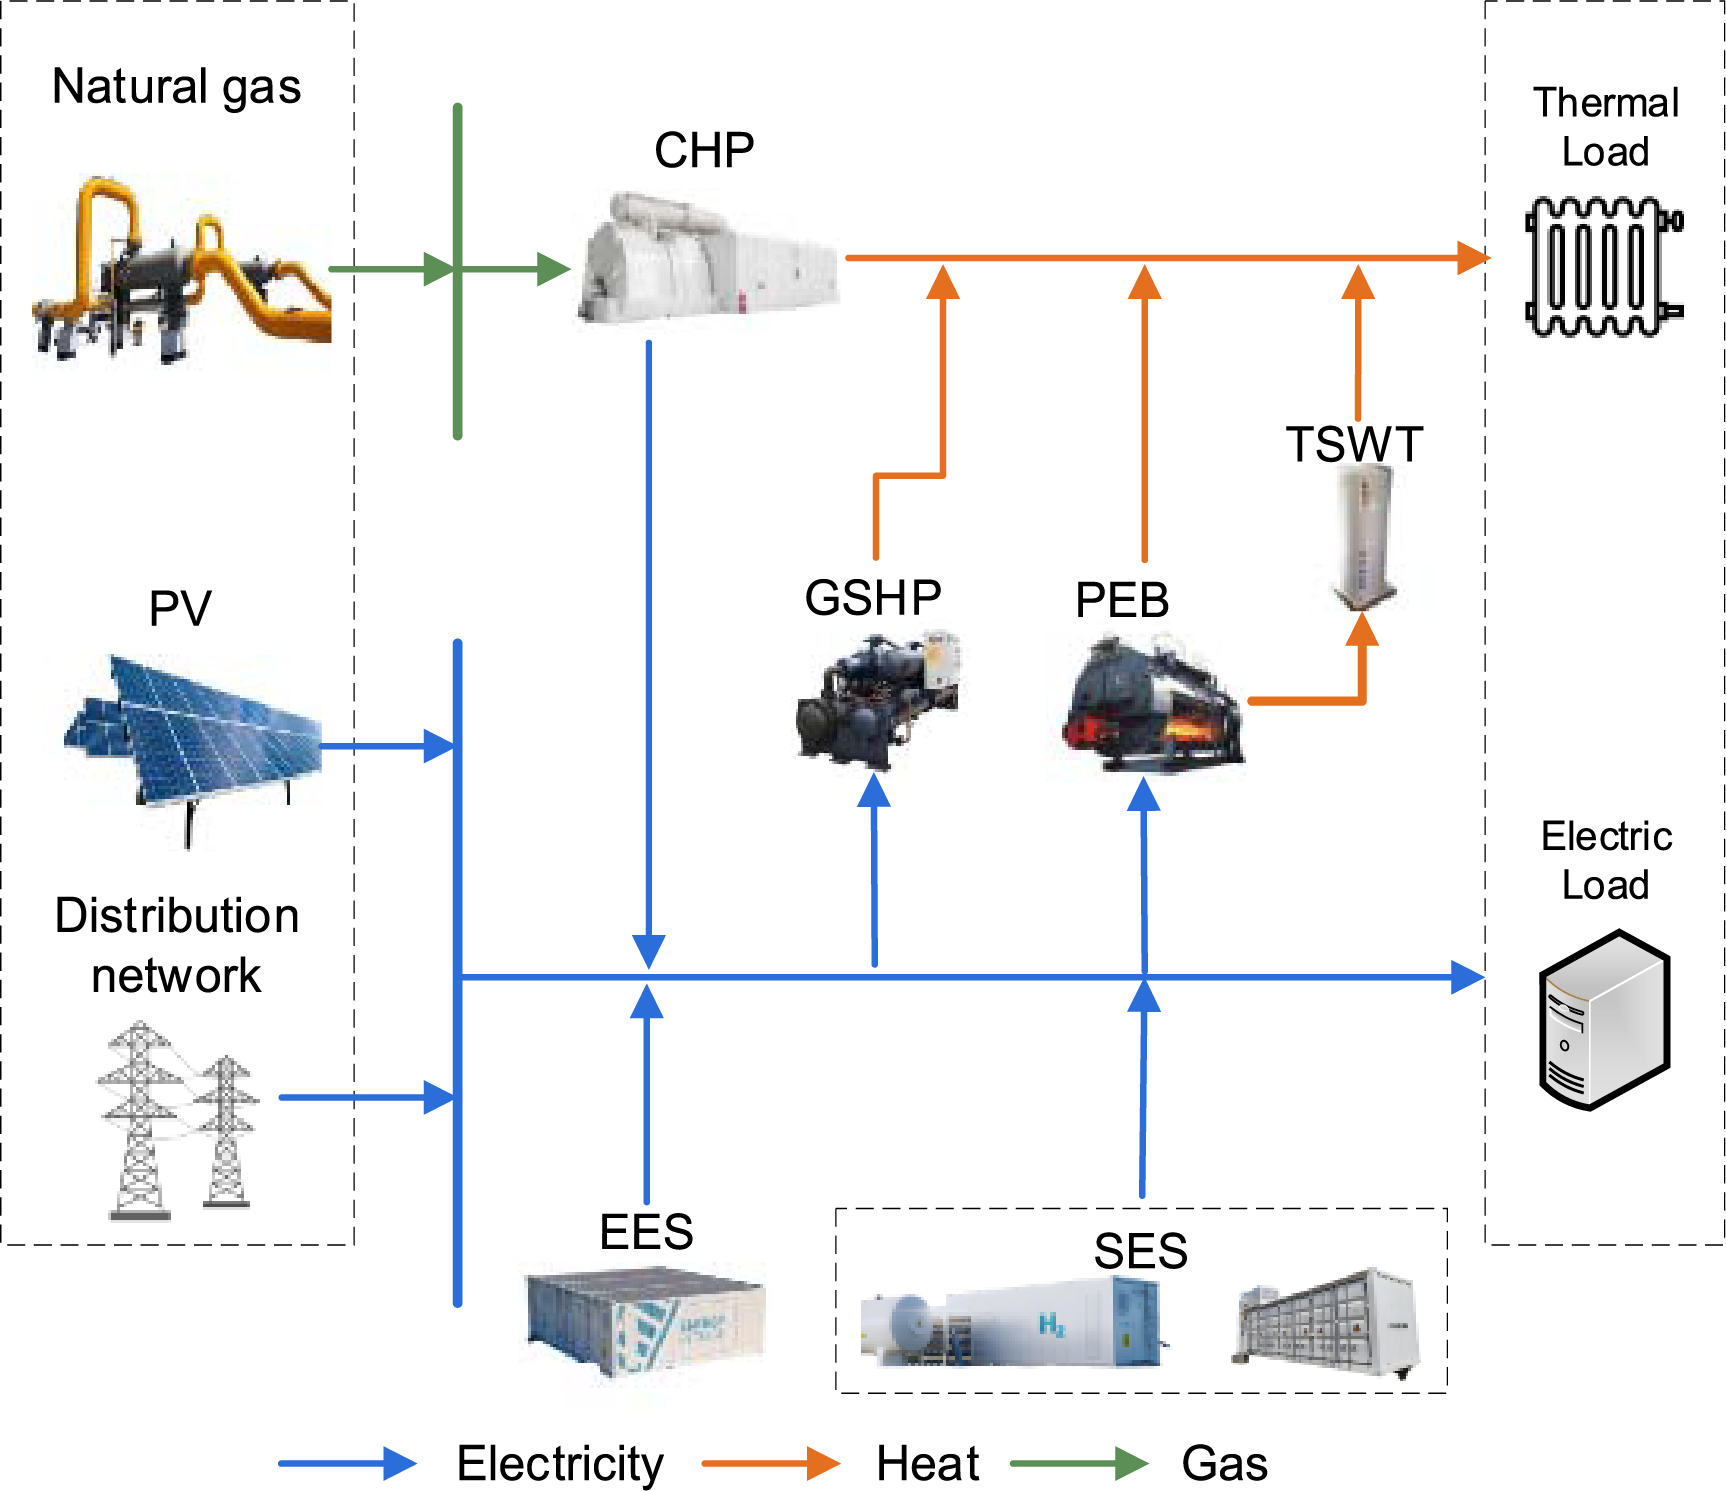
Figure 1: Framework for a typical park operation model
(1) Energy input: The integration of three inputs is achieved, including the PV system, the external grid power supply, and the natural gas supply.
(2) Energy conversion: Electrical energy is converted into thermal energy via GSHP and pressurized electric boilers (PEB). Natural gas is converted into electricity and thermal energy through CHP equipment.
(3) Energy storage system: Comprises EES devices and thermal storage water tanks (TSWT). Additionally, the park can purchase energy storage services from shared energy storage (SES) providers.
(4) Energy consumption: The electrical load and the thermal load are both included.
The PV system converts solar irradiance into electrical power. Its output is determined by two key environmental parameters: solar irradiance and cell operating temperature [18]. Therefore, the output of the PV system is expressed as a functional relationship of these parameters [19]. The operational constraints of the PV system are given by Eqs. (1)–(3).
where
The GSHP utilizes electricity to extract shallow geothermal energy. In winter, the low-grade energy is transformed into higher-grade heat and supplied to the building. This paper focuses on the GSHP in heating mode during winter.
The GSHP output constraint is given by Eq. (4), which constrains the upper and lower limits of the heating power output from the GSHP host unit.
where
where
2.4 Thermal Storage Electric Boiler
The TSEB is an electrical heating device designed to convert and store thermal energy. Unlike conventional electric boilers that provide direct heating only, the TSEB can actively accumulate thermal energy during off-peak hours when electricity prices are low. During periods of high heating demand, the stored energy is discharged via a heat exchange system into the district heating network. This operational strategy enhances both energy efficiency and economic performance. The TSEB system in this paper consists of two subsystems: PEB and TSWT.
The relationship between the total heating power of the TSEB system and the heating powers of its two subsystems is given by Eq. (7).
where
2.4.1 Pressurized Electric Boiler
The PEB converts electricity into thermal energy for high-temperature heat supply. Operating under elevated pressure compared to atmospheric boilers, it achieves higher outlet temperatures and improved operational safety, offering significant technical advantages [21].
Eq. (8) states that the total energy output of the PEB is the sum of its heating power and thermal storage power. Eq. (9) limits the total energy output of the PEB to be less than its upper limit. Eq. (10) constrains the heating power to be non-negative.
where
The electricity consumption of the PEB is given by Eqs. (11)–(14). Eq. (11) describes the operating electric power of the PEB, taking into account the heat loss caused by the working fluid flow velocity [22]. Eq. (12) indicates that the working fluid velocity is a function of the water pump’s output [23].
where
2.4.2 Thermal Storage Water Tank
The TSWT serves as the core component of the TSEB system. Its main function is to store and release thermal energy, thereby facilitating the temporal shift and utilization of heat. The device accumulates thermal energy produced by the PEB during off-peak electricity price periods and discharges it during times of high heating demand. However, extended storage durations lead to inevitable thermal energy losses due to heat dissipation. Prolonged thermal storage results in thermal energy loss.
The thermal energy stored in the TSWT is given by Eqs. (15) and (16). Eq. (17) constrain the heating power output of the TSWT. Eqs. (18) and (19) ensure the TSWT cannot store and release simultaneously. The binary variables are defined in Eq. (20).
where
Considering the thermal stratification [24] and the load effect of the TSWT, its power upper limit should be subject to variation over time t, as shown by Eqs. (21)–(25). Eq. (21) illustrates that the maximum thermal storage capacity of the TSWT is influenced by its internal temperature distribution. Eq. (22) specifies that the maximum supply temperature of the TSWT should not exceed 98°C. Meanwhile, Eq. (23) indicates that the supply water temperature is a function of the total heating load. Under conditions of limited flow rate, the water temperature should increase accordingly to meet a higher heat demand.
where
2.5 Combined Heat and Power Unit
The CHP unit generates electricity by burning natural gas in a gas turbine and simultaneously recovers waste heat generated during the power generation process. This production method enables the simultaneous supply of electricity and thermal energy, improving fuel utilization and reducing energy consumption while enhancing system efficiency.
The operational constraints of the CHP unit are given by Eqs. (26)–(30).
where
EES devices facilitate the spatiotemporal transfer of electrical energy via electrochemical reactions. They store surplus electricity by converting it into chemical energy and release it back as electricity during periods of high demand. Within the park, electricity is stored when supply exceeds demand or when prices are low, and discharged during peak demand or high-price periods [26]. This strategy mitigates the volatility of renewable energy generation and contributes to peak shaving and valley filling in the park’s electricity consumption.
The operational constraints for the EES device are given by Eqs. (31)–(36).
Eq. (31) describes the working process of the EES device, where
Although the EES device only relies on fuel or stored chemical energy and does not directly consume grid electricity for operation, energy losses occur during the charging, discharging, and storage processes. The electrical energy loss during EES operation at each time step is given by Eq. (37). The electrical energy loss of the EES device will be used to calculate the carbon emissions generated during its operation.
SES integrates decentralized energy storage resources from the grid, generation, and user sides, making them available for on-demand use by multiple users [27]. The park enters into service agreements with SES providers based on storage dispatch decisions, purchasing storage capacity and paying service fees to satisfy its internal energy storage requirements.
The operational constraints for SES are given by Eqs. (38)–(43):
where
3 Low-Carbon Operation Optimization Model for Multi-Energy Parks
The equipment models established in Section 2 are formulated as a mixed-integer linear programming problem. This section presents the low-carbon operation optimization model for multi-energy parks and its objective function.
The carbon trading model comprises a carbon accounting model, a carbon quota allocation model, and a carbon price model.
Accurate carbon accounting methods are fundamental to low-carbon emission reduction. Carbon emissions are categorized as direct carbon emissions and indirect carbon emissions, as shown in Fig. 2.
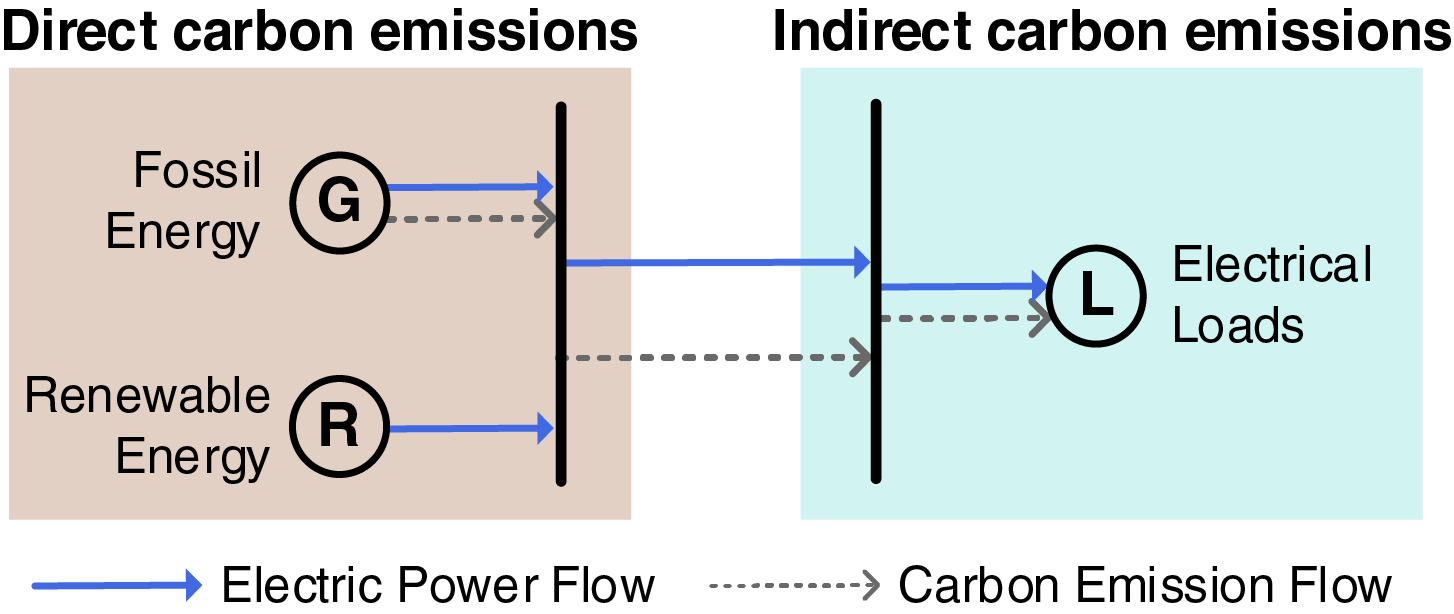
Figure 2: Classification of direct and indirect carbon emissions
Direct carbon emissions are defined as CO2 emitted directly by the sources. This includes emissions from on-site fossil fuel combustion or industrial processes. Indirect carbon emissions are those attributable to an entity’s activities but occurring from sources not directly under its control. These emissions typically arise from purchased electricity, heat, transportation services, or other activities associated with the entity’s consumption. While physically emitted by entities such as power generators or transportation providers, the responsibility for these indirect emissions is assigned to the consuming entity.
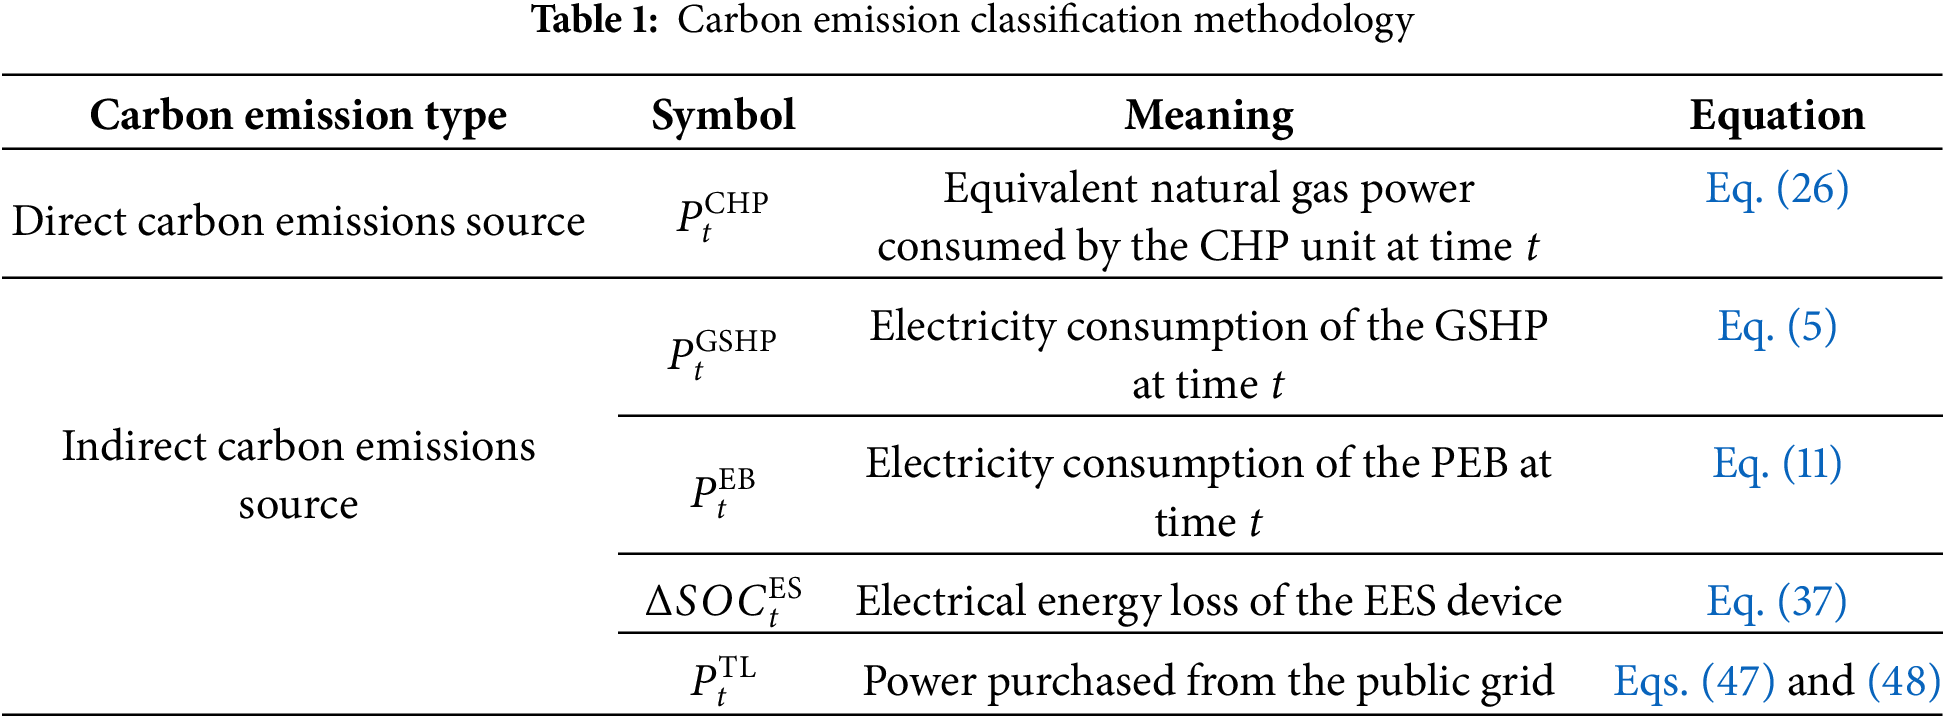
In this paper, the CO2 emissions from the CHP unit burning natural gas are classified as direct carbon emissions. In contrast, the electricity consumption activities of the park and the energy losses of the EES devices [28] are regarded as indirect carbon emissions. Although these activities do not produce CO2, they indirectly lead to CO2 generation elsewhere. The classification of carbon emissions is shown in Table 1.
The carbon emissions generated by park operations are given by Eqs. (44)–(48).
where
3.1.2 Carbon Quota Allocation Model
Carbon emission trading (carbon market) treats carbon quotas as commodities. Its purpose is to reduce carbon emissions by economic instruments. The carbon market is divided into the primary carbon market and the secondary carbon market.
Government regulators set overall carbon quotas and allocate them to entities in the primary carbon market through methods such as free allocation and auctions. These entities can subsequently trade quotas in the secondary market. If an entity’s emissions exceed its allocated quota, it must purchase additional allowances, while those with surpluses may sell them to others. By the compliance deadline, entities are required to hold sufficient quotas; otherwise, they will incur penalties. The trading mechanism of the secondary carbon market is shown in Fig. 3.
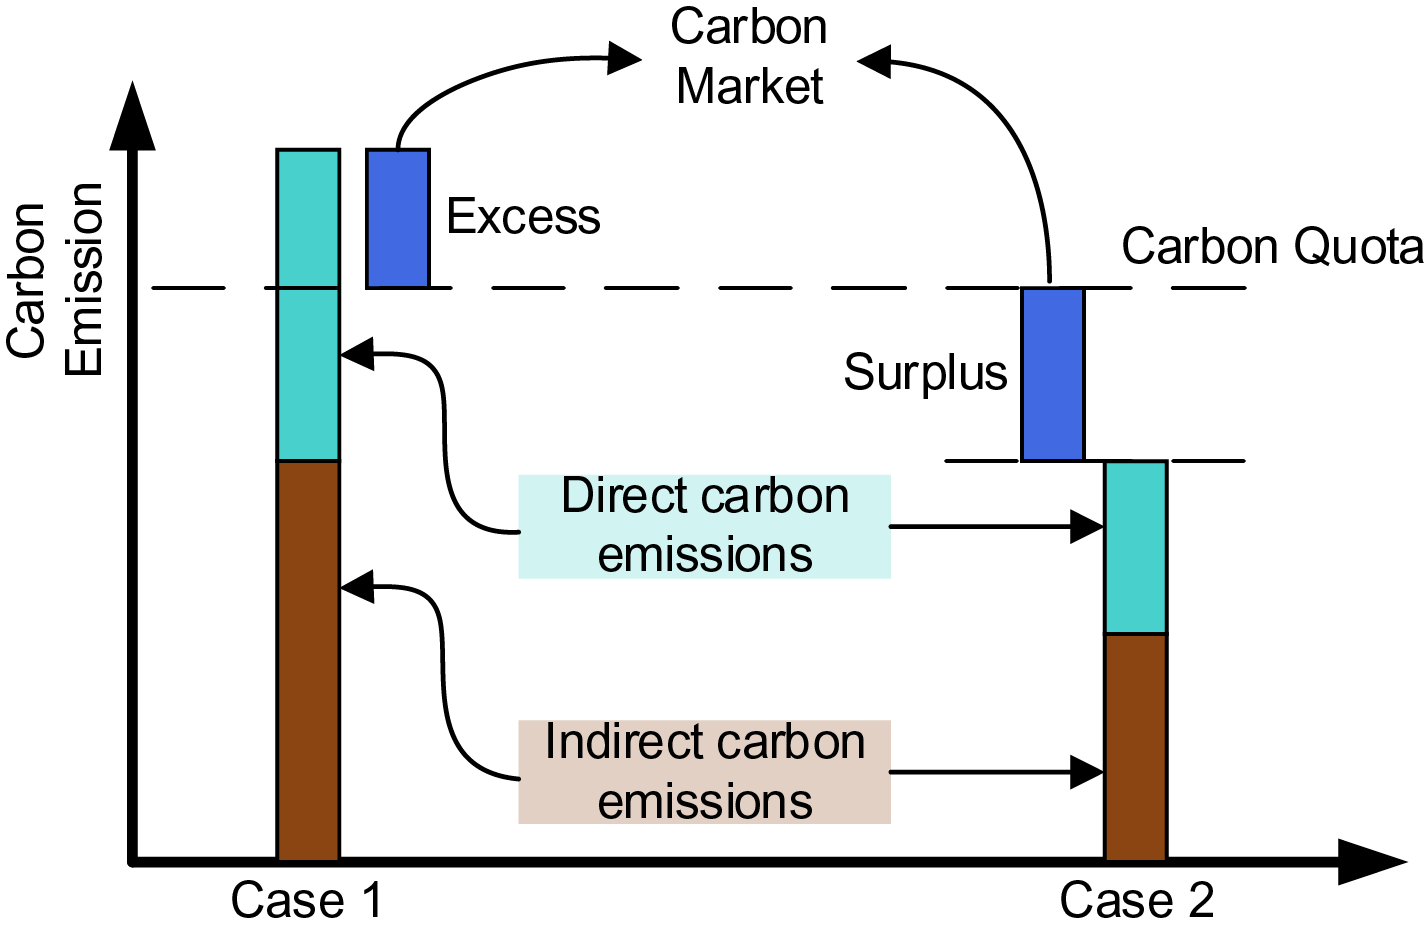
Figure 3: Trading mechanism in secondary carbon market [30]
This paper’s carbon quota allocation model addresses the primary carbon market, where government departments allocate quotas gratis to the park according to its carbon emission intensity. The carbon quota allocation model for park is given by Eqs. (49)–(51).
where
The carbon price model reflects secondary market operations. The trading volume in the carbon market is defined as the difference between its carbon emissions. The park’s trading volume is defined in Eq. (52). A positive
The carbon market price function is given by Eq. (53).
where,
Fig. 4 shows the function of the tiered carbon price. The blue curve illustrates the park’s total carbon cost dependence on trading volume, which increases non-linearly. The red curve plots the unit price against trading volume, demonstrating a stepwise progression as volume rises.
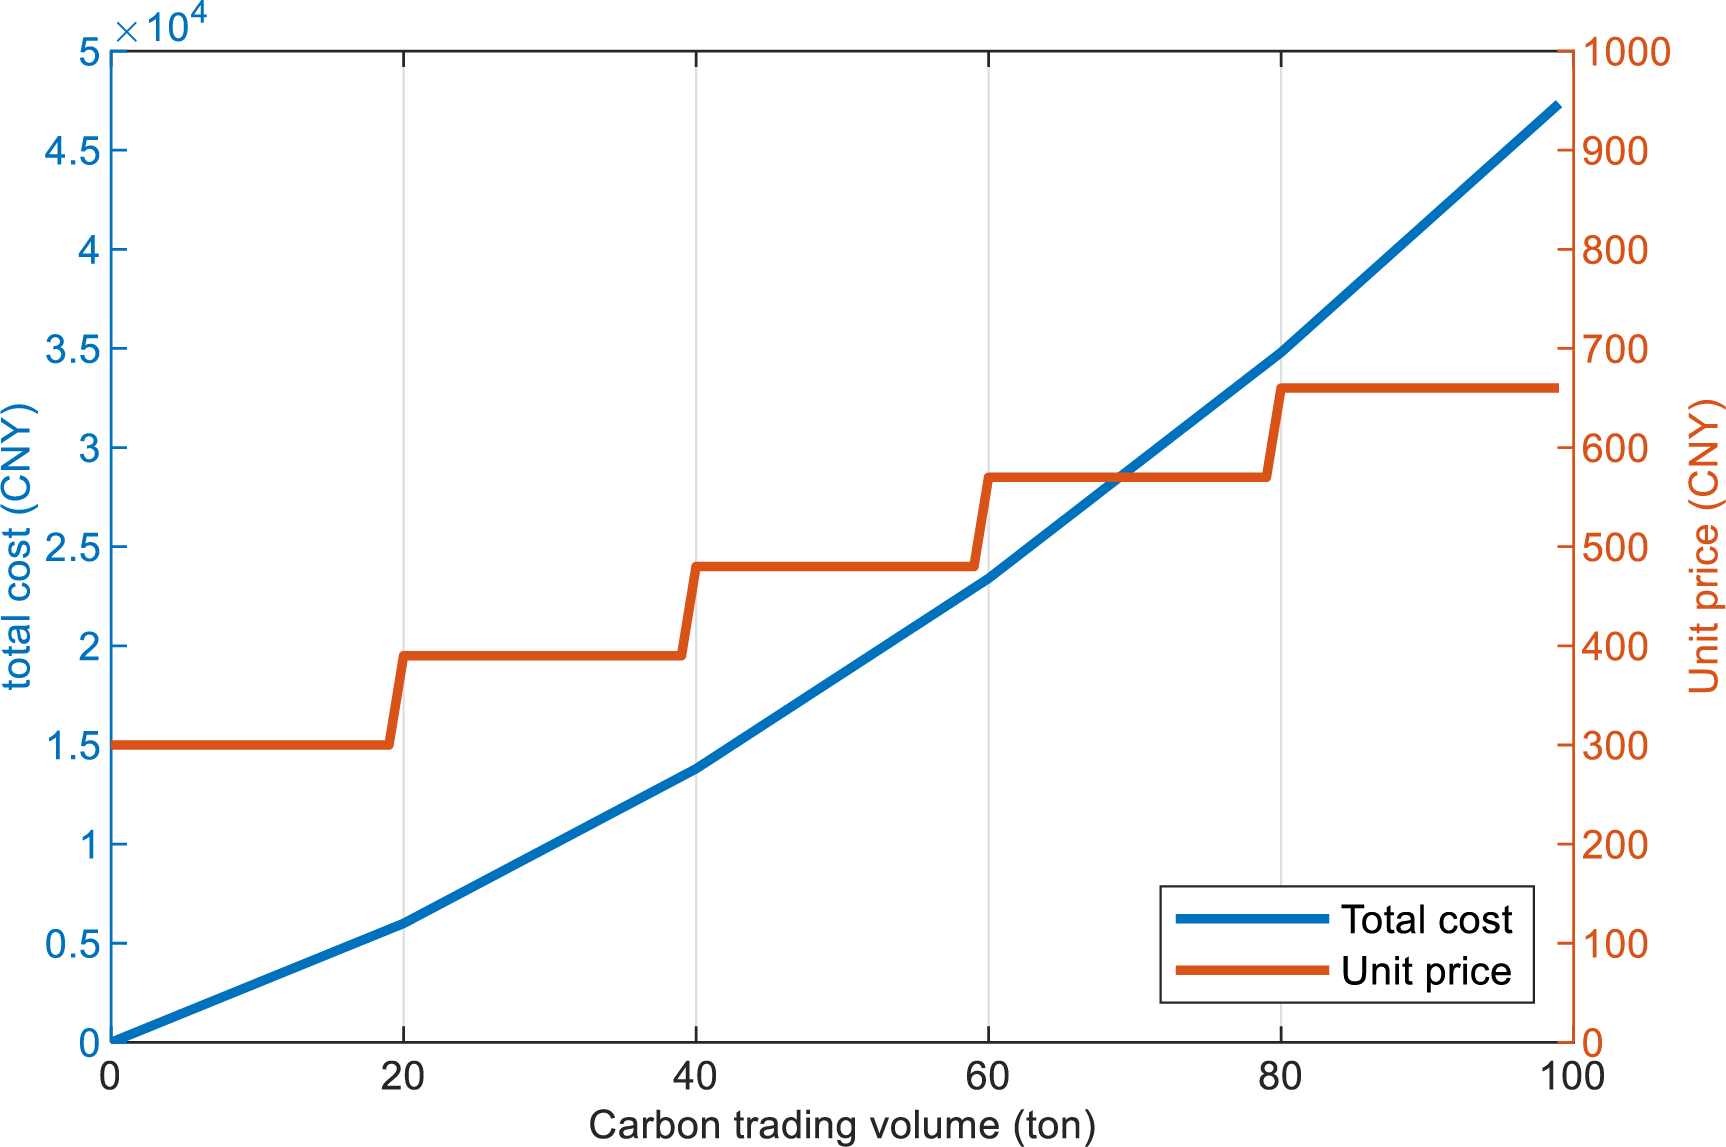
Figure 4: Tiered carbon pricing mechanism and its cost impact
3.2 Low-Carbon Operation Optimization Problem
The objective function of the park operations optimization model is to minimize the system operating costs over one scheduling cycle. Eq. (54) represents the daily operating cost (
where
While SES incurs direct service fees for charge/discharge operations, EES operational costs are internalized through carbon emissions: Energy losses
3.2.2 Power Balance Constraints
A balance must be maintained between the supply of energy carriers and the load demand at each time step
(1) Thermal Power Balance Constraint
where
(2) Electrical Power Balance Constraint
Eq. (58) represents the electrical power balance constraint, signifying that the total power supply in the park must equal the total power demand.
where
3.2.3 Equipment Start-Stop Operation Constraints
Frequent start-stop cycles adversely affect equipment lifespan and incur additional operational costs. Therefore, the CHP unit and PEB system within the TSEB are subject to the constraint that each device, once started, must operate continuously for at least 6 h. These constraints are formulated using binary state variables and expressed uniformly as:
where:
The above equations define
this 0 to 1 state change marks the onset of an operational cycle.
When
ensuring 6 consecutive hours of operation after startup.
Based on the aforementioned general constraints, the operational start-stop constraint variables
Building on Section 2 equipment models, an electricity-carbon synergy optimization method is developed for low-carbon park operations. Dynamic models of PV, GSHP, TSEB, CHP, and EES are integrated with power balance constraints, equipment operation rules, and carbon trading mechanisms. A multi-energy complementary mixed-integer programming model with low-carbon orientation is established.
The solution process of the optimization model can be summarized into the following steps: input layer, optimization layer, solution layer, and output layer, as shown in Fig. 5. The input layer integrates external data and the energy supply equipment models established in Section 2, providing the fundamental parameters for the optimization model.
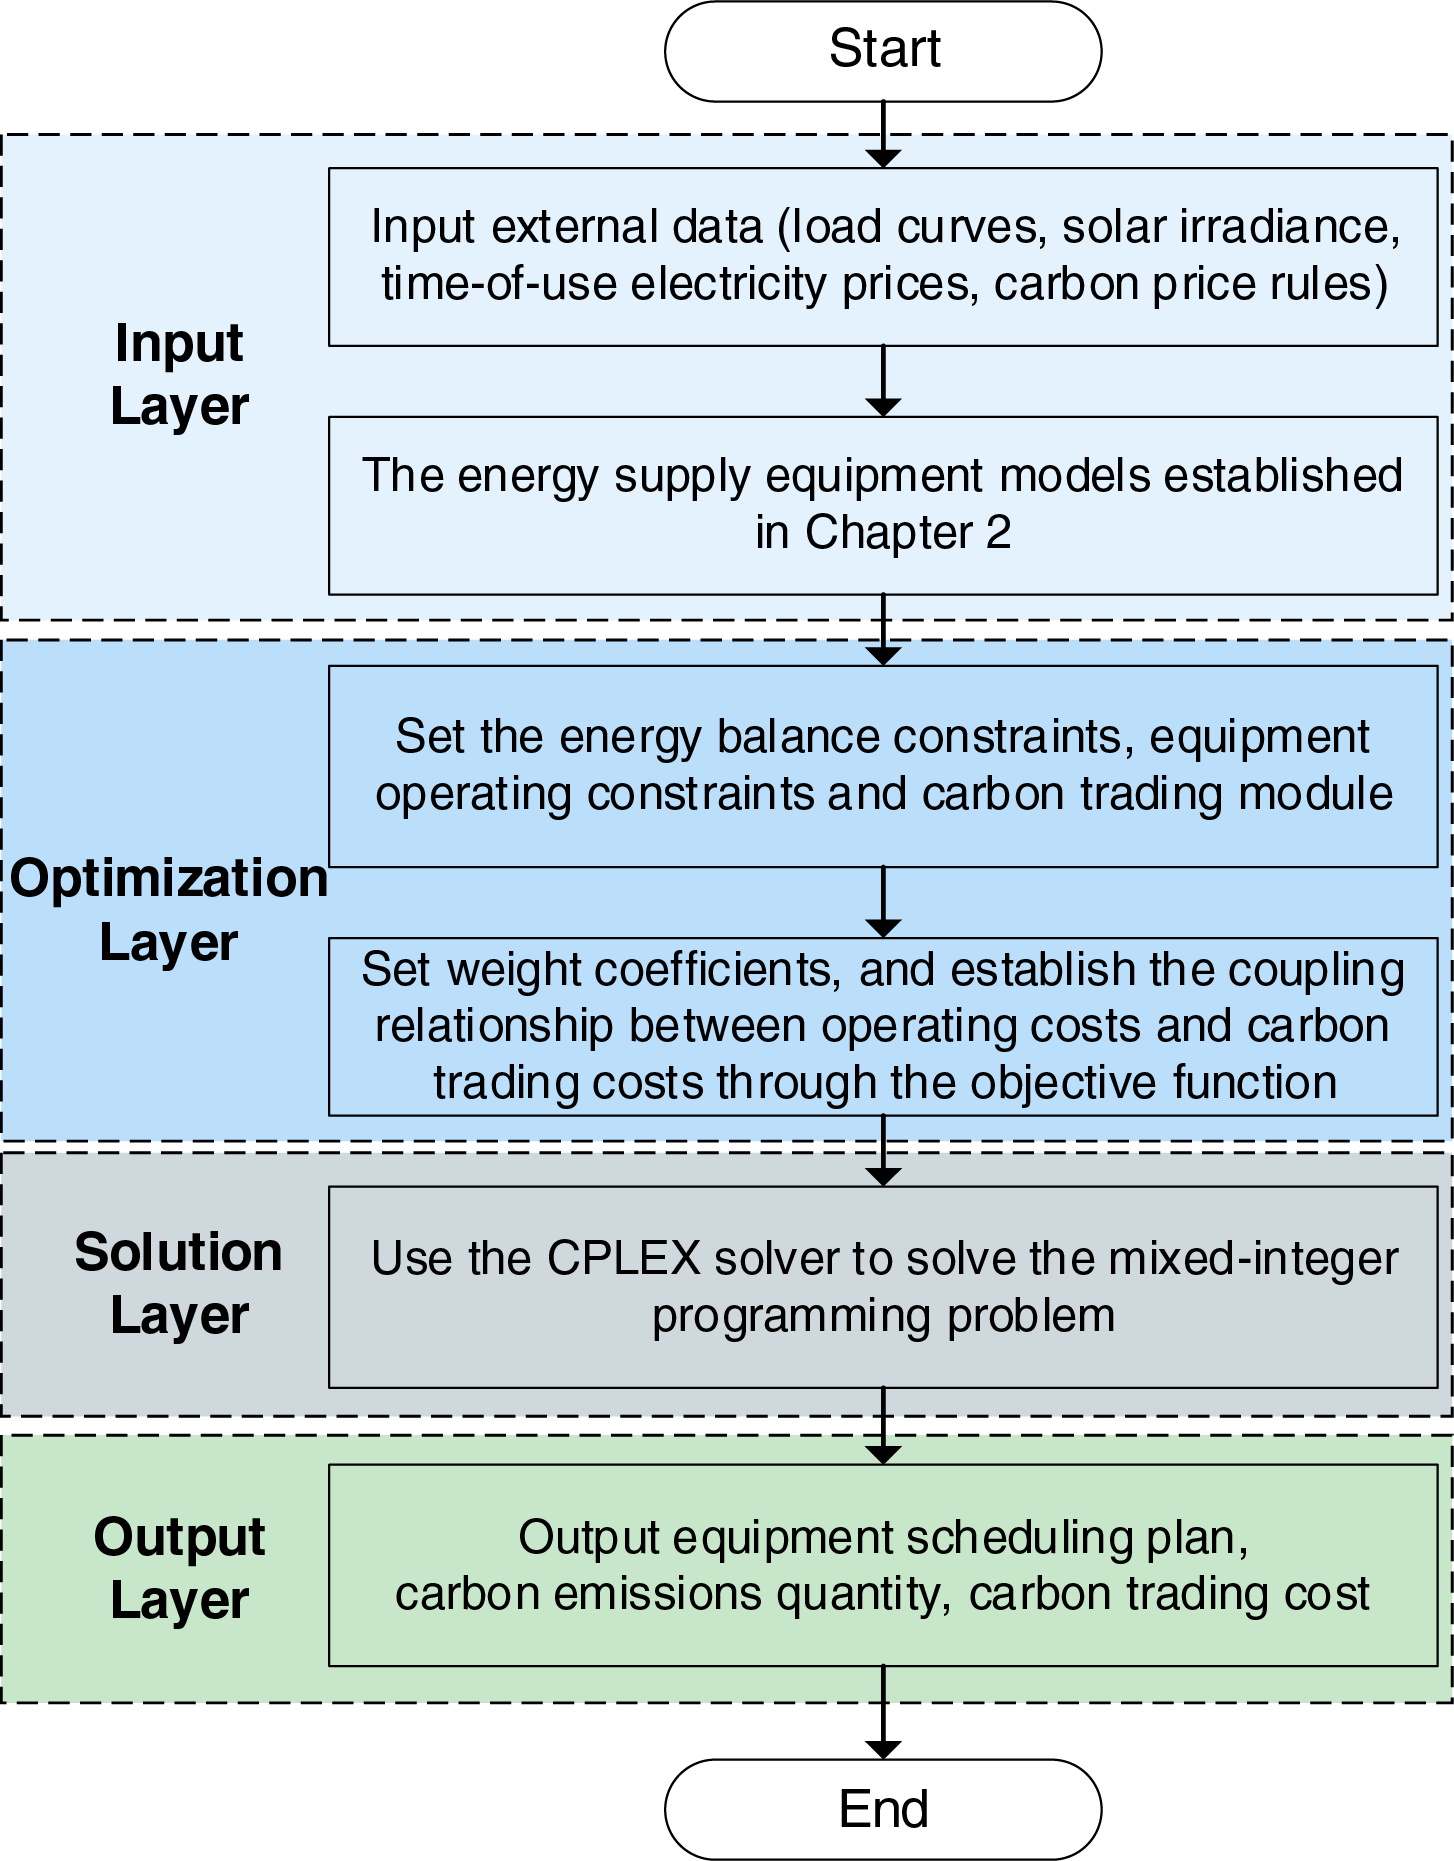
Figure 5: Solving flow of the mixed-integer programming optimization model
The optimization layer establishes the coupling relationship between operating costs and carbon trading costs through the objective function. By setting weight coefficients
The solution layer employs the CPLEX solver to solve the mixed-integer programming problem, generating equipment scheduling schemes, energy storage system charge/discharge sequences, and carbon emission data. The output layer provides the equipment operation schedule, energy storage system status, energy purchasing strategy, and carbon emission data, providing data support for subsequent scenario comparative analysis.
4.1 Data Description and Case Design
A representative multi-energy park incorporating all Sections 2 and 3 equipment and mechanisms is selected to validate model effectiveness, with electricity and heat load demands analyzed. Four critical dimensions of technical and economic parameters are included.
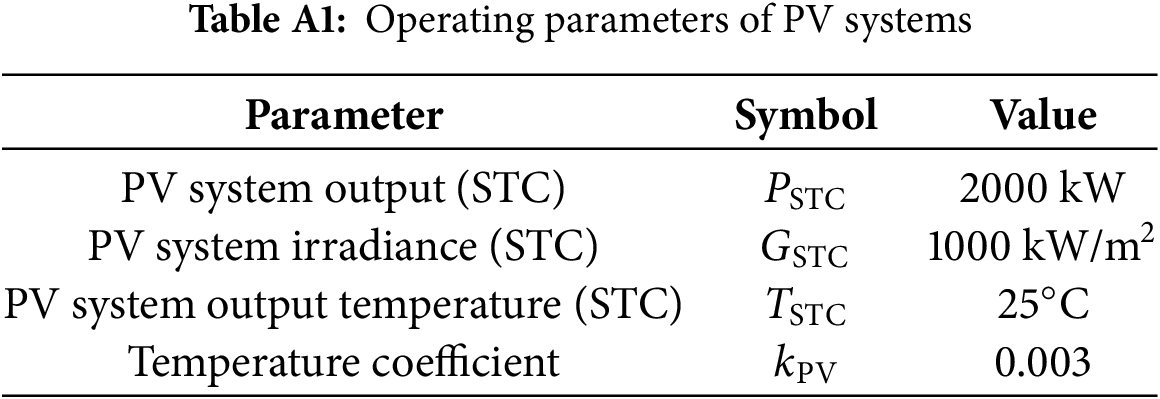
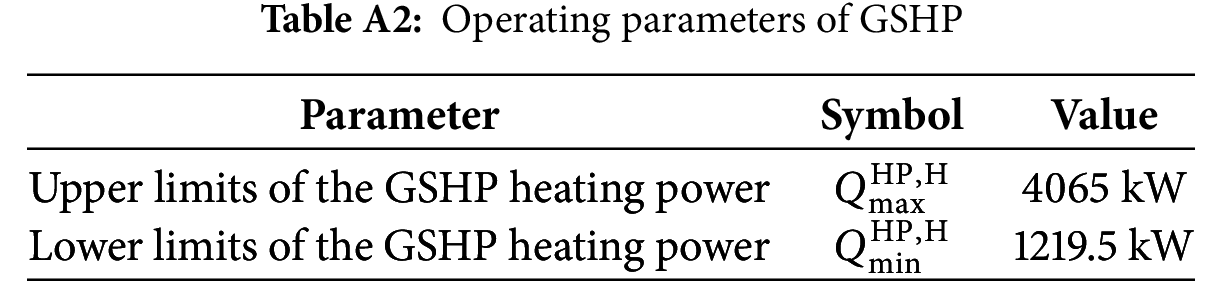
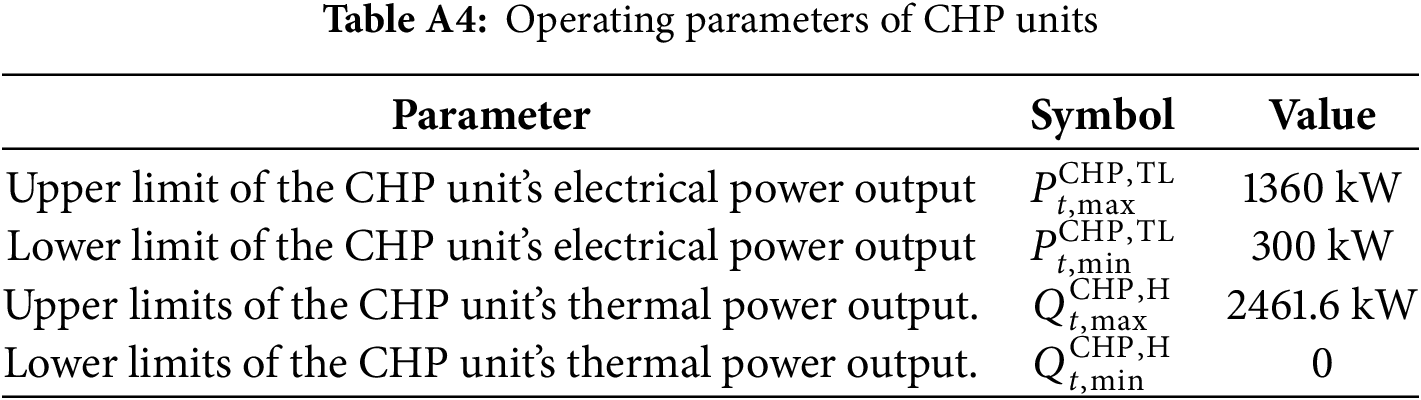
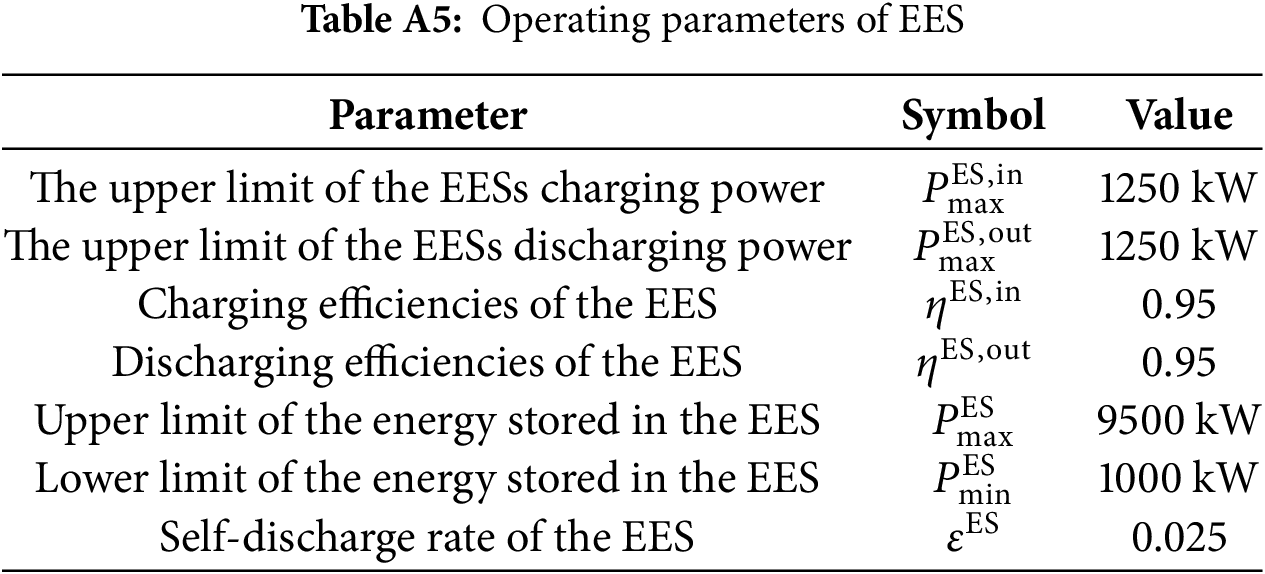
(1) Equipment operation parameters. The operating efficiencies and power parameters for various park equipment are listed in Appendix Tables A1–A5.
(2) Load parameters. The variations in the park’s thermal and electrical loads are shown in Fig. A2.
(3) Solar irradiance parameters. The predicted solar irradiance curve is shown in Fig. A3.
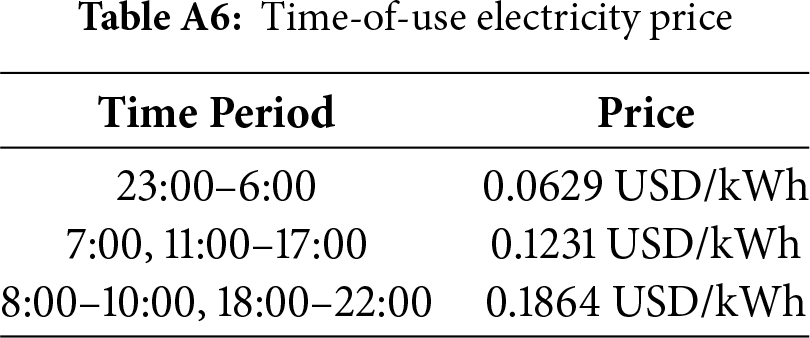
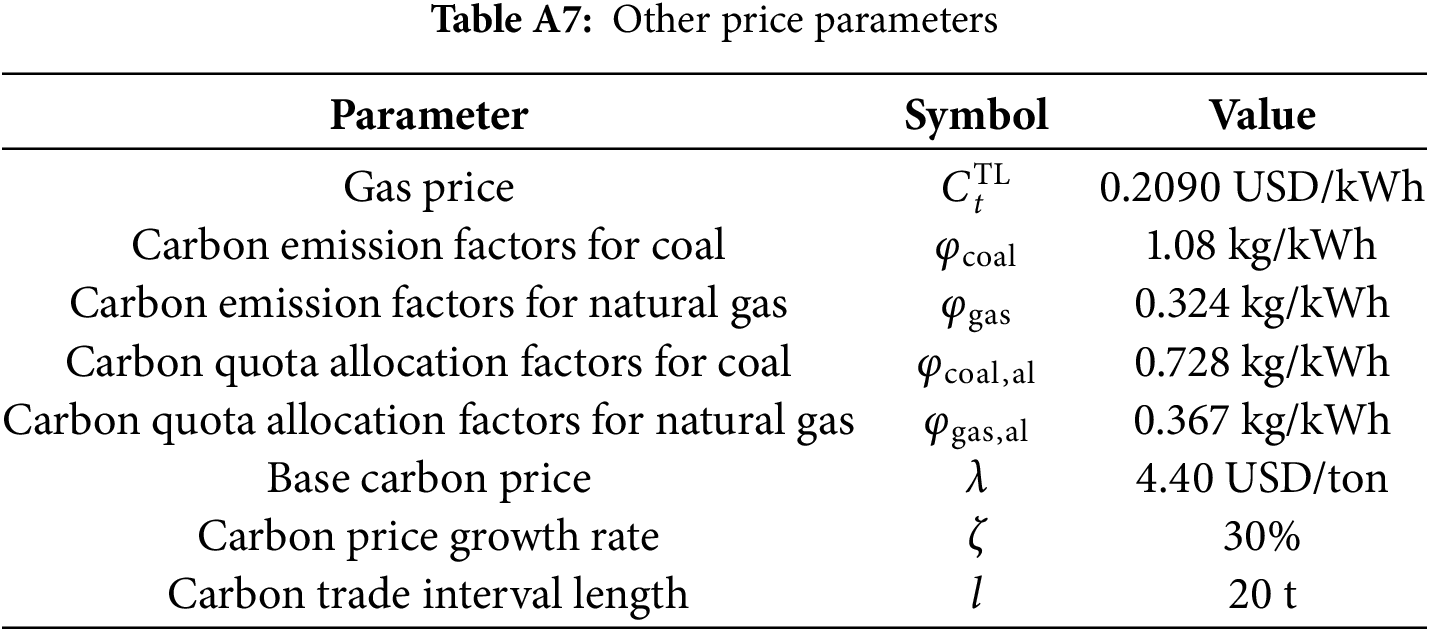
(4) Cost parameters. Time-of-use electricity prices, natural gas prices, and carbon trading prices in Appendix Tables A6 and A7. Electricity prices follow spot market time-of-use characteristics. Natural gas prices remain stable short-term due to market supply-demand balance, modeled as a constant.
4.2 Operation Results and Analysis
To validate the efficacy of the proposed electricity-carbon synergy optimization model for multi-energy parks, three distinct operational scenarios have been designed and comparatively analyzed:
Scenario I: Excluding carbon trading and environmental considerations, this scenario minimizes only the park’s operating costs. It serves as a baseline, revealing the limitations of purely economic-driven strategies for achieving low-carbon operations.
Scenario II: Building upon Scenario I, carbon trading mechanisms are integrated. A multi-objective optimization balances operating costs against carbon trading expenses.
Scenario III: Within Scenario II’s framework, environmental objectives are prioritized by increasing the weight on carbon cost reduction. This explores optimization strategies under asymmetric emphasis on environmental benefits over economic considerations.
The economic performance across three operational scenarios is systematically compared in Table 2, highlighting the impact of carbon pricing mechanisms on cost structures.
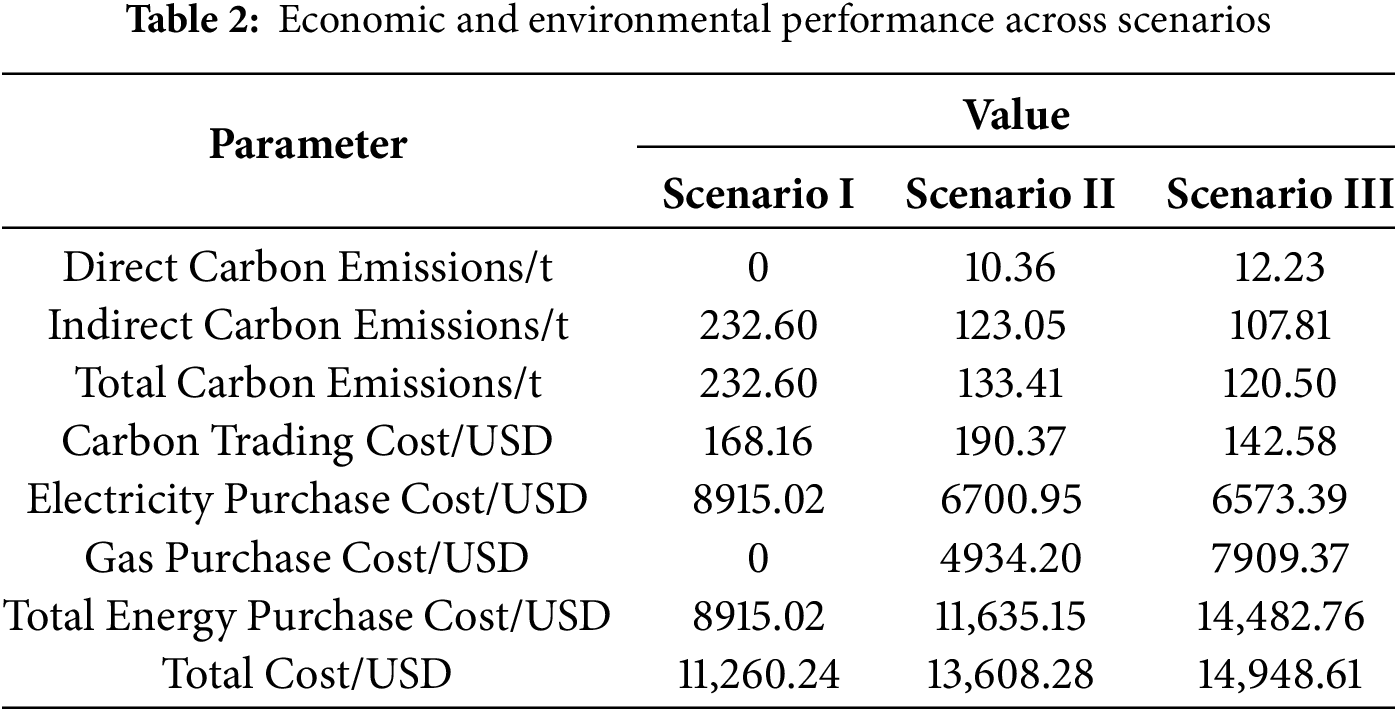
In Scenario I, all emissions are indirect, originating from electricity consumption. The absence of carbon price signals impedes adoption of cleaner but potentially higher-cost options such as CHP.
Implementation of electricity-carbon synergy in Scenario II yielded simultaneous economic and environmental benefits, reducing carbon emissions by 42.64% while increasing total operational costs by 20.85% compared to Scenario I. This cost optimization primarily resulted from the internalization of carbon expenses through the tiered pricing mechanism, which effectively transformed emissions into controllable economic variables. The marginal carbon emission cost reaches 23.67 USD/ton, significantly exceeding the base carbon price of 4.4 USD/ton. This indicates that each ton of carbon emission reduced incurs an additional cost of 23.67 USD. The pursuit of environmental benefits thus necessitates a trade-off in economic performance, which aligns with theoretical expectations.
Scenario III demonstrated the economic viability of aggressive decarbonization strategies. Although natural gas consumption costs increased by 60.30% due to expanded CHP utilization, carbon trading expenses decreased by 25.10% relative to Scenario II. The marginal carbon emission cost in this scenario reaches 103.82 USD/ton, substantially higher than the 23.67 USD/ton observed in Scenario II. This indicates that increased preference for environmental benefits incurs progressively higher costs.
Due to the tiered carbon pricing mechanism, when parks proactively reduce emissions into lower price tiers, they not only reduce the volume of carbon traded but also avoid the high carbon prices in high-emission tiers. Conversely, to reduce emissions, the park purchases more expensive natural gas, driving up the energy purchase cost and ultimately increasing the total cost. This mechanism proved instrumental in maintaining cost controllability while achieving substantial emission reductions.
4.2.2 Supply and Demand Analysis
Fig. 6 shows the thermal power allocation in Scenario I, II and III.
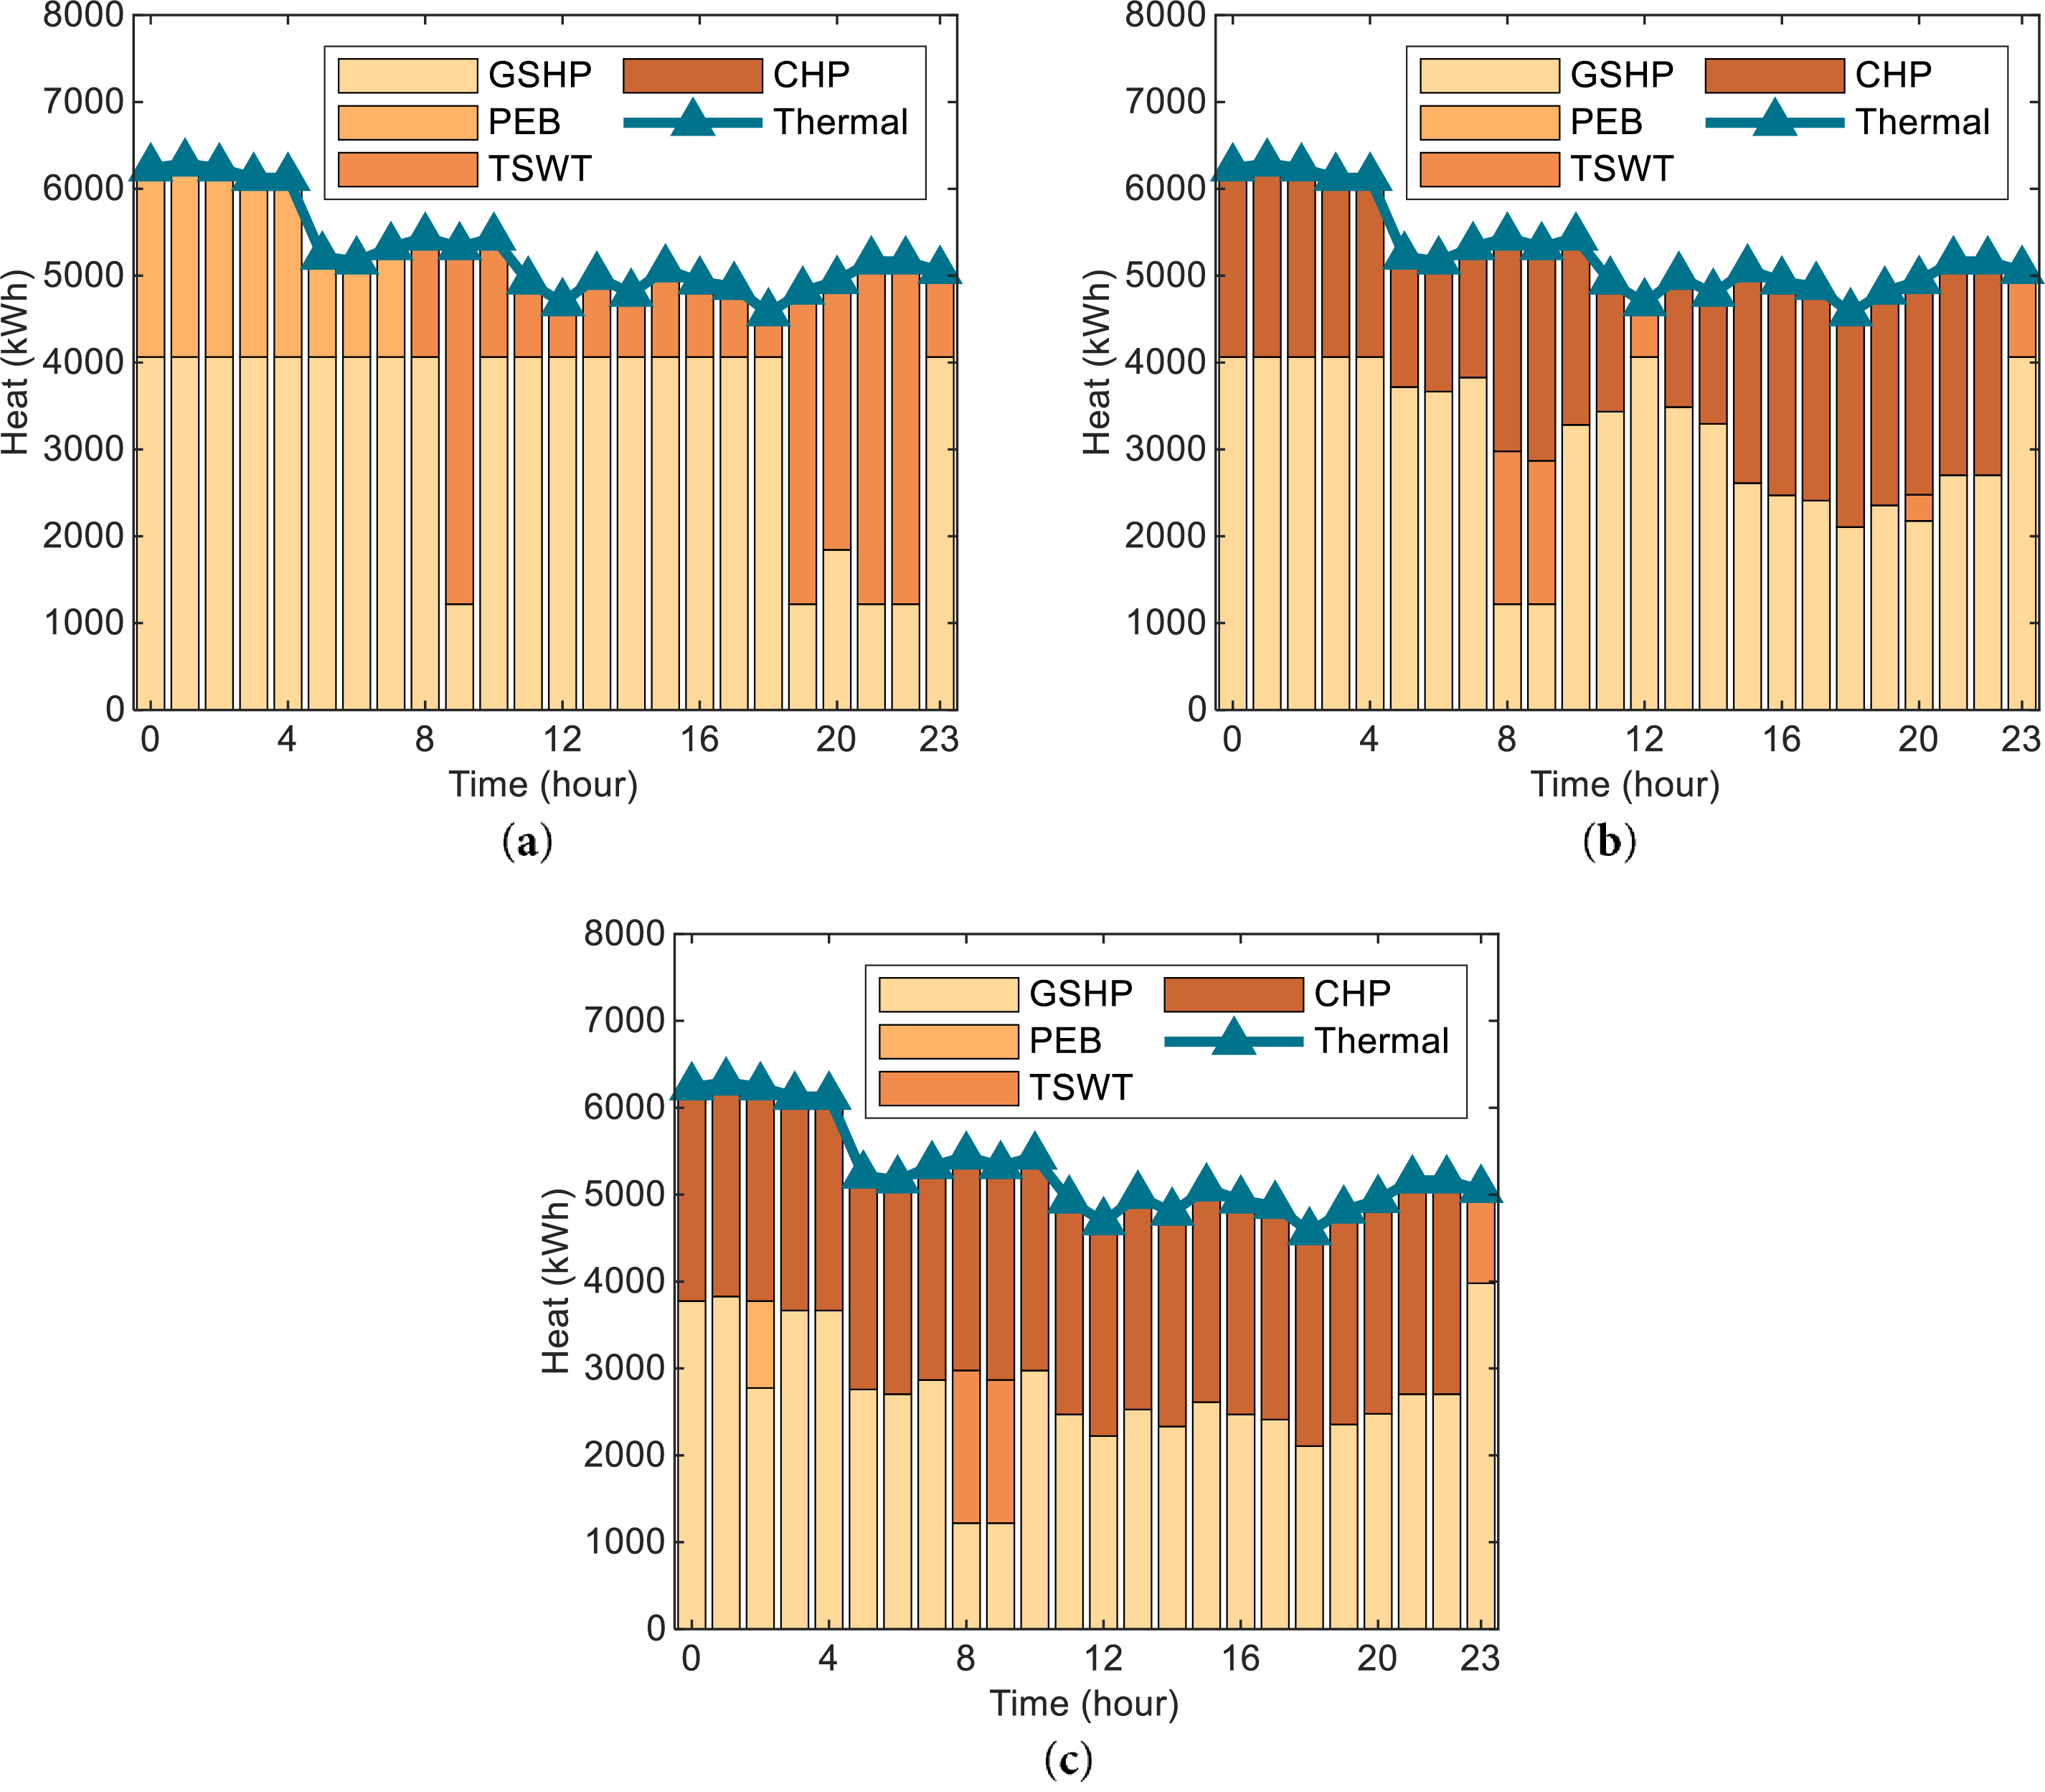
Figure 6: Thermal supply-demand balance (a, b, c for Scenario I, II, III, respectively)
Scenario I established a GSHP-dominated thermal supply structure supplemented by TSEB systems. During peak electricity price periods (
Scenario II fundamentally transformed the thermal supply paradigm with CHP becoming the dominant heat source. The TSEB system shifted to exclusive thermal storage mode during off-peak hours, while GSHP served as auxiliary supply during CHP inactivity.
Fig. 7 illustrates the electrical power balance in Scenario I, II and III.
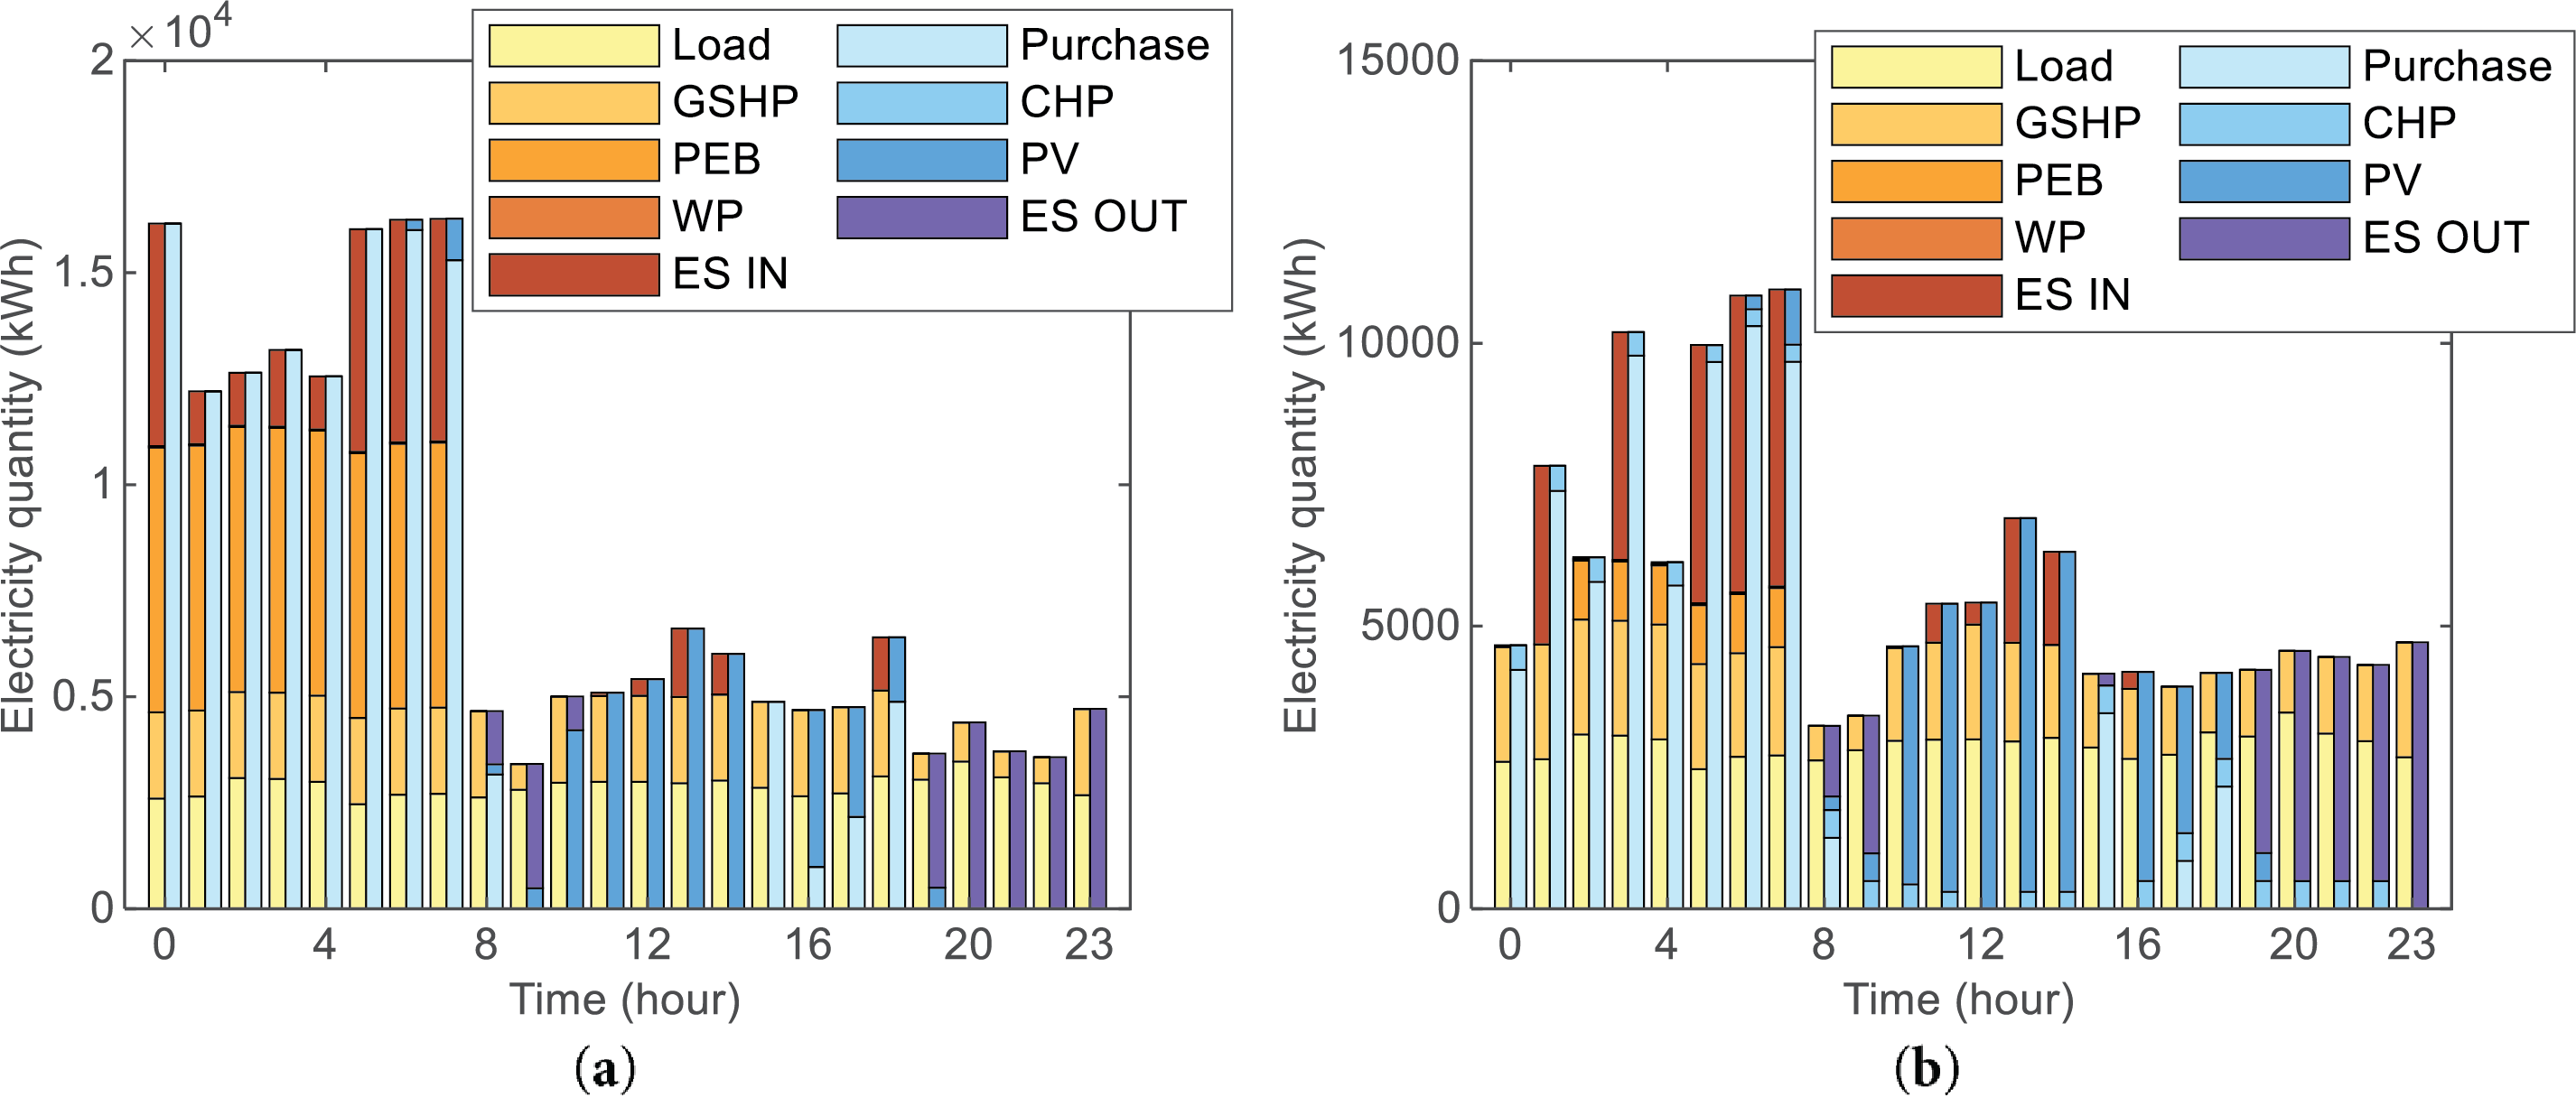
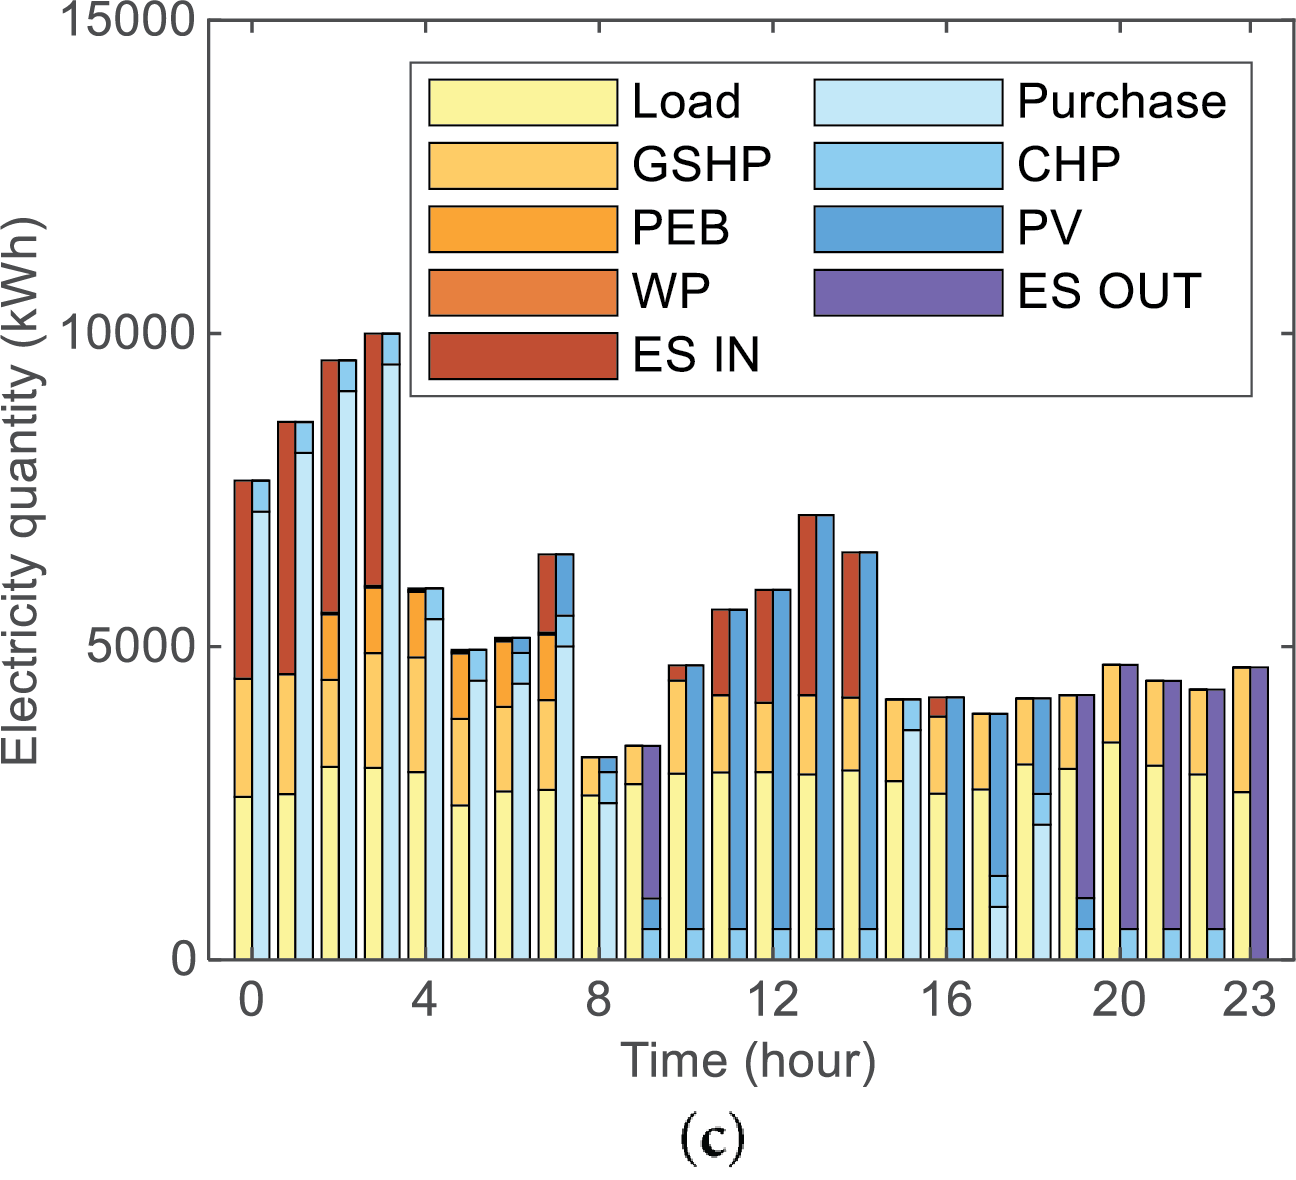
Figure 7: Electrical supply-demand balance (a, b, c for Scenario I, II, III, respectively)
Scenario I achieved real-time power balance through multi-energy sourcing. Purchased electricity and PV generation met demand, supported by EES and SES discharging during peak hours. Economic responsiveness was evidenced by energy storage during low-price periods (t = 0–7, 11–14, 17–18) and utilization during high-price intervals (t = 8–10, 19–23). PV output followed solar irradiance profiles.
Scenario II maintained similar storage strategies but reduced electricity purchases by 24.84% relative to Scenario I. This reduction was directly attributed to increased CHP utilization, which displaced grid electricity consumption.
Scenario III further decreased electricity purchases by 1.90% compared to Scenario II. Total electricity demand exhibited evident reduction as carbon pricing influenced consumption behavior.
Scenario III is selected for energy storage analysis due to its distinctive operational characteristics under carbon constraints. The storage systems exhibit evident differences compared to the scenario I.
Fig. 8 shows the operational status of the TSWT.
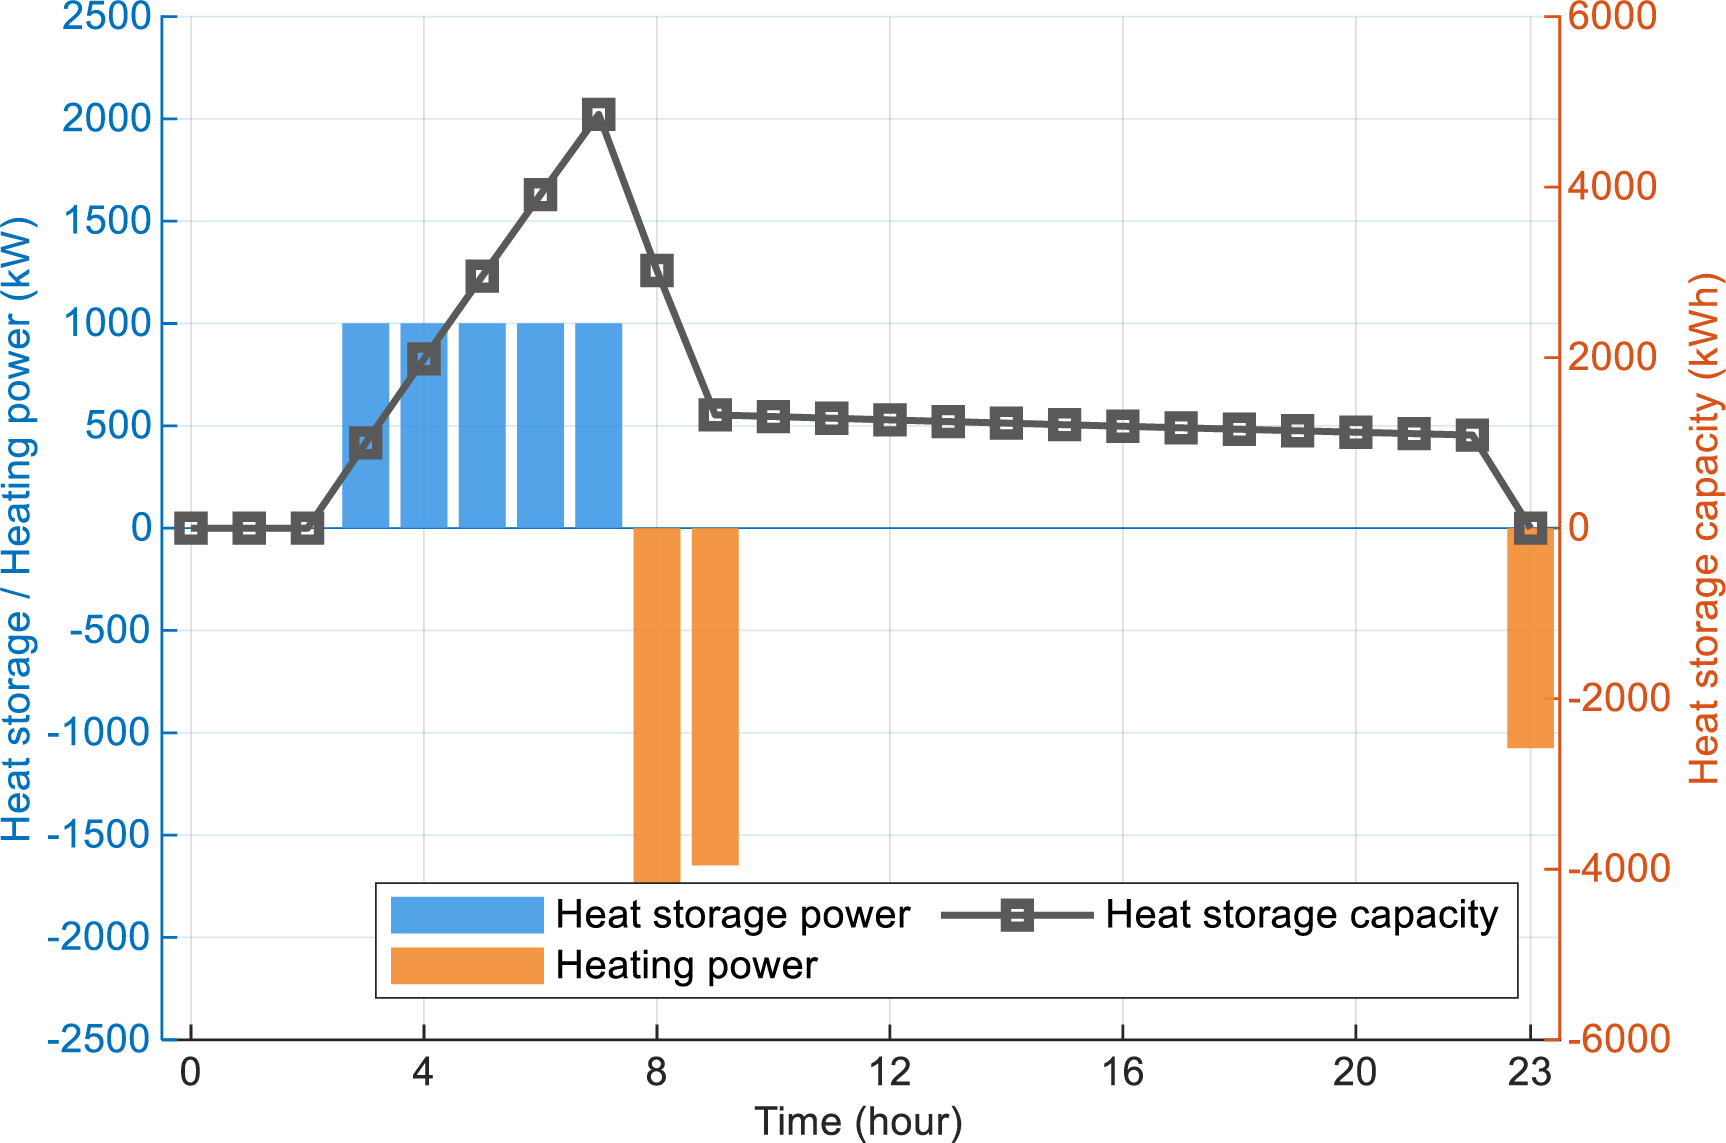
Figure 8: TSWT operation status (Scenario III)
The TSWT demonstrates a high-frequency, low-volume charging pattern during off-peak periods (
Fig. 9 shows the operational status of the EES device. Charging/discharging frequency of local EES reduced by 27.8% compared to Scenario II. This conservation strategy directly responded to carbon cost considerations, as energy losses during conversion processes contribute to indirect carbon emissions. State of charge maximum levels decreased by 18%, indicating deliberate capacity underutilization to minimize carbon cost. Charging occurred primarily during PV peak periods (
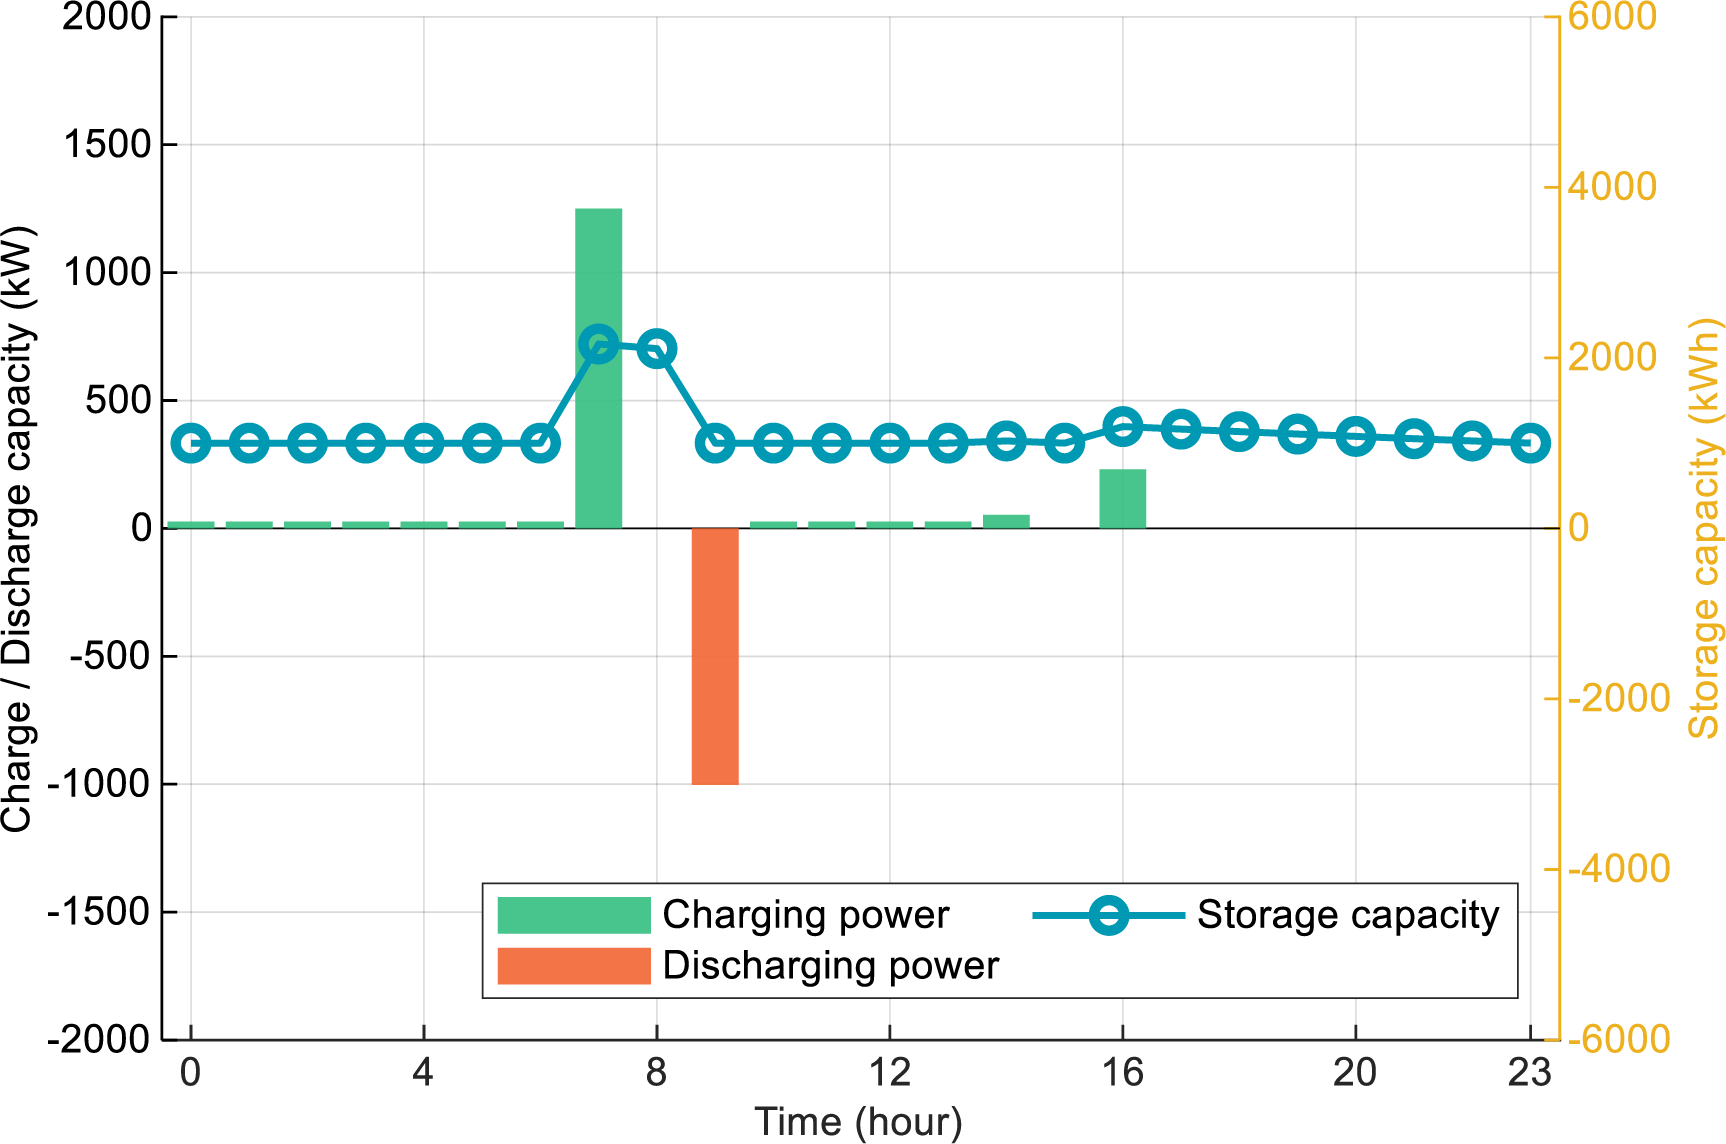
Figure 9: EES device operation status (Scenario III)
The calculated values for the round-trip efficiency [31] of the system across the Scenario I~III are presented in Table 3.
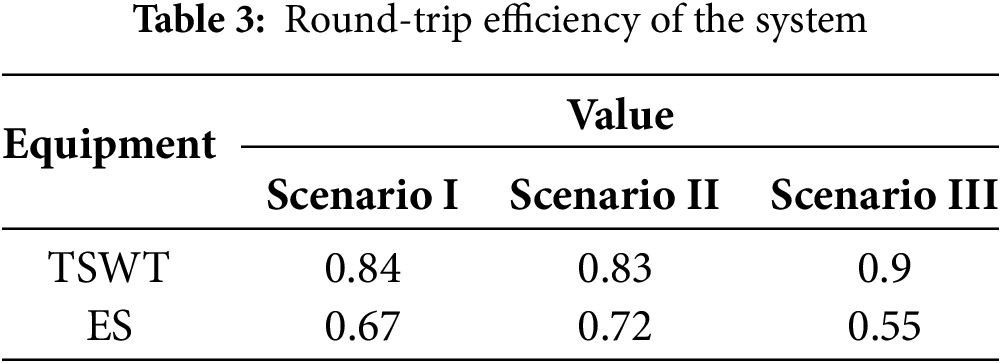
The TSWT demonstrates consistently high round-trip efficiency, with values ranging from 0.83 to 0.90. In contrast, the ES system exhibits a wider range of round-trip efficiency (0.55–0.72), indicating its higher sensitivity to operational parameters such as cycling rate and depth of discharge. The notably lower round-trip efficiency observed in Scenario III (0.55) suggests that excessive prioritization of environmental benefits may adversely affect equipment operating efficiency. Conversely, the highest efficiency occurs in Scenario II (0.72), indicating an operational profile that aligns more closely with the system’s optimal performance.
Fig. 10 shows the status of the SES system.
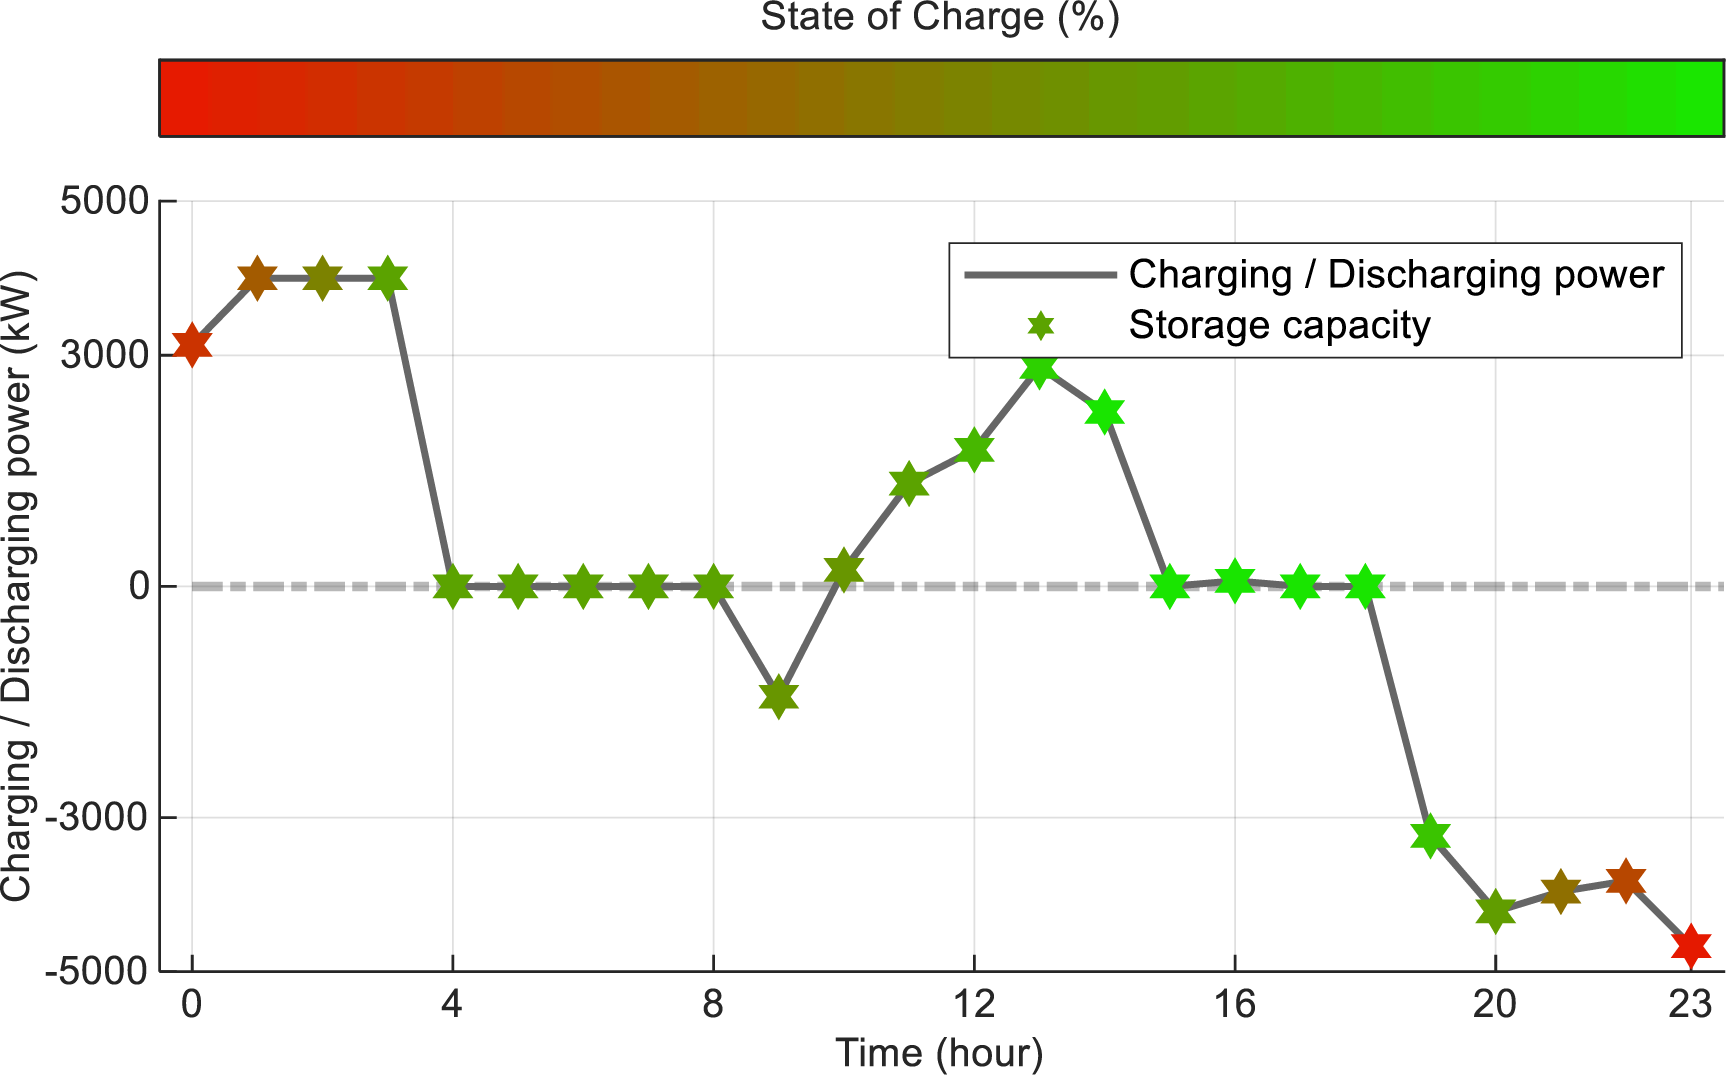
Figure 10: SES system operation status (Scenario III)
The SES system provided critical supplementation to local EES, exhibiting a 32% increase in charging activity during peak photovoltaic generation periods (
To comprehensively evaluate the robustness of the proposed electricity-carbon synergy optimization model against inherent uncertainties in multi-energy park operations, sensitivity analyses are systematically conducted across key parameters. This investigation assesses the model’s adaptability to fluctuations in electrical and thermal loads, PV power output, peak-valley electricity price spreads, and carbon trading prices. By varying these parameters within defined ranges, the impacts on critical performance indicators are quantified to validate the model’s reliability and practical applicability under dynamic real-world conditions.
4.3.1 Sensitivity Analysis on Electrical and Thermal Loads
The impacts on key performance indicators, including economic costs, carbon emissions, and energy storage behavior, are systematically presented in Tables 4 and 5. This analysis aims to demonstrate the model’s ability to maintain stable and predictable operation under significant load fluctuations.
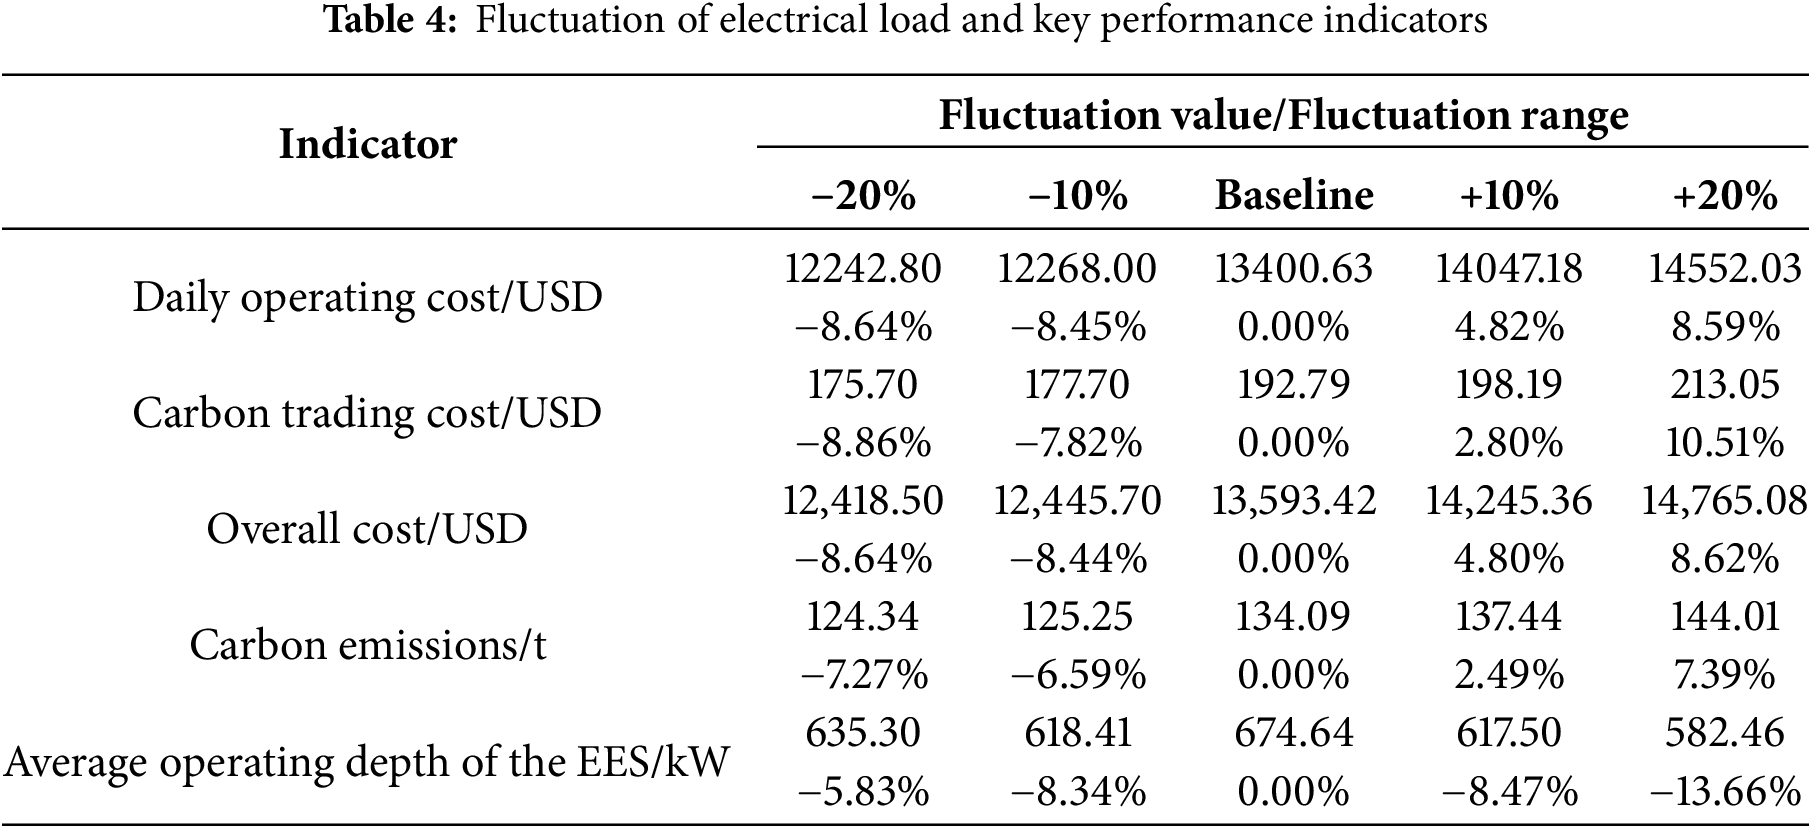
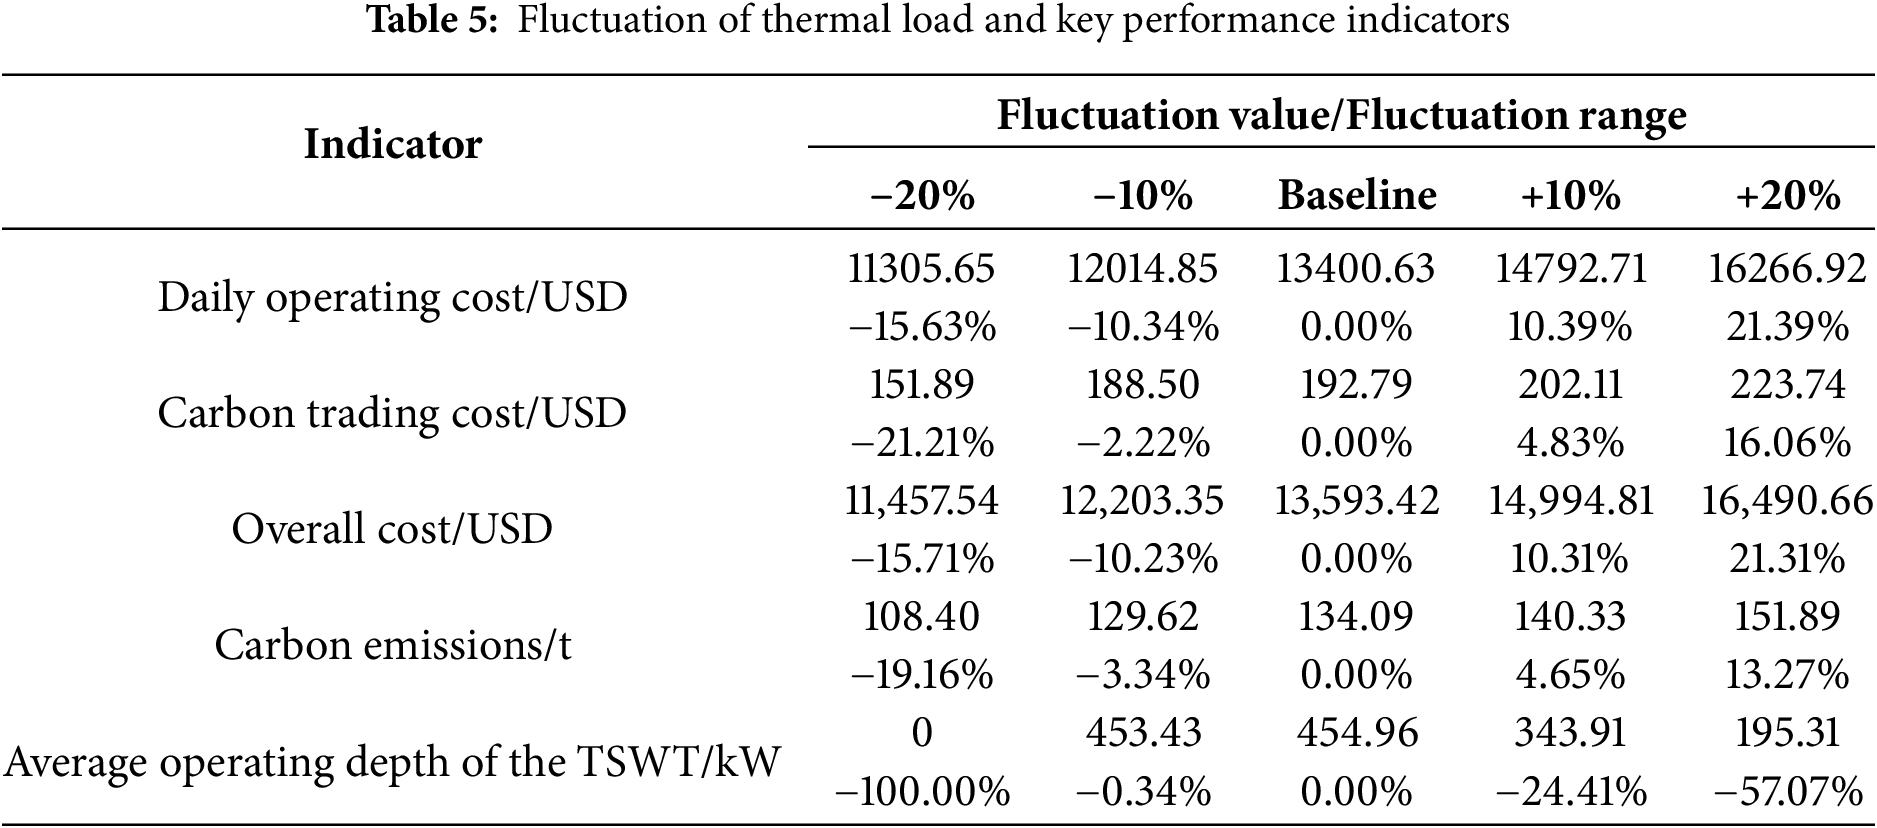
The total operational cost shows a positive correlation with variations in both electrical and thermal loads. A 20% increase in electrical load leads to an 8.62% rise in total cost, while a similar 20% increase in thermal load results in a more substantial 21.31% cost increase. This asymmetry reflects the different marginal costs associated with supplying electrical vs. thermal energy within the system. Notably, the carbon trading cost remains limited, contributing to less than 1.5% of the total cost across all scenarios, which underscores the effectiveness of the proposed carbon management mechanism in mitigating economic risks under uncertainty.
The system’s carbon emissions also exhibit a strong correlation with load variations, increasing as loads rise. For electrical load changes, emissions grow by 7.39% across the ±20% range, while thermal load variations produce a more pronounced 13.27% increase. The model’s response is consistent and without erratic nonlinearities, indicating a stable and environmentally predictable operation under load uncertainty.
Despite considerable perturbations in input loads, the model consistently generates stable, feasible, and economically viable scheduling solutions. Both cost and emission responses are smooth and predictable, without extreme nonlinearities or instability. Furthermore, the inclusion of electrical and thermal storage enhances the system’s resilience against uncertainty. These characteristics ensure the model’s practical applicability in real-world scenarios where load forecasting errors are inevitable.
4.3.2 Sensitivity Analysis on PV Power Output
The impacts on economic costs, carbon emissions, and average operating depth of the EES are summarized in the Table 6.
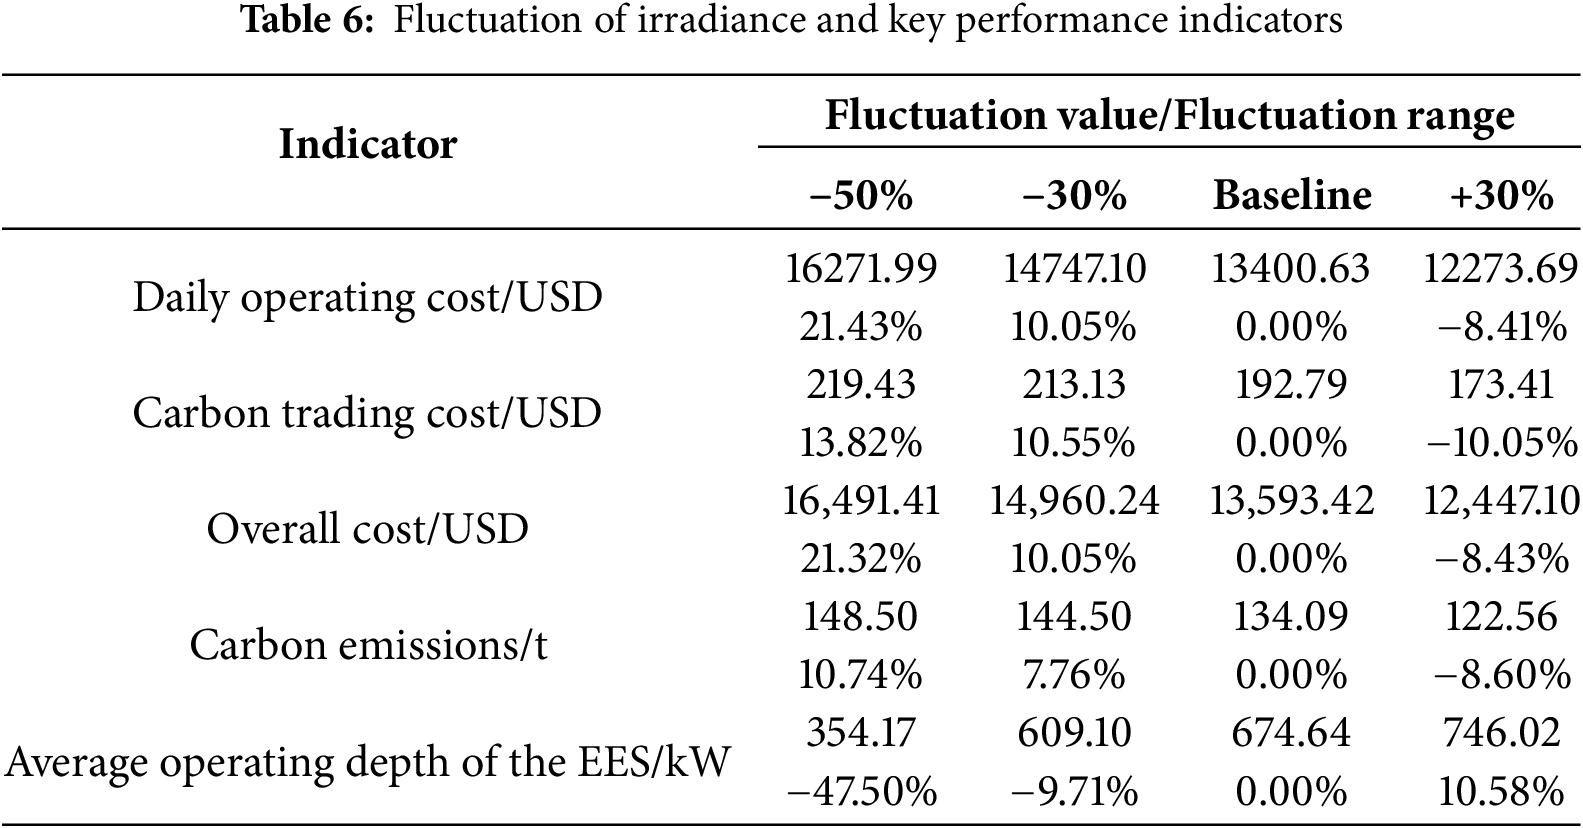
As irradiance decreases, both economic and environmental performance deteriorate predictably. A 50% reduction in PV output results in a 21.32% increase in total cost and a 10.74% rise in carbon emissions. Conversely, a 30% increase in PV power improves economic efficiency by reducing total cost by 10.05% and carbon emissions by 8.60%. The EES demonstrates adaptive responsiveness, with its average action depth rising from 354.17 to 746.02 as PV power rises, indicating greater utilization for energy shifting during periods of higher renewable generation.
The model exhibits stable and monotonic responses to PV variations without erratic fluctuations, highlighting strong robustness against renewable generation uncertainties. These results confirm the model’s practical applicability in real-world scenarios with intermittent renewable energy sources.
4.3.3 Sensitivity Analysis on Peak-Valley Electricity Price Spread
The peak-valley electricity price spread was adjusted by −20%, 0%, and +20% relative to the baseline scenario, with key results summarized in the Table 7.
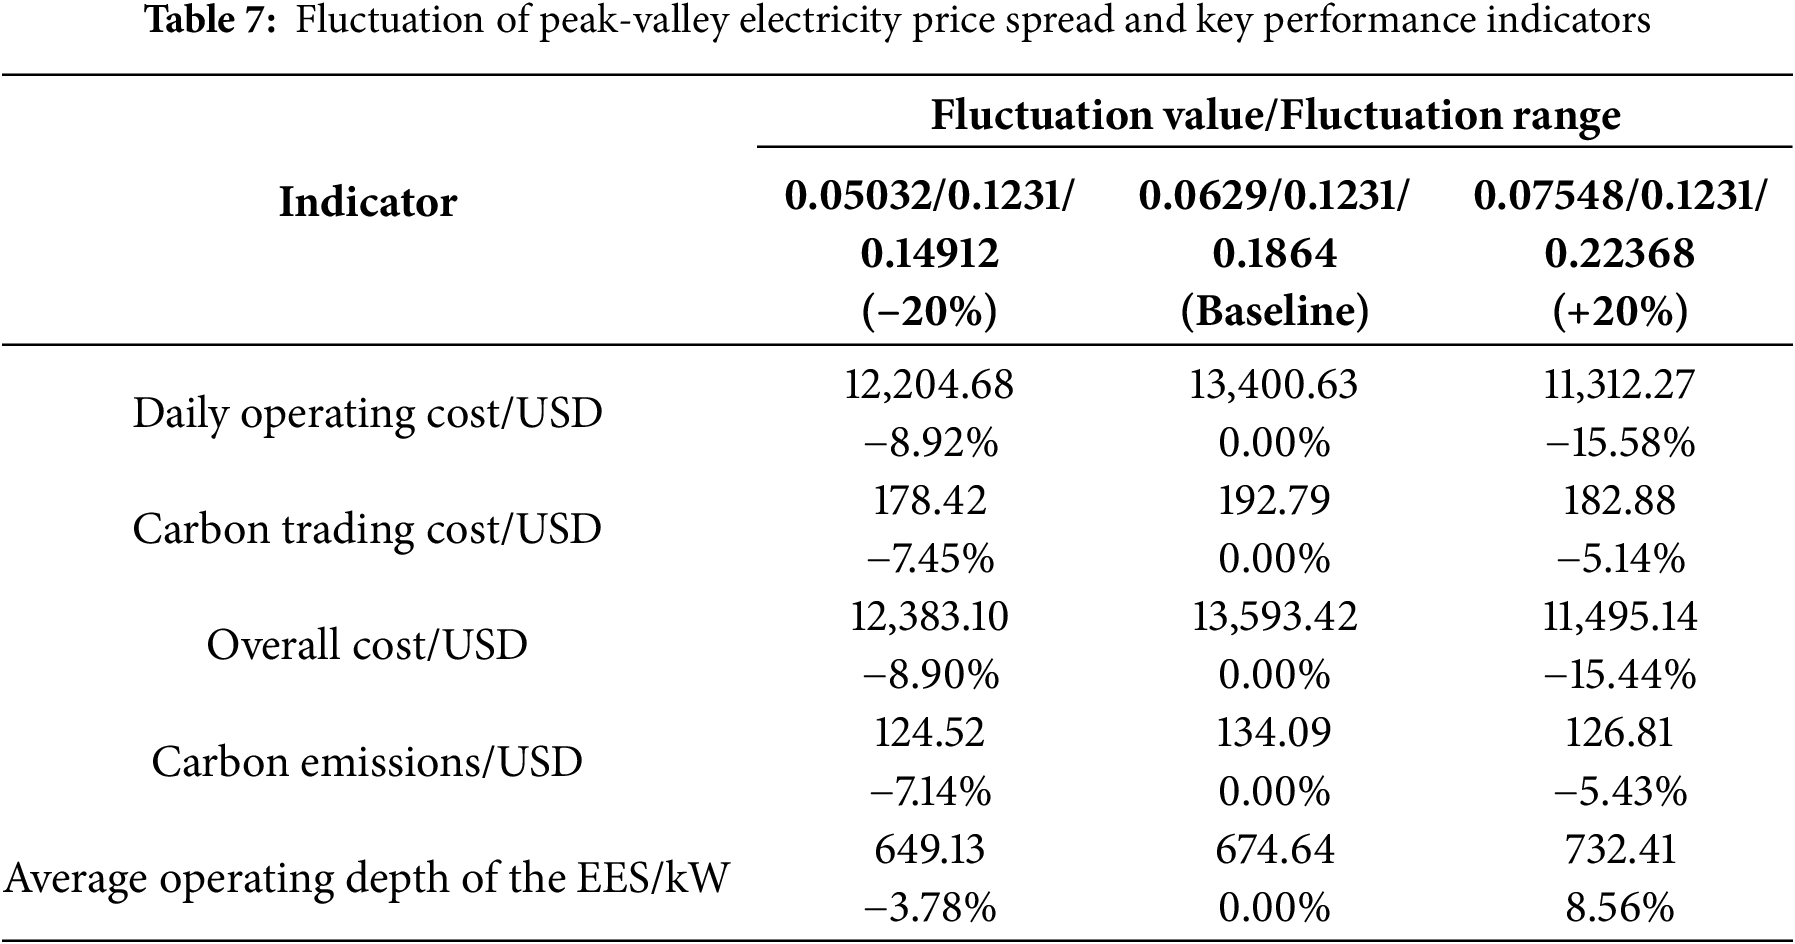
The results demonstrate that a larger peak-valley price spread enhances the system’s economic viability. As the price spread widened by 20%, the total cost decreased by 15.5%, primarily driven by a reduction in operational cost. This trend confirms that the model effectively leverages arbitrage opportunities through optimal EES scheduling. Consequently, the EES’s average action depth increased from 674.64 to 732.41, indicating more active and rational utilization of storage under larger price differentials. Carbon emissions also decreased from 134.09 to 126.81, suggesting improved operational efficiency. The carbon trading cost remains stable across all scenarios, never exceeding 192.79, which underscores the resilience of the emission management strategy to electricity market volatility.
The model exhibits consistent and adaptive performance under varying price spreads, demonstrating strong robustness and the capability to achieve economical and low-carbon operation through rational storage dispatch.
4.3.4 Sensitivity Analysis on Carbon Price Fluctuations
This analysis aims to contrast the performance of the proposed tiered carbon pricing mechanism against a fixed carbon price model (4.4 USD/ton) and simulate scenarios with carbon price fluctuations of −50%, 0%, +50%, +100%, and +200%, with key results summarized in the Table 8.
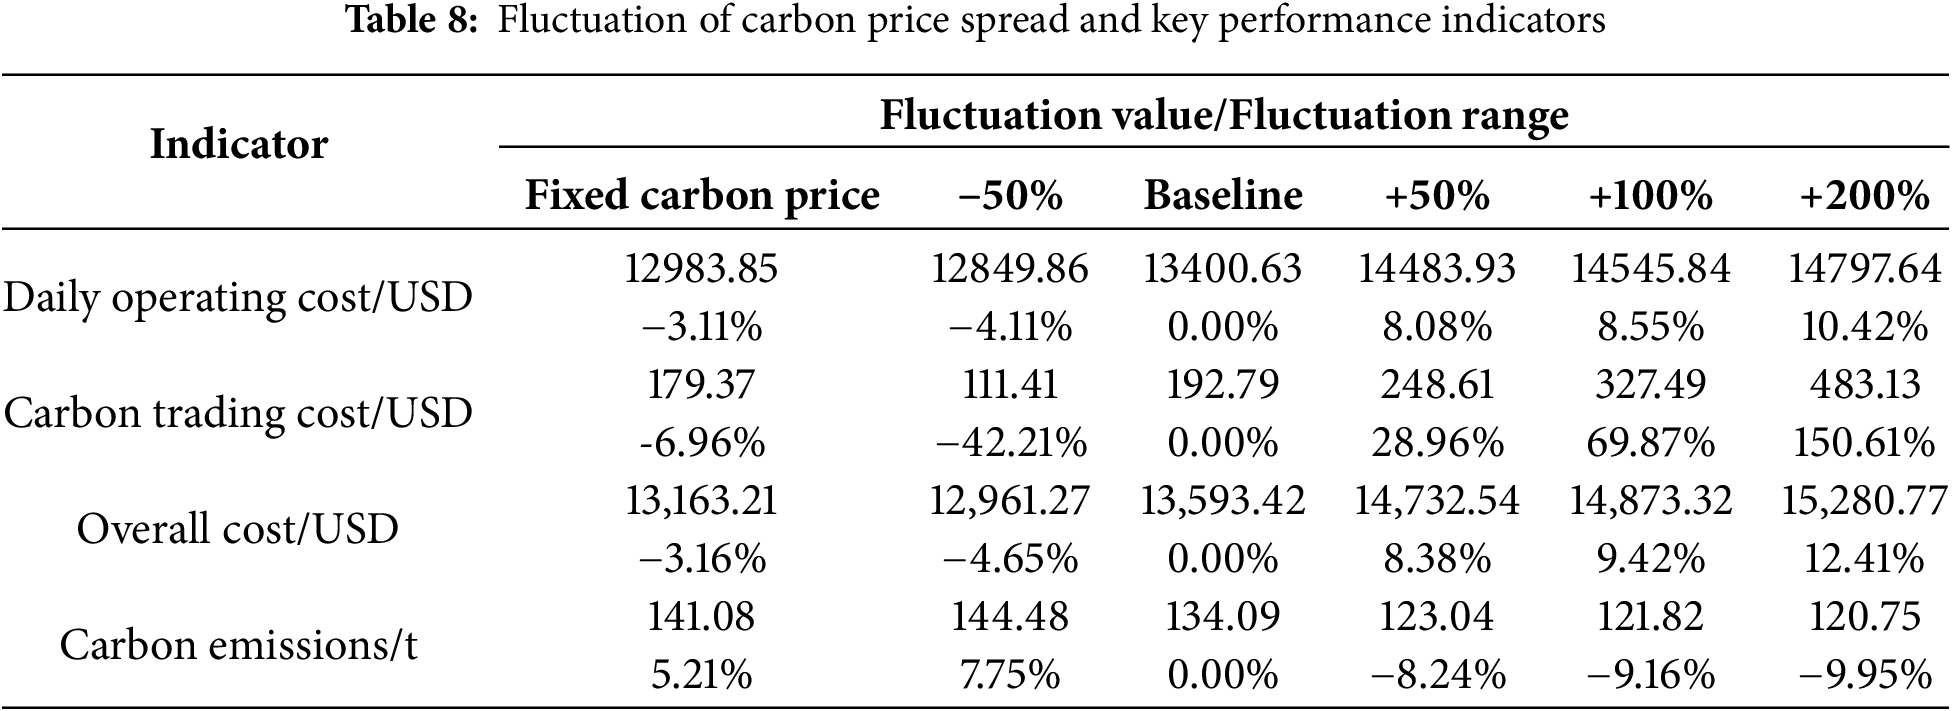
Firstly, the model demonstrates strong economic robustness. Although the total cost is positively correlated with the carbon price, the rate of increase is significantly mitigated. For instance, when the carbon price rises by +200%, the total cost increases by approximately 12.4% (from 13,163.21 to 14,783.32 USD) relative to the benchmark scenario. This rate of increase is substantially lower than the magnitude of the carbon price shock itself, reflecting the model’s ability to adapt its scheduling strategy through flexible energy management to cushion the impact of extreme carbon market volatility on overall operational economics.
Secondly, the tiered carbon pricing mechanism proves effective in curbing carbon emissions compared to a fixed-price model. Under the fixed carbon price, the system’s carbon emissions reach 141.08 tons. In contrast, the proposed mechanism drives emissions down to 134.09 tons even at the benchmark price. Its environmental advantage becomes more pronounced as the carbon price rises: emissions monotonically decrease to 123.04 tons (+50%), 121.82 tons (+100%), and finally to 120.75 tons (+200%). This consistent downward trend generates that the tiered mechanism creates a sustained and powerful economic incentive for low-carbon transition. Even when the carbon price is halved (−50%), the emissions (144.48 tons) remain significantly lower than those under the fixed-price model, demonstrating the mechanism’s structural advantage in emission reduction.
An electricity-carbon synergy-driven optimization method framework that achieves a balance among security, economic efficiency, and low-carbon objectives in multi-energy parks is proposed. The established mixed-integer programming model enables precise characterization of multi-energy conversion relationship for PV systems, GSHPs, TSEBs, CHP units, and energy storage devices. By designing a tiered carbon trading mechanism based on “energy type-carbon intensity-quota allocation” principles, carbon emission costs are effectively internalized into operational decisions. Multi-scenario validation demonstrates emission reductions of 42.64% compared to economy-oriented operation models, with operational costs constrained to a 20.85% increase. The carbon-prioritized scenario further achieves 9.7% emission abatement, confirming the suppressive effect of tiered carbon pricing on high-emission activities. Sensitivity analyses further reveal the method’s robustness against load fluctuations, renewable uncertainty, and carbon price volatility. The method provides both theoretical foundations and implementation pathways for multi-energy park low-carbon operation.
Future work will focus on five key enhancements: (1) Developing an integrated demand response mechanism that coordinates electricity-thermal-gas flexible loads; (2) Refining dynamic carbon quota allocation methods; (3) Establishing robust optimization frameworks to address uncertainties in renewable generation, load fluctuations, and carbon price volatility; (4) Extending the framework to prosumer parks with bidirectional grid exchange capability through integration of asymmetric pricing mechanisms; (5) Incorporating explicit security-oriented constraints (e.g., reserve margins, ramping reserves, and start-up trajectories) to ensure operational adequacy under contingencies. These advancements will strengthen the practical applicability of electricity-carbon synergy in large-scale industrial deployments.
Acknowledgement: Not applicable.
Funding Statement: This work is supported by Technology Project of State Grid Tianjin Electric Power Company (2024-06) “Research on hierarchical partition dynamic calculation and panoramic monitoring technology of electric power carbon emission and its application”.
Author Contributions: Study conception and design: Jiangyang Yuan, Jiaowen Wu, Hao Yu; Software: Jiangyang Yuan, Yi Gao; Validation: Yuhao Fu, Yuntao Bu, Tianyu Chen; Writing: Jiangyang Yuan; Funding acquisition: Hao Yu. All authors reviewed the results and approved the final version of the manuscript.
Availability of Data and Materials: The authors confirm that the data supporting the findings of this paper are available within the article.
Ethics Approval: Not applicable, this paper did not involve any human or animal subjects.
Conflicts of Interest: The authors declare no conflicts of interest to report regarding the present paper.
To ensure equitable comparison and balanced optimization between the disparate scales of operational cost (
The linear scaling normalization is mathematically defined as follows for each sub-objective function:
where:
Following the sensitivity analysis, a comprehensive stress test was conducted to further interrogate the robustness of the weight allocation in the combined objective function. Under the constraint
The stress test results corroborate and extend the initial sensitivity analysis conclusions, confirming a strong, non-linear trade-off between the two competing objectives:
Carbon Tax Cost (
The carbon trading cost (
The Total Cost (
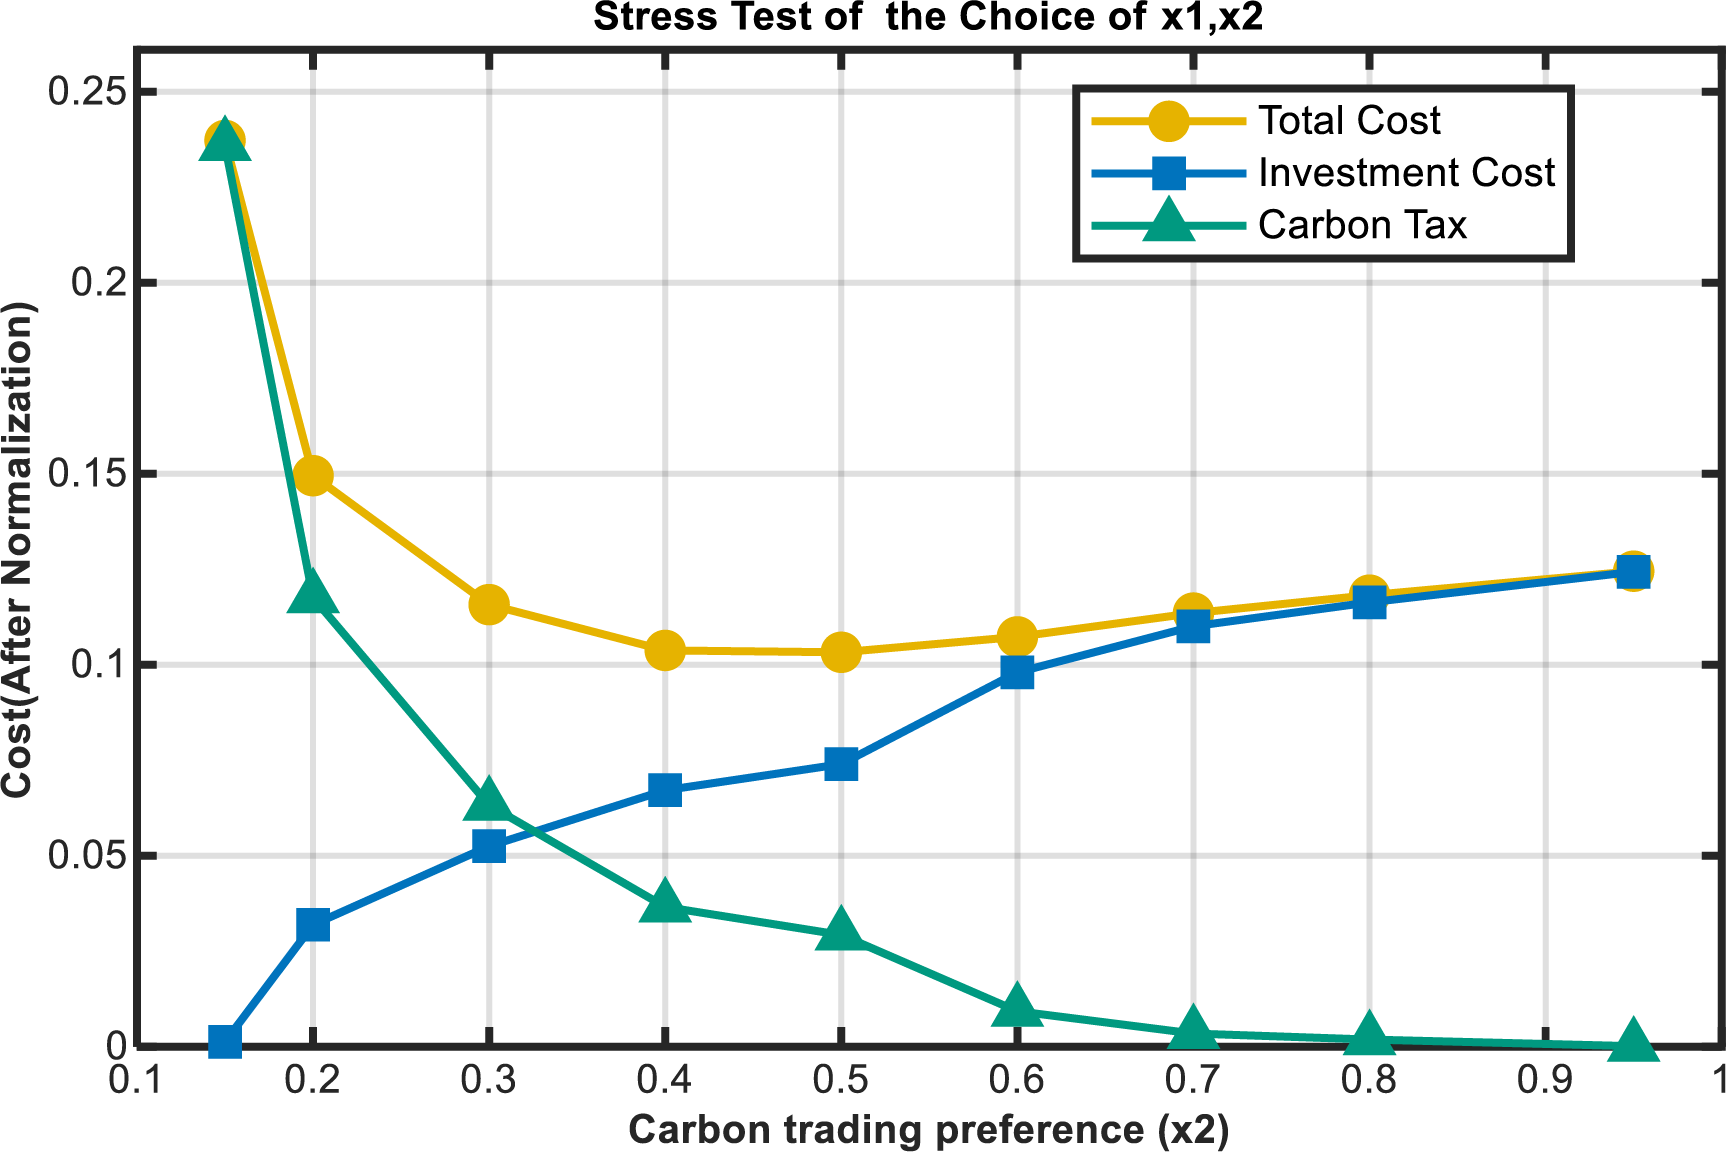
Figure A1: The results of this stress test
Appendix B

Appendix C
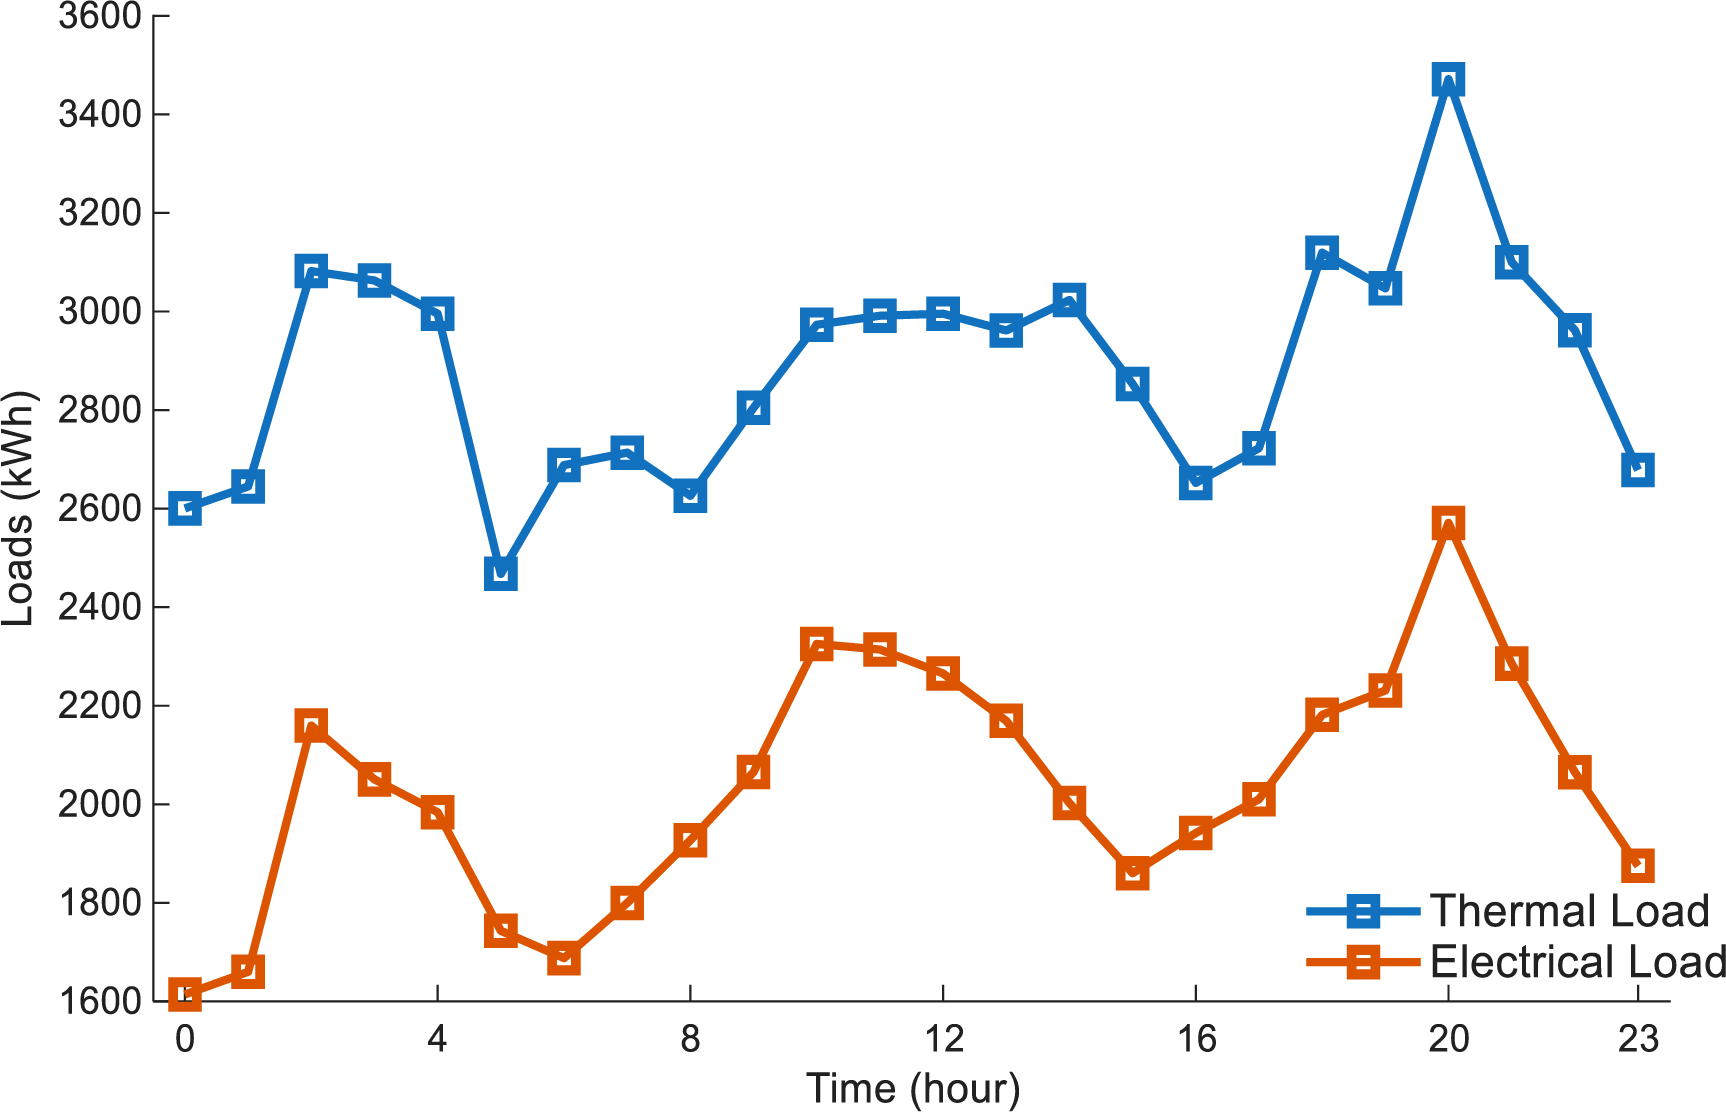
Figure A2: Electrical and thermal load parameters of the park
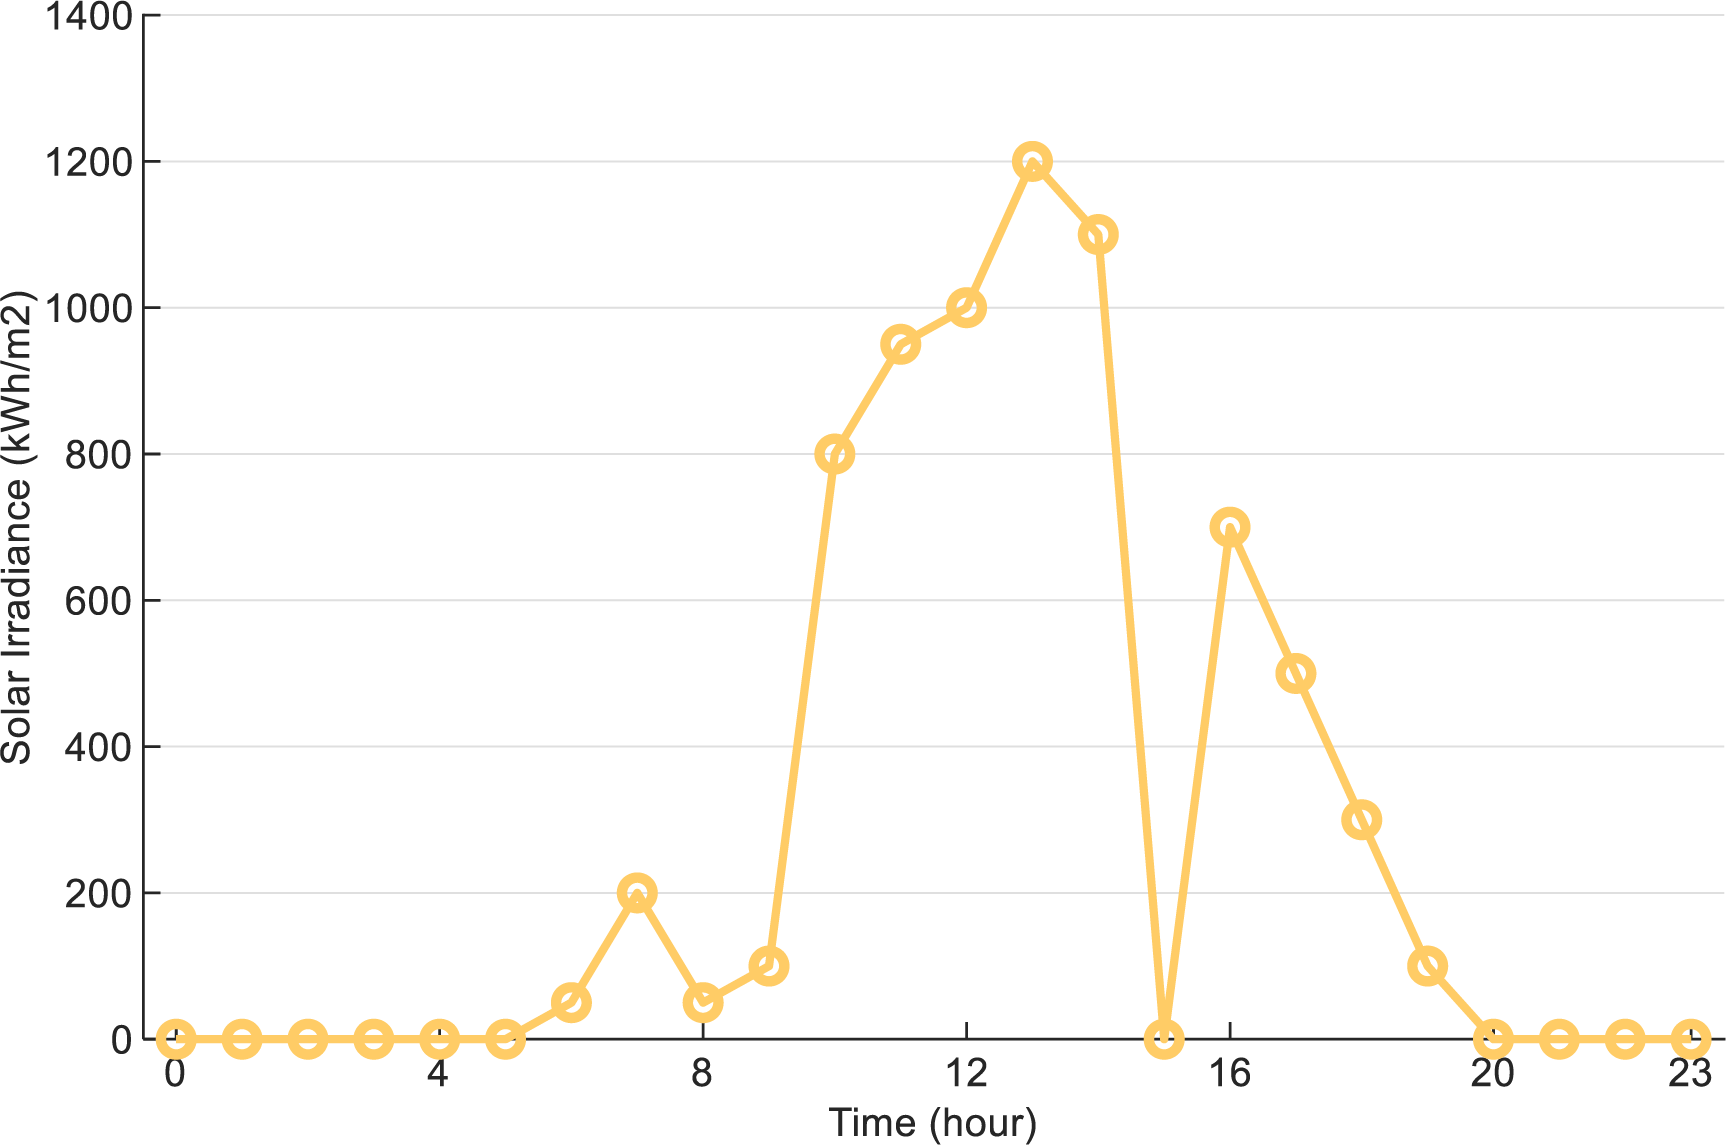
Figure A3: Forecasted solar irradiance parameters
References
1. IEA. CO2 emissions in 2023. Paris, France: IEA; 2024. p. 1–24. [Google Scholar]
2. Energy Institute. Statistical review of world energy 2023. London, UK: Energy Institute; 2023. p. 1–64. [Google Scholar]
3. Wang C, Lv C, Li P, Song G, Li S, Xu X, et al. Modeling and optimal operation of community integrated energy systems: a case study from China. Appl Energ. 2018;230(1):1242–54. doi:10.1016/j.apenergy.2018.09.042. [Google Scholar] [CrossRef]
4. Zhang L, Li Q, Fang Y, Yang Y, Ren H, Fan L, et al. Optimization scheduling of community integrated energy system considering integrated demand response. J Build Eng. 2024;98:111230. doi:10.1016/j.jobe.2024.111230. [Google Scholar] [CrossRef]
5. Zhang Y, Li L, Liu Z, Wu Y. Research on operation optimization of energy storage power station and integrated energy microgrid alliance based on stackelberg game. Energy Eng. 2024;121(5):1209–21. doi:10.32604/ee.2024.046141. [Google Scholar] [CrossRef]
6. Zhang D, Zhu H, Zhang H, Goh HH, Liu H, Wu T. Multi-objective optimization for smart integrated energy system considering demand responses and dynamic prices. IEEE T Smart Grid. 2021;3(2):1100–12. doi:10.1109/tsg.2021.3128547. [Google Scholar] [CrossRef]
7. Tian L, Zhu C, Deng T. Day-ahead scheduling of SMR integrated energy system considering heat-electric-cold demand coupling response characteristics. Energy Rep. 2022;8(2):13302–19. doi:10.1016/j.egyr.2022.10.005. [Google Scholar] [CrossRef]
8. Liao X, Ma J, Jiang Z, Zhou J. Many-objective optimization based mutual feed scheduling for energy system of integrated energy station. Appl Soft Comput. 2024;161(6):111803. doi:10.1016/j.asoc.2024.111803. [Google Scholar] [CrossRef]
9. Javanshir N, Syri S, Tervo S, Rosin A. Operation of district heat network in electricity and balancing markets with the power-to-heat sector coupling. Energy. 2023;266:126423. doi:10.1016/j.energy.2022.126423. [Google Scholar] [CrossRef]
10. Wang R, Wen X, Wang X, Fu Y, Zhang Y. Low carbon optimal operation of integrated energy system based on carbon capture technology, LCA carbon emissions and ladder-type carbon trading. Appl Energ. 2022;311(7):118664. doi:10.1016/j.apenergy.2022.118664. [Google Scholar] [CrossRef]
11. Chen L, Tang W, Wang Z, Lu Z, Fang X. Low-carbon oriented planning of shared photovoltaics and energy storage systems in distribution networks via carbon emission flow tracing. Int J Elec Power. 2024;160(1):110126. doi:10.1016/j.ijepes.2024.110126. [Google Scholar] [CrossRef]
12. Wu C, Chen X, Hua H, Kun Y, Lei G, Bo W. Optimal energy management for prosumers and power plants considering transmission congestion based on carbon emission flow. Appl Energ. 2025;377:124488. doi:10.1016/j.apenergy.2024.124488. [Google Scholar] [CrossRef]
13. Gao L, Fei F, Jia Y, Wen P, Zhao X, Shao H, et al. Optimal dispatching of integrated agricultural energy system considering ladder-type carbon trading mechanism and demand response. Int J Elec Power. 2024;156:109693. doi:10.1016/j.ijepes.2023.109693. [Google Scholar] [CrossRef]
14. Zhang M, Ge Y, Liu L, Zhou D. Impacts of carbon emission trading schemes on the development of renewable energy in China: spatial spillover and mediation paths. Sustain Prod Consump. 2022;32(9):306–17. doi:10.1016/j.spc.2022.04.021. [Google Scholar] [CrossRef]
15. Wang S, Zhao Q, Dong S, Li H. Optimal dispatch of integrated energy station considering carbon capture and hydrogen demand. Energy. 2023;269(1):126981. doi:10.1016/j.energy.2023.126981. [Google Scholar] [CrossRef]
16. Zhang J, Liu Z. Low carbon economic dispatching model for a virtual power plant connected to carbon capture system considering green certificates-carbon trading mechanism. Sustain Energy Techn. 2023;60:103575. doi:10.1016/j.seta.2023.103575. [Google Scholar] [CrossRef]
17. Wang L, Xian R, Jiao P, Chen J, Chen Y, Liu H. Multi-timescale optimization of integrated energy system with diversified utilization of hydrogen energy under the coupling of green certificate and carbon trading. Renew Energ. 2024;228(2):120597. doi:10.1016/j.renene.2024.120597. [Google Scholar] [CrossRef]
18. Kesavan PK, Karthikeyan A, Kumar M, Mandal S. A simple primary key algorithm based shade dispersion method for maximizing PV power generation under partial shading conditions. Chinese J Electr Eng. 2024;10(2):93–102. doi:10.23919/CJEE.2024.000067. [Google Scholar] [CrossRef]
19. Jia J, Li H, Wu D, Guo J, Jiang L, Fan Z. Multi-objective optimization study of regional integrated energy systems coupled with renewable energy, energy storage, and inter-station energy sharing. Renew Energ. 2024;225:120328. doi:10.1016/j.renene.2024.120328. [Google Scholar] [CrossRef]
20. Adebayo P, Fry N, Shor R, Mohamad A, Mwesigye A. Thermal analysis of a double U-loop vertical ground heat exchanger for a solar-assisted ground source heat pump. Therm Sci Eng Prog. 2025;64(1):103837. doi:10.1016/j.tsep.2025.103837. [Google Scholar] [CrossRef]
21. Talib A, Park S, Im P, Joe J. Grey-box and ANN-based building models for multistep-ahead prediction of indoor temperature to implement model predictive control. Eng Appl Artif Intel. 2023;126(1):107115. doi:10.1016/j.engappai.2023.107115. [Google Scholar] [CrossRef]
22. Liu B, Gao W, Li Q, Chen H, Zhang Y, Ding X. Quantification of thermal stratification and its impact on energy efficiency in solar hot water storage tanks. Energy. 2025;326(1–2):136243. doi:10.1016/j.energy.2025.136243. [Google Scholar] [CrossRef]
23. Zhang W, Hu B, Xie K, Shao C, Niu T, Yan J, et al. Short-term transmission maintenance scheduling considering network topology optimization. J Mod Power Syst Cle. 2022;10(4):883–93. doi:10.35833/MPCE.2020.000937. [Google Scholar] [CrossRef]
24. Wang H, Han J, Zhang J, Sun M, Sun Z, Hua P, et al. Heat-power peak shaving and wind power accommodation of combined heat and power plant with thermal energy storage and electric heat pump. Energ Convers Manag. 2023;297(5):117732. doi:10.1016/j.enconman.2023.117732. [Google Scholar] [CrossRef]
25. Yu J, Li T, Pan J. Optimizing hydrogen-integrated Micro-CHP systems with demand response for sustainable energy management. J Build Eng. 2025;99:111625. doi:10.1016/j.jobe.2024.111625. [Google Scholar] [CrossRef]
26. Guo W, Sun Z, Vilsen SB, Meng J, Stroe DI. Review of grey box lifetime modeling for lithium-ion battery: combining physics and data-driven methods. J Energy Storage. 2022;56:105992. doi:10.1016/j.est.2022.105992. [Google Scholar] [CrossRef]
27. Yang Y, Qiu J, Zhang C. Distribution network planning towards a low-carbon transition: a spatial-temporal carbon response method. IEEE T Sustain Energ. 2023;15(1):429–42. doi:10.1109/tste.2023.3294532. [Google Scholar] [CrossRef]
28. Ge W, Wang X. Editorial for the special issue on emerging technology and advanced application of energy storage in low-carbon power systems. Chinese J Electr Eng. 2024;10(4):141–51. doi:10.23919/CJEE.2024.000074. [Google Scholar] [CrossRef]
29. People’s Daily. Daily. China’s photovoltaic power generation capacity has exceeded 1 billion kilowatts, and the proportion of thermal power generation capacity has dropped to about 40% [Internet]. Beijing, China: People’s Daily; 2025 [cited 2025 Aug 21]. Available from: https://www.gov.cn/lianbo/bumen/202506/content_7029140.htm. [Google Scholar]
30. Zhang L, Liu D, Cai G, Lyu L, Koh LH, Wang T. An optimal dispatch model for virtual power plant that incorporates carbon trading and green certificate trading. Int J Elec Power. 2023;144(29):108558. doi:10.1016/j.ijepes.2022.108558. [Google Scholar] [CrossRef]
31. Zhang Y. Influence of capital cost input on optimized round-trip efficiency of pumped thermal electricity storage under finite time thermoeconomic optimization. J Energy Storage. 2024;103:114285. doi:10.1016/j.est.2024.114285. [Google Scholar] [CrossRef]
Cite This Article
 Copyright © 2026 The Author(s). Published by Tech Science Press.
This work is licensed under a Creative Commons Attribution 4.0 International License , which permits unrestricted use, distribution, and reproduction in any medium, provided the original work is properly cited.
 Downloads
 Citation Tools