
 Submit a Paper
 Propose a Special lssue
 Open Access
ARTICLE

Adaptability Analysis of Dual Clearing Systems in Spot Electricity Markets Based on Fuzzy Evaluation Metrics: An Inner Mongolia Case Study
1 NR Electric Co., Ltd., Nanjing, 210000, China
2 Inner Mongolia Power (Group) Co., Ltd., Inner Mongolia, 010000, China
3 Southeast University, Nanjing, 210000, China
* Corresponding Author: Jinran Wang. Email:
(This article belongs to the Special Issue: Grid Integration of Intermittent Renewable Energy Resources: Technologies, Policies, and Operational Strategies)
Energy Engineering 2026, 123(2), 15 https://doi.org/10.32604/ee.2025.070733
Received 22 July 2025; Accepted 11 September 2025; Issue published 27 January 2026
 View Full Text
 Download PDF
Abstract
The construction of spot electricity markets plays a pivotal role in power system reforms, where market clearing systems profoundly influence market efficiency and security. Current clearing systems predominantly adopt a single-system architecture, with research focusing primarily on accelerating solution algorithms through techniques such as high-efficiency parallel solvers and staggered decomposition of mixed-integer programming models. Notably absent are systematic studies evaluating the adaptability of primary-backup clearing systems in contingency scenarios—a critical gap given redundant systems’ expanding applications in operational environments. This paper proposes a comprehensive evaluation framework for analyzing dual-system adaptability, demonstrated through an in-depth case study of the Inner Mongolia power market. First, we establish the innovative “Dual-Active Heterogeneous” architecture that enables independent parallelized operation and fault-isolated redundancy. Subsequently, key performance indices are quantitatively evaluated across four critical dimensions: unit commitment decisions, generator output constraints, transmission section congestion patterns, and clearing price formation mechanisms. An integrated fuzzy evaluation methodology incorporating grey relational analysis is employed for objective indicator weighting, enabling systematic quantification of system superiority under specific grid operating states. Empirical results based on actual operational data from 200 generation units demonstrate the framework’s efficacy in guiding optimal system selection, with particularly strong performance observed during peak load periods. The proposed approach shows high generalization potential for other regional markets employing redundant clearing mechanisms—particularly those with increasing renewable penetration and associated uncertainty.Keywords
China’s electricity marketization in electricity marketization continues to deepen, with the construction and operation of electricity spot markets emerging as a critical breakthrough in the power sector restructuring. Ensuring long-term stable operation of the spot market system and the correctness and reasonableness of clearing results has become paramount, as it directly impacts grid security and stability and the economic interests of market participants. Based on synchronized operational data from the primary and backup dispatch systems, this paper adopts a comparative analysis approach to investigate the compatibility, consistency, and optimization pathways between the two systems, thereby providing insights for similar electricity markets in China.
The spot market’s clearing mechanism primarily follows a centralized unilateral architecture, and relies on centralized optimization computations. It achieves uniform system-wide clearing in a single iteration by aggregating bid data from all participants and leveraging the computational resources of the central dispatch system. For this single-optimization-engine architecture, academic research focuses on three critical areas: 1. Enhancements to centralized optimization algorithms: Techniques such as high-efficiency parallel solvers and staggered decomposition of mixed-integer programming models significantly improve the numerical stability and convergence speed of optimal power flow calculations [1,2]. 2. AI-driven clearing models: Deep learning and reinforcement learning are adopted to design novel clearing frameworks that accommodate bidding strategies under the high uncertainty of renewable energy integration [3]. 3. Dynamic pricing mechanism optimization: Refinements to system marginal price precision mitigate volatile nodal price fluctuations [4,5].
However, practical cases reveal that single-system architectures face multifaceted constraints and risks—such as relying on monolithic data sources and lacking heterogeneous redundancy. Most Chinese spot markets adopt single-system designs, even in provinces with primary-backup configurations, without mature failover mechanisms [6,7]. The prevailing single-system implementation relies on a singular data center node. Failures in critical communication infrastructure (e.g., fiber-ring network outages, front-end switch crashes) [8] can trigger full clearing-service disruptions, impacting provincial-scale market operations [9]. In extreme scenarios (e.g., data source failures, algorithmic flaws, or host system crashes), such architectures may lead to distorted clearing results or trading suspensions. While the EU’s dual-center model incorporates redundancy, it retains a serialized computational structure [10]. Hence, data anomalies at any stage may invalidate the entire settlement outcome—diverging sharply from China’s domestic dual-active/dual-data-source standards, which mandate Independent parallelized operation and fault-isolated redundancy [11]. Studies demonstrate that spot market price volatility stems from grid physical constraints (e.g., congestion) [12,13], unit operational states, and cross-market coupling effects, where reliability/accuracy significantly influences resource allocation efficiency [14].
Especially in wind-dominated electricity markets, the coexistence of regulated transactions (e.g., traditional thermal power generation) and deregulated transactions (e.g., wind power market-based trading) further amplifies the clearing risks of single systems. Studies on such markets indicate that wind energy intermittency requires simultaneous alignment with planned unit output adjustments and market-oriented electricity price signals. A single system may face heightened severe failure risks due to surging data processing loads. It may also fail to adapt to multi-transaction mode clearing logic (e.g., collaborative optimization of planned and market-based electricity). These issues can lead to deviations from actual supply-demand relationships, even triggering transaction disputes [15].
To address the inherent risks of single-system architectures in electricity markets—such as data source failures, algorithm errors, and system downtime—several academic studies have explored or proposed dual-system or primary-backup clearing architectures to enhance reliability and resilience. For instance, research on two-settlement systems, which integrate day-ahead (forward) and real-time (spot) market clearing mechanisms, highlights their role in mitigating network uncertainty and market power while ensuring operational reliability through redundant processes that correct infeasibilities in forward scheduling [16]. Similarly, two-settlement frameworks under network constraints are examined for their welfare and distributional properties, emphasizing how spot markets act as a backup to forward commitments to maintain system balance [17]. Other work introduces two-stage stochastic models for security-constrained market clearing, incorporating storage systems and wind power as network assets to provide reserves and reduce load shedding risks during contingencies, effectively serving as a dual-stage redundancy for reliability [18]. Reviews of electricity market resilience further discuss self-healing networks and bio-inspired designs that balance redundancy with efficiency in transmission systems, positioning them as backup architectures to enable autonomous recovery from disruptions [19]. Additionally, state-of-the-art analyses of resilient multi-microgrids incorporate backup mechanisms like battery storage and distributed energy resources for contingency management, with implicit dual clearing through bi-level optimization in energy trading [20]. However, these studies generally mention dual or backup systems without delving into comprehensive comparative evaluations of the switching processes between different clearing systems—such as transitions from forward to spot modes or stage shifts under varying uncertainties—and lack adaptability analyses, such as how these architectures dynamically adjust to real-time deviations or evolving risks.
To address this, Inner Mongolia implemented a backup dispatch spot system. Its design decouples computation engines, algorithms, and data sources between primary and backup systems, yet requires consistency verification before final clearing—a fault-tolerant approach inspired by multi-center settlement in financial trading systems. However, given power system complexities (e.g., generator-coordination, grid constraint propagation, and regional price coupling), its applicability demands further validation.
This paper proposes a comprehensive framework for analyzing the Inner Mongolia spot market clearing system. First, we outline the operational context of the primary-backup systems. Next, we deconstruct key factors influencing clearing results and propose an analytical framework. Critical grid states and clearing prices are then modeled, followed by statistical methods to locate atypical clearing data. Our approach demonstrates scientific rigor and offers actionable insights for backup system planning in electricity markets.
2 Framework for Primary-Backup System Switching of Inner Mongolia Spot Clearing
The stable operation and correct clearing of the electricity spot market are critical for grid security and market participant interests. Most provincial electricity spot markets in China rely on a “single infrastructure + homogeneous backup” model, which creates a single point of failure in both data and calculation [21]. They also lack real-time validation mechanisms. Even with primary-backup systems, switchover protocols are immature. Traditional approaches, derived from scheduling automation, require simultaneous failover of all modules at both centers, forcing a full-scale switch even for isolated spot system faults. These deficiencies in validation, data redundancy, and fault response threaten system reliability [22]. To address this, Inner Mongolia Power Grid proposes an innovative Dual-Active Heterogeneous and Cross-Mutual Backup architecture.
As shown in Fig. 1, the backup spot system incorporates a Data Source Management Module that simultaneously ingests data from the primary dispatch business system, backup dispatch business system, and trading center. Under normal conditions, the backup system selects the same data source as the primary dispatch system. When a single data source fails, it seamlessly switches to an alternative source, ensuring uninterrupted data continuity and achieving cross-mutual redundancy at the data source layer. Furthermore, through real-time synchronization between primary and backup systems and transformation of heterogeneous model data, the market model parameters, which are manually modified and used by both the primary and backup dispatch systems, are kept consistent. To verify which system is more suitable, a Flexible Primary-Backup Switchover mechanism has been developed, allowing the spot system to either switch collectively with the dispatch automation system or operate independently. Consequently, failures in a single spot system can be mitigated by switching to the alternative spot system without disrupting the dispatch automation system. During normal operations, the system with superior clearing outcomes can be designated as primary. This granular switching approach enhances operational flexibility and responsiveness.
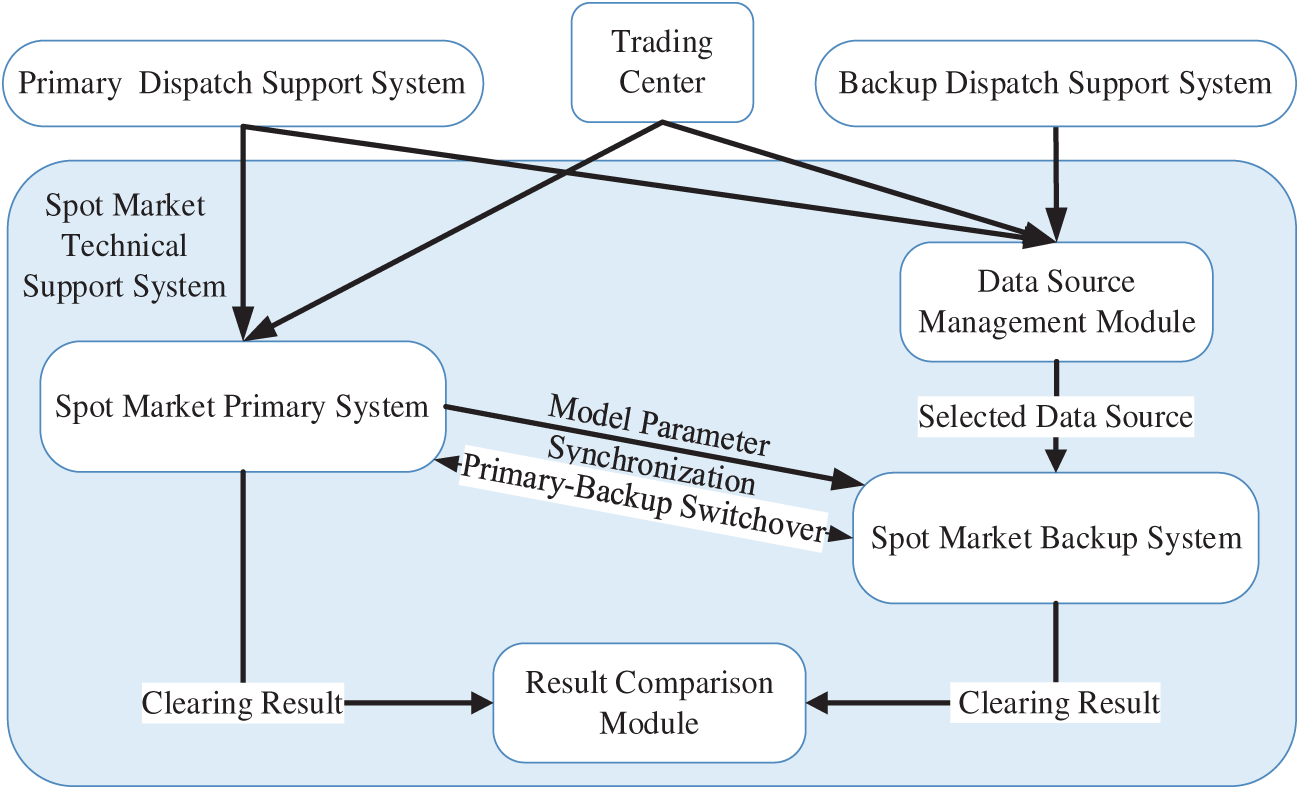
Figure 1: Spot market system architecture schematic diagram
The verification methodology for the clearing system’s advantages will be elaborated in subsequent sections.
3 Comprehensive Analysis Framework for Electricity Spot Market
The electricity trading volume and transaction price of market entities are the most valuable information in the output results of spot market clearing calculations. The clearing of electricity markets requires solving security-constrained unit commitment (SCUC) [23] and security-constrained economic dispatch (SCED) [24] models to ensure that the power grid achieves a globally optimal generation resource allocation under various physical constraints and operational boundaries.
However, when various complex situations occur simultaneously, some atypical scenarios may arise, and the analysis and interpretation of market clearing results based solely on the quantity and price information declared by market entities will become inaccurate. The operating states and physical constraints of equipment such as generating units and transmission sections serve as important constraints for market clearing and also constitute key information of concern to power grid dispatching and market operating institutions. Thus, the paper centers the analysis of market results on two aspects: the critical states of power grid operation and market clearing prices, and puts forward a framework for analyzing the clearing results of electricity spot markets as shown in Fig. 2.
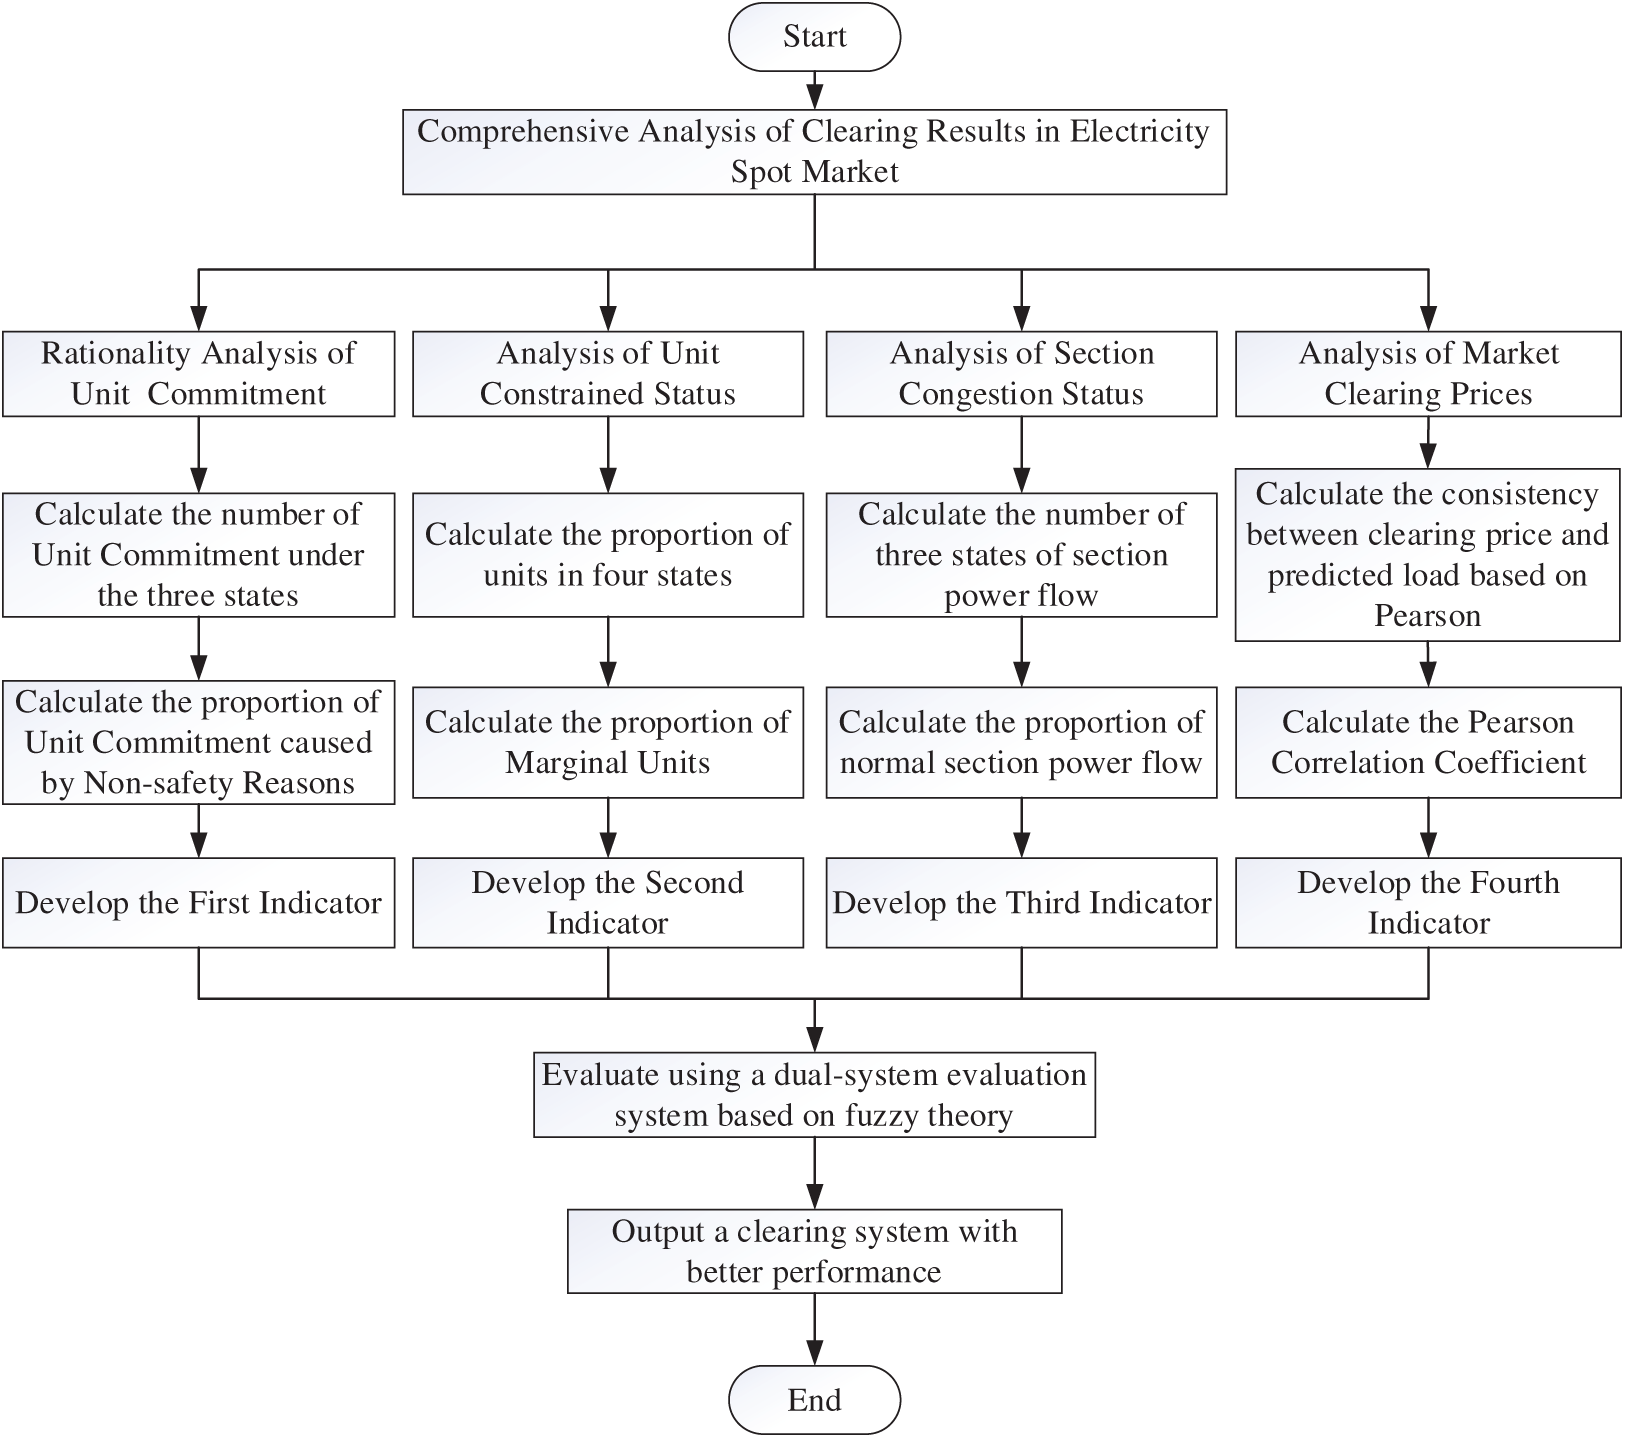
Figure 2: Analysis framework of electricity spot market clearing results
Regarding the critical operating states of power grid, the analysis mainly covers three aspects: the commitment of generating units, the constraints on their maximum and minimum technical output as well as ramping capacity, and the situations where transmission section security constraints meet or exceed limits. Initially, atypical states are screened out based on operational experience. The unit commitment is influenced by three factors: load demand, the inherent characteristics of units, and network security constraints. The constrained state of units shall be considered from four aspects: Output boundary limitation, Start-stop state limitation, Regulation capacity limitation, and Market response limitation. For the section power flow state, three aspects need to be considered, namely section coupling cause, start-up dispatching cause, and economic dispatching cause. The results of power grid operation state analysis not only serve as an important reference for explaining market winning results, but also form the basis for further market price analysis.
Regarding the analysis of market clearing prices, we first use statistical methods to analyze typical historical operation information to derive the correlation between day-ahead price trends and electricity demand. The Pearson algorithm is utilized on the market clearing price to form the fourth indicator. By analyzing the key operating states of the power grid and market clearing prices, four indicators are derived. These indicators are then evaluated using a dual-system evaluation framework based on fuzzy theory to determine the optimal clearing system.
4 Modeling of System Key States and Clearing Prices
4.1 Analysis of Critical States of Power Grid Operation
4.1.1 Analysis of Unit Commitment Reasons
The start-up and shutdown of generation units are crucial scheduling operations in power systems. These decisions are made based on factors such as load demand, the inherent characteristics of the units, and network security constraints. Such operations are categorized into two scenarios: those without network security constraints and those where network security constraints are present.
In scenarios without network security constraints, unit commitment is determined by market supply, demand, and economic efficiency, with the goal of minimizing total power generation costs. Therefore, in the start-up sequence, units with lower start-up costs and more competitive bidding prices are prioritized for operation. In scenarios with network security constraints, unit commitment focuses on ensuring the safety and stability of the power grid. This may involve shutting down units at the sending end and starting units at the receiving end to alleviate transmission section overloads, while also coordinating with grid topology adjustments to guarantee reliable power supply. In such cases, decisions prioritize meeting security constraints, which may entail sacrificing local economic efficiency—for example, activating higher-cost units while shutting down lower-cost ones.
The differences in unit commitment outcomes between the two scenarios stem from the role of security constraints, while the commonalities are influenced by both economic factors and fundamental equipment limitations. This principle helps explain both typical and atypical commitment phenomena.
4.1.2 Analysis of Unit Constrained States
In power system scheduling optimization, the operational constraints of generation units can be categorized into four types based on their sources and characteristics. Firstly, output boundary constraints arise from technical limitations, preventing units from exceeding their maximum or minimum technical output limits. Secondly, start-up/shutdown state constraints are governed by operational rules such as minimum duration requirements or insufficient grid synchronization time, forcing units to maintain their current status. Thirdly, adjustment capacity constraints stem from dynamic performance limitations, including restricted ramp rates and reactive power adjustment ranges, which impede rapid response to load changes. Finally, market response constraints result from network security protocols and market mechanisms, leading to economically suboptimal operations where inefficient units may be forced to operate while efficient units remain underutilized.
Analysis of unit constrained states contributes to both market operation effectiveness and system dispatching scientificity. On the one hand, by clarifying technical output limits and start-up/shutdown rules, it provides accurate parameters for market clearing and improves resource allocation efficiency. It also helps distinguish between safety and economic influences, explains atypical market outcomes, enhances clearing transparency, and supports the optimization and supervision of market rules. On the other hand, quantifying load response limitations enables better reserve capacity configuration to reduce operational risks. Moreover, refined cost accounting reduces non-essential losses, while the actual implementation rate of power plans is increased.
To determine whether a unit is in a constrained state, an indirect method can be employed based on the shadow prices of unit-related constraints.
The original problem of unit operation optimization is as follows [25]:
Objective Function:
General Constraints:
where
According to the complementary slackness condition, the activation status of constraints in the primal problem can affect the value of shadow prices [26].
where
4.1.3 Analysis of Causes for Section Congestion
Analyzing the causes of transmission congestion helps establish connections between the physical constraints of the power grid and market clearing outcomes. Such analysis not only clarifies the electricity price formation mechanism but also directly supports grid security control and market operation optimization, serving as an essential step toward improving the efficiency and transparency of spot market operations.
Section power flow is co-determined by generator outputs and nodal loads. The first step involves examining potential abnormalities in nodal load data. If a section remains overloaded even after utilizing the maximum adjustment capacity of all operational units, abnormal load data may be indicated. If loads are normal, the focus shifts to the constraint status of units whose output adjustments influence the section power flow. Based on unit constraints, this paper categorizes transmission congestion causes into three types: section coupling, caused by mutual power flow influences among sections where one section’s security limit restricts unit outputs; start-up scheduling, where units cannot flexibly adjust output due to dispatch instructions such as reserve requirements, maintenance plans, or peak-shaving operations; and economic dispatch, where units are limited by generation bounds or economic scheduling plans.
4.2 Analysis of Spot Market Clearing Price
The user-side weighted average price, as a core indicator for settlement and price signal transmission in the electricity spot market, has a formation mechanism directly related to the interest distribution of market participants and the rationality of market operation. Essentially, this price is the result of aggregating locational marginal prices across the entire network by load weight, reflecting both the energy value of electricity commodities and the congestion costs caused by grid security constraints. It is a product of the combined effects of market supply-demand relationships and grid physical characteristics.
Specifically, the mathematical expression of the user-side weighted average price (P) [27] is:
where
Here,
Substituting the expression of locational marginal price into the formula for the user-side weighted average price, a clearer composition analysis can be obtained:
This formula intuitively demonstrates the dual attributes of the weighted average price: the first term
The trend of clearing prices should closely follow the trend of load forecast. The higher the consistency between them, the better the clearing effect will be. This is because reasonable clearing prices should reflect changes in load demand, thereby accurately representing the supply-demand relationship in the market and the actual operating conditions of the power grid. In this way, they can provide accurate price signals for market participants, guiding them in making reasonable generation and consumption plans and ensuring the stable and economic operation of the power system.
In electricity spot market operations, ensuring the accuracy and rationality of market clearing results is crucial, as these outcomes directly affects grid stability and the economic interests of market participants. For electricity retailers, effectively assessing deviation risks is essential for successful market engagement and operational sustainability. This section focuses on establishing an evaluation index system and a corresponding model to assess the deviation assessment risks of electricity retailers, combining grey relational analysis and fuzzy comprehensive evaluation methods to quantitatively measure risk levels, providing a scientific basis for retailers to optimize risk management strategies. It should be noted that this study is conducted based on the following core assumptions: (1) The boundary data used by the two systems are not affected by differences in data collection or manual maintenance, meaning the grid models, measured values of various measurements (using state estimation results), initial calculation values, and stability constraints, among others, are identical. (2) Both systems perform clearing calculations at 15-min intervals, generating 96 data points per day. (3) The grid topology and stability constraints remain unchanged on the calculation day, meaning the extracted calculation results possess universal applicability.
Based on the characteristics of power system operation and market mechanisms, the following evaluation factors are selected to construct a comprehensive evaluation system for deviation assessment risks:
Unit commitment: Reflects the start-up/shut down state and output plan of generating units, which is crucial for ensuring the reliability of power supply and the economic operation of the power grid. Its data is characterized by the proportion of unit start-up/shut-down numbers caused by non-security reasons (e.g., economic dispatch) in the total start-up/shut-down units.
Output limit: Constrains the maximum and minimum output of generating units, ensuring operation within safe and feasible ranges. It is quantified by the daily average proportion (in percentage) of marginal units, reflecting the efficiency of unit output allocation.
Section limit: Reflects transmission capacity constraints of key grid sections, critical for grid security and stability. It is represented by the percentage of units operating within in-limit section constraints, indicating the effectiveness of section security control.
Clearing price: Serves as the core result of market transactions, directly reflecting supply-demand relationships and price formation mechanisms. It is measured by the average percentage of Pearson correlation coefficients between price and load trend consistency across multiple cases, indicating the rationality of price signals.
These factors cover key aspects of power system operation and market transactions, and can comprehensively reflect the deviation assessment risk level of electricity retailers.
Grey relational analysis is used to quantify the weights of each evaluation factor. By applying grey system theory and relevant mathematical formulas, the weights of various influencing factors are obtained, avoiding the interference of subjective experience on weight determination, which is a relatively reasonable weight assignment method [28].
5.2.1 Determine the Decision Matrix and Reference Sequence
Take the data of each evaluation factor as the decision matrix
Select the deviation risk level as the reference sequence
5.2.2 Dimensionless Processing
Standardize the decision matrix to eliminate dimension differences. The standardization formula is [29]:
5.2.3 Calculate the Relational Coefficient
Calculate the relational coefficient between each evaluation factor and the reference sequence to reflect the degree of correlation with deviation risks:
where ρ is the distinguishing coefficient, usually taking 0.5.
5.2.4 Determine the Relational Degree and Weight
The relational degree of each evaluation factor is calculated through the relational coefficient using the formula:
where
Normalize to obtain the weight:
where
5.3 Fuzzy Comprehensive Evaluation
The fuzzy comprehensive evaluation method is utilized to handle the fuzziness and uncertainty inherent in the evaluation factors, with the following steps [30]:
5.3.1 Define the Factor Set and Comment Set
Take the evaluation factors as the factor set
Grade I (no risk): The deviation rate is lower than 5%.
Grade II (low risk): The deviation rate is between 5% and 10%.
Grade III (medium risk): The deviation rate is between 10% and 15%.
Grade IV (higher risk): The deviation rate is between 15% and 20%.
Grade V (high risk): The deviation rate is higher than 20%.
5.3.2 Adopt Membership Function and Calculate Membership Degree
Use the normal distribution membership function to compute the membership degree of each evaluation factor to each risk level:
where
5.3.3 Calculate the Fuzzy Comprehensive Evaluation Vector
Perform a linear transformation on the evaluation matrix composed of grey weights and membership degrees to obtain the fuzzy comprehensive evaluation vector:
Where B is the fuzzy comprehensive evaluation vector, W is the weight set, and R is the membership degree matrix.
5.3.4 Apply the Maximum Membership Degree Principle
Determine the deviation risk level of the electricity retailer based on the maximum membership degree principle:
This section takes the operational data from Inner Mongolia as an example, covering 200 power generation units, including 100 thermal power units, 60 wind power units, and 40 photovoltaic units. Among them, renewable energy units are not included in the start-up and shutdown statistics due to their marginal cost approaching zero and fast regulation rate. The section constraint analysis focuses on 80 key units, with a statistical cycle of 24 h a day (at an hourly resolution). The data is sourced from https://dianchacha.cn/ and https://www.impc.com.cn/.
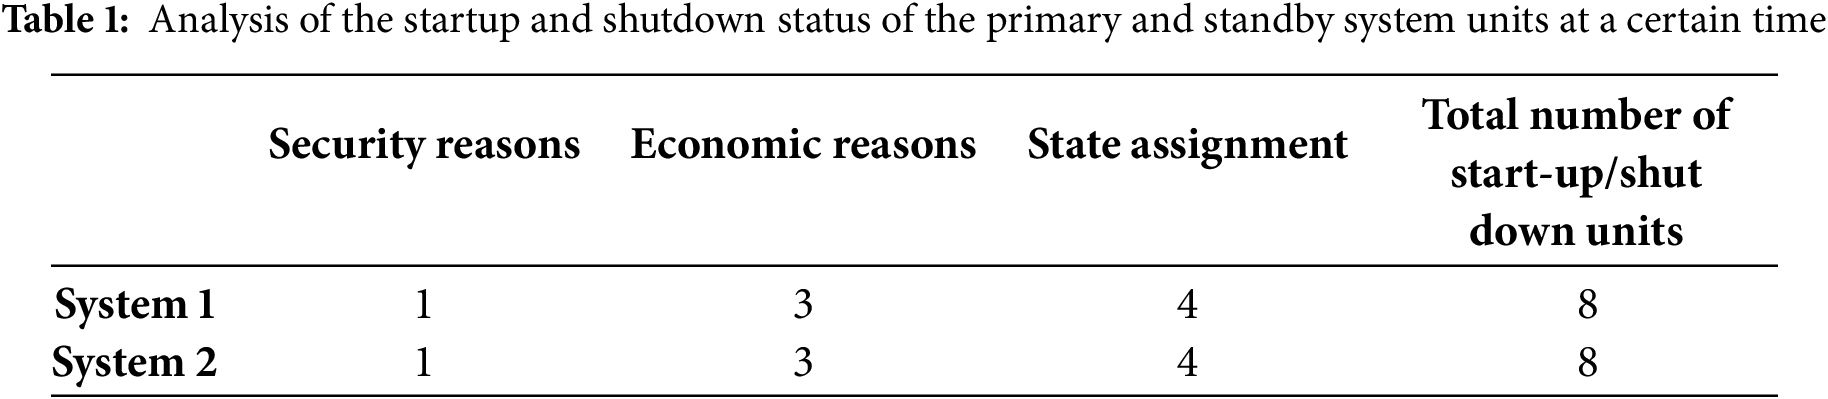
This section analyzes the daily start-up/shutdown (SU/SD) status of 200 generation units (including both thermal and renewable energy units) in the Inner Mongolia under spot market conditions. Among these, only eight thermal power units underwent SU/SD operations—renewable units were excluded due to their negligible marginal cost (near-zero) and fast regulation rates (hence not statistically counted for SU/SD).
As shown in the Table 1, both systems exhibit identical total SU/SD unit counts, with equal numbers of units dispatched for security constraints (e.g., maintenance) or economic reasons. Specifically: 1. Must-run/must-off units: A subset of units were forced online/offline due to operational constraints (e.g., maintenance, grid safety). 2. Economic dispatch: The majority of remaining units were committed/decommitted based on cost priorities (e.g., lower-cost units brought online, higher-cost units shut down), aligning with the market clearance logic of least-cost bidding. Conclusion: From a unit commitment (UC) perspective, the two systems demonstrate identical SU/SD results, satisfying the seamless switching condition for interoperability.
Inner Mongolia’s total generating fleet comprises 200 units, with thermal units accounting for 100. We compared the operating statuses of all thermal units under System 1 and System 2 implementations over a single day. Comparative results are shown in Figs. 3 and 4.
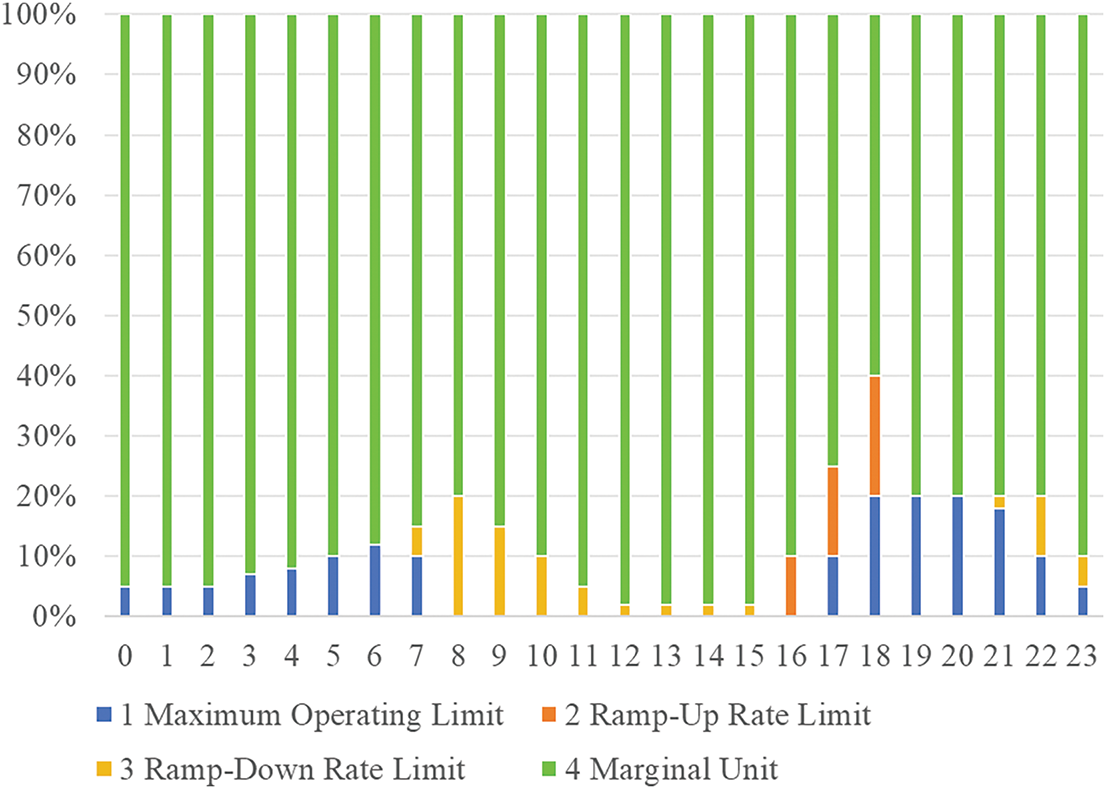
Figure 3: Schematic diagram of the working condition of the unit in System 1
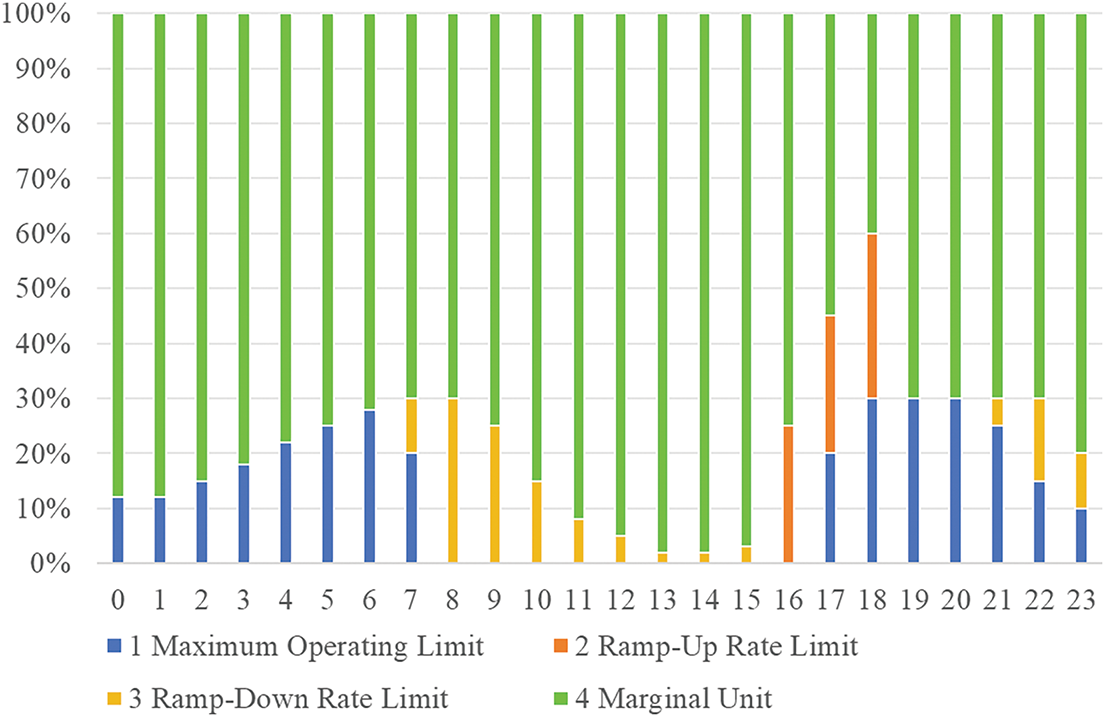
Figure 4: Schematic diagram of the working condition of the unit in System 2
In the adaptability study of dual clearing systems for electricity spot markets, System 1 demonstrates superiority through its Dual-Active Heterogeneous and Cross-Mutual Backup architecture. System 1 exhibits a daily average marginal unit proportion of 87.9%, significantly higher than the 74.7% observed in System 2. During the critical 16:00–18:00 peak load period, System 1 maintains a marginal unit level of 78.3%, compared to a sharp decilne to 56.7% in System 2, demonstrating System 1’s superior operational flexibility and stability.
By implementing multi-source data verification and real-time parameter synchronization, it significantly mitigates node load anomalies and model distortion risks, thereby improving the accuracy of root-cause analysis of section congestion. Its constraint activation mechanism strictly links shadow prices (λ > 0) to genuine physical boundaries, eliminating pseudo-constraints triggered by data flaws in conventional systems and reducing uneconomical output limitations on efficient units. During security-economy coordination, System 1 adjusts unit status only during actual congestion events, meticulously distinguishing coupling effects from dispatch commands to minimize non-essential output restrictions. This approach optimizes congestion costs, enhances electricity price signal accuracy, and demonstrates its core advantage of reducing output-constrained units to promote efficient resource allocation.
System 1’s consistently higher proportion of marginal units, particularly during peak demand, directly translates to superior resource utilization and enhanced market efficiency. This indicates that System 1 more effectively minimizes unnecessary output constraints, thereby reducing potential curtailment costs and avoiding the uplift in system marginal prices that typically arises when lower-cost units are artificially restricted. The attributed mechanisms of multi-source data verification and real-time parameter synchronization evidently prevent data anomalies and model distortions from imposing unwarranted limits, allowing the market to operate closer to its economic optimum and providing more accurate price signals to participants.
To compare the operational performance of the two systems, statistical analysis is respectively conducted on the boundary-reaching and over-limit conditions of section security constraints for System 1 and System 2. As shown in Fig. 5, 80 units are included in the statistics for both System 1 and System 2.
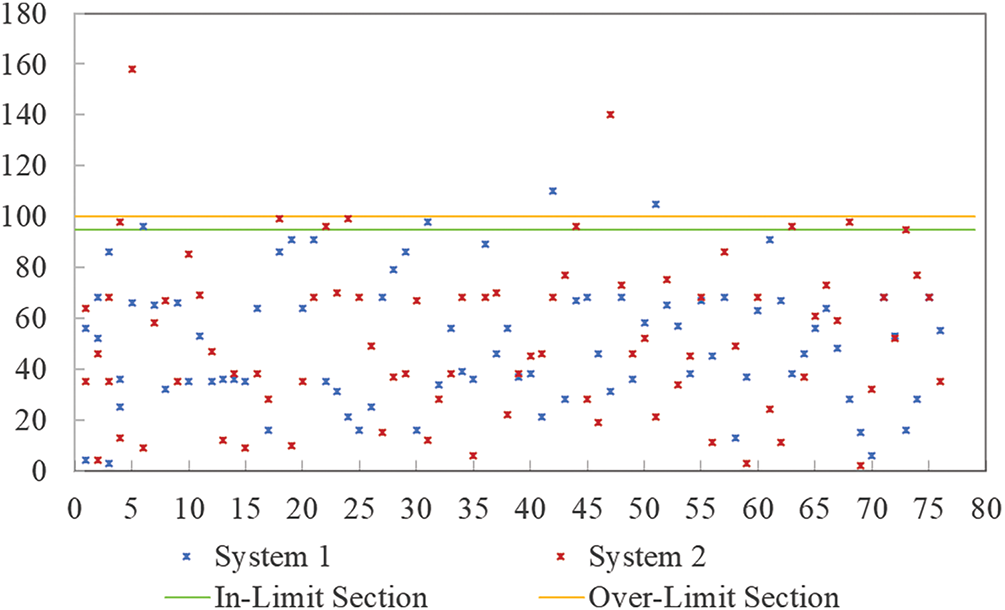
Figure 5: Statistical summary of unit section power flow operation status for system 1 and system 2
In Fig. 5, among the units of System 1, 76 units operate normally in terms of section constraints, accounting for 95% of the total. For System 2, 70 units can operate normally, accounting for 88% of the total. For units in the on-limit section, 2 units using System 1 account for 3%, while 8 units using System 2 account for 10% of the total. Although both System 1 and System 2 have 2 units in the over-limit section, the maximum over-limit value of System 1 units does not exceed 120%, while the minimum over-limit value of System 2 units is greater than 120%. Based on the above, System 1 has more units operating normally in terms of section constraints than System 2, and the over-limit degree of System 1’s units is lower than that of System 2’s units. Therefore, the section power flow operation of System 1 is better than that of System 2.
System 1’s significantly lower rates of section constraint violations and milder over-limit conditions demonstrate a more robust and effective congestion management capability. This directly translates to reduced grid security risks and lower redispatch costs, as the system is less frequently forced into suboptimal or emergency operational states. The superior performance implies that System 1’s underlying models and constraint handling mechanisms are more adept at accurately forecasting and mitigating potential congestion, ensuring that power flows remain within safe operating boundaries with greater consistency, which is crucial for maintaining both grid reliability and market efficiency.
6.4 Analysis of Clearing Price Analysis
Load demand is the main factor affecting the market clearing price, and in general, the system energy price is positively correlated with load change. To quantitatively analyze the correlation between the two, the Pearson correlation coefficient is used to quantify the closeness of the correlation between the predicted load series and the system’s energy price, and the formula is shown in Eq. (14) [31].
where
Using multiple simulated operation datasets from the Inner Mongolia electricity market, this study takes the system predicted load and energy price series as sample data. The correlation analysis results between electricity price and load are presented in Fig. 6. It can be seen from the figure that in case1 and case2, the correlation coefficients between the energy price and the predicted load of system A are greater than 0.8, and the trend correlation is strong and there is no obvious anomaly, which is in line with the general law of positive correlation between load and electricity price. However, due to significant abnormal fluctuations in electricity prices, the correlation coefficient dropped below 0.8, deviating from the normal correlation trend.
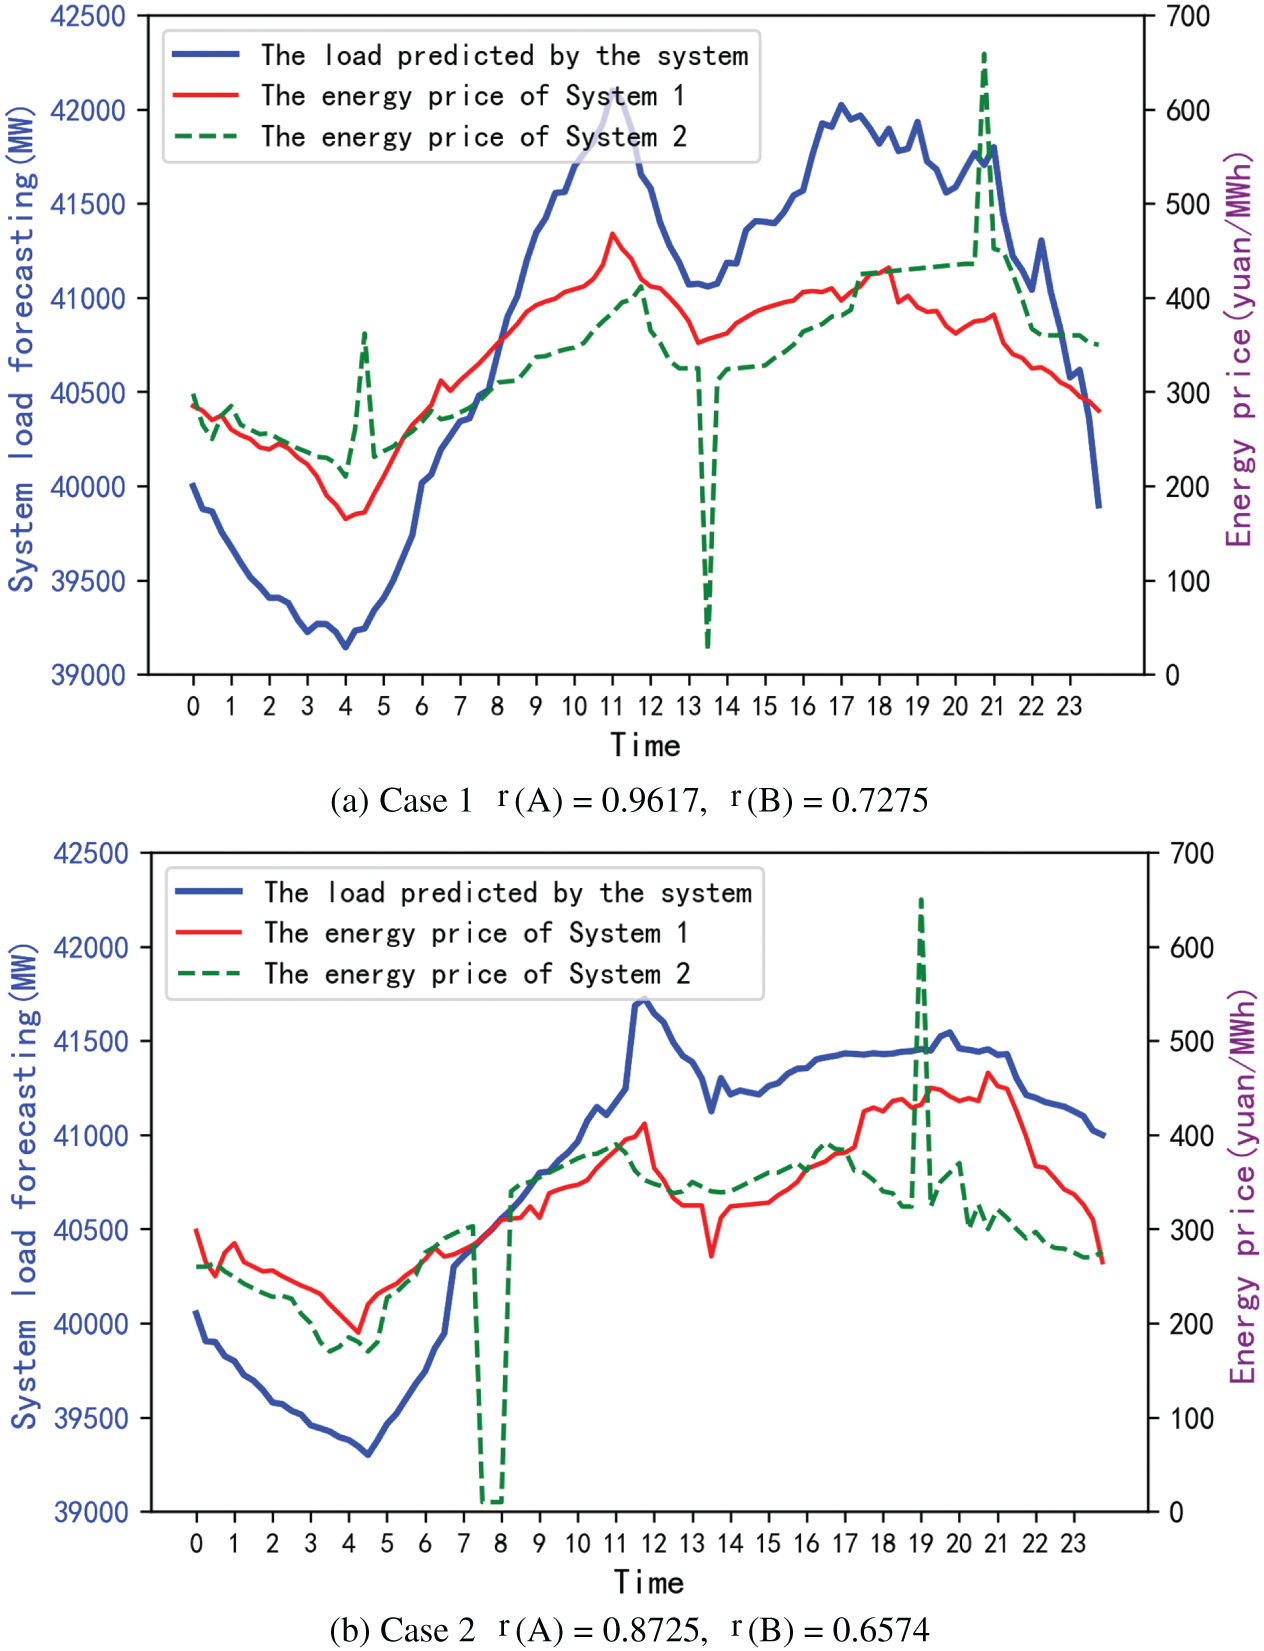
Figure 6: Example results of price-load correlation
Based on typical data analysis, this paper sets the threshold of reasonableness to 0.8. When
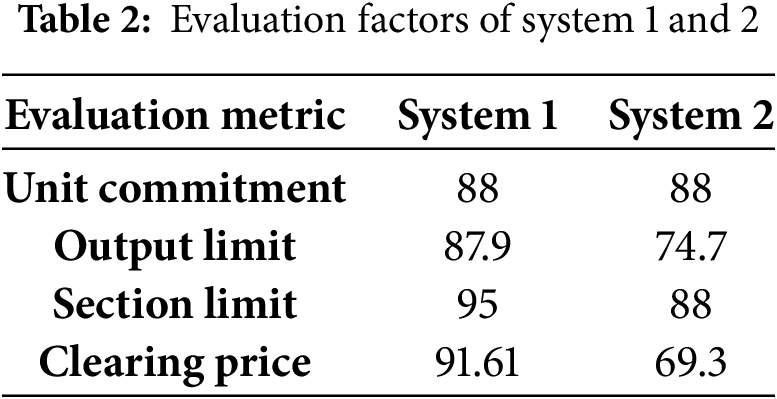
6.5 Comprehensive Evaluation of Adaptability of Two Systems
Based on the analysis of the two systems across the aforementioned four dimensions in unit commitment, output limit, section limit and clearing price, the evaluation metrics can be summarized as presented in Table 2.
The weights derived from each system through the gray relational analysis method are presented in Table 3.
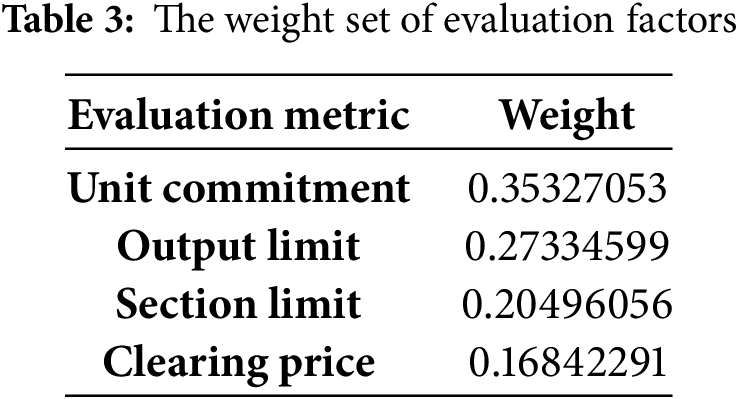
Building upon this foundation, we employ the normal distribution membership function to compute the degree of membership for each evaluation factor across different compatibility levels in both systems, thereby obtaining their respective membership matrices. Subsequently, by multiplying the weight set with these membership matrices, we derive the fuzzy comprehensive evaluation vectors, as illustrated in Figs. 7 and 8.
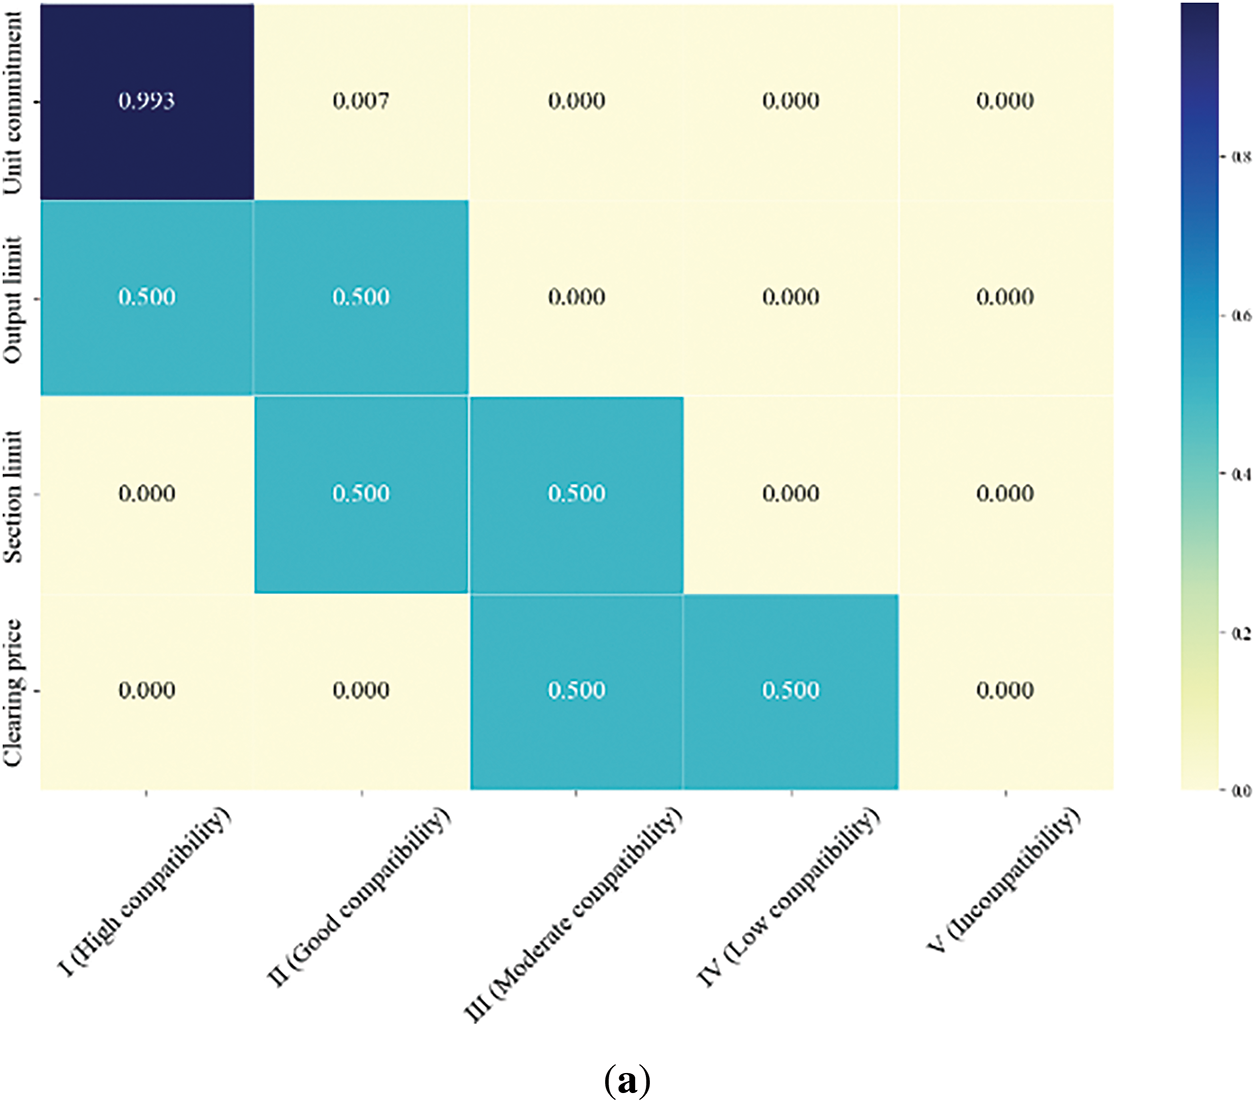
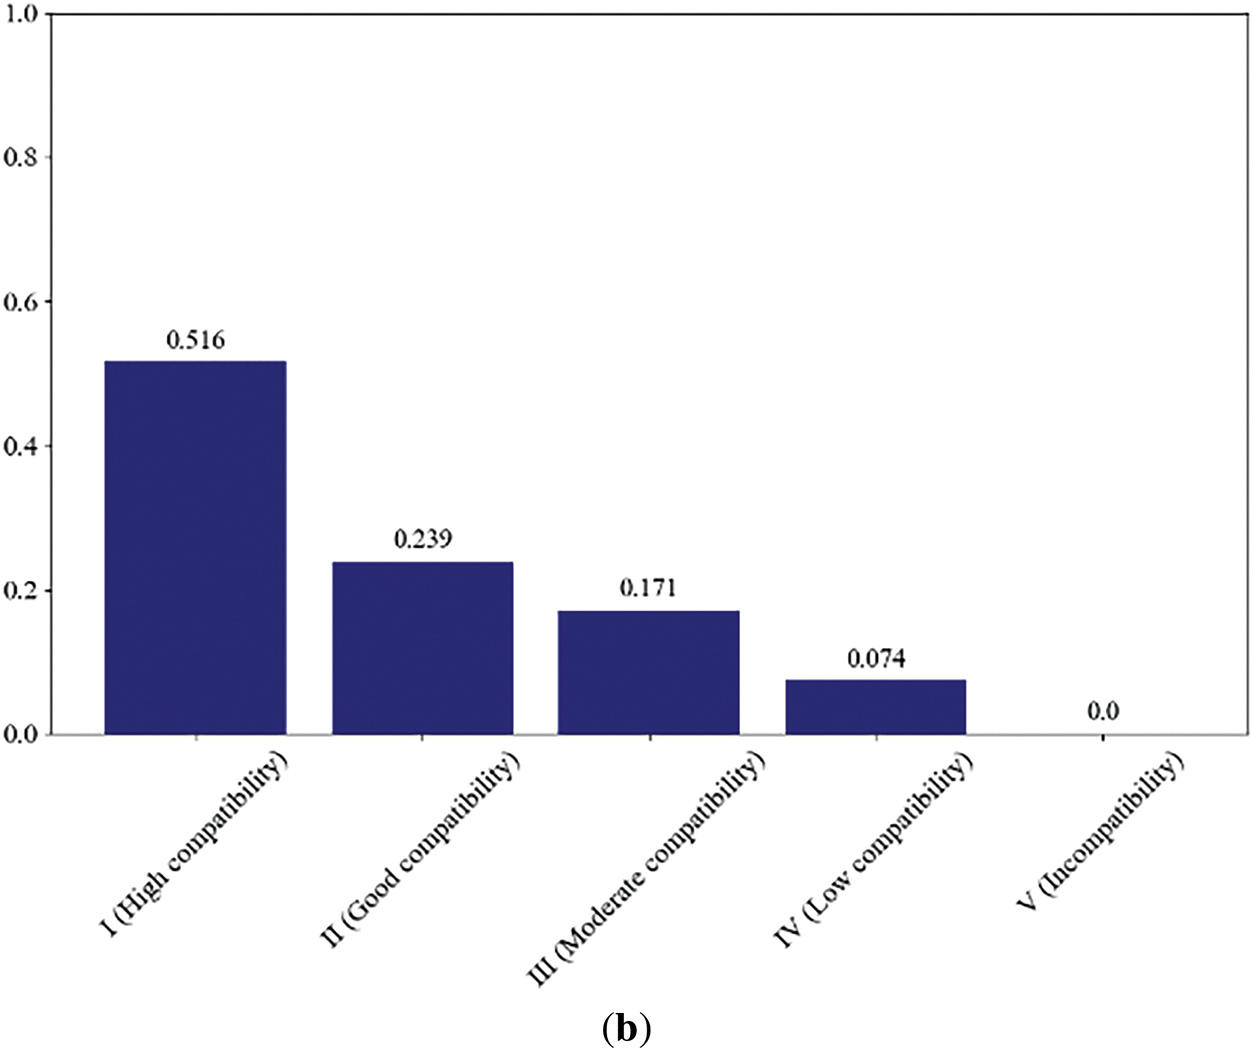
Figure 7: (a) Distribution of membership degrees for evaluation factors across compatibility levels in system 1, (b) Fuzzy comprehensive evaluation results of system 1
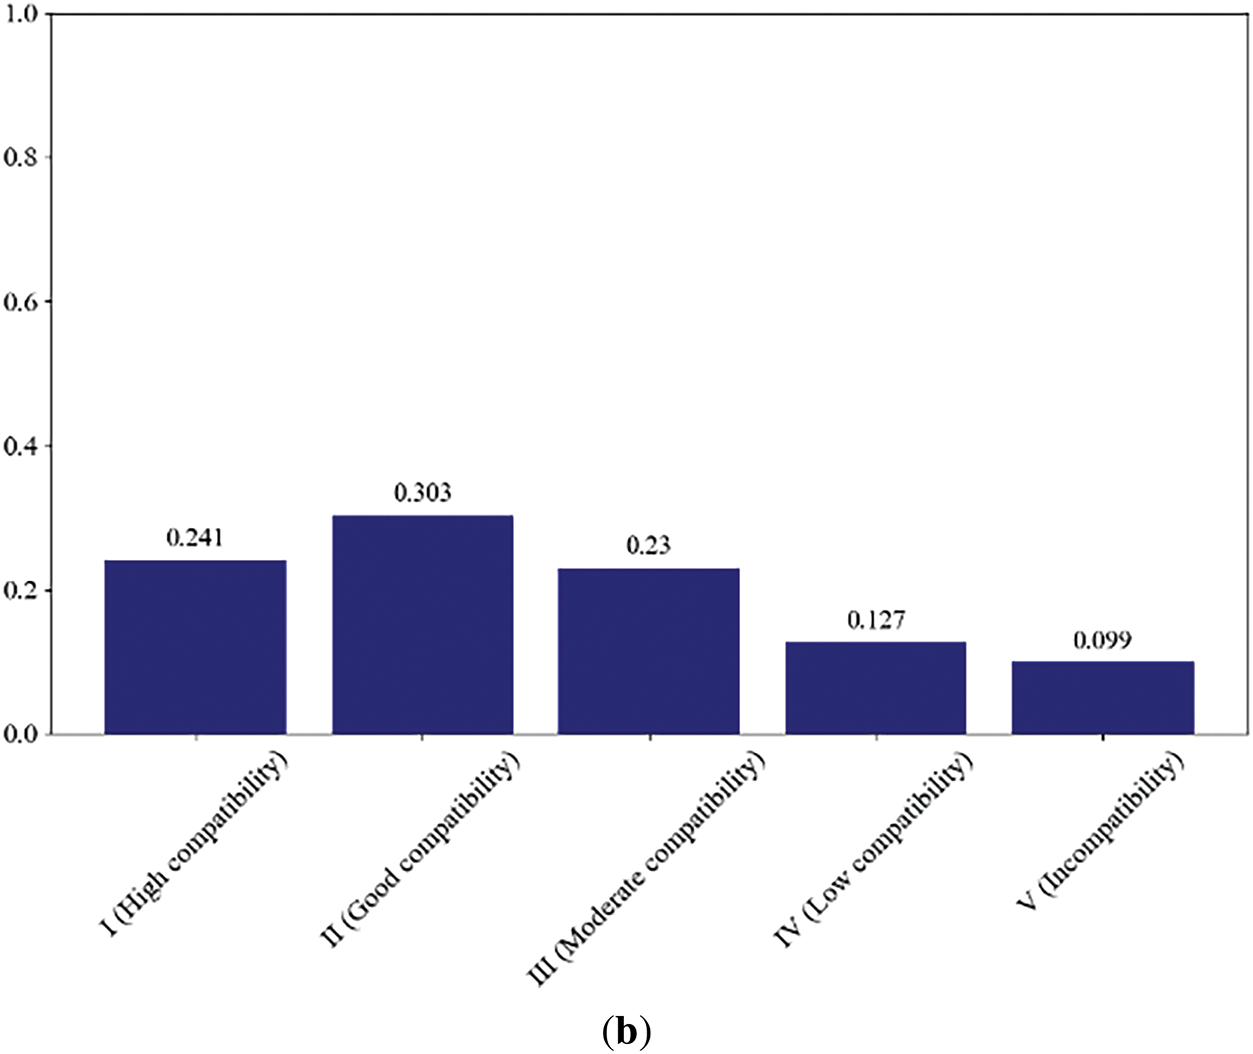
Figure 8: (a) Distribution of membership degrees for evaluation factors across compatibility levels in system 2, (b) Fuzzy comprehensive evaluation results of system 2
As illustrated in Fig. 7b, following the principle of maximum membership degree, the highest membership value of 0.516 corresponds to Compatibility Level I (High Compatibility) for System 1. The weight distribution of evaluation factors, depicted in Fig. 7a, reflects their respective contributions to deviation risk. In this case study, Unit Commitment and Output Limit exhibit significantly higher weights (0.993 and 0.5, respectively), indicating their substantial influence on System 1’s compatibility. Similarly, Fig. 8b demonstrates that the maximum membership degree of 0.303 corresponds to Compatibility Level II (Good Compatibility) for System 2. The weight analysis in Fig. 8a reveals that Unit Commitment and Section Limit carry relatively greater weights (0.605 and 0.372, respectively), suggesting their pronounced impact on System 2’s compatibility. The comparative analysis leads to the conclusion that System 1 demonstrates a higher compatibility compared to System 2.
This study successfully developed and applied a comprehensive fuzzy evaluation framework to quantitatively assess the adaptability of primary-backup clearing systems in electricity spot markets, specifically demonstrated through an Inner Mongolia case study. By integrating grey relational analysis for objective indicator weighting and fuzzy comprehensive evaluation for system ranking, the framework effectively quantifies system adaptability, addressing the critical need for systematic evaluation in redundant clearing mechanisms.
Our findings reveal that System 1, with its Dual-Active Heterogeneous and Cross-Mutual Backup architecture, consistently demonstrated superior performance. It exhibited higher operational flexibility, evidenced by a greater marginal unit proportion, particularly during peak loads. Furthermore, System 1 showed enhanced grid security and constraint management, with more units operating normally under section constraints and lower over-limit degrees. Crucially, its clearing prices displayed stronger Pearson correlation with predicted load trends, indicating greater rationality and stability of market signals. The fuzzy comprehensive evaluation ultimately assigned System 1 a “High Compatibility” level, significantly outperforming System 2. This confirms the framework’s efficacy in supporting decision-making for optimal redundant clearing system selection in markets with complex grid dynamics and increasing renewable penetration.
While the methodology offers general applicability, future work should focus on developing dynamic adaptability assessment models for real-time evaluation under evolving grid and market conditions. Further research is also needed to expand the framework to include more granular contingency-specific analyses, integrate advanced AI/ML techniques for predictive assessment, conduct detailed economic cost-benefit analyses, and validate the framework’s scalability and generalizability across diverse regional electricity markets, including the investigation of multi-market coupling effects.
Acknowledgement: This paper was completed with the hard help of every author.
Funding Statement: This work is supported by NARI Relays Electric Co., Ltd. under the Project “Research on Evaluation of Clearing Results and Switching Criteria for Primary-Backup Systems in Electricity Spot Markets” (Project No. CGSQ240800443).
Author Contributions: The authors confirm contribution to the paper as follows: study conception and design: Kai Xie, Shaoqing Yuan; data collection: Dayun Zou; analysis and interpretation of results: Jinran Wang, Genjun Chen; draft manuscript preparation: Ciwei Gao, Yinghao Cao. All authors reviewed the results and approved the final version of the manuscript.
Availability of Data and Materials: Due to the nature of this research, participants of this study did not agree for their data to be shared publicly, so supporting data is not available.
Ethics Approval: Not applicable.
Conflicts of Interest: The authors declare no conflicts of interest to report regarding the present study.
References
1. Sundaram A, Khan MA. Market clearing and settlement using participant based distributed slack optimal power flow model for a double sided electricity auction market—part II. Electr Power Compon Syst. 2018;46(5):533–43. doi:10.1080/15325008.2018.1460640. [Google Scholar] [CrossRef]
2. Rueda-Medina AC, Ferraz RSF, Ferraz RSF, Batista OE. A stochastic market-based clearing approach in active distribution networks by using interval optimization. Electr Power Syst Res. 2024;235(4):110621. doi:10.1016/j.epsr.2024.110621. [Google Scholar] [CrossRef]
3. Gao S, Bai X, Shang Q, Weng Z, Wu Y. A joint electricity market-clearing mechanism for flexible ramping products with a convex spot market model. Sustainability. 2024;16(6):2390. doi:10.3390/su16062390. [Google Scholar] [CrossRef]
4. Koltsaklis NE, Knápek J. Assessing flexibility options in electricity market clearing. Renew Sustain Energy Rev. 2023;173:113084. doi:10.1016/j.rser.2022.113084. [Google Scholar] [CrossRef]
5. Saxena A. Optimized Fractional Overhead Power Term Polynomial Grey Model (OFOPGM) for market clearing price prediction. Electr Power Syst Res. 2023;214(1):108800. doi:10.1016/j.epsr.2022.108800. [Google Scholar] [CrossRef]
6. Tao S, Tan Z, Yang C, Yan Z, Cheng H. Path-aware market clearing model for inter-regional electricity market via redundancy elimination. J Mod Power Syst Clean Energy. 2024;12(6):1980–92. doi:10.35833/mpce.2023.000962. [Google Scholar] [CrossRef]
7. Li Y, Huang J, Liu Y, Zhao T, Zhou Y, Zhao Y, et al. Day-ahead risk averse market clearing considering demand response with data-driven load uncertainty representation: a Singapore electricity market study. Energy. 2022;254(2):123923. doi:10.1016/j.energy.2022.123923. [Google Scholar] [CrossRef]
8. Chen Y, Wang H, Yan Z, Xu X, Zeng D, Ma B. A two-phase market clearing framework for inter-provincial electricity trading in Chinese power grids. Sustain Cities Soc. 2022;85(9):104057. doi:10.1016/j.scs.2022.104057. [Google Scholar] [CrossRef]
9. Fu X, Yang K, Li G, Zeng D. Research on the trading arrangement and clearing model of medium- and long-term inter-provincial markets considering security constraints. Front Energy Res. 2022;9:839108. doi:10.3389/fenrg.2021.839108. [Google Scholar] [CrossRef]
10. Sleisz Á., Divényi D, Sőrés P, Raisz D. Performance comparison of integrated formulations for European electricity market clearing. In: 2022 18th International Conference on the European Energy Market (EEM); 2022 Sep 13–15; Ljubljana, Slovenia. p. 1–6. doi:10.1109/EEM54602.2022.9921009. [Google Scholar] [CrossRef]
11. Eddahmany El Adlani A, Riquelme-Santos JM, Gómez-Quiles C. A decomposition-based approach to European electricity market clearing. Int J Electr Power Energy Syst. 2024;161(1):110192. doi:10.1016/j.ijepes.2024.110192. [Google Scholar] [CrossRef]
12. Zalzar S, Bompard E. A day-ahead joint energy and uncertainty reserve market clearing model to manage VRE uncertainty. In: 2018 IEEE International Conference on Environment and Electrical Engineering and 2018 IEEE Industrial and Commercial Power Systems Europe (EEEIC/I&CPS Europe); 2018 Jun 12–15; Palermo, Italy. p. 1–5. doi:10.1109/EEEIC.2018.8493987. [Google Scholar] [CrossRef]
13. Shi J, Guo Y, Wu W, Sun H. Scenario-oriented multi-area joint market clearing of energy and reserve under uncertainty. Appl Energy. 2024;361(2):122873. doi:10.1016/j.apenergy.2024.122873. [Google Scholar] [CrossRef]
14. Zhu J, Cai X, Meng Z, Chen Y, Liu L, Zhai W. Study on the clearing mechanism of provincial power spot market considering regional standby market trading. In: 2023 6th International Conference on Energy, Electrical and Power Engineering (CEEPE); 2023 May 12–14; Guangzhou, China. p. 1580–5. doi:10.1109/CEEPE58418.2023.10167241. [Google Scholar] [CrossRef]
15. Li Y, Xiao D, Chen H, Cai W, do Prado JC. Analyzing the wind-dominant electricity market under coexistence of regulated and deregulated power trading. Energ Eng. 2024;2024:1–10. doi:10.32604/ee.2024.049232. [Google Scholar] [CrossRef]
16. Kamat R, Oren SS. Two-settlement systems for electricity markets: zonal aggregation under network uncertainty and market power. Program on workable energy regulation (POWER) working paper series, PWP-091. Berkeley, CA, USA: University of California Energy Institute; 2002. [Google Scholar]
17. Kamat R, Oren SS. Two-settlement systems for electricity markets under network uncertainty and market power. J Regul Econ. 2004;25(1):5–37. doi:10.1023/B:REGE.0000008653.08554.81. [Google Scholar] [CrossRef]
18. Rezaee Jordehi A, Tabar VS, Ahmadi Jirdehi M. A two-stage stochastic model for security-constrained market clearing with wind power plants, storage systems and elastic demands. J Energy Storage. 2022;51:104550. doi:10.1016/j.est.2022.104550. [Google Scholar] [CrossRef]
19. Shittu E, Santos JR. Electricity markets and power supply resilience: an incisive review. Curr Sustain Renew Energy Rep. 2021;8(4):189–98. doi:10.1007/s40518-021-00194-4. [Google Scholar] [CrossRef]
20. Kumar A, Singh AR, Raghav LP, Deng Y, He X, Bansal RC, et al. State-of-the-art review on energy sharing and trading of resilient multi microgrids. iScience. 2024;27(4):109549. doi:10.1016/j.isci.2024.109549. [Google Scholar] [PubMed] [CrossRef]
21. Chen YB, Xiao QZ, Zhang Z, Ma RG, Deng FY. Quantitative characterization of influencing factors and market power evaluation method for clearing results in spot electricity market. Grid Technol. 2025;49(5):2035–45. (In Chinese). doi:10.13335/j.1000-3673.pst.2024.1459. [Google Scholar] [CrossRef]
22. Zhu X. Research on the participation of wind and solar energy storage in electricity market trading decisions under the renewable energy quota system [master’s thesis]. Beijing, China: North China Electric Power University; 2024. (In Chinese). doi:10.27139/d.cnki.ghbdu.2022.000765. [Google Scholar] [CrossRef]
23. Latify MA, Mokhtari A, Alavi-Eshkaftaki A, Rajaei Najafabadi F, Hashemian SN, Khaleghizadeh A, et al. Security-constrained unit commitment: modeling, solutions and evaluations. Appl Energy. 2025;390(1):125796. doi:10.1016/j.apenergy.2025.125796. [Google Scholar] [CrossRef]
24. Feng X, Lin S, Liang Y, Liu Y, Liu M. A non-iterative distributed approximate dynamic programming algorithm for frequency security-constrained stochastic economic dispatch. Int J Electr Power Energy Syst. 2025;166(2):110543. doi:10.1016/j.ijepes.2025.110543. [Google Scholar] [CrossRef]
25. Ongsakul W, Petcharaks N. Transmission and ramp constrained unit commitment using enhanced adaptive Lagrangian relaxation. In: Proceedings of the 2005 IEEE Russia Power Tech (PTC); 2005 Jun 27–30; St. Petersburg, Russia. [Google Scholar]
26. Li XY. Optimal configuration of flexible and adjustable resources and multi-level cooperative optimal scheduling of virtual power plants [dissertation]. Beijing, China: North China Electric Power University; 2023. (In Chinese). doi:10.27140/d.cnki.ghbbu.2023.000086. [Google Scholar] [CrossRef]
27. Ahmed MI, Kumar R. Locational marginal price based optimal placement of DG using stochastic radial basis function. Int J Ambient Energy. 2023;44(1):739–49. doi:10.1080/01430750.2022.2142287. [Google Scholar] [CrossRef]
28. Tong G, Deng Q, Yang B. Selection of key indicators for comprehensive evaluation of smart distribution networks based on grey relational analysis. J Phys Conf Ser. 2025;2935(1):012003. doi:10.1088/1742-6596/2935/1/012003. [Google Scholar] [CrossRef]
29. Song X, E J, Huang Y, Tan S. Multi-parameter impact analysis of the liquid-cooled battery cold plate in island wind-solar-tidal energy storage system based on fuzzy grey correlation analysis. Energy. 2025;333(2):137313. doi:10.1016/j.energy.2025.137313. [Google Scholar] [CrossRef]
30. Fu H, Ai Y, Qiu L, Ai Y, Yang B, Shi Y. Application of fuzzy comprehensive evaluation method in the identification of potential faults of high-voltage power cables. Front Energy Res. 2024;12:1490524. doi:10.3389/fenrg.2024.1490524. [Google Scholar] [CrossRef]
31. Fan S, Geng H, Zhang H. Multi-step power forecasting method for distributed photovoltaic (PV) stations based on multimodal model. Sol Energy. 2025;298:113572. doi:10.1016/j.solener.2025.113572. [Google Scholar] [CrossRef]
Cite This Article
 Copyright © 2026 The Author(s). Published by Tech Science Press.
This work is licensed under a Creative Commons Attribution 4.0 International License , which permits unrestricted use, distribution, and reproduction in any medium, provided the original work is properly cited.
 Downloads
 Citation Tools