
 Submit a Paper
 Propose a Special lssue
 Open Access
ARTICLE

Collaboration of GTCC-Powered CAES with Residual Compression Heat for Gas Turbine Inlet Air Heating
School of Electric Power, South China University of Technology, Wushan Street Tianhe District, Guangzhou, 510640, China
* Corresponding Author: Cheng Yang. Email:
Energy Engineering 2026, 123(2), 24 https://doi.org/10.32604/ee.2025.070957
Received 28 July 2025; Accepted 04 September 2025; Issue published 27 January 2026
 View Full Text
 Download PDF
Abstract
In order to enhance the off-peak performance of gas turbine combined cycle (GTCC) units, a novel collaborative power generation system (CPG) was proposed. During off-peak operation periods, the remaining power of the GTCC was used to drive the adiabatic compressed air energy storage (ACAES), while the intake air of the GTCC was heated by the compression heat of the ACAES. Based on a 67.3 MW GTCC, under specific demand load distribution, a CPG system and a benchmark system (BS) were designed, both of which used 9.388% of the GTCC output power to drive the ACAES. The performance of the CPG and the BS without intake air heating was compared. The results show that the load rate of the GTCC in the CPG system during off-peak periods is significantly enhanced, and the average operating efficiency of the GTCC is increased by 1.19 percentage points. However, in the BS system, due to the single collaborative method of load shifting, the GTCC operative efficiency is almost increased by 1.00 percentage points under different ambient temperatures. In a roundtrip cycle at an ambient temperature of 288.15 K, the system efficiency of the CPG reaches 0.5010, which is 0.62 percentage points higher than the operative efficiency of 0.4948 in the standalone GTCC; while the system efficiency of the BS is slightly inferior to that of the standalone GTCC. The findings confirm the technical feasibility and performance improvement of the ACAES-GTCC collaborative power generation system.Keywords
Nomenclature
| A | Heat exchanging area [m2] |
| cp | Specific heat capacity [kJ/(kg·K)] |
| de | Equivalent diameter of fin channel [m] |
| E | Energy [kJ] |
| e | Specific enthalpy [kJ/kg] |
| f | The friction coefficient [N/m2] |
| h | Heat transfer coefficient [W/(m2·K)] |
| j | Time sequence |
| k | Number |
| Le | The effective length of fin channel [m] |
| M | Accumulated mass [kg] |
| m | Mass flowrate [kg/s] |
| P | power [kW] |
| p | Pressure [kPa] |
| Q | Thermal quantity [kJ] |
| qLHV | Lower heating value of fuel [kJ/kg] |
| RTE | Roundtrip efficiency |
| r | Load rate |
| T | Temperature [K] |
| t | Duration time |
| u | Flow velocity [m/s] |
| W | Work [kWh] |
| Acronyms | |
| ACAES | Adiabatic compressed air energy storage |
| AF | Air fan |
| AH | Air heater |
| AR | Air reservoir |
| BS | Benchmark system |
| CAES | Compressed air energy storage |
| CPG | Collaborative power generation system |
| GT | Gas turbine |
| GTCC | Gas turbine combined cycle |
| IAH | GT compressor inlet air heating |
| Greek | |
| Δ | Difference value, interval |
| η | Efficiency |
| π | Pressure ratio |
| ρ | Density [kg/m3] |
| λ | Heat conductive coefficient [W/(m·K)] |
| Subscript | |
| a | Air, ambient |
| at | Air turbine of ACAES |
| c | Cooling energy |
| cc | Gas turbine combined cycle |
| com | Compressor of ACAES |
| ch | Charging |
| d | Demand |
| dis | Discharging |
| exh | Exhaust |
| f | Fuel |
| h | Heat energy |
| m | Mean value |
| p | Preset value |
| r | Residual |
| sys | System |
| 0 | Designed values |
Gas turbine (GT) power generation is one of the important technical forms in the world, with the share of generation capacity remaining around 23% [1]. According to the Natural Gas Development Report (2024) released by the National Energy Administration of China, the installed capacity of gas turbine power units reached 130 GW in 2023, playing a significant role in the construction of the new energy system. Gas turbine combined cycle (GTCC) is one of the main technical forms of gas power generation, characterized by its strong flexibility and high efficiency [2]. However, the new power system currently under construction is dominated by renewable energy. To accommodate a high proportion of renewables in the power grid, gas power generation units typically operate at relatively low loads. This transformation poses crucial requirements for the peak-shaving flexibility and part-load performance of existing generation units [3,4]. Therefore, in order to accommodate renewable energy while maintaining high efficiency, further improving the flexible operation of GT and GTCC units has become an issue that needs to be addressed.
To enhance the flexibility of gas turbine power generation units, various technologies for modifying gas turbines have emerged. Pashchenko et al. [5] proposed thermochemical recuperation by steam methane reforming as an efficient alternative to steam injection in gas turbines. Wang et al. [6] designed a humid air turbine cycle with additional heat exchangers, conducted a comprehensive thermodynamic analysis on the heat exchanger effectiveness, and demonstrated that the power efficiency could be enhanced through increasing the recuperator effectiveness. Strušnik et al. [7] combined a GTCC with a Cu-Cl cycle, which was beneficial to the environment and improved the cycle efficiency. Manatura et al. [8] established an artificial neural network model for GTCC power generation systems, through which the operational strategies could be adjusted and the energy efficiency could be enhanced. Kumar et al. [9] pointed out that GT inlet air cooling could increase the GT output power at full load. In addition to the above technologies, gas turbine inlet air heating (IAH) can increase the load rate under a specified power demand, thereby improve the part-load efficiency of a GTCC power unit [10].
Regarding GTCC compressor inlet air heating, its significant effect on improving the part-load efficiency of GTCC can be further confirmed from the relevant literature [11–15]. For instance, Yang et al. [14] proposed an operating strategy for GTCC with compressor inlet air heating, where turbine inlet temperature and exhaust temperature were alternatively maintained at constant levels according to the load rate. They found that, when the new operating strategy was applied under the GT inlet air temperature of 338.15 K in comparison with 288.15 K, the part-load efficiency of the GTCC could be improved by 1.7 percentage points. Fan et al. [15] compared different control strategies of combined cycles with IAH and determined the favorable conditions for each control strategy. When the GT compressor inlet air temperature was increased from 288.15 to 308.15 K at 80% load, the maximum increment in power efficiency was 2.3 percentage points.
Currently, the research on GTCC with inlet air heating mainly focuses on the utilization of the waste heat from the HRSG for IAH, as well as the part-load operation performance of GTCC with IAH. However, there are relatively few studies on coupling the inlet air heating with other systems. Reference [16] installed a solar collector for GTCC inlet air heating, but solar energy was limited by environmental factors and could not ensure stable inlet air heating. Among other systems that can provide heat for inlet air heating and exchange energy with GTCC, the compressed air energy storage system (CAES) is a promising option, which can improve power flexibility and operational performance.
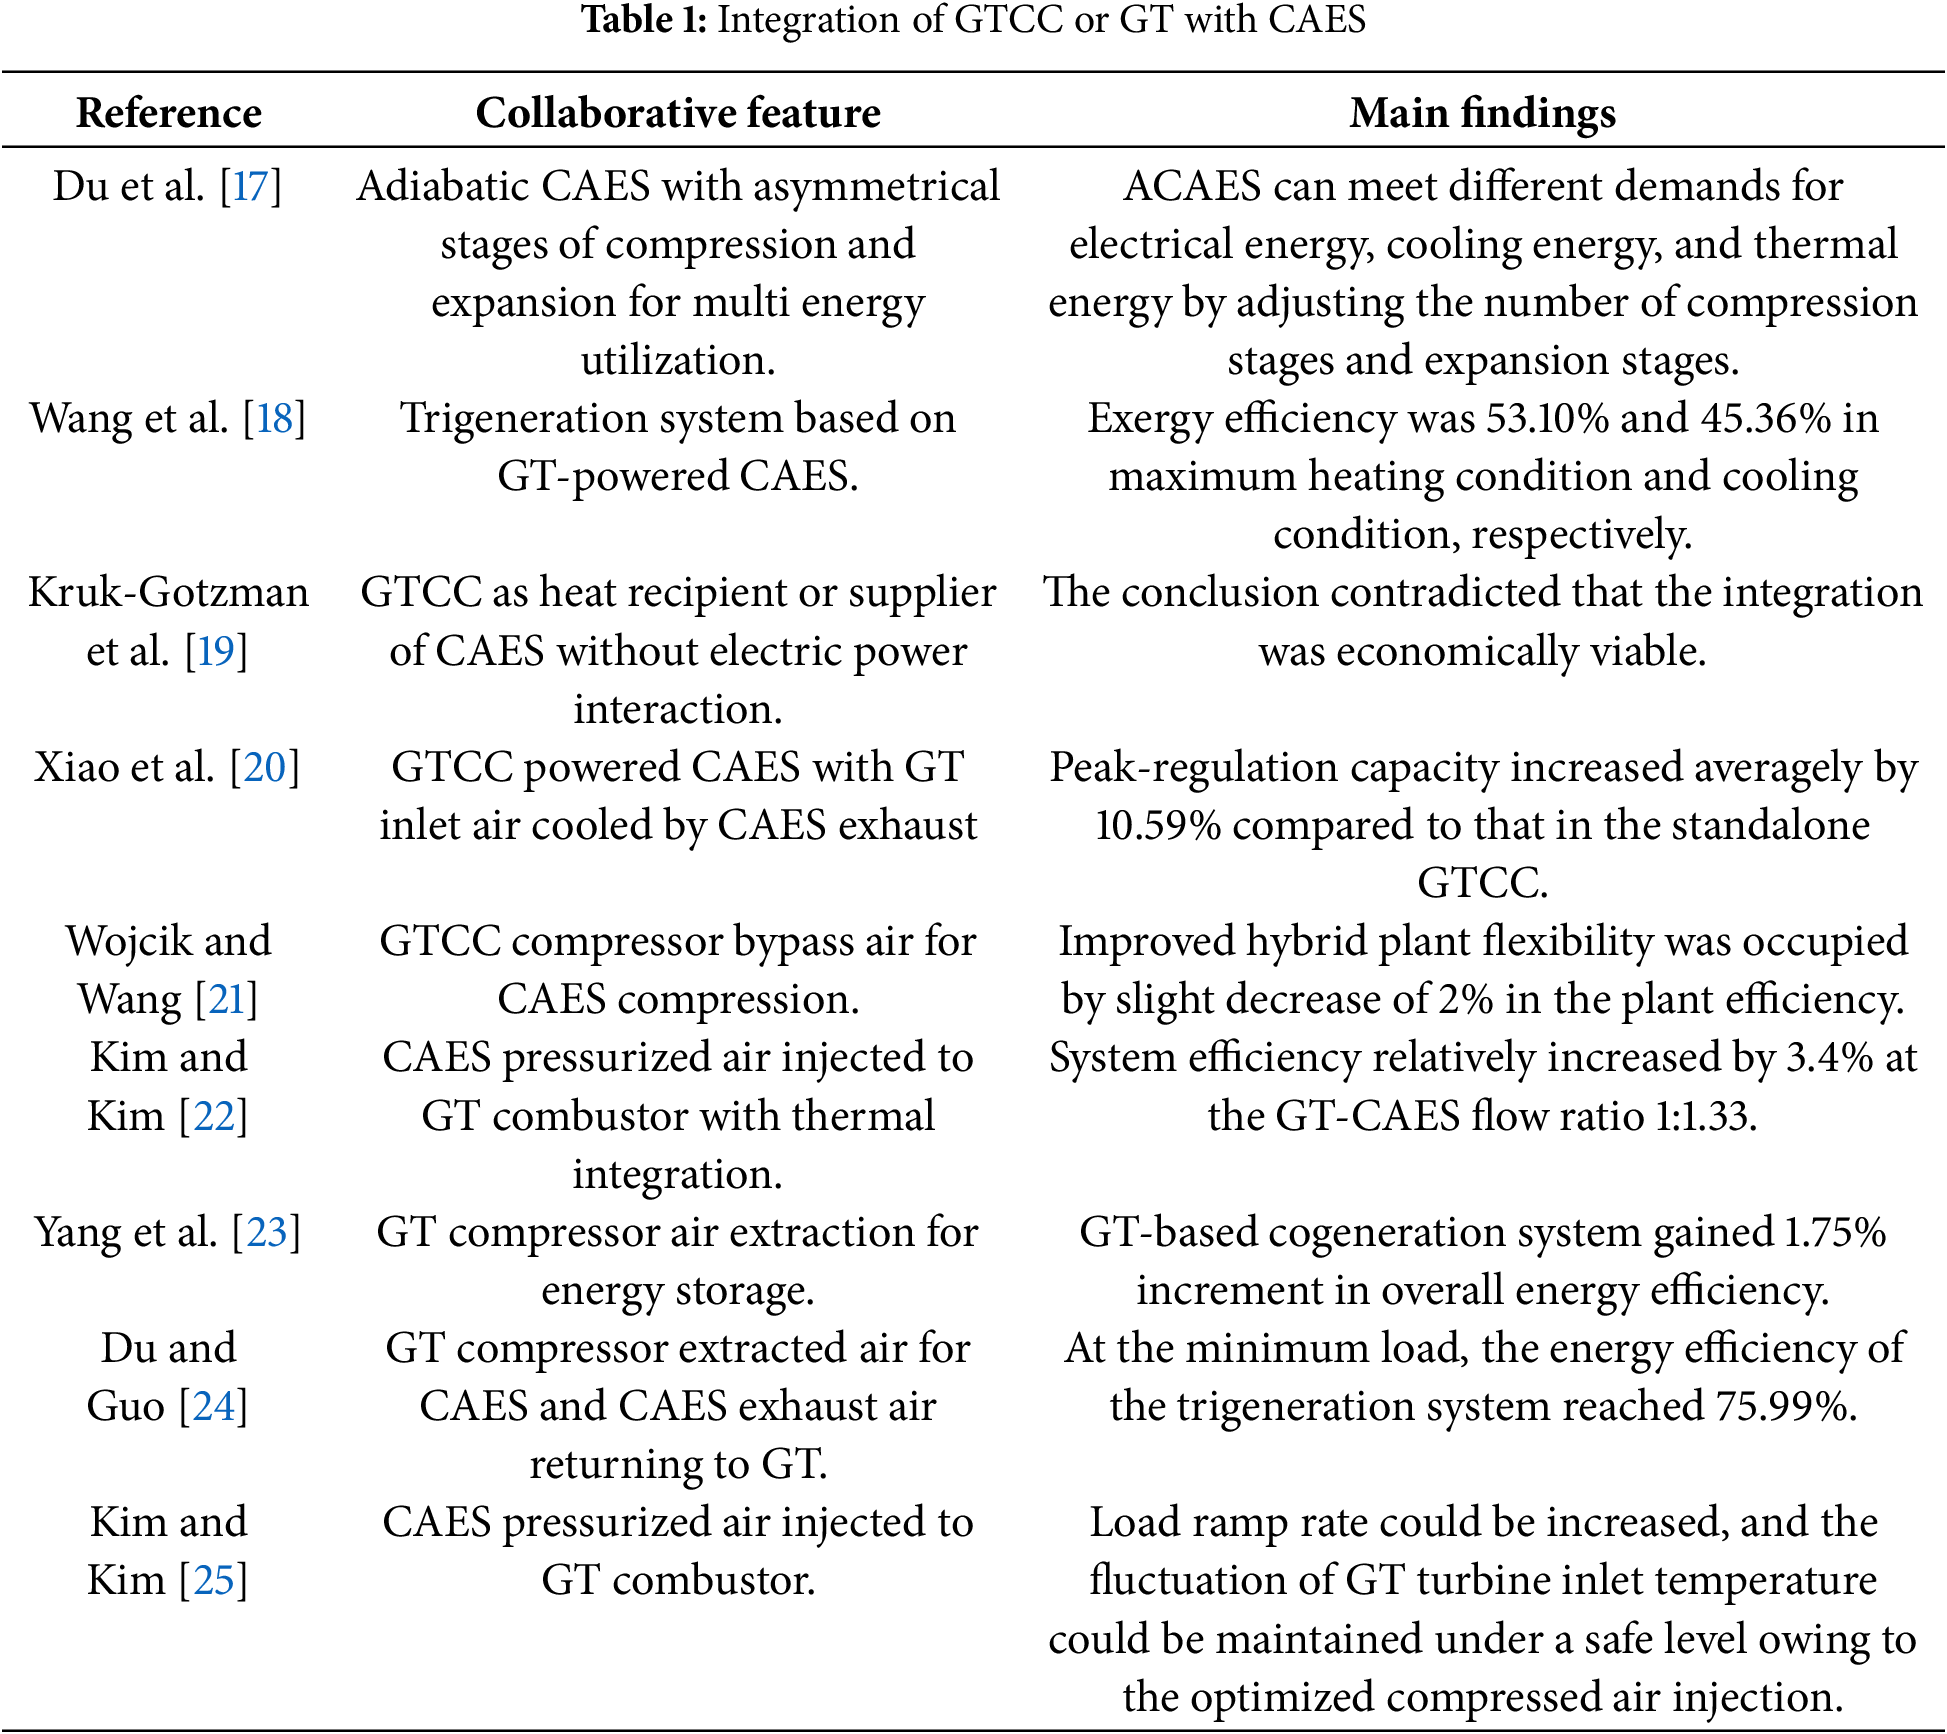
From the perspective of working mediums and main components, the operating principle of a CAES is similar to that of a gas turbine. Meanwhile, the temperature range of gas turbines and GTCC covers a wide range from the ambient temperature to approximately 1900 K, which can serve as a suitable heat receiver, or a heat supply source for CAES. In this context, there have been rich researches on the integration of GTCC with CAES, or simple-cycle GT with CAES. From the perspective of collaborative characteristics, these integration systems can be classified into the following three categories: (1) CAES driven by GTCC or simple-cycle gas turbine [17,18]. (2) GTCC serving as a heat receiver or provider of CAES without electric power shifting [19]. (3) Interaction of working medium between CAES and GTCC or gas turbine [20–25]. The main findings of these integrated systems are summarized in Table 1.
In summary, rich topics have been focused on: 1) the part-load or peak-regulation performance of GTCC with compressor inlet air heating; 2) the coupling performance of GTCC integrated by CAES; 3) the application of exhaust cold and heat energy from adiabatic CAES. However, the remaining compression heat of ACAES and its utilization for improving the performance of GTCC during off-peak hours have received little attention. Therefore, there is still a research gap in the following issues regarding CAES-GTCC collaborative power generation systems (CPG) for power regulation during off-peak hours:
(1) The thermal energy balance between the compression process and the expansion process in an adiabatic compressed air energy storage (ACAES) system. There would be residual thermal energy resulting from the ACAES configuration.
(2) The collaborative performance of an ACAES-GTCC integrated system, which uses the residual compression thermal energy of ACAES to heat the intake air of the GT compressor, during off-peak hours. In terms of the synergetic effects of the integrated system, GTCC and ACAES can be coupled during both off-peak and peak hours. In addition, the compression heat in ACAES is applicable for heating the GT compressor inlet air, whether from the perspective of energy grade or operating time sequence.
To address the aforementioned issues, a collaborative power generation system (CPG) will be designed in detail. During off-peak operation periods, the ACAES is driven by the surplus power from the GTCC; meanwhile, the GTCC compressor inlet air heating (IAH) is implemented using the residual compression heat from ACAES. During peak operation periods, the CPG subsystems collaboratively meet the power demand of external loads. Hence, the contribution of this work lies in:
(1) Designing two kinds of ACAES-GTCC coupled system, including a collaborative power generation system and a benchmark system.
(2) Analyzing the operational performance of the CPG and the BS, and each subsystem as well, under different ambient temperatures.
The remaining contents are organized in the following sections: Section 2: System description, where the basic configuration of the CPG and benchmark systems, and the performance indicators as well, are described; Section 3: Operating strategy, which includes the system operating mode control, air temperature control, oil control and hourly allocation method of the residual compression heat for GTCC inlet air heating; Section 4: Off-design performance of subsystems, including GTCC performance, ACAES performance model and heat-exchanger characteristics; Section 5: Design of CPG and BS, which includes the detailed design procedures, an example of the GTCC load distribution, and the design results; Section 6: Operating performance, which contains ACAES operating performance, GTCC operative performance and the system efficiency of CPG; Section 7: Challenges and limitations and Section 8: Conclusions.
2.1 Description to the Collaborative Power Generation System
As shown in Fig. 1, the proposed collaborative power generation system (CPG) mainly consists of two subsystems: (1) An adiabatic compressed air energy storage (ACAES) system operating under sliding pressure; and (2) A gas turbine combined cycle (GTCC).
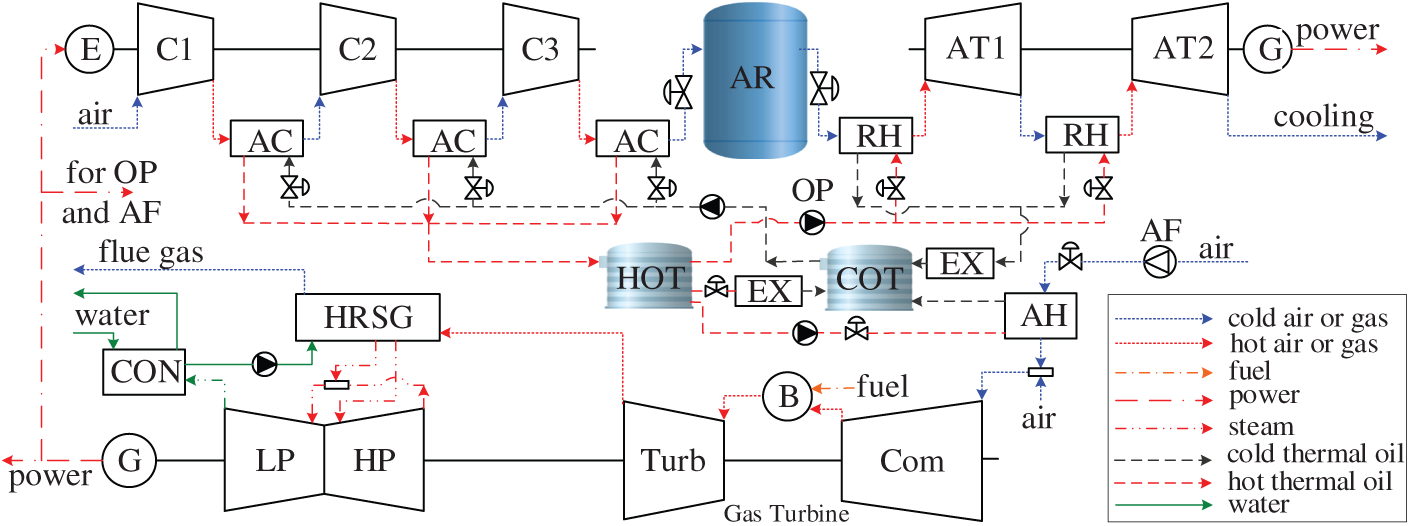
Figure 1: Schematic of collaborative power system (AC—air cooler; AF—air fan; AR—air reservoir; AT—air turbine; B—combustor; C—compressor; Com—GT compressor; CON—condenser; COT—cold oil tank; E—electrical motor; EX—auxiliary heat exchanger; G—generator; Turb—GT turbine; HOT—hot oil tank; HP—high-pressure steam cylinder; HRSG—heat recovery steam generator; AH—GT compressor inlet air heater; LP—low-pressure steam cylinder; OP—oil pump; RH—air reheater)
In the GTCC during off-peak time and power charging process, part of the compressor inlet air is suctioned by the air fan (AF), and heated by the ACAES compression heat in the air heater (AH), then mixed with the ambient air and suctioned in the GT compressor (Com) for compression. The exhaust air of the GT compressor is premixed with the natural gas and burned in the combustor (B). Successively, the high-temperature gas from the combustor enters the turbine (Turb) and expands for power production. Subsequently, the turbine exhaust gas, with required high temperature, flows through the heat recovery steam generator (HRSG) and produces the steam with several pressure ratings. The steam enters the steam turbine high-pressure cylinder (HP) and low-pressure cylinder (LP), and expands for additional power. Finally, the LP exhaust steam condenses in the condenser (CON) and serves as the feed water of the HRSG.
The ACAES consists of a power charging process, a discharging process and a thermal storage section. The charging process includes an electric motor (E), three stages of air compressors (C1, C2 and C3) with three air coolers (AC). The discharging process includes two stages of air turbines (AT1 and AT2), two reheaters (RH) and a generator (G). The energy storage section consists of oil pumps (OP), a cold oil tank (COT), a hot oil tank (HOT) and an adiabatic air reservoir (AR). During the ACAES operation, the air compressor exhaust temperature and the turbine inlet temperature are controlled by the oil flow.
During the ACAES charging and GTCC off-peak time, the compressors (C1, C2 and C3) are driven by the motor (E), which consumes the surplus electric power from the GTCC. The multi-stage compressed air is cooled in the coolers (AC) by the cold oil pumped from the oil tank (COT) and then stored in the air reservoir (AR). Meanwhile, the hot oil from the air coolers is stored in the hot oil tank (HOT). In the air cooler (AC), the air-side exhaust temperature is controlled as constant through cold oil flow regulation.
During the ACAES discharging and GTCC on-peak time, the high-pressure air is released from the air reservoir (AR), successively reheated in the air reheaters (RH) and expands in the dual-stage of air turbines (AT1 and AT2) for power generation. Meanwhile, the cold oil from the air reheaters is stored in the tank (COT). After meeting the hot oil demand of the RH, a certain amount of residual hot oil will remain in the hot oil tank, due to the unbalanced configuration of the compressors and turbines [17]. This part of hot oil is scheduled and pumped to the air heater (AH), aiming to raise the compressor inlet air temperature in the GTCC and hence to enhance the gas turbine load rate at a given power load. In the air heater, the exit cold oil temperature is controlled as constant through oil flow. In the reheater (RH), the inlet temperature of the turbines is controlled as constant through hot oil flow regulation. An auxiliary heat exchanger (EX) is configured before the cold oil tank (COT), which is used to ensure that the oil temperature in the COT for the next cycle is 5K higher than the ambient temperature. The other auxiliary heat exchanger (EX) is configured between the COT and HOT to address the possible unbalance of oil mass between the oil tanks.
The features in the CPG lie in the power connection, and thermal energy connection as well, between the ACAES and the GTCC.
2.2 Description to the Benchmark System
To demonstrate the merits and demerits of the proposed collaborative power generation system (CPG), a benchmark system (BS) is designed for comparison. The benchmark system is sketched in Fig. 2, where the charging process is driven by the GTCC surplus power during off-peak time, exactly the same with CPG.
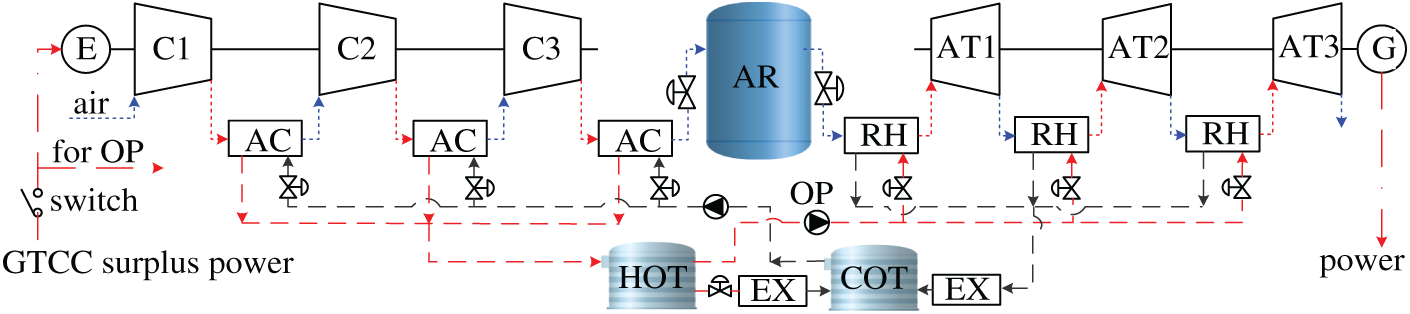
Figure 2: Schematic of benchmark system
The difference lies in the discharging process. In the BS, three stages of air turbines with reheaters, instead of dual stages in the CPG, are designed for a higher roundtrip efficiency and more discharging power. There is no other energy but power connection between the ACAES and the GTCC. In other words, BS applies single one way of collaboration by only power shifting from off-peak time to on-peak time.
Fig. 3 shows the temperature-entropy diagram of the ACAE. Points 1–7 in the figure correspond to charging process of the ACAES, points 8–12 represent the discharging process of ACAES in CPG, and points 8′–14′ represents the discharging process of ACAES in BS. As shown in Fig. 3, since the CPG adopts a dual-stage expansion, its discharging process involves more residual thermal energy. Additionally, the exhaust gas from the ACAES turbine in CPG is lower in temperature than that in BS, resulting in available cold energy. This cold energy can be applied for gas turbine inlet air cooling, which has been discussed in the previous work [20].
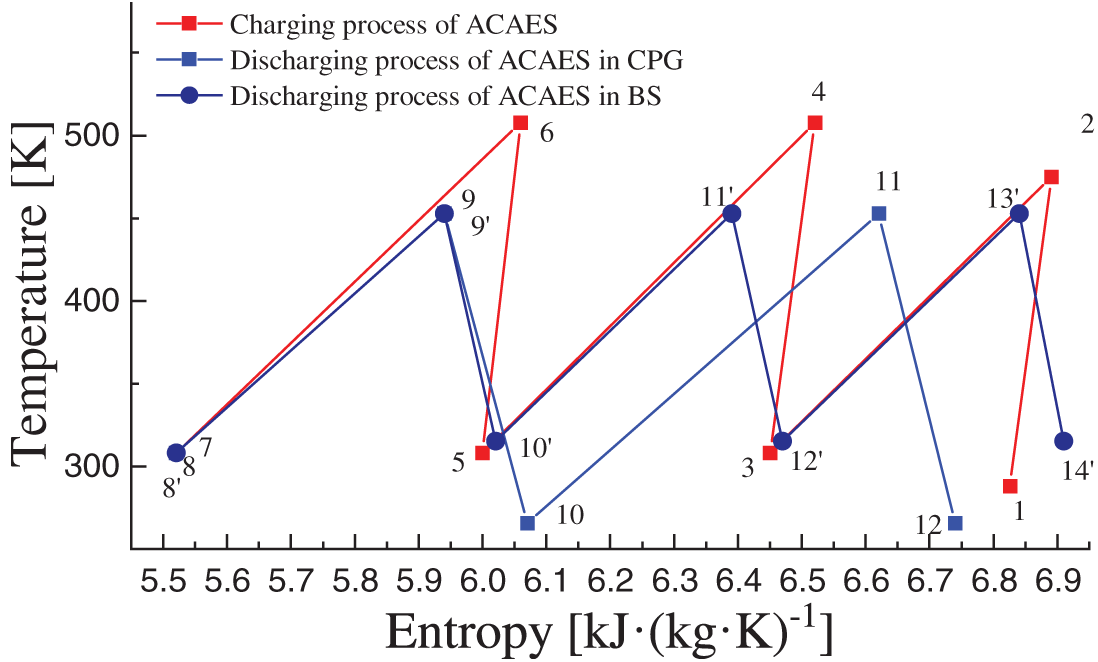
Figure 3: Temperature-entropy diagram of the ACAES
The GTCC unit is based on a commercial SGT-800 gas turbine coupled with a due-pressure non-reheating heat recovery generator and steam turbine [26]. The schematic of the GTCC subsystem can be referred to Fig. 1.
The main design parameters of the GTCC are listed in Table 2, where the design performance at ISO conditions has been simulated using commercial software GT-Pro. It can be seen that, the simulation results are in agreement with the manufacturer data. In the simulation, the mole fraction of the fuel is 89.43% CH4, 4.85% C2H6, 0.43% C3H8, 0.12% C4H10, 0.03% C5H12, 4.04% CO2, 0.95% N2 and 0.15% O2. The lower heating value is qLHV = 50,994 kJ/kg. The GT compressor inlet air flow resistance is 1 kPa, and the GT exhaust flow resistance is 2.5 kPa. The other boundary conditions can be referred to the previous work [20].
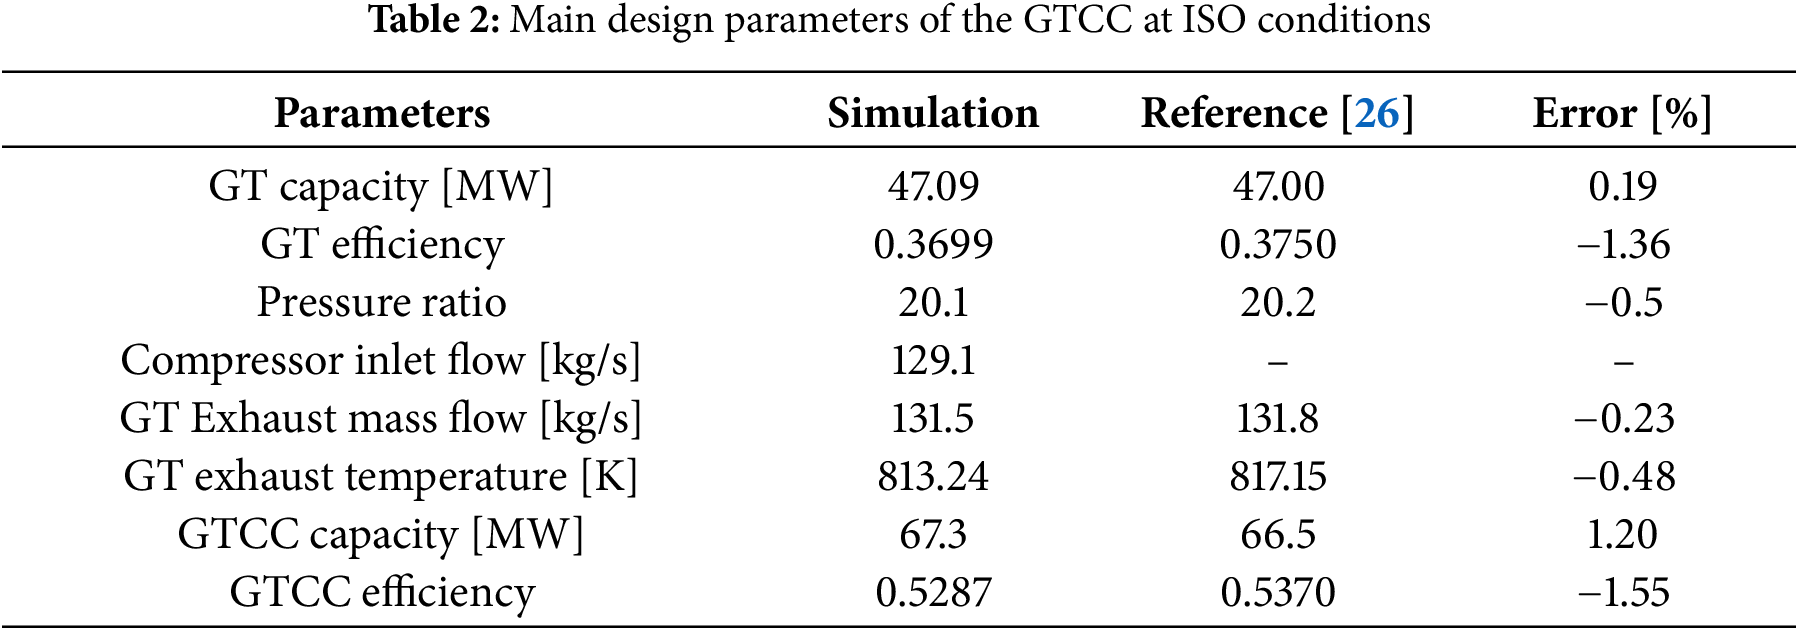
Additionally, in the bottoming cycle of the GTCC, the high-pressure steam pressure, temperature and the flow rate are designed as 6.9 MPa, 795.15 K and 15.96 kg/s, respectively. The low-pressure steam pressure, temperature and the flow rate are designed as 0.77 MPa, 490.95 K and 19.55 kg/s, respectively.
2.3.2 Basic Parameters of Air Compressor and Turbine in ACAES
The basic parameters of the compressor train are presented in Table 3, including the compression ratio, the air flow and the efficiency at the ambient conditions.
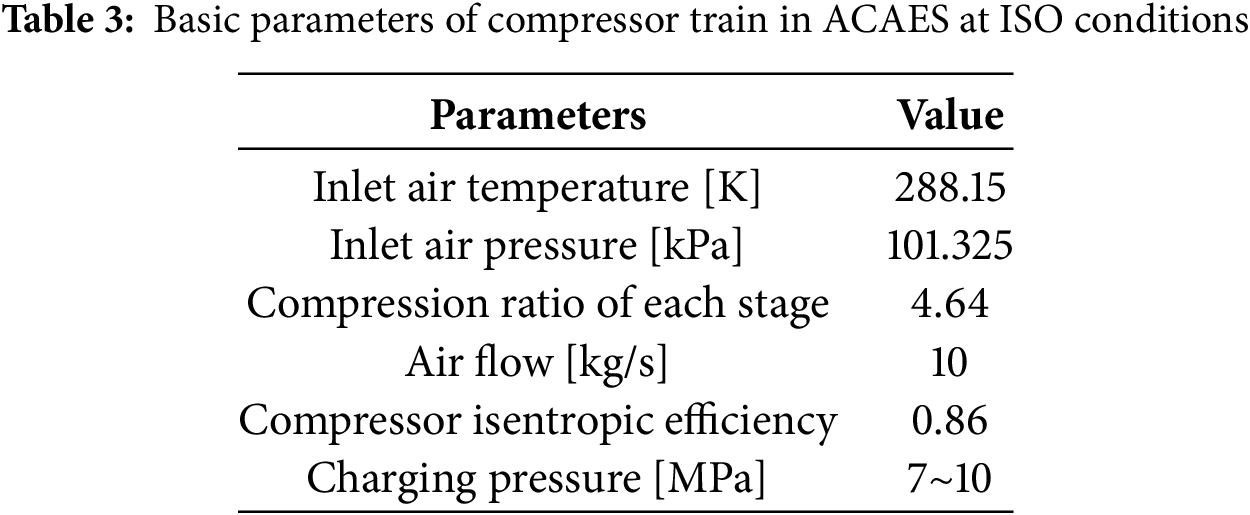
The air compressor train operates at a sliding pressure from 7 to 10 MPa, and the turbine train operates at the corresponding sliding pressure with consideration of pressure loss. In addition, the continuous charging time needs to be determined by the GTCC performance at a certain hourly load distribution. After the air coolers are designed, the pressure loss can then be determined. Consequently, the inlet air pressure of each compression stage, the volume of the air reservoir, and the charging power as well, can be decided.
The basic given parameters of the turbine train include the number of the expansion stage, i.e., dual stages expansion in CPG and triple stages in BS, and the isentropic efficiency is designed as 0.87. It should be noted that the other design parameters are to be determined by the collaborative mechanisms of the CPG and benchmark system.
2.3.3 Basic Parameters of Heat Exchangers
The heat exchangers include the air coolers, air reheaters and GT inlet air heater. In all the heat exchangers, a type of DY325 thermal oil is selected as the heat transfer medium, which properties can be obtained from [20].
In addition, aluminum alloy plate-fin heat exchangers with rectangular fins are selected for the air coolers, the reheaters, and GT inlet air heater as well. The basic structure sizes are presented in Table 4, which are the same with those in Ref. [20].
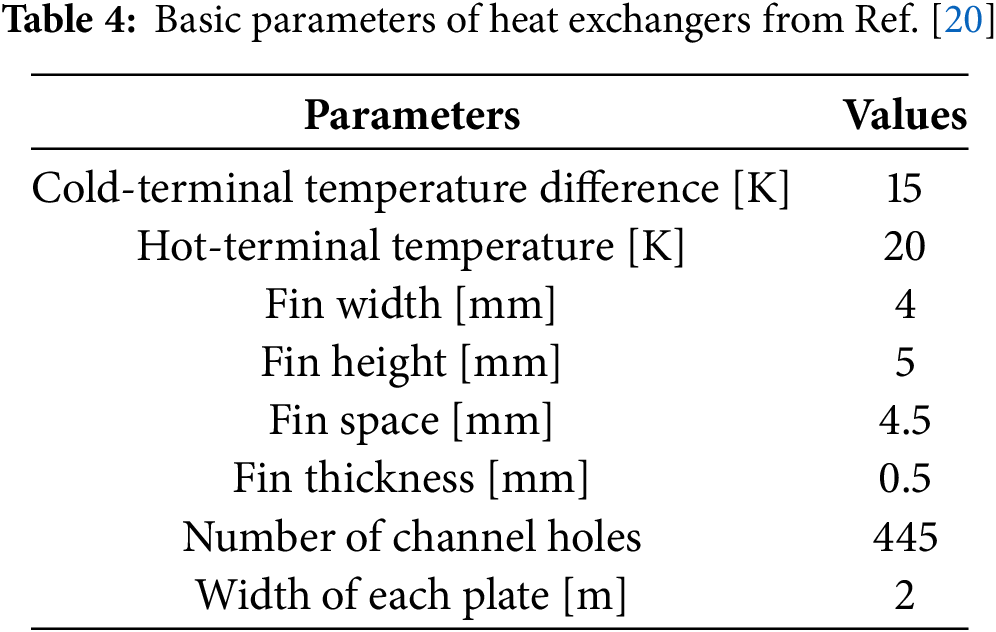
When the heating and cooling loads are determined based on the operating performance of the subsystems, the length of the flow channels and heat-exchanging areas can be further decided using energy balance and heat-exchange characteristics. Consequently, the oil-side flow and temperatures, and pressure losses at both sides as well, can be decided.
2.4 The Calculation Logic of the System
The calculation logic diagram is presented in Fig. 4. The GTCC operating performance is obtained through Thermoflow™ simulations under the boundary conditions. The GTCC performance, combined with ACAES components modelling and boundary conditions, provides the basis for determining the ACAES design and configuring the GTCC inlet air heating exchanger. On the basis of these models and evaluation indicators, the overall system performance of CPG and BS can be investigated and compared.
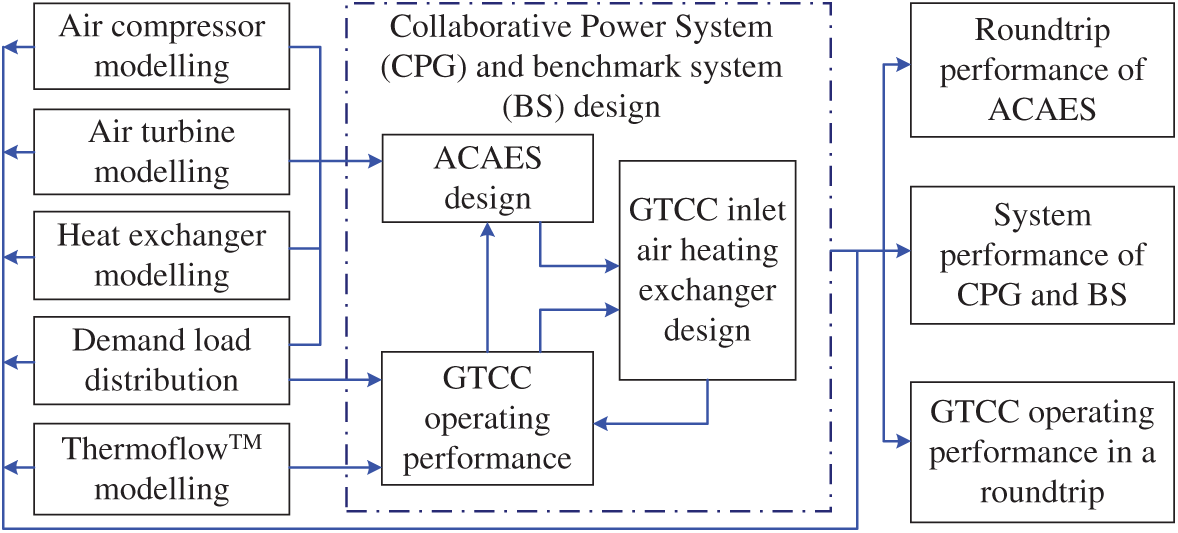
Figure 4: The calculation logic diagram
2.5.1 GTCC Evaluation Indicators
The load rate of GTCC (rcc) is defined as:
where, Pcc refers to the GTCC power load, [kW]; Pcc,max is the maximum output or capacity, [kW], mainly depending on the ambient conditions.
The operative efficiency (ηcc,operative) of the GTCC means the average operating efficiency during a roundtrip time tcycle. The operative efficiency can be written as [15]:
where, Pcc,net is the net power output of the GTCC, [kW]; mf is the fuel mass flow rate [kg/s]; qLHV is the lower heating value of the fuel, [kJ/kg]; Q̅IAH is the heat flow for GT inlet air heating, [kW], and Q̅IAH = 0 in the standalone GTCC and BS; t is the operating time. In the collaborative power generation (CPG) as sketched in Fig. 1, the GTCC meets the total demand of the external load (Pd), the power for driving the ACAES (Pcom,ACAES), and that for driving the oil pumps (POP) and air fan (PAF) as well. Hence, the GTCC output power Pcc can be expressed as:
As the oil pumps are configured nearly the same in the CPG and the benchmark system, and because the flow resistance and flow rate of the thermal oil is relatively low, the power for driving the oil pumps (POP) is ignored.
2.5.2 ACAES Roundtrip Efficiency
The roundtrip efficiency of the ACAES (RTE) is defined as [21]:
where, Pat,ACAES is the power output of the air turbines in the ACAES discharging process, [kW]; Pcom,ACAES is the power consumption of the compressors in the ACAES charging process, [kW]. The parameters tdis and tch refer to the discharging time and charging time, respectively.
The system efficiency of the collaborative power generation system, and the benchmark system (ηsystem) as well, is defined as the sum of the total power for the external user and the electricity grid divided by the energy consumed in a roundtrip, which is expressed as [20]:
It should be noted that, in the original standalone GTCC unit, the system efficiency is equivalent with the operative efficiency.
3 Operating Strategy of Collaborative Power Generation System
The control strategies of the collaborative power generation system (CPG) include: mode control, air-side temperature control in ACAES air coolers and reheaters, cold oil temperature control in the air heater.
3.1.1 Operating Mode and Selection Strategy
The control logic for mode selection is sketched in Fig. 5 using SAMA diagram.
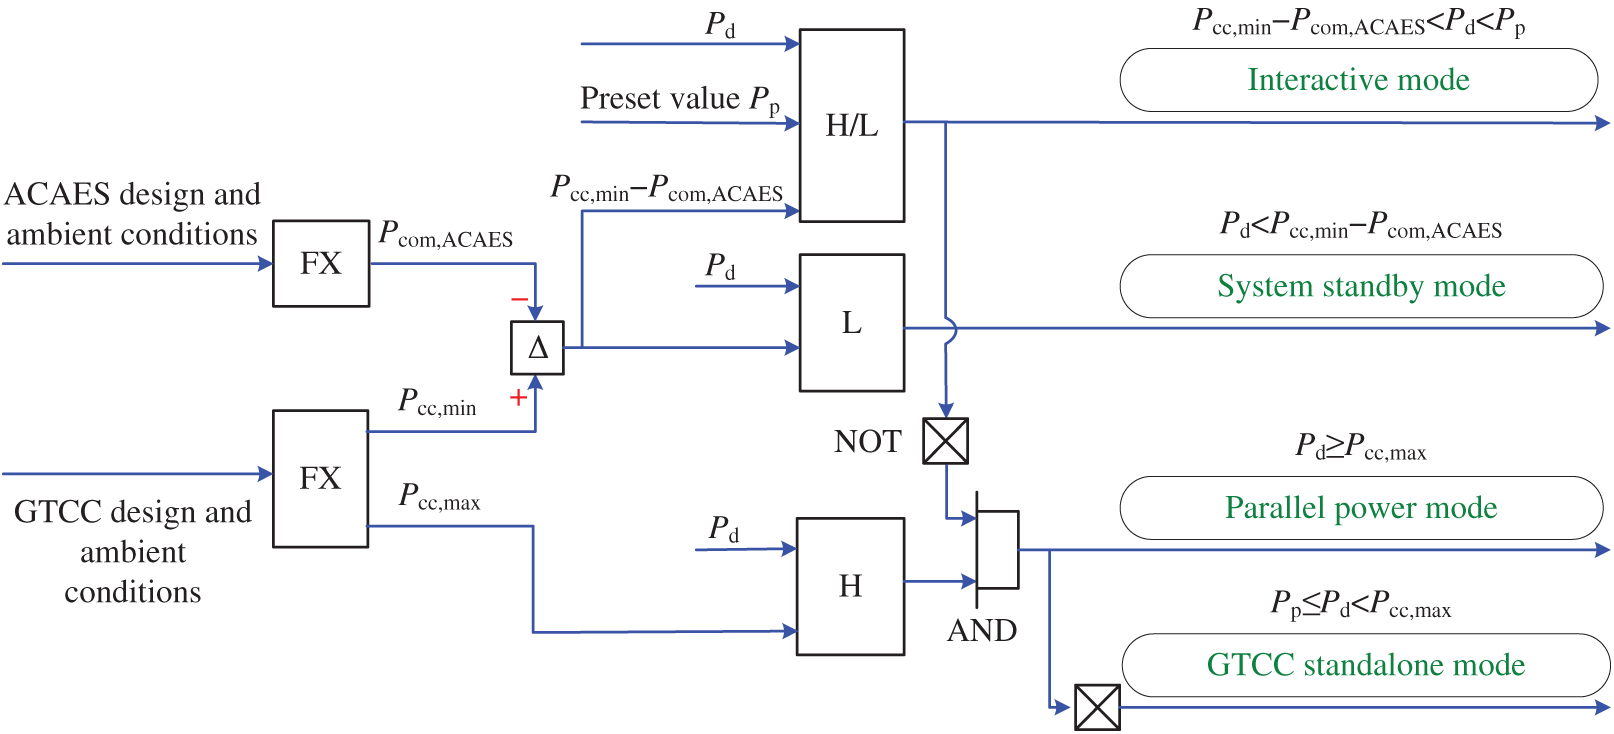
Figure 5: Control block for CPG operating mode selection
The additional power for driving the ACAES (Pcom,ACAES) depends on the designed parameters and the ambient conditions, and the similar in the GTCC technical power output (Pcc,min and Pcc,max). When presetting a critical power load (Pp) and giving the power demand (Pd), the operating mode selection of the system can be summarized as:
(i) The interactive mode functions at Pcc,min-Pcom,ACAES < Pd < Pp. The GTCC meets the external power demand at off-peak times, and drives the ACAES charging process as well, meanwhile the GTCC inlet air is heated using the ACAES residual compression heat;
(ii) The system standby mode is selected at Pd < Pcc,min-Pcom,ACAES. The GTCC and the ACAES stops working as the GTCC load is lower than the minimum technical power;
(iii) GTCC standalone mode is selected at Pp ≤ Pd < Pcc,max. The GTCC operates independently with ACAES standby;
(iv) Parallel power mode is selected at Pd ≥ Pcc,max. The GTCC operates at full load together with the ACAES power discharging to meet the peak demand. The ACAES generation power is received by the power grid.
It should be noted that, the similar three operating modes are applied in the benchmark system (BS). However, the difference in the BS lies in the mode (i), i.e., interactive mode, where the GTCC compressor inlet heating is not configured and the compression thermal energy is stored only for ACAES reheater.
3.1.2 Air-Side Temperature Control in the Heat Exchangers
In the air coolers (AC) of the ACAES, the AC exhaust air temperature is control as 15 K bias against the cold oil temperature, through regulating the oil flow rate. While in the air reheaters (RH), the RH exhaust air or turbine inlet air temperature is control as 20 K below the hot oil temperature.
In the GT compressor inlet air heater (AH), the exit air temperature is controlled by the hot oil flow, and the air fan operates at full rotational speed. The exit preheated air is then mixed with the ambient air, and suctioned by the GT compressor. A practical power project was reported in the Middle East area installed with SGT-800 gas turbine at the ambient temperature of 323.15 K [27]. Hence, the GTCC compressor inlet air is controlled below 323.15 K for safety margin.
The cold oil temperature and hot oil temperature vary with the ambient conditions. They arrive at decidable values according to the mass balance, energy conservation and heat-transfer characteristics. However, in the GTCC compressor inlet air heater (AH), the exit oil temperature is controlled as a target value, i.e., 15 K bias against the ambient temperature, through regulating the oil flow. The oil temperature in the cold oil tank at the start of the charging process is initialized as 5 K above the ambient temperature, which would need additional heating or cooling through auxiliary heat exchangers.
3.2 Time-Sequential Allocation of Hot Oil Flow for GTCC Inlet Air Heating
When an ACAES has been designed in collaboration with a certain GTCC power unit according to the typical power load distribution at given ambient conditions, the following performance can be obtained including:
(1) The ACAES continuous charging time (tch), discharging time (tdis);
(2) The operating performance of the ACAES, including the charging power consumed by the compressor (Pcom) and the residual compression heat (Qh,r) between the working processes;
(3) The operating performance of the GTCC including the part-load air mass flow (ma,cc).
The residual compression thermal energy of the CAES is mainly reflected in the mass of residual oil (Moil,r), which can be determined by:
Hence the residual compression heat of the ACAES (Qh,r) can be decided by:
where, moil,hot and moil,cold refer to the oil mass flowrate in the ACAES air reheater and air cooler, respectively, kg/s; Toil,cold and Toil,hot are the oil temperature in the tanks, K.
For the convenience of description, a time step Δt can be applied to simulate the operating performance of the ACAES. In the calculations of program, the parameters of the ACAES within each Δt are regarded as equal parameters, which are then transferred to the next Δt for continuous calculation. Eventually, an entire charging or discharging process is obtained.
The total step number during the ACAES charging is denoted by k, where k equals the rounding of tch/Δt + 0.5 and the final step needs to consider the air mass balance in the ACAES processes.
At a given power demand distribution, the GTCC time-sequential power load (Pcc) is the sum of the ACAES charging power (Pcom,ACAES) and the external demand load (Pd), which can be written as a matrix:
According to GTCC performance, the time-sequential inlet air flowrate (ma,cc) can be obtained and written as:
The accumulated air mass can be calculated by Ma,cc = sum(Δt·ma,cc,j). An allocation factor matrix X of the residual compression heat can be applied according to the time-sequential air mass proportion:
where, the subscript i means the time sequential number and j = 1, 2, 3, …, k.
A correction factor matrix F is additionally introduced, preventing inlet air temperature from overheating above 323.15 K and assuring the maximum GTCC capacity can meet the power demand:
where, the time-sequential correction factor Fj > 0 and the initial value is set as Fj = 1. The product F·X can be called allocation proportion.
Hence, every time-sequential thermal energy (QIAH,j) and oil mass flowrate (moil,AH,j) for the GTCC compressor inlet heating are decided by:
where, Toil,AH,out is the exit oil temperature in the GTCC compressor inlet air heater (AH), which is controlled to be 15 K bias against the ambient temperature.
According to the energy balance and the GTCC part-load performance, the time-sequential GTCC inlet air temperature (Tin,j) and the corresponding power capacity (Pcc,max,j) can be obtained. Under the constraints of Tin,j ≤ 323.15 K and Pcc,max,j ≥ Pcc,j, a solution of the correction factor matrix F, and the oil mass flowrate (moil,AH,j) for IAH as well, can be obtained. Please note, there would be a further optimization on the time-sequential allocation of the hot oil flow for GTCC inlet air heating, which is not to be discussed in this work.
4 Off-Design Performance of Subsystems
(1) The GTCC minimum power is set as 30% of the capacity, ensuring the combustion stability.
(2) The kinetic energy, heat loss and leakage in the pipelines and the tanks are ignored.
(3) The power consumed by the oil pumps is ignored, since the power for oil transmission is only a few percent of the air, even if 10 m hydraulic head in addition to the flow resistance is considered.
(4) The maximum inlet air temperature of the GT compressor is deemed as 50°C or Tin ≤ 323.15 K, which is still within the permitted operation range of SGT-800 unit [27].
(5) The mole fraction of the air is: 78.0840% N2, 20.9476% O2, 0.9340% Ar, 0.0344% CO2.
(6) The discharging power of ACAES is completely received by the grid.
4.2 GTCC Off-Design Performance
The GTCC subsystem is based on a commercial SGT-800 gas turbine coupled with a due-pressure non-reheating bottoming cycle. The design model simulated by GT-PRO can be imported into THERMOFLEX to simulate the off-design performance [28,29].
The full-load performances of the GTCC, and the simple-cycle GT as well, at various inlet air temperatures are presented in Fig. 6a. It indicates that the simulated GT performance agrees well with that in Reference [26]. On average, the GTCC full-load capacity reduces by 0.46%, while the GTCC power efficiency varies slightly with every 1°C increment in the GT compressor inlet air temperature (Tin). The compressor inlet air flow decreases with the rise of Tin, which shows a similar variation trend with the GTCC capacity.
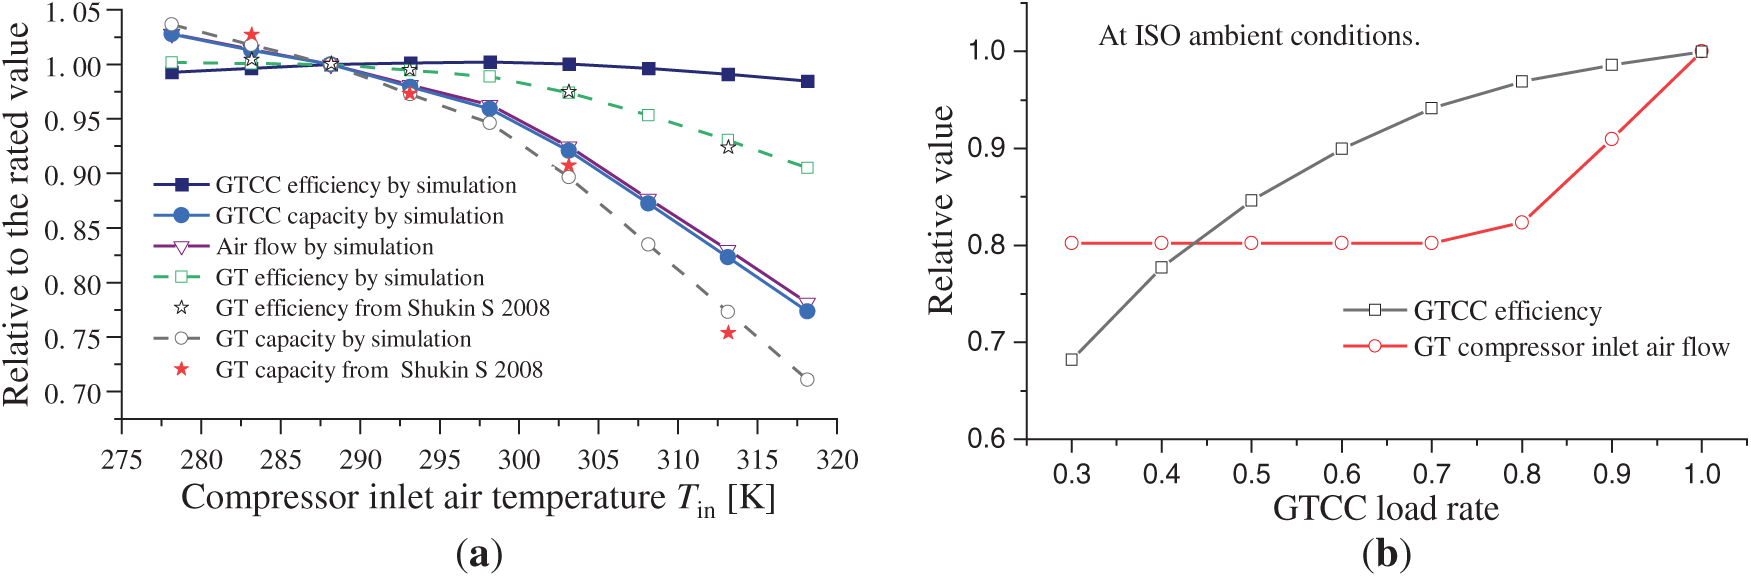
Figure 6: GTCC operating performance. (a) Full-load performance [26]; (b) Part-load performance
The GTCC power efficiency, and air flow rate as well, at various partial loads are presented in Fig. 6b, where the relative performance is defined as the operating values divided by the full-load ones. It can be indicated that the GTCC power efficiency relatively drops by 1.92% per 10% reduction in the load rate at the load rate above approximately 0.7, whereas it rapidly declines by 7.21% for load rates from 0.3 to 0.7. Hence, operation at high load rate is in favor of the GTCC efficiency. Hence, the charging process of the ACAES is to be collaborated and driven when the GTCC demand load is below 70% of the capacity. In other words, the critical power load (Pp) in Fig. 5 can be preset as 0.7.
It can be also seen from Fig. 6b that, at the load rate below approximately 0.7, the gas turbine operates at nearly constant air flow rate, this is because the GT compressor inlet guide vane remains at the minimum open at low loads. At the load rate above approximately 0.7, the GT compressor air flow rate rises with the GTCC load rate increment, owing to the increase in the inlet guide vane open. It should be noted that, Fig. 6b exhibits a typical part-load performance of GTCC power units configured with compressor inlet guide vanes.
The operating efficiency of the GTCC at specified power loads at various GT compressor inlet air tempertures (Tin) is presented in Fig. 7. As can be seen that, at a specified power load, the higher temperature of the compressor inlet air is, the higher efficiency of the GTCC unit can achieve. This is because the compressor inlet air temperature exerts a weak impact on the GTCC efficiency, whereas it significantly inlfuences the power capacity and hence alters the load rate at the specified power demand. This is the principle of the efficiency improvement of a GTCC unit with compressor inlet air heating at partial loads. For example, if the demand power of the GTCC is specified at pd = 38.86 MW, the GTCC full load power Pcc,max = 67.3 MW at Tin = 288.15 K, and Pcc,max = 51.83 MW at Tin = 318.15 K. The corresponding GTCC load rate rcc = 0.5774 and power efficiency ηcc = 0.4777 at Tin = 288.15 K, while rcc = 0.75 and ηcc = 0.5010 at Tin = 318.15 K. An increment of 2.33 percentage points in the power efficiency can be achieved when the GT compressor inlet air temperature is heated from 288.15 K to 318.15 K.
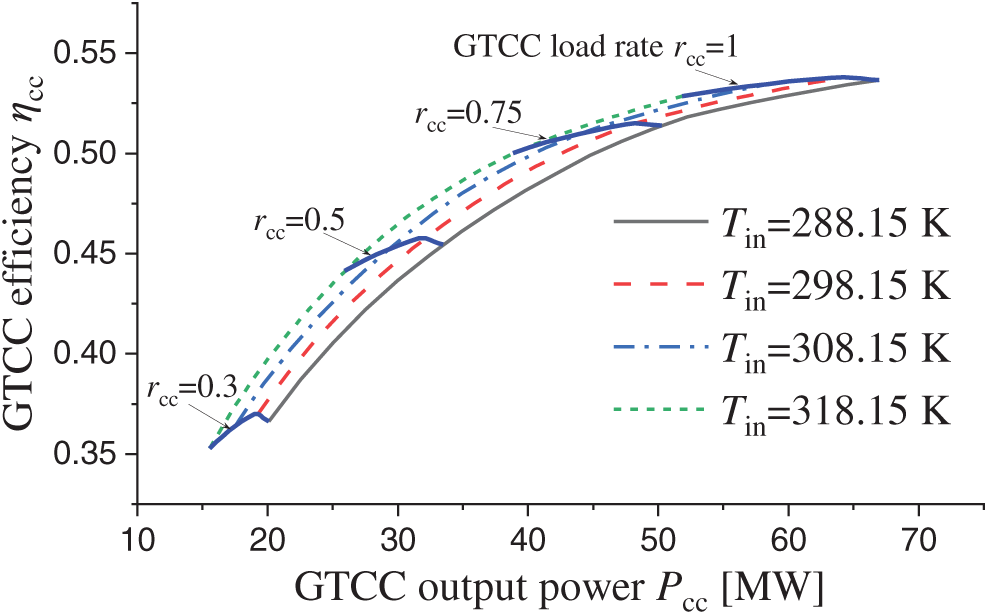
Figure 7: GTCC part-load performance at various inlet air temperatures
Appling the typical performance solution of centrifugal compressors [30], the performance map can be plotted in Fig. 8, where the relative pressure ratio and efficiency are defined as the operating value divided by the rated.
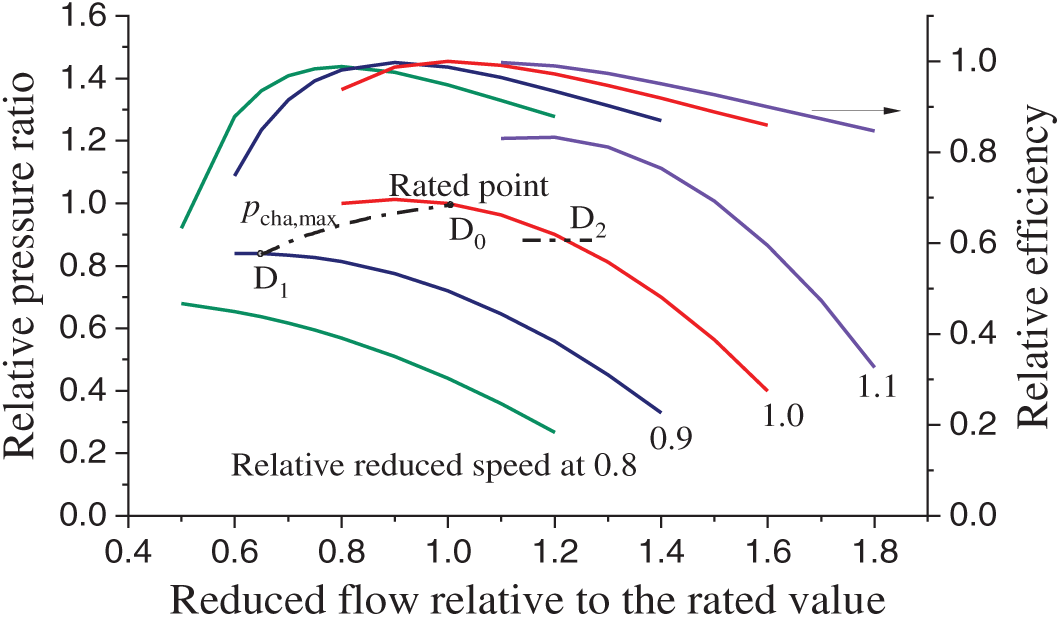
Figure 8: Typical operating performance of centrifugal compressors
The maximum air pressure is designed as pmax,0 = 10,000 kPa, which varies with the inlet air temperature and pressure at the rated speed. The curve D1–D0 indicates the maximum pressure variation with the relative reduced speed when considering the safety margin of the compressor surge, which can be approximately expressed as [20]:
where, Tin is the ACAES compressor inlet air temperature, [K]. The constants c1 = 65.78610, c2 = −0.66382, c3 = 2.22705e−3, c4 = −2.5926e−6.
In addition, the ACAES charging and discharging processes operate at sliding pressure, and the minimum pressure is set as 7 MPa at on-design and off-design conditions. The point D2 in Fig. 8 represents for the minimum pressure ratio at ISO ambient conditions and rated rotation speed.
Using the equations proposed by Zhang and Cai [30] and Flügel formula, the typical part-load performance map of the air turbines can be plotted in Fig. 9. The relative parameters are similar with those defined in the compressors.
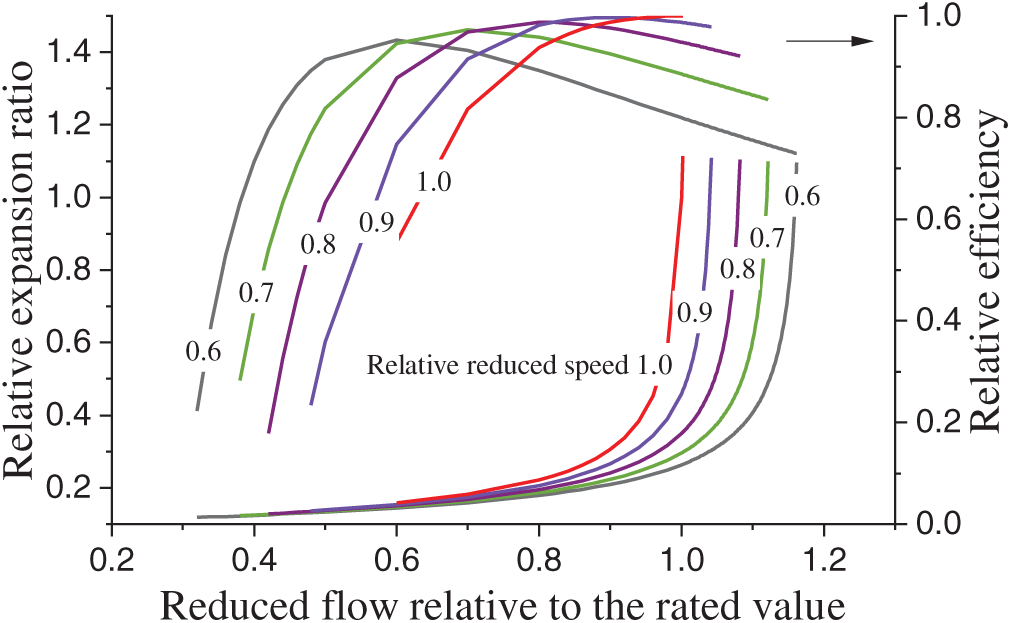
Figure 9: Typical off-design performance map of air turbines
4.3.3 Performance Model for Heat Exchangers
Plate-fin heat-exchangers are selected for the air coolers, reheaters and GT compressor inlet air heater. The heat transfer coefficient U [W/(m2·K)] can be obtained by the correlation formulas [31].
The heat transfer coefficient U [W/(m2·K)] can be obtained through Nusselt number (Nu):
where, λ is the heat conductive coefficient [W/(m·K)], de is the equivalent diameter and de = 4.444 mm according to Table 4.
Ignoring the local resistance at the inlet and outlet of the fluid, the flow resistance [Pa] caused by the heat-exchangers can be calculated by:
where, ρ is the density of the fluid [kg/m3]; u is flow velocity, [m/s]. Le is the length of fin channel, which is determined in the system design procedure.
Ignoring the resistance of conduction and fouling, the complex heat-transfer coefficient can be determined by:
where, Fair and Foil refer to the heat-exchange areas [m2] on the air side and the oil side, respectively.
5 Design for Collaborative Power Generation System and Benchmark System
5.1 Determination Methods of ACAES Parameters
The initialized cold oil temperature Toil,cold = Ta + 5 K based on the oil temperature control as described in Section 3.1.3. The continuous charging time tch and discharging time tdis can be determined according to an hourly demand load distribution, which is to be given in Section 5.3.
For each compressor stage, the exhaust temperature Texh.com and power consumption Pcom can be decided by:
where, e refers to the specific enthalpy of air, which is a function of air pressure and temperature. The efficiency ηcom and air mass flow rate mcom have been given in Table 3. The subscript s means isentropic process.
At the air temperature control, i.e., Tcom,in = Ta for 1st compression stage while Tcom,in = Toil,cold + 15 for the rear stages, the oil flow rate from the air coolers moil,hot, and the heat-exchanging area can be determined according to energy balance and heat transfer characteristics. At the terminal of charging process, the other air-side and oil-side parameters can be accumulated, including the air reservoir temperature, volume and total air mass (Ma,AR), terminal hot oil temperature, hot oil tank volume and total mass (Moil,hot). The total charging work (Wch) consumed by the ACAES compressor train can also be accumulated.
While ACAES discharging, the expansion air flow rate mat is constrained by the air mass balance, i.e.,
where, mdis refers to the discharging air flow rate (mat = mdis); mch is the charging air mass flow rate (mch = mcom).
For each turbine stage, the exhaust air temperature Texh.at and power output Pat can be decided by:
At the air temperature control, i.e., Tat,in = Toil,hot + 20, the oil flow rate from the air reheaters moil,cold, and the heat-exchanging area can be determined. At the terminal of discharging process, the other air-side and oil-side parameters can be accumulated, including total cold oil mass (Moil,cold) and discharging work (Wdis).
5.2 Design Methods of GT Compressor Inlet Air Heater
The hot oil temperature has been decided in Section 5.1. Based on the given general parameters in Section 2.3, the AH design can be carried out subject to the oil temperature control (see Section 3.1.3) and the subsystem performance (see Section 4). In the design, the heating objective is set as Tin = 313.15 K at Ta = 288.15 K and GTCC load rate rcc = 0.7. Consequently, the AH design parameters can be decided, including the AH heat exchanging area AAH, designed oil flow moil,AH,0, flow resistance and air fan power PAF,0.
5.3 GTCC Hourly Demand Load Distribution
As an example, the hourly demand load distribution of the GTCC unit is presented in Fig. 10, which is similar with that in the scenario of hotel buildings [20,32].
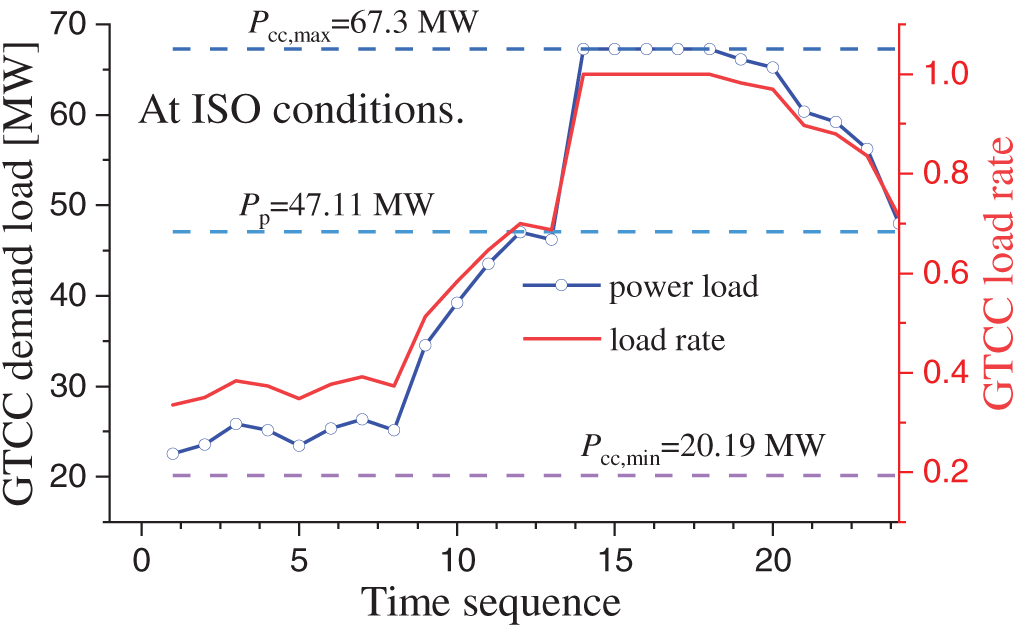
Figure 10: GTCC hourly demand load distribution
In a typical day at Ta = 288.15 K, the original standalone GTCC operates at the power load ranging from 20.19 to 47.11 MW, or load rate from 30% to 70%, during 1:00 to 13:00; whereas operates at the full load of 67.3 MW during 14:00 to 18:00. The daily average load rate is 0.6775. As demonstrated in Section 4.2, the power load for driving the ACAES charging process can be preset as Pp = 47.11 MW. Hence, the continuous charging time is designed as tch = 13 h and the discharging time tdis = 5 h at ISO ambient conditions. Under these boundary conditions, the design of the integrated systems can be fulfilled.
At this stage, based on Eqs. (20)–(24), the ACAES parameters, including those of the compressor train and turbine train, in the CPG and BS, can be obtained and summarized in Table 5.
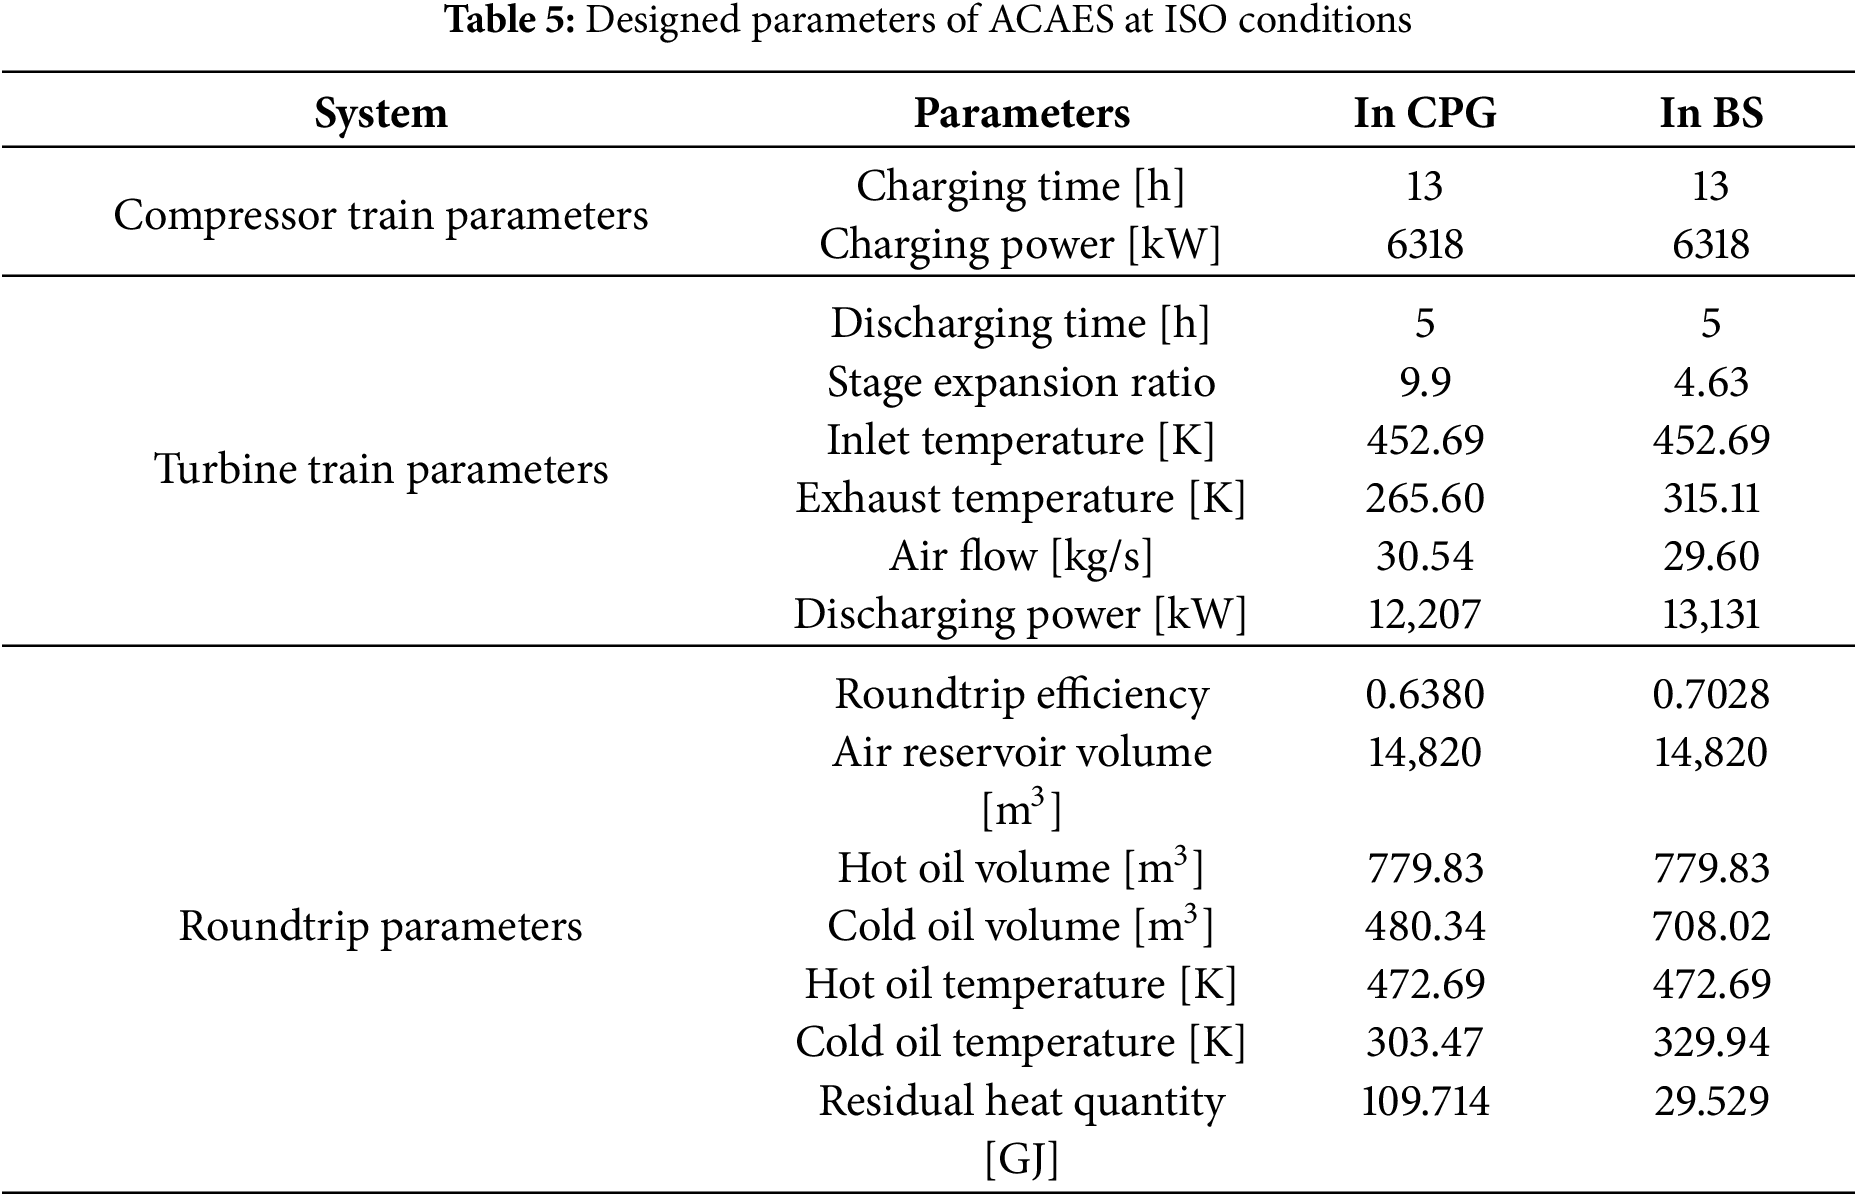
The charging time tdis is designed since the time when the GTCC load rate below 0.7 is accumulated as 13 h. The charging power of the compressor train amounts to 6318.38 kW, which is 9.388% of the GTCC capacity at ISO conditions. The roundtrip efficiency in CPG is 0.6380, which is considerably lower than that in BS because of the less discharging power by the less expansion stages.
The roundtrip design performance is also presented in Table 5. The cold oil volume is the accumulation of the hourly oil flow required for the air reheaters. In addition, the cold oil temperature as listed in Table 5 means the accumulation value at the terminal of the expansion process. To continue the next roundtrip of the ACAES, the cold oil needs to be cooled by the auxiliary heat exchangers and initialized as 5 K above the ambient temperature, i.e., 293.15 K.
5.4.2 Designed Parameters of Heat Exchangers
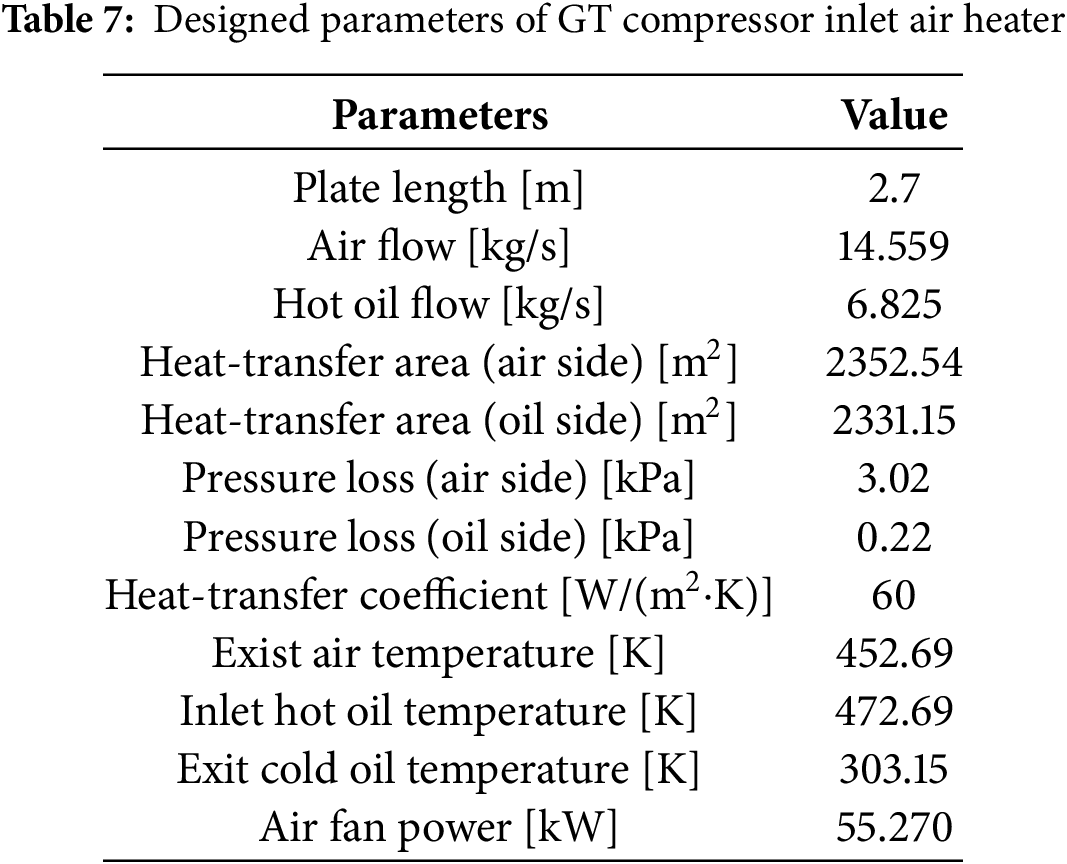
The designed parameters of the heat exchangers, including the air cooler and reheater, and GT compressor inlet heater as well, are summarized in Tables 6 and 7 based on Eqs. (17)–(19).
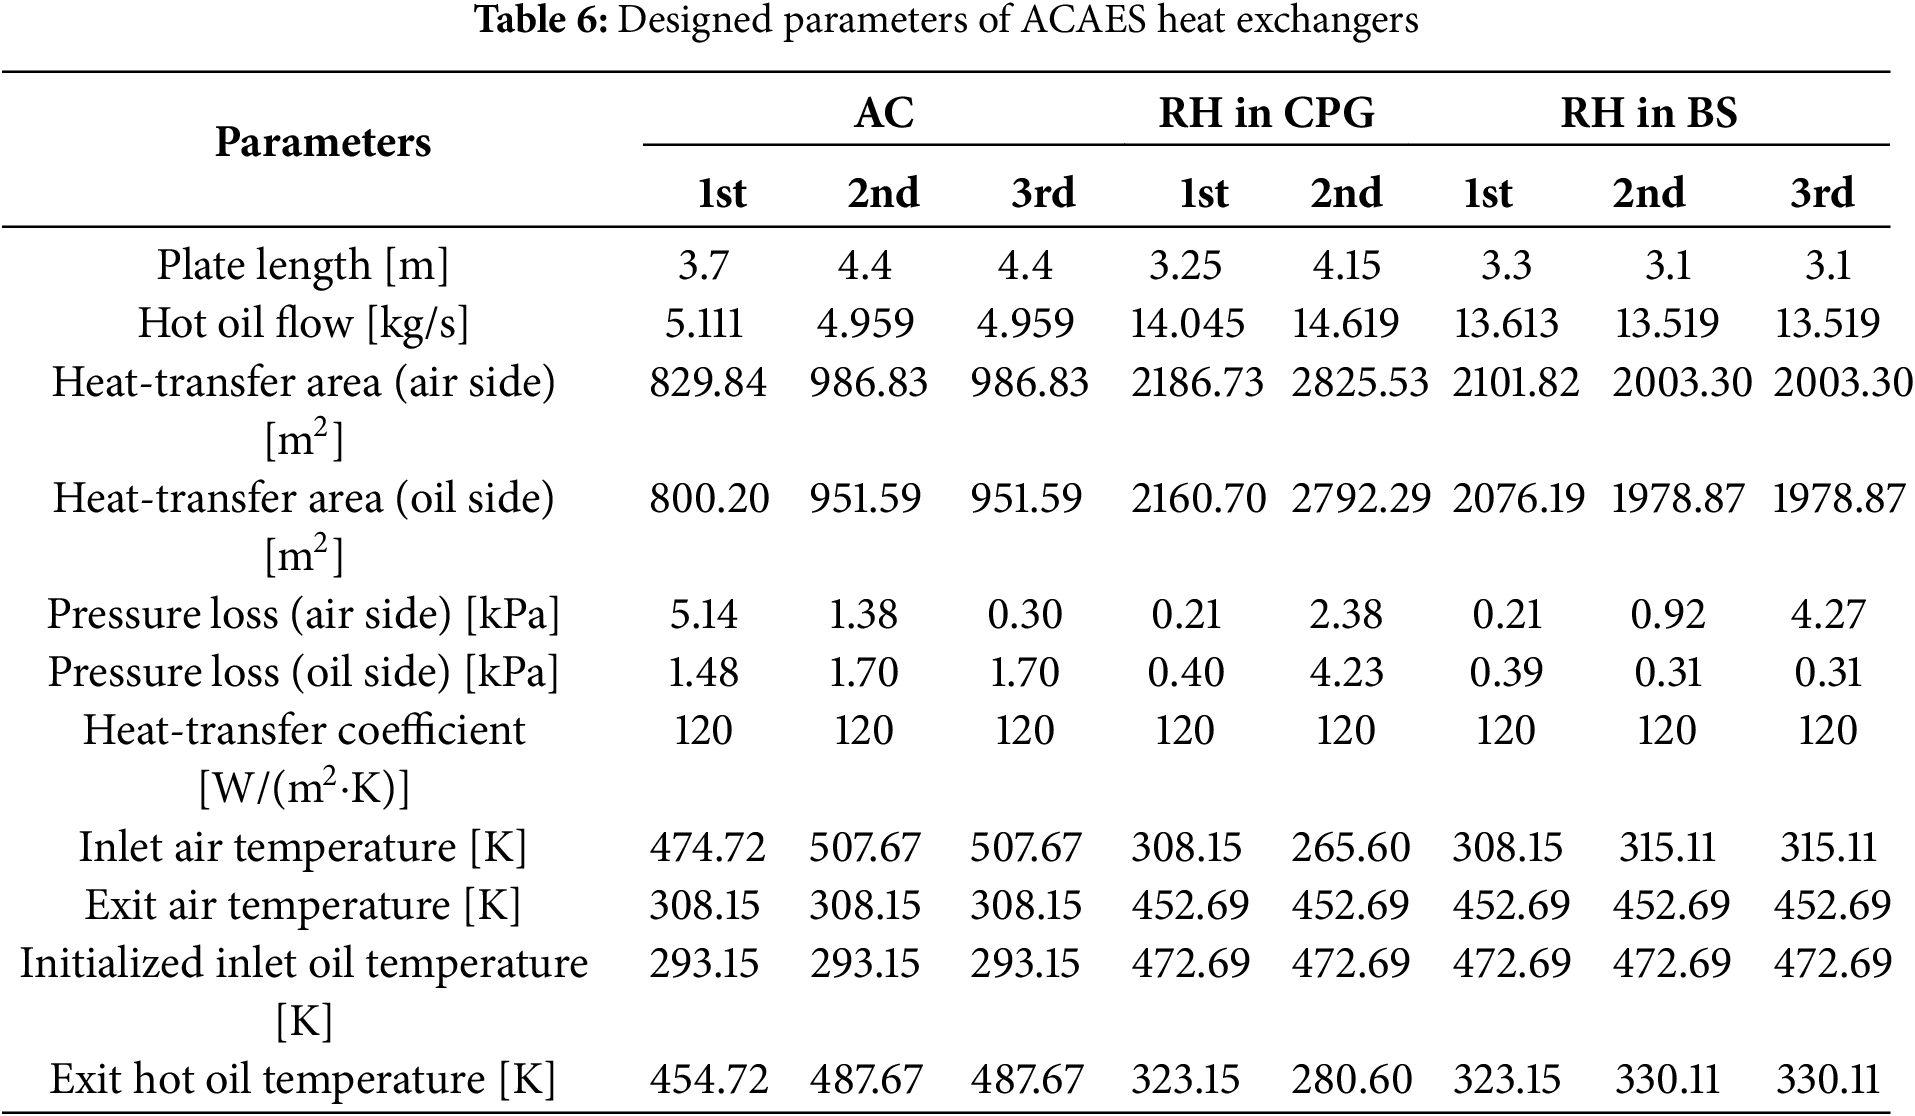
The designed parameters of air coolers (AC) are presented in Table 6. The heat-transfer coefficients are uniformly designed as 120 W/(m2·K). The inlet cold oil temperature is initialized as 5 K above the ambient temperature, i.e., 293.15 K, while the AC cold-terminal temperature difference is controlled as 15 K. As the air flow and AC inlet air temperature have been determined in the compressor train, the heat-exchanging area, the required oil flow and exit temperature can be therefore decided. It should be noted that, the exist oil temperatures in the three stages are 454.72, 487.67 and 487.67 K, respectively, which show difference from the accumulated roundtrip hot oil temperature as listed in Table 5. This is because the charging process operates at sliding pressure. During charging, the ACAES compressor exhaust air temperature and the exit hot oil temperature both rise with the back pressure rising from the minimum 7 MPa to the maximum 10 MPa. At the terminal charging pressure of 10 MPa, the exit oil temperature of the 3rd air cooler arrives at 487.67 K. The hot oil flow from each AC stage accumulates in the oil tank and the terminal hot oil temperature arrives at 472.69 K as listed in Table 5.
The designed parameters of air reheaters (RH) are also presented in Table 6. Similarly, the heat-transfer coefficients are also uniformly designed as 120 W/(m2·K). The inlet hot oil temperature is decided by the thermal accumulation during the charging process as listed in Table 5, meanwhile RH hot-terminal temperature difference is controlled as 20 K. As the air flow and RH inlet air temperature have been determined in the turbine train, the heat-exchanging area, the required oil flow and exit oil temperature can be therefore decided. Distinctively, the oil-side pressure loss in the second stage of RH becomes greater, because of the low temperature and high viscosity. Please note, the exit oil temperature in the CPG secondary stage is 280.60 K, which is below the ambient temperature resulting from the ACAES exhaust cooling energy. The cold oil flow from each RH stage accumulates in the oil tank and the terminal cold oil temperature reaches the values of 303.47 K at CPG and 329.94 K at BS, respectively, as listed in Table 5.
The designed parameters of GT compressor inlet air heater (AH) are presented in Table 7. Dissimilarly, the heat-transfer coefficients of AH are designed as 60 W/(m2·K), which is lower than those in AC and RH due to the lower air density and avoiding excessive flow resistance. The exit oil temperature is controlled as a 15 K above the ambient temperature, through regulating the oil flow. The target of the exit air temperature is designed for heating the GT inlet air from the ambient (Ta) to 313.15 K at GTCC load rate rcc = 0.7. At this stage, the air mass flow at rcc = 0.7 and Ta = 288.15 K can be decided according to GTCC operating performance. Consequently, the heat-exchanging area, the required oil flow rate and AH air flow rate can be decided. Please note, the pressure loss in AH at oil side is much less than that at air side, and the mass oil flow is below half of the air mass flow. This means negligible power required for the oil transmission. In the design, the air fan efficiency is deemed as 0.8. Hence, the air fan power is designed as 55.270 kW, which is supplied by GTCC. Please note, the operating power of the air fan varies with the AH pressure loss. However, the AH air flow at off-design conditions varies little. Therefore, the operating efficiency of the air fan is deemed as constant.
6 Operating Performance of Systems
6.1 ACAES Operating Performance
The charging performance at various ambient temperatures is shown in Fig. 11, where the relative value is defined as the operating parameter divided by the designed one. The designed parameters can be referred to Section 5.4. The air storage reservoir is designed in constant volume, and the compressor train operates at sling pressure from the minimum 7 MPa to the maximum as decided by Eqs. (15) and (16). Hence, the charging time decreases with the increment in the ambient temperature, because the air density in the reservoir decreases with the rise in the storage air temperature. For example, the charging time tch = 13 h at ISO conditions, whereas decreases by 6.775%, i.e., tch = 12.12 h at the ambient temperature Ta = 308. 15 K. The hot oil temperature linearly rises with the increment in the ambient temperature, mainly because the ACAES compressor exhaust temperature rises under the control strategy, and additionally because the compressor efficiency lessens at higher ambient temperatures. To sum up, The higher ambient temperature results in lower air mass flowrate of the compressor train and less charging time as well. Consequently, the accumulated charging work, and the terminal hot oil mass as well, also decrease.
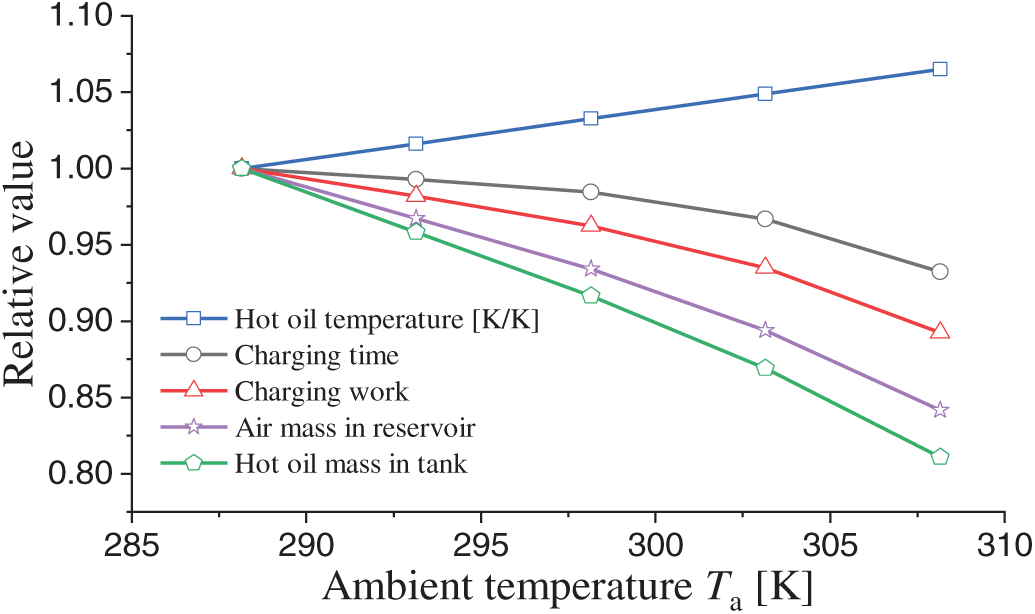
Figure 11: Charging performance at various ambient temperatures
The discharging performance in the different systems is presented in Fig. 12. It indicates a similar variation trend in the off-design parameters with that in the charging process. At the terminal discharging state, except that the cold oil temperature (Toil,cold) rises with the increment in the ambient temperature Ta, the other parameters, including total discharging work (Wdis), discharging time (tdis) and cold oil mass (Moil,cold), all decline with Ta rising, as can be seen from Fig. 12. In addition, the relative parameters in CPG correspondingly overlaps with those in BS. Please note, the absolute values are very different. For example, the total discharging electric work (Wdis) at ISO conditions in CPG is 51.445 MWh, which is 9.211% lower than that value of 56.665 MWh in BS.
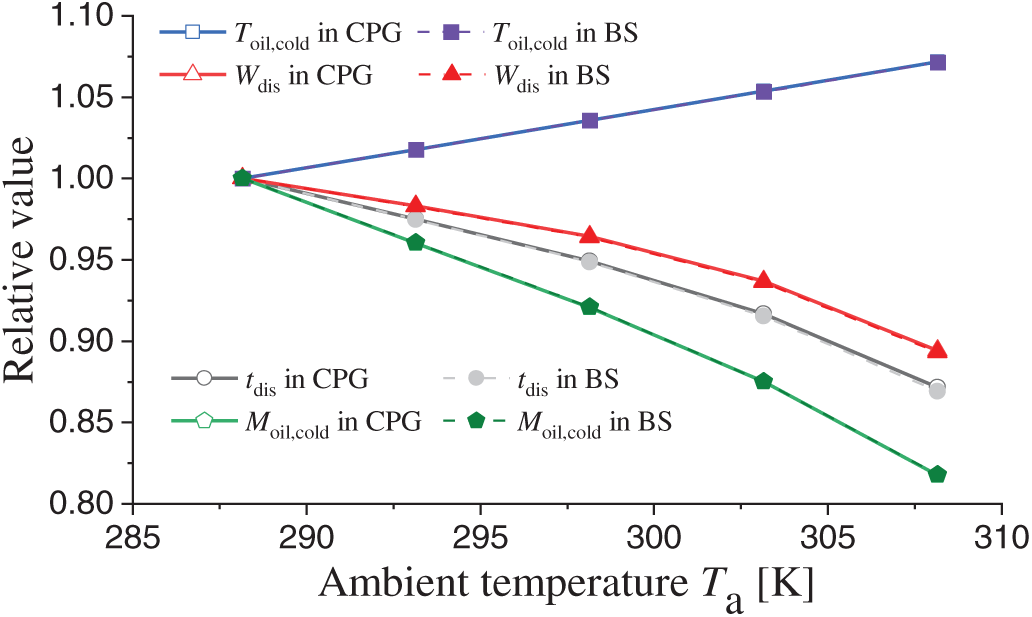
Figure 12: Discharging performance of ACAES
The roundtrip performance of the ACAES in the different systems at various ambient temperatures is shown in Fig. 13. As can be seen that, the ACAES roundtrip efficiency (RTE, calculated as per Eq. (5)) in CPG is obviously lower than that in BS, with an average bias of 6.44 percentage points. This is because the discharging work in CPG is lower than that of BS, as stated in Section 6.1.2.
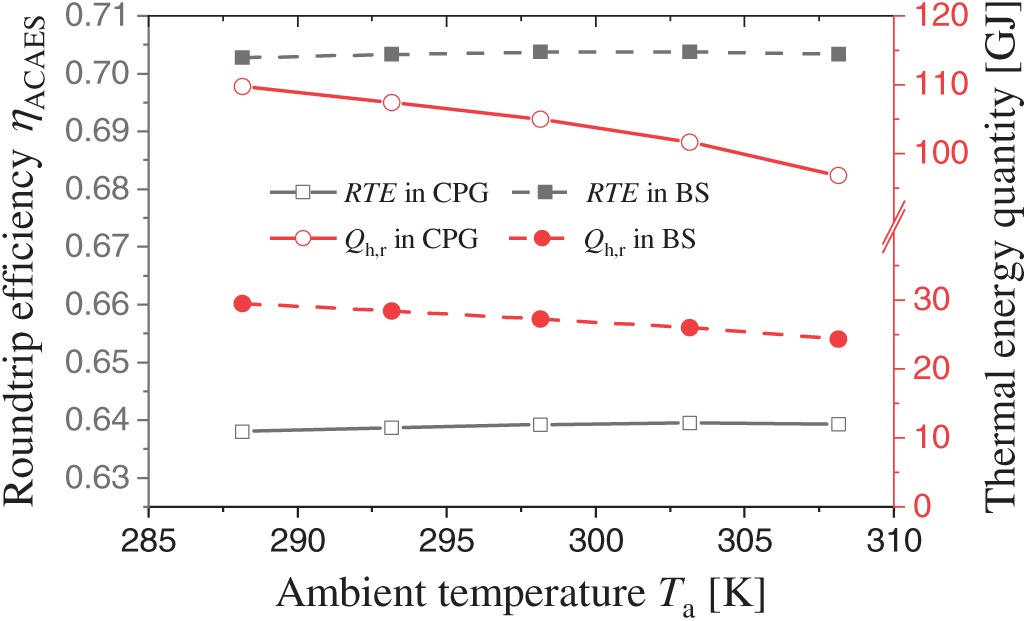
Figure 13: ACAES roundtrip performance
The ACAES roundtrip efficiencies in the both systems slightly increase and then smoothly drop with the rise in the ambient temperature, owing to the air temperature control strategies and variation in the roundtrip time. For example, with the ambient temperature increasing, both the hot oil temperature and turbine inlet air temperature rise, which exerts positive influence on the expansion work although does negative impact on the compressor work.
The residual heat (Qh,r) in the hot oil tank considerably decreases with the rise in ambient temperature, because of the lower air mass flow and shorter roundtrip time at higher ambient temperatures.
6.2 GTCC Operative Performance in a Roundtrip
(1) Hourly allocation of residual compression heat for IAH
According to the time-sequential allocation of residual compression heat for IAH as described in Section 3.2, specifically Eqs. (7)–(14), the hourly allocation proportion (F·X) at various ambient temperatures is presented in Fig. 14.
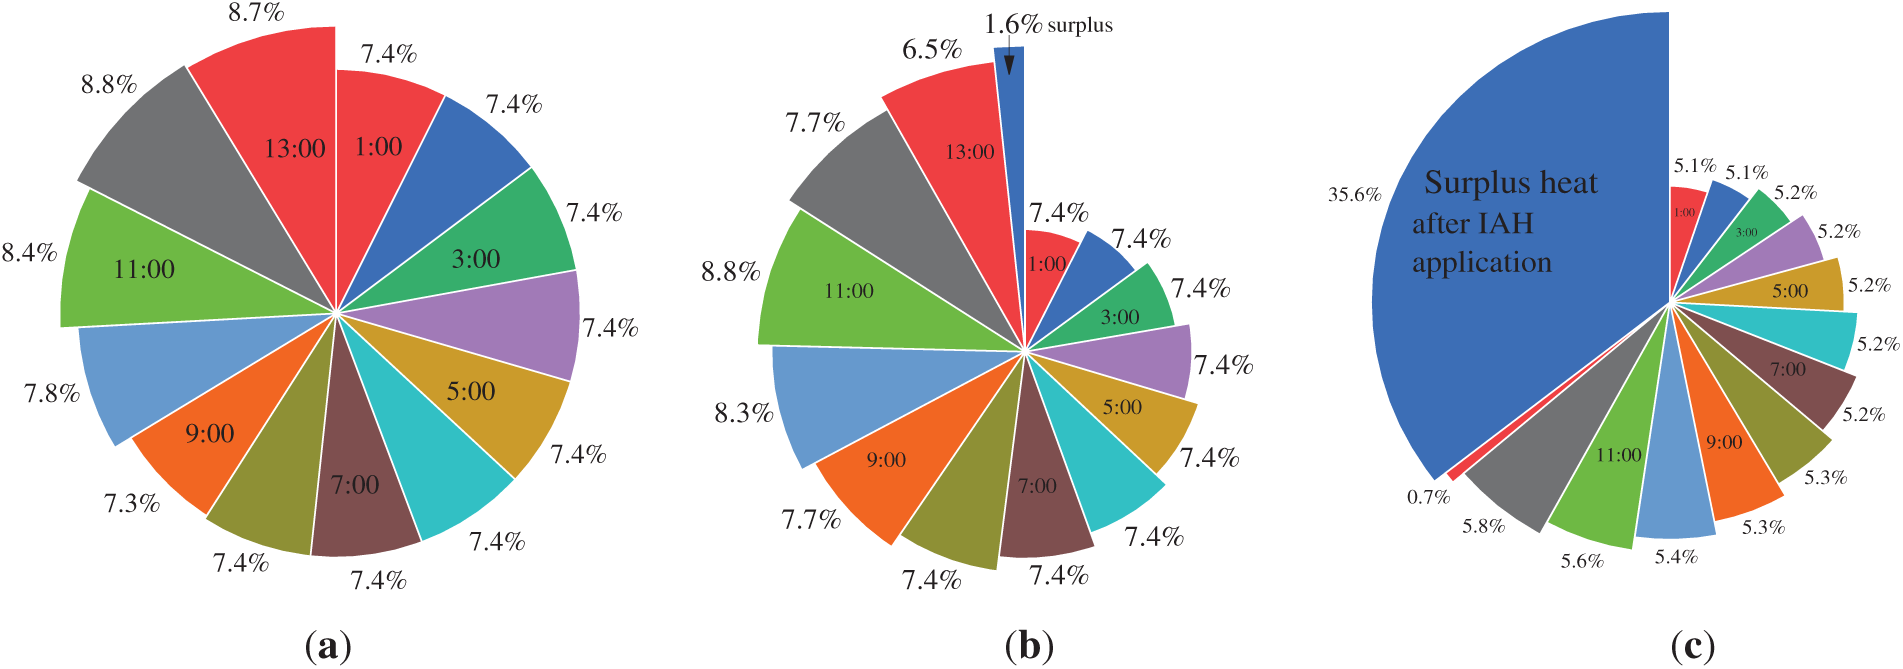
Figure 14: Hourly allocation of residual compression heat. (a) Ta = 288.15 K; (b) Ta = 298.15 K; (c) Ta = 308.15 K
It can be seen form Fig. 14 that, most of the allocation proportions at the time sequences are nearly equal. This is because the GTCC operates at nearly constant inlet air flow at the load rate below 0.7, as can be referred to Fig. 6b. However, at the final hour of the ACAES charging process, the GTCC AH is allocated with more heat proportion, because the inlet air flow increases, and additionally because the GTCC load rate is enhanced above 0.7 owing to the GT compressor inlet air heating. At the terminal of the ACAES charging process, the required heat for IAH, i.e., 6.5% in Fig. 14b and 0.7% in Fig. 14c, drops sharply because the final time-sequence is less than one hour. The greater the ambient temperature Ta is, the less charging time the ACAES lasts. Additionally, there still occurs surplus compression heat in the case of higher ambient temperature. For example, 35.6% of the residual compression heat at Ta = 308.15 K cannot be used in IAH, because the GT compressor inlet air temperature Tin has arrived at the limited value of 323.15 K.
(2) Hourly GT compressor inlet air temperature
According the hourly allocation of residual compression heat for GT compressor inlet heating, the hourly inlet air temperature of GT compressor is shown in Fig. 15.
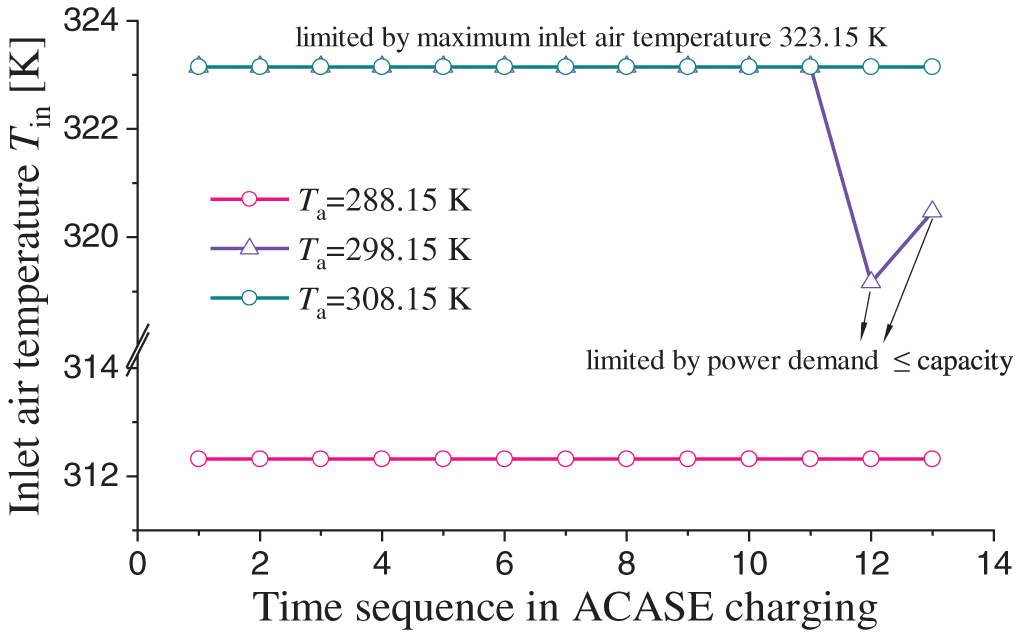
Figure 15: Hourly GT compressor inlet air temperature
At the ISO ambient temperature, i.e., Ta = 288.15 K, the residual compression heat can be completely recovered and the GT compressor inlet air temperature is equally heated to Tin = 312.32 K, because the GT compressor inlet air flow remains nearly unchanged at those load rates, as can be referred to Fig. 6b. At Ta = 308.15 K, the GT inlet air temperature (Tin) can be heated to the specified maximum value of 323.15 K, and thus there still occurs surplus compression heat, as illustrated in Fig. 14c. However, at Ta = 298.15 K, the values of Tin at the last two hours are constrained by the power demand, that is, the maximum GTCC capacity at Tin = 323.15 K is below the demand power. Please note, the GTCC operates in standalone mode during the subsequent 14:00~24:00.
(3) Hourly GTCC load rate and efficiency
The hourly load rate of the GTCC (rcc, calculated as per Eq. (1)) in the standalone mode and interactive mode of CPG at various ambient temperatures (Ta) is shown in Fig. 16a. The hourly load rate of the standalone GTCC is set as the same at various Ta. Because the standalone GTCC full-load capacity (Pcc,max) decreases with the increment in Ta, as can be seen from Fig. 6a, the absolute power demand (Pd = rcc·Pcc,max) is greater at lower ambient temperatures. As can be seen that, the GT inlet air heating and additional power shifting in the interactive mode, or ACAES charging process, considerably enhances the GTCC load rate at specified power demand. The value of rcc at Ta = 288.15 K is slightly lower than that at Ta = 308.15 K, because the GT inlet air temperature is relatively lower at Ta = 288.15 K, as can be seen from Fig. 15. However, the value of rcc at Ta = 298.15 K is considerably higher than that at Ta = 308.15 K. This is because, the GTCC capacities (Pcc,max) are nearly the same owing to the same Tin except the last two hours as shown in Fig. 15, whereas the absolute demand power load (Pd) is higher at lower ambient temperatures.
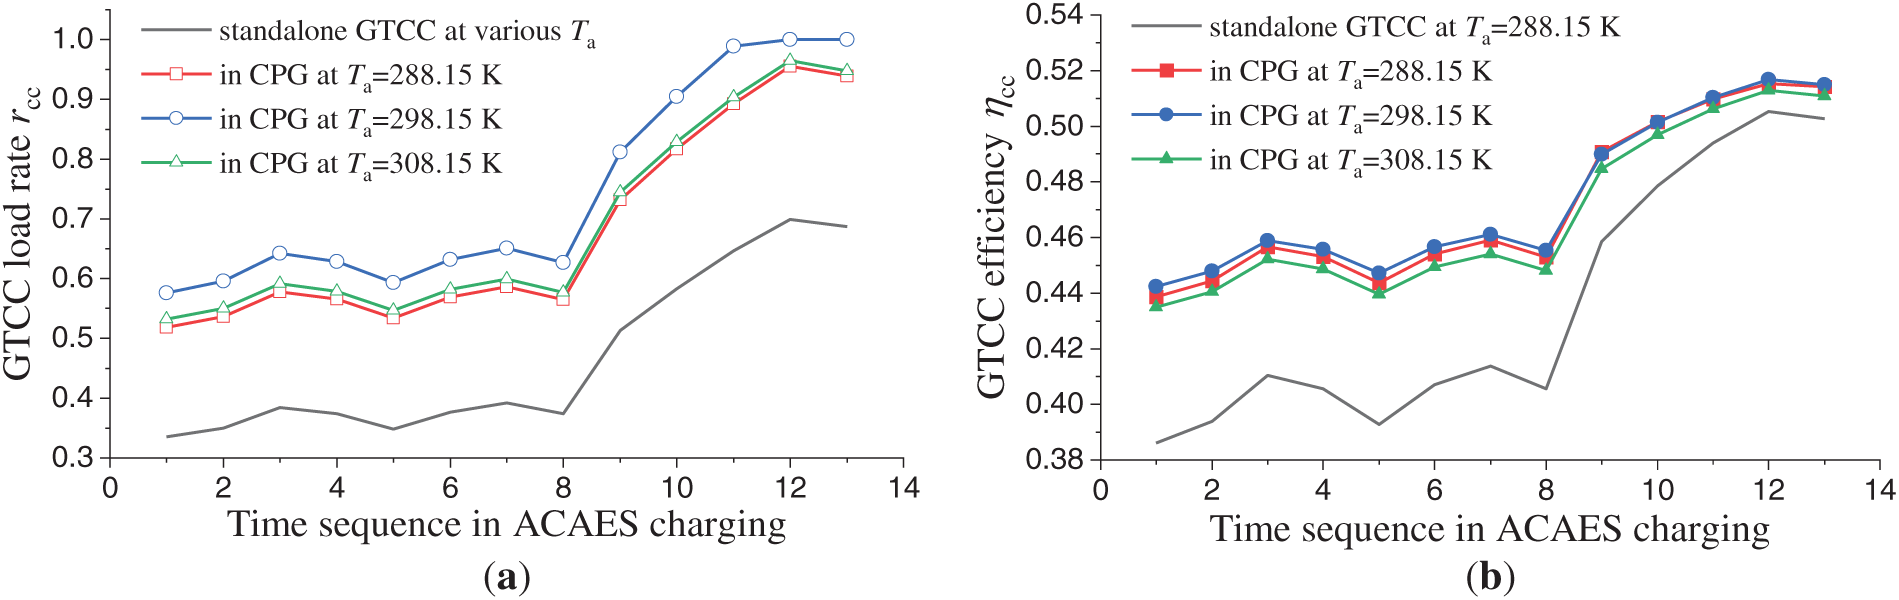
Figure 16: Hourly load rate and efficiency of GTCC during ACAES charging in CPG. (a) GTCC load rate; (b) GTCC efficiency
The GTCC efficiency ηcc depends mainly on the load rate, and meanwhile slightly on the GT compressor inlet air temperature, bringing about the time-sequential GTCC efficiency as plotted in Fig. 16b. On the whole, the time-sequential GTCC efficiency considerably increases owing to the increment in the load rate. For example, at Ta = 288.15 K and at 8:00 of the time sequence, the load rate of the standalone GTCC is rcc = 0.3738, which is enhanced to 0.5646 owing to the additional power shifting to ACAES charging and GT compressor inlet air hating as well. The corresponding GTCC efficiency is improved from 0.4057 to 0.4529.
The hourly load rate of the GTCC (rcc) at various ambient temperatures (Ta) is shown in Fig. 17a. The load rate of the standalone GTCC is set as the same in Fig. 16a. In the interactive mode of BS, the time-sequence GTCC load rate increases only because of the additional power shifting to the ACAES charging process, i.e., the additional power for driving the ACAES (Pcom,ACAES). At higher ambient temperature, although Pcom,ACAES becomes lower, the GTCC capacity decreases more as can be seen from Fig. 6a. This results in a slight increment in the load rate (rcc) at higher ambient temperature (Ta). However, the much higher Ta exerts a negative influence on the GTCC efficiency. Hence, the hourly GTCC efficiency in BS at higher Ta is slightly less than that at lower Ta. AT various ambient temperatures, the GTCC additional power shifting to ACAES in BS can improve the GTCC efficiency on the whole, as can be seen from Fig. 17b. For example, at Ta = 308.15 K and at 8:00 of the time sequence, the load rate of the standalone GTCC is rcc = 0.3738, which is enhanced to 0.4755 due to the additional power shifting to ACAES charging. The corresponding GTCC efficiency is improved from 0.4031 to 0.4437.
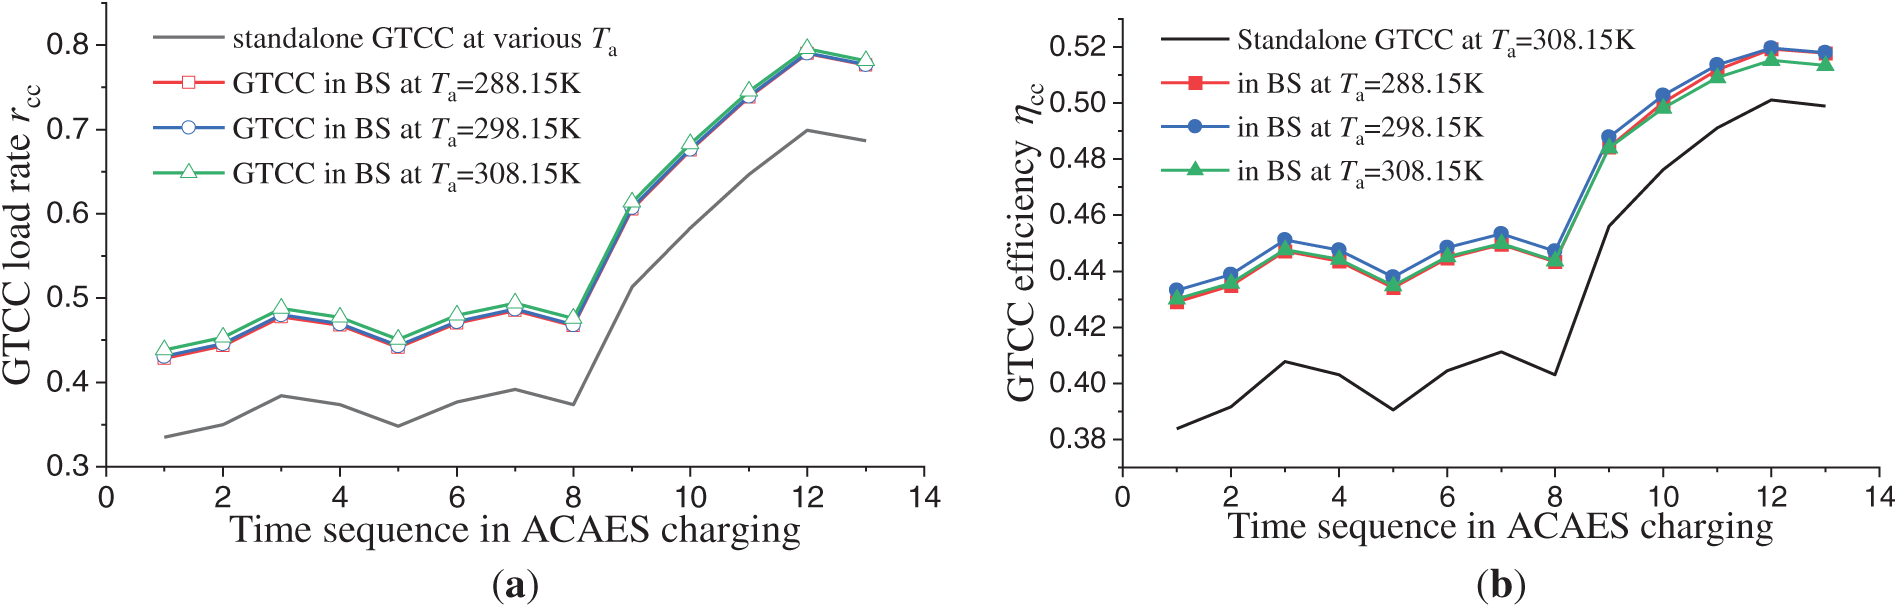
Figure 17: Hourly load rate and efficiency of GTCC during ACAES charging in BS. (a) GTCC load rate; (b) GTCC efficiency
It should be noted that, during ACAES discharging process or at parallel power, the GTCC units in the various systems, i.e., CPG and BS, have the equivalent operating performance as the original GTCC unit, so does at GTCC standalone mode. Hence, there is no need to discuss the hourly performance during the remaining time sequences, but in charging process or at interactive mode. However, the GTCC operative efficiency and the system efficiency in a roundtrip are to be discussed in the following sections.
6.2.3 Operative GTCC Efficiency in Various Systems
The GTCC in various systems operates under the same load rate distribution as given in Fig. 10. The GTCC operative efficiency (ηcc,operative, calculated as per Eqs. (2)–(4)) in a roundtrip at various ambient temperatures is presented in Fig. 18. It can be found that, the GTCC operative ηcc,operative is obviously enhanced by the interactive mode. At various ambient temperatures, the value of ηcc,operative in BS almost uniformly increases by 1 percentage point against that in the standalone GTCC, owing to the additional power shifting from the GTCC to the ACAES. Remarkably, ηcc,operative in CPG increases by 1.26 percentage points at Ta = 288.15 K and averagely by 1.19 percentage points at the various ambient temperatures. The increment in ηcc,operative of CPG against the standalone GTCC lessens with the rise in Ta. These findings just indicate a unilateral benefit on the side of GTCC operators. Hence, it needs to further discuss the system efficiency in a roundtrip, which answers the over-all benefit from the subsystem collaboration.
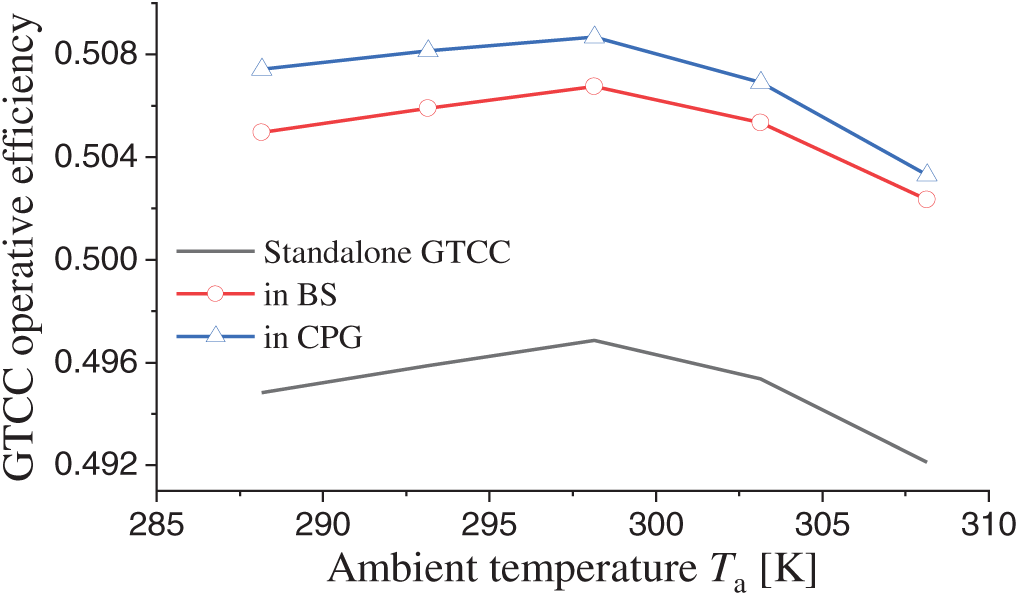
Figure 18: GTCC operative efficiency in various systems
6.3 System Efficiency in a Roundtrip
The roundtrip system efficiency (ηsys, calculated as per Eq. (6)) in the standalone GTCC, the BS and the CPG at various ambient tempratures is presented in Fig. 19, where the system efficiency in the original standalone GTCC is equivalent with the corresponding operative efficiency as plotted in Fig. 18.
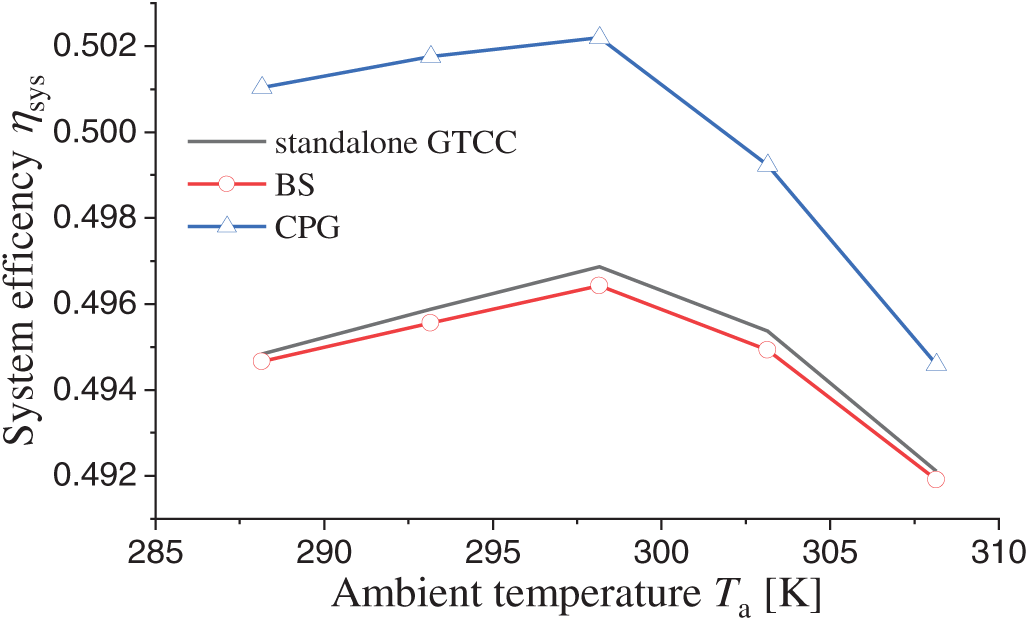
Figure 19: System efficiency in a roundtrip
As can be seen from Fig. 19, ηsys in the benchmark system (BS) is slightly inferior to that in the standalone GTCC. For example, at Ta = 288.15 K, the system efficiency in BS is 0.4947 vs. 0.4948 in the standalone GTCC. This indicates unattractive economical efficiency of BS if considering no peak regulation allowance, where a single way by load shifting from GTCC to ACAES is designed.
However, the system efficiency in the proposed CPG is considerably superior to that in the standalone GTCC. For example, also at Ta = 288.15 K, the system efficiency in CPG is 0.5010, which is enhanced by 0.0062 against 0.4948 in the standalone GTCC. This indicates a competitive over-all benefit of the collaborative system. In addition, the enhancement in ηsys of CPG against the standalone GTCC lessens with the rise in Ta.
The GTCC hourly demand load distribution is a crucial condition for the design, and operating performance as well, of the collaborative system. One may apply the technical routines as described in this work for general evaluation on the collaborative effects under various typical load distributions with universal characteristics.
Under the demand load distribution as illustrated in Fig. 10 and the basic design parameters as presented in Section 2.3, the standalone GTCC operative efficiency is 49.48% at ISO ambient conditions; while the CPG system efficiency in a roundtrip is 50.10% vs. 49.47% in BS. This means an uncompetitive economy of BS without consideration of peak regulation allowance. Hence, in the integrated systems similar to BS, one of the crucial challenges is to improve the roundtrip efficiency of the energy storage subsystems. Optimization of the design parameters could further promote the cost efficiency of the collaborative system.
As can be found from this work, thermal energy discharge to the environment in an ACAES generally occurs in forms of either residual compression heat, or waste heat from the ACAES air turbine, or sometimes in a form of cold energy. This work only addresses the issues in the residual heat from ACAES compression process, for improving the part-load performance of a GTCC unit. Whereas the authors’ previous work focused on the ACAES exhaust cold energy mainly for enhancing GTCC full-load capacity [20]. Hence, the residual heat, waste thermal energy or cold energy, or both, could be received by GTCC during off-peak time and during on-peak time as well, which could guide for other interesting collaborative systems.
A novel collaborative power generation system (CPG) is proposed, based on a gas-turbine combined cycle (GTCC) unit and an adiabatic air energy storage (ACAES). In the interactive operating mode, the surplus power from GTCC is shifted for driving the ACAES, while the ACAES residual compression heat is hourly allocated for GTCC compressor inlet air heating. The CPG system and a benchmark system (BS) are separately designed in detail based on a 67.3 MW GTCC under a specified demand-load distribution. Additional 9.39% output power from the GTCC is designed for driving the ACAES in the both systems. The CPG is configured with three compression stages and two expansion stages, whereas the BS is configured with three expansion stages. The main conclusions are summarized as follows:
(1) Under the constraints of air mass balance of ACAES processes, there occurs residual heat in the thermal storage and exhaust heating or cooling energy, which depends on the stage configuration. The residual heat quantities are 109.714 GJ in CPG and 29.529 GJ in BS, respectively, under the design conditions of this work.
(2) The GTCC load rate in CPG under the interactive mode is significantly enhanced, resulting in an average increase in GTCC operative efficiency by 1.19 percentage points compared to the original standalone GTCC. In contrast, the GTCC operative efficiency in BS at various ambient temperatures almost uniformly increases by 1.00 percentage point owing to the single collaborative approach of load shifting.
(3) In a roundtrip at the ambient temperature of 288.15 K, the system efficiency of BS is 0.4947, compared to 0.4948 in the standalone GTCC. Hence, the BS is slightly inferior to the standalone GTCC. However, the CPG system efficiency reaches 0.5010 and is enhanced by 0.62 percentage points against the standalone GTCC.
Further work could focus on the design and parameter optimization of the collaborative system under various load distributions, where the GTCC functions as both a power supplier and a multi-energy receiver of the ACAES.
Acknowledgement: The authors would also express thanks to Baoqi Liu, Jiale Peng, Zefeng Liao, Changyu Yang and Dr. Yiluan Jian for their proofreading of this work.
Funding Statement: The authors received no specific funding for this study.
Author Contributions: Cheng Yang: Writing—review & editing, methodology, formal analysis. Hanjie Qi: Writing. Qing Yin: Review. All authors reviewed the results and approved the final version of the manuscript.
Availability of Data and Materials: Data will be made available on request.
Ethics Approval: Not applicable.
Conflicts of Interest: The authors declare no conflicts of interest to report regarding the present study.
References
1. Energy Institute. statistical review of world energy [Internet]. [cited 2025 Aug 30]. Available from: https://www.energyinst.org/statistical-review. [Google Scholar]
2. Wang X, Li M, Bing H, Zhang D, Zhang Y. Malfunction diagnosis of the GTCC system under all operating conditions based on exergy analysis. Energy Eng. 2024;121(12):3875–98. doi:10.32604/ee.2024.056237. [Google Scholar] [CrossRef]
3. Chen X, Tian G, Huang Y, Yang Y, Li J, Wu Y, et al. New power system development path mechanism design. Globle Energy Interconnect. 2023;6(2):166–74. doi:10.1016/j.gloei.2023.04.004. [Google Scholar] [CrossRef]
4. Guédez R, García J, Nuutinen A, Graziano G, Chiu J, Sorce A, et al. Techno-economic comparative analysis of innovative combined cycle power plant layouts integrated with heat pumps and thermal energy storage. In: Turbo Expo: Power for Land, Sea, and Air; 2019 Jun 17–21; Phoenix, AZ, USA. New York City, NY, USA: American Society of Mechanical Engineers; 2019. doi:10.1115/GT2019-91036. [Google Scholar] [CrossRef]
5. Pashchenko D, Mustafin R, Karpilov I. Thermochemical recuperation by steam methane reforming as an efficient alternative to steam injection in gas turbines. Energy. 2022;258(5):124913. doi:10.1016/j.energy.2022.124913. [Google Scholar] [CrossRef]
6. Wang Y, Zhang Q, Li Y, He M, Weng S. Research on the effectiveness of the key components in the HAT cycle. Appl Energy. 2022;306(5):118066. doi:10.1016/j.apenergy.2021.118066. [Google Scholar] [CrossRef]
7. Strušnik D, Avsec J. Exergoeconomic machine-learning method of integrating a thermochemical Cu-Cl cycle in a multigeneration combined cycle gas turbine for hydrogen production. Int J Hydrogen Energy. 2022;47(39):17121–49. doi:10.1016/j.ijhydene.2022.03.230. [Google Scholar] [CrossRef]
8. Manatura K, Rummith N, Chalermsinsuwan B, Samsalee N, Chen W-H, Phookronghin K, et al. Gas turbine heat rate prediction in combined cycle power plant using artificial neural network. Thermal Sci Eng Prog. 2025;59:103301. doi:10.1016/j.tsep.2025.103301. [Google Scholar] [CrossRef]
9. Kumar NR, Krishna KR, Raju AVS. Performance improvement and exergy analysis of gas turbine power plant with alternative regenerator and intake air cooling. Energy Eng. 2007;104(3):36–53. doi:10.1080/01998590709509498. [Google Scholar] [CrossRef]
10. Variny M, Mierka O. Improvement of part load efficiency of a combined cycle power plant provisioning ancillary services. Appl Energy. 2009;86(6):888–94. doi:10.1016/j.apenergy.2008.11.004. [Google Scholar] [CrossRef]
11. Wang X, Duan L, Zhu Z. Peak regulation performance study of GTCC based CHP system with compressor inlet air heating method. Energy. 2023;262(6–7):125366. doi:10.1016/j.energy.2022.125366. [Google Scholar] [CrossRef]
12. Hachem J, Schuhler T, Orhon D, Cuif-Sjostrand M, Zoughaib A, Molière M. Exhaust gas recirculation applied to single-shaft gas turbines: an energy and exergy approach. Energy. 2022;238(4):121656. doi:10.1016/j.energy.2021.121656. [Google Scholar] [CrossRef]
13. Wang S, Liu Z, Cordtz R, Imran M, Fu Z. Performance prediction of the combined cycle power plant with inlet air heating under part load conditions. Energy Convers Manage. 2019;200:112063. doi:10.1016/j.enconman.2019.112063. [Google Scholar] [CrossRef]
14. Yang Y, Bai Z, Zhang G, Li Y, Wang Z, Yu G. Design/off-design performance simulation and discussion for the gas turbine combined cycle with inlet air heating. Energy. 2019;178(4):386–99. doi:10.1016/j.energy.2019.04.136. [Google Scholar] [CrossRef]
15. Fan K, Yang C, Xie Z, Ma X. Load-regulation characteristics of gas turbine combined cycle power system controlled with compressor inlet air heating. Appl Therm Eng. 2021;196:117285. doi:10.1016/j.applthermaleng.2021.117285. [Google Scholar] [CrossRef]
16. Wang S, Zhang G, Fu Z. Performance analysis of a novel integrated solar combined cycle with inlet air heating system. Appl Therm Eng. 2019;161:114010. doi:10.1016/j.applthermaleng.2019.114010. [Google Scholar] [CrossRef]
17. Du R, He Y, Chen H, Xu Y, Li W, Deng J. Performance and economy of trigenerative adiabatic compressed air energy storage system based on multi-parameter analysis. Energy. 2022;238(6):121695. doi:10.1016/j.energy.2021.121695. [Google Scholar] [CrossRef]
18. Wang X, Yang C, Huang M, Ma X. Multi-objective optimization of a gas turbine-based CCHP combined with solar and compressed air energy storage system. Energy Convers Manage. 2018;164(9):93–101. doi:10.1016/j.enconman.2018.02.081. [Google Scholar] [CrossRef]
19. Kruk-Gotzman S, Ziółkowski P, Iliev I, Negreanu G, Badur J. Techno-economic evaluation of combined cycle gas turbine and a diabatic compressed air energy storage integration concept. Energy. 2023;266(3):126345. doi:10.1016/j.energy.2022.126345. [Google Scholar] [CrossRef]
20. Xiao R, Yang C, Qi H, Ma X. Synergetic performance of gas turbine combined cycle unit with inlet cooled by quasi-isobaric ACAES exhaust. Appl Energy. 2023;352(2):122019. doi:10.1016/j.apenergy.2023.122019. [Google Scholar] [CrossRef]
21. Wojcik J, Wang J. Feasibility study of combined cycle gas turbine (CCGT) power plant integration with adiabatic compressed air energy storage (ACAES). Appl Energy. 2018;221(9):477–89. doi:10.1016/j.apenergy.2018.03.089. [Google Scholar] [CrossRef]
22. Kim HR, Kim TS. Investigation of synergistic integration and optimization in combining compressed-air energy storage and a gas turbine. Appl Therm Eng. 2023;232(4):120988. doi:10.1016/j.applthermaleng.2023.120988. [Google Scholar] [CrossRef]
23. Yang C, Wang P, Fan K, Ma X. Performance of gas turbine multi-generation system regulated with compressor bypass extraction air energy storage. Appl Therm Eng. 2020;172:115181. doi:10.1016/j.applthermaleng.2020.115181. [Google Scholar] [CrossRef]
24. Du J, Guo J. Analysis of multi-cascade CCHP system with gas turbine bypass extraction air energy storage. Appl Therm Eng. 2023;232:121021. doi:10.1016/j.applthermaleng.2023.121021. [Google Scholar] [CrossRef]
25. Kim M, Kim T. Integration of compressed air energy storage and gas turbine to improve the ramp rate. Appl Energy. 2019;247(3):363–73. doi:10.1016/j.apenergy.2019.04.046. [Google Scholar] [CrossRef]
26. Shukin S, Annerfeldt M, Björkman M. Siemens SGT-800 industrial gas turbine enhanced to 47 MW design modifications and operation experience. In: ASME Turbo Expo 2008: Power for Land, Sea, and Air; 2008 Jun 9–13; Berlin, Germany. doi:10.1115/GT2008-50087. [Google Scholar] [CrossRef]
27. Kiuru T, Oijerholm M. Flexible package solutions for Siemens SGT-800. In: 21st Symposium of the Industrial Application of Gas Turbines Committee; 2015 Oct; Banff, Alberta, Canada. [cited 2025 Aug 29]. Available from: https://na.eventscloud.com/file_uploads/b30468298436a849a7ac4d755e4ef2d4_102finalpaper.pdf. [Google Scholar]
28. Pan Z, Lin Z, Fan K, Yang C, Ma X. Off-design performance of gas turbine power units with alternative load-control strategies. Energy Eng. 2021;118(1):119–41. doi:10.32604/EE.2020.013585. [Google Scholar] [CrossRef]
29. Xie G, Xue Z, Xiong B, Huang Y, Chen C, Liao Q, et al. Performance of gas-steam combined cycle cogeneration units influenced by heating network terminal steam parameters. Energy Eng. 2024;121(6):1495–519. doi:10.32604/ee.2024.047832. [Google Scholar] [CrossRef]
30. Zhang N, Cai R. Analytical solutions and typical characteristics of part-load performances of single shaft gas turbine and its cogeneration. Energy Convers Manage. 2002;43(9-12):9–12. doi:10.1016/S0196-8904(02)00018-3. [Google Scholar] [CrossRef]
31. Hesselgreaves JE. Compact heat exchangers selection, design and operation. Amsterdam, The Netherlands: Elsevier; 2001. [Google Scholar]
32. Zhu Q, Luo X, Zhang B, Chen Y. Mathematical modelling and optimization of a large-scale combined cooling, heat, and power system that incorporates unit changeover and time-of-use electricity price. Energy Convers Manage. 2017;133(5):385–98. doi:10.1016/j.enconman.2016.10.056. [Google Scholar] [CrossRef]
Cite This Article
 Copyright © 2026 The Author(s). Published by Tech Science Press.
This work is licensed under a Creative Commons Attribution 4.0 International License , which permits unrestricted use, distribution, and reproduction in any medium, provided the original work is properly cited.
 Downloads
 Citation Tools