
 Submit a Paper
 Propose a Special lssue
 Open Access
ARTICLE

A Hybrid CEEMDAN-HOA-Transformer-GRU Model for Crude Oil Futures Price Forecasting
1 School of Civil and Environmental Engineering, Zhengzhou University of Aeronautics, Zhengzhou, 450046, China
2 School of Electronics and Information, Zhengzhou University of Aeronautics, Zhengzhou, 450046, China
* Corresponding Author: Lingxiao Ye. Email:
Energy Engineering 2026, 123(4), 5 https://doi.org/10.32604/ee.2025.072163
Received 20 August 2025; Accepted 16 October 2025; Issue published 27 March 2026
 View Full Text
 Download PDF
Abstract
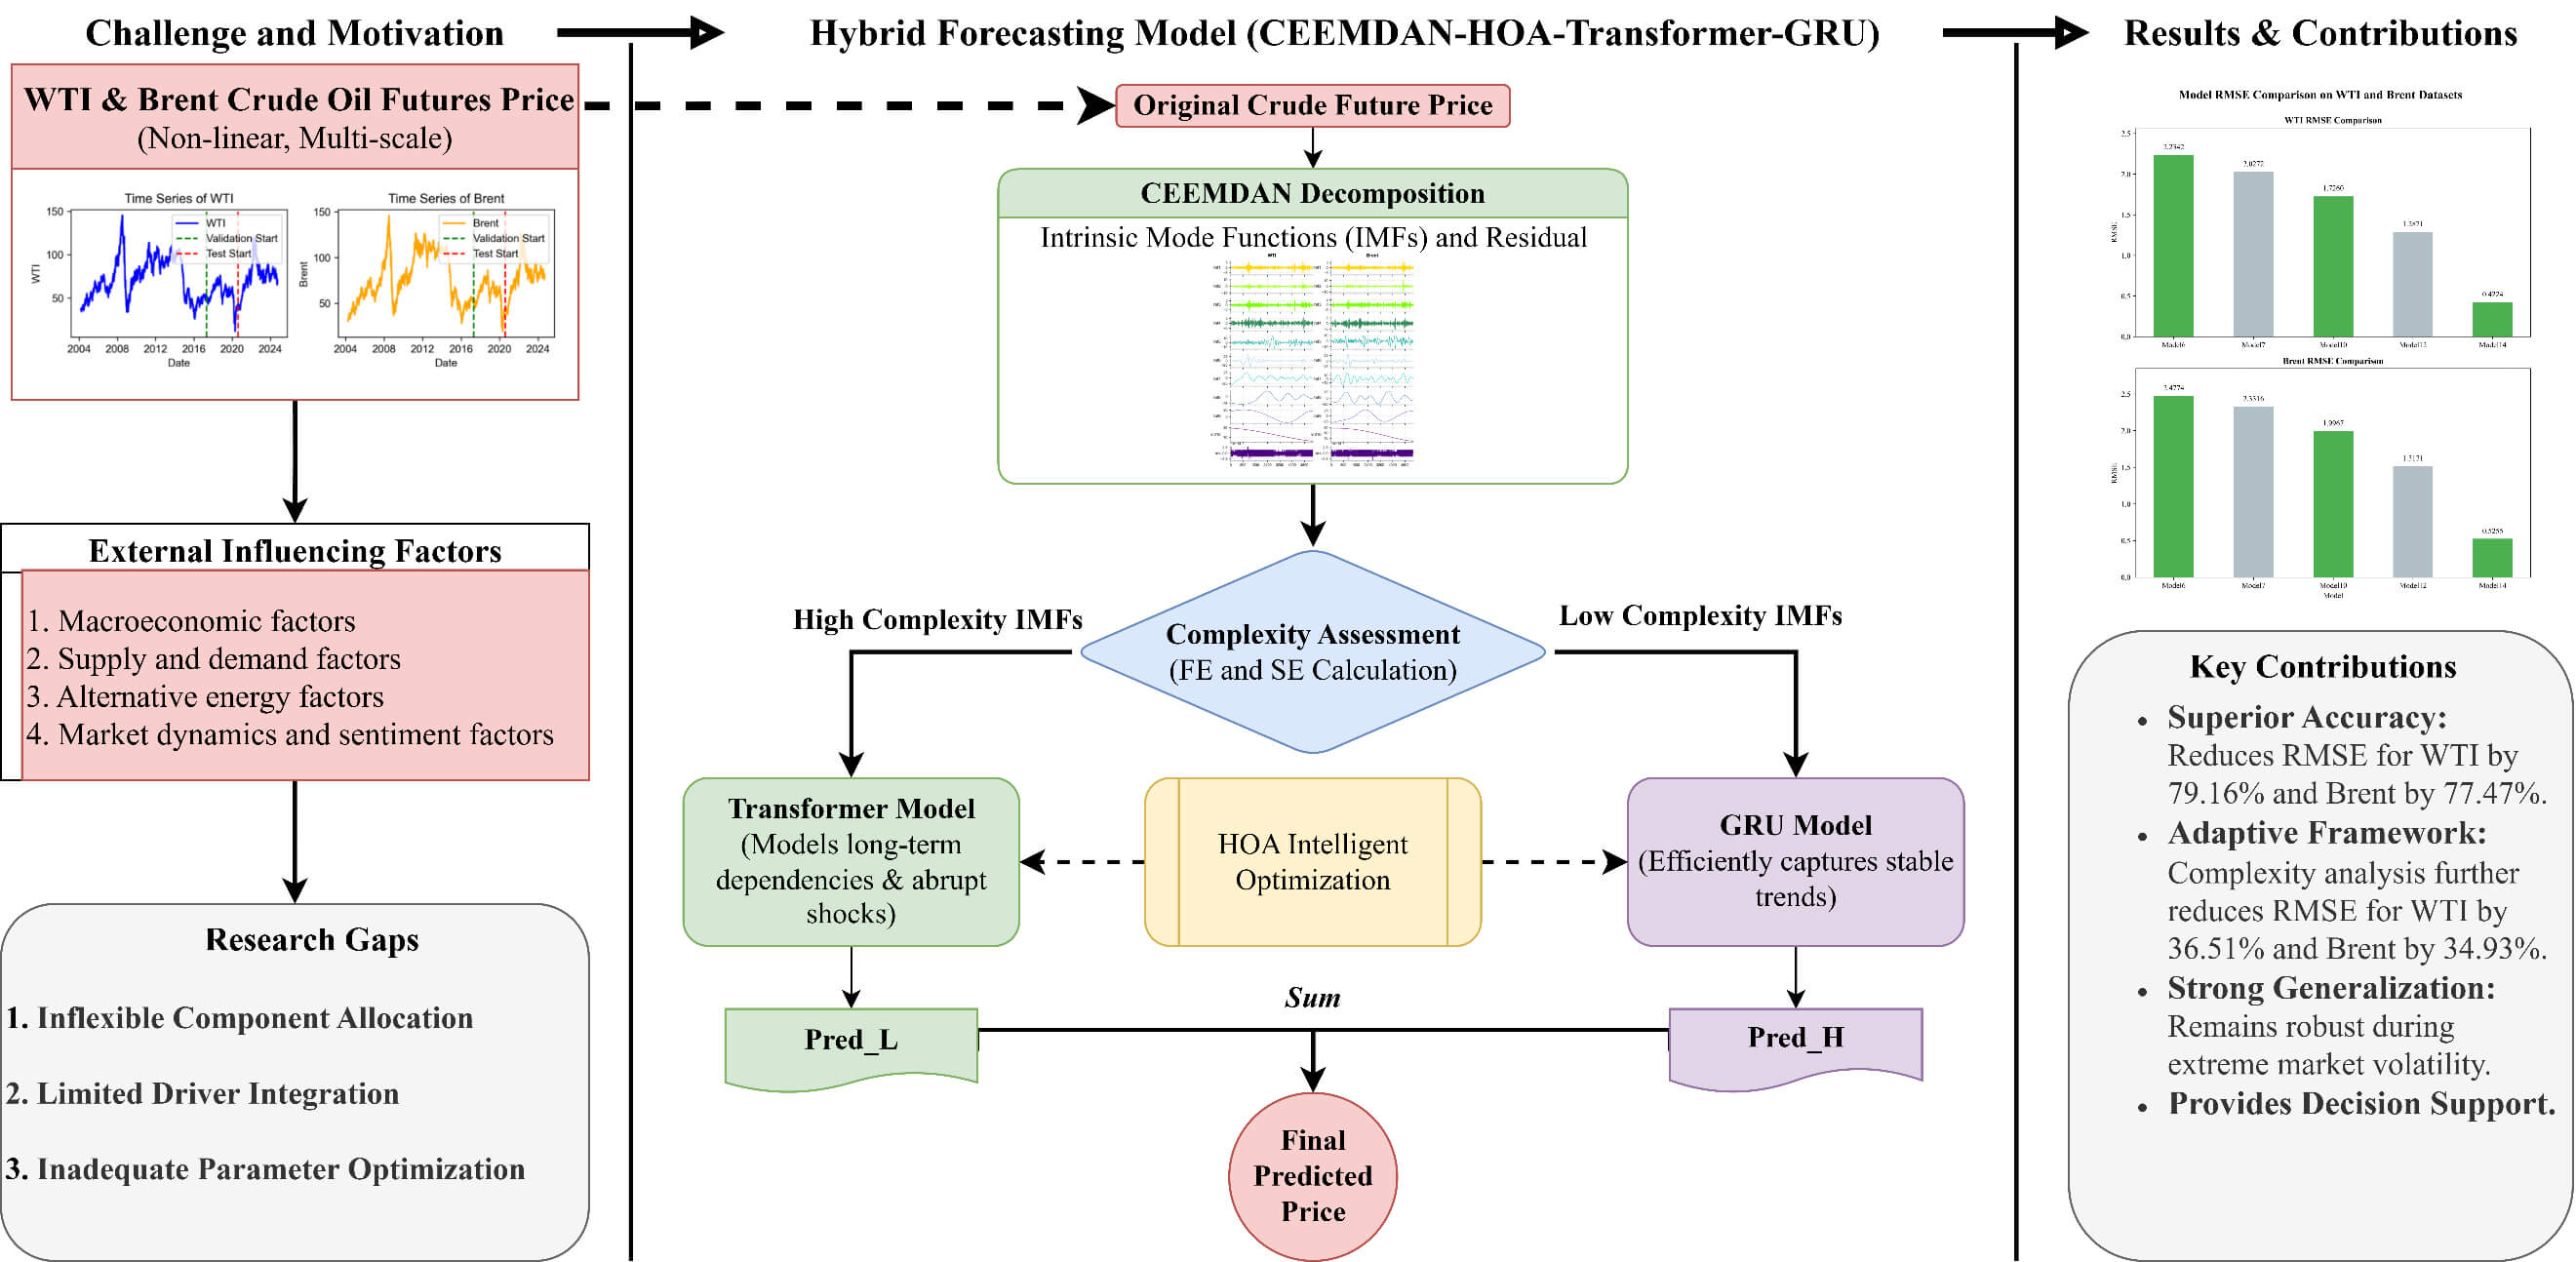
Accurate forecasting of crude oil futures prices is crucial for understanding global energy market dynamics and formulating effective macroeconomic and energy strategies. However, the strong nonlinearity and multi-scale temporal characteristics of crude oil prices pose significant challenges to traditional forecasting methods. To address these issues, this study proposes a hybrid CEEMDAN–HOA–Transformer–GRU model that integrates decomposition, complexity analysis, adaptive modeling, and intelligent optimization. Specifically, Complete Ensemble Empirical Mode Decomposition with Adaptive Noise (CEEMDAN) is employed to decompose the original series into multi-scale components, after which entropy-based complexity analysis quantitatively evaluates each component. A differentiated modeling strategy is then applied: Transformer networks capture long-term dependencies in high-complexity components, while Gated Recurrent Units (GRU) model short-term dynamics in relatively simple components. To further enhance robustness, the Hiking Optimization Algorithm (HOA) is used for joint hyperparameter optimization across both base learners. Empirical analysis of WTI and Brent crude oil futures demonstrates the technical effectiveness of the framework. Compared with benchmark models, the proposed method reduces RMSE by 79.16% for WTI and 77.47% for Brent. Incorporating complexity analysis further decreases RMSE by 36.51% for WTI and 34.93% for Brent, confirming the superior nonlinear modeling capacity and generalization performance of the integrated framework. Overall, this study provides not only a technically reliable tool for modeling complex financial time series but also practical guidance for improving the accuracy and stability of crude oil price forecasting, thereby supporting market monitoring, risk management, and policy formulation.Graphic Abstract
Keywords
Crude oil, as one of the most fundamental energy resources in modern industrial societies, plays a pivotal role in the global energy system [1]. Its enormous market size, high liquidity, and extensive international influence have positioned crude oil futures at the center of global financial markets, macroeconomic policymaking, and international geopolitical dynamics [2]. The volatility of crude oil futures prices not only affects the stability and growth of the global economy but also exerts a significant impact on inflation, international trade, and geopolitical relations [3]. Consequently, accurate forecasting of crude oil futures prices holds considerable theoretical and practical importance for global economic governance, policy formulation, and financial risk management. Nevertheless, forecasting crude oil futures prices remains an exceptionally challenging task. Price movements are shaped by a multitude of complex and interrelated factors, including shifts in macroeconomic conditions, changes in supply–demand dynamics, speculative trading in financial markets, and fluctuations in alternative energy prices [4]. The interaction of these factors renders crude oil futures prices highly nonlinear, non-stationary, and volatile, characterized by the coexistence of long-term trends and short-term shocks. These features significantly hinder pattern recognition and increase the complexity of prediction tasks [5].
Existing forecasting approaches for crude oil prices can generally be categorized into three major types: econometric models, artificial intelligence (AI)-based methods, and hybrid models. In earlier studies, econometric methods dominated the field, with researchers applying various classical linear and nonlinear time series models to forecast crude oil futures prices. These models include, but are not limited to, ARMA [6], ARIMA [7], VECM [8], GARCH [9], VAR [10], and Markov Switching models [11]. Variants such as the Seasonal ARIMA (SARIMA) model have also been introduced in related energy forecasting studies [12]. For example, Xiang and Zhuang [7] demonstrated that ARIMA can provide acceptable short-term accuracy under relatively stable conditions, but its effectiveness declines in the presence of market shocks. Similarly, Murat and Tokat [8] showed that VECM is capable of capturing long-term equilibrium relationships and can outperform ARIMA in stable regimes, though it becomes less reliable during structural breaks. GARCH-type models were effective in modeling volatility clustering but struggled when market dynamics shifted abruptly. These findings suggest that while econometric models remain useful for capturing linear dependence, they are often inadequate for handling strongly nonlinear and non-stationary behavior.
In recent years, the rapid development of artificial intelligence has introduced a new paradigm in crude oil price forecasting. AI-based methods have gained significant attention due to their ability to capture complex nonlinear patterns, adapt to evolving data distributions, and learn from high-dimensional information. Common AI approaches include, but are not limited to, neural networks (NNs) [13], extreme learning machines (ELMs) [14], long short-term memory networks (LSTMs) [15], extreme gradient boosting (XGBoost) [16], and support vector regression (SVR) [17]. For instance, Ramyar and Kianfar [18] highlighted the potential of neural networks to outperform traditional econometric approaches. Gao and Lei [19] introduced a stream learning–based forecasting framework that enhances adaptability under changing market conditions. Yu et al. [20] illustrated the usefulness of compressed sensing in combination with machine learning models for daily WTI forecasting, while Weng et al. [14] incorporated sentiment and news information into ELMs to improve predictive robustness during turbulent periods. Despite these advantages, many AI models remain sensitive to hyperparameter tuning, susceptible to overfitting, and limited in interpretability, which constrains their practical application.
To overcome the limitations of single AI models and fully leverage the strengths of different methodologies, researchers have proposed hybrid forecasting models. These models combine two or more distinct techniques in a complementary manner, with the aim of achieving more robust and accurate predictions compared to standalone approaches. Generally, hybrid models can be categorized into two main types: ensemble-based strategies, which aggregate multiple forecasting models, and decomposition-based strategies, which integrate signal decomposition methods with forecasting algorithms. On the ensemble side, Liu and Huang [21] integrated ARIMA, GARCH, and LSTM into the AGESL framework, showing that combining statistical models with deep learning enhances robustness across different market conditions. Qin et al. [22] further incorporated search trend data into a stacked ensemble, improving adaptability to external information. Hasan et al. [23] applied blending strategies with multiple base learners such as KNN, SVR, and ridge regression, which improved both accuracy and stability in Brent and WTI forecasts. Similarly, Zhang et al. [24] developed a fuzzy combination strategy that effectively addressed uncertainty in ensemble integration. For decomposition-based approaches, Zhao et al. [25] proposed a hybrid model with two-layer decomposition for crude oil price forecasting, incorporating market factors and news to enhance stability and robustness. Shen et al. [26] integrated empirical mode decomposition with CNN, BiLSTM, and quantile regression, enabling improved probability forecasting under different volatility regimes. Fang et al. [27] advanced this line of work by combining sentiment information and decomposition techniques with BiGRU networks, demonstrating superior performance in highly volatile environments, albeit with high computational requirements. Wang et al. [28] introduced CEEMDAN with an optimized LSTM, confirming the effectiveness of decomposition in mitigating non-stationarity. Zhang et al. [29] and Lin and Sun [30] further explored decomposition–reconstruction strategies with recurrent networks, which improved stability in multi-step forecasting. More recently, Lu and Huang [31] proposed a knowledge-guided decomposition-based framework (KV-MFSCBA-G), integrating decomposition with graph-based modeling to capture both temporal dynamics and structural dependencies. This approach highlighted the importance of incorporating domain knowledge into hybrid designs, though it increased computational complexity and runtime. Likewise, Alruqimi and Di Persio [32] introduced a hybrid ERS-BiGRU model for Brent crude oil, demonstrating the potential of combining enhanced recurrent structures with decomposition to improve prediction under limited data availability, albeit with constraints related to dataset size and time span.
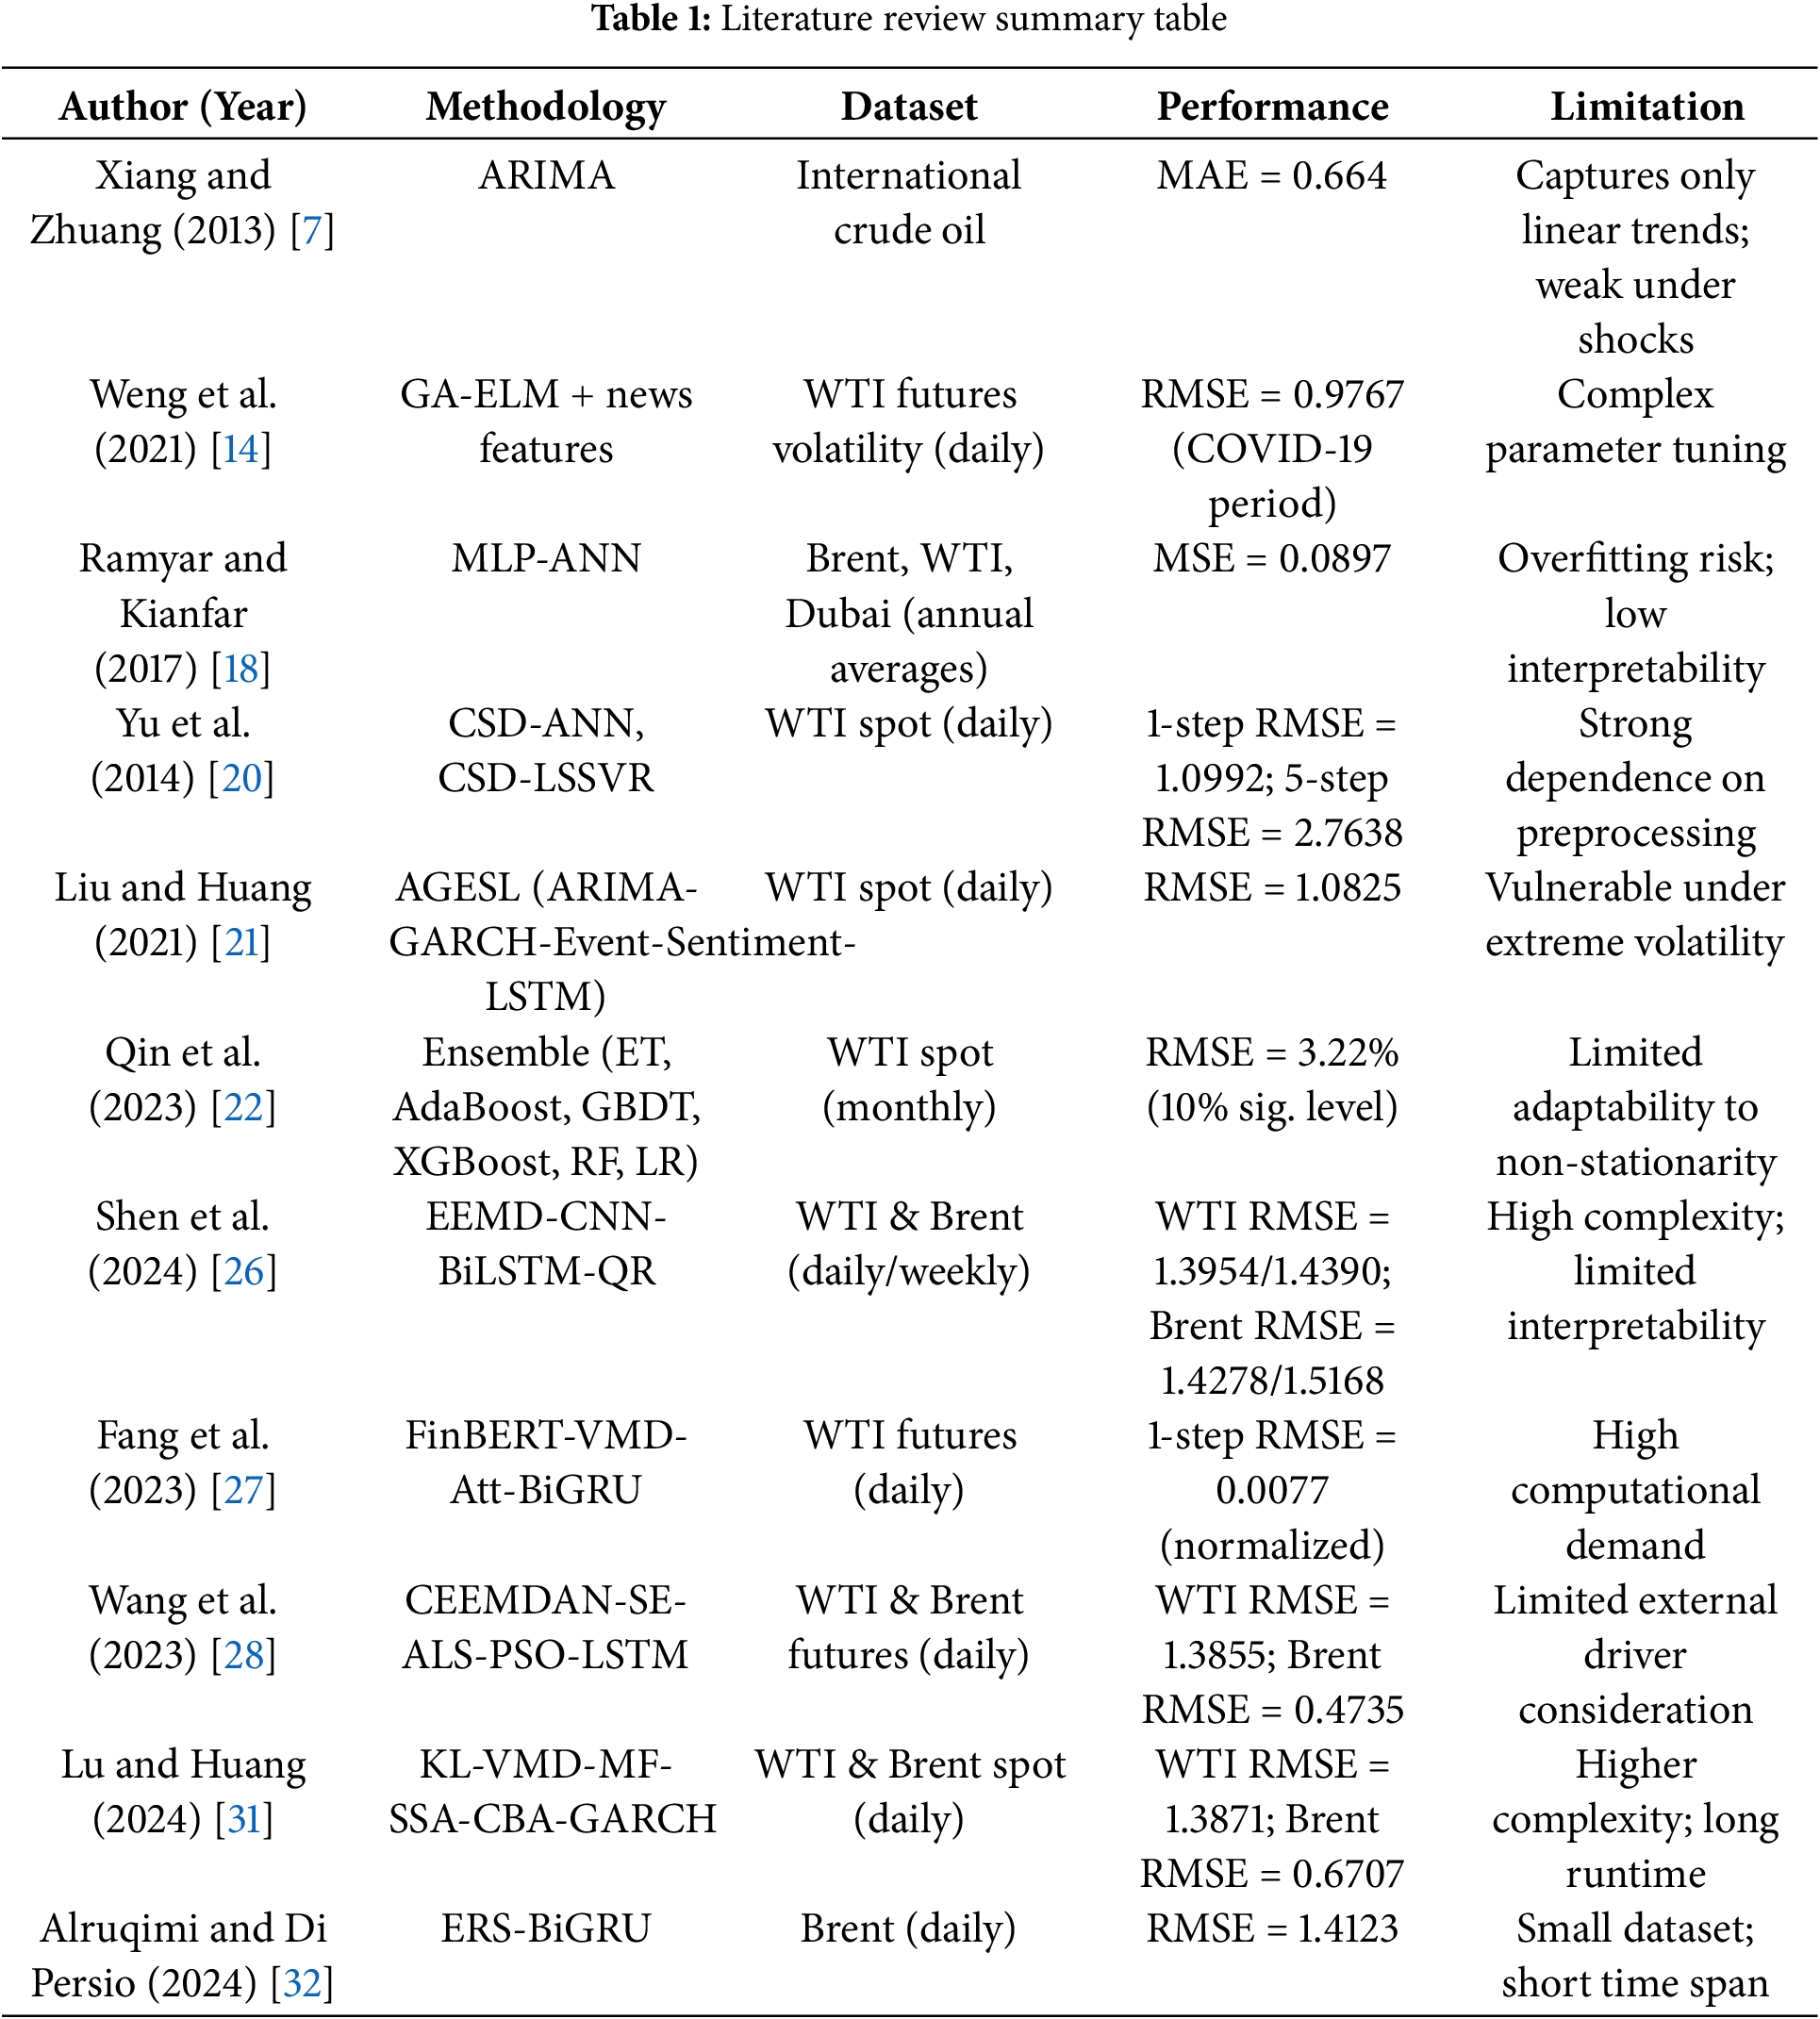
Despite these advancements, existing hybrid models still face notable limitations, including mechanical integration without adaptive component allocation, insufficient incorporation of multidimensional driving factors, and reliance on static or heuristic parameter tuning. These issues restrict robustness during abrupt market events, hindering the capacity of models to capture structural changes and sudden shocks, and thereby reducing their practical reliability in applications such as market monitoring, investment risk management, and policy support. To underscore these challenges and systematically position the research gap, Table 1 provides a structured summary of recent studies, outlining their methodological features, advantages, and limitations.
In light of the above limitations, there remains a clear need for forecasting frameworks that reduce non-stationarity at the source, allocate sub-models to components according to signal complexity rather than ad-hoc design, conduct global and data-driven hyperparameter optimization, and incorporate multi-source external drivers to enhance interpretability and robustness. Motivated by these challenges, this study proposes a hybrid CEEMDAN–HOA–Transformer–GRU model that integrates signal decomposition, complexity-aware component modeling, and metaheuristic optimization within a unified pipeline, while coupling macroeconomic, supply–demand, alternative energy, and sentiment indicators. By addressing both methodological and practical gaps, the proposed framework aims to deliver more reliable forecasts under volatile market conditions and provide actionable insights that support market monitoring, investment decision-making, and policy formulation in the energy sector. The main contributions of this study are summarized as follows:
(1) A comprehensive feature indicator system encompassing multidimensional driving factors is constructed and validated. By systematically integrating macroeconomic indicators, supply–demand fundamentals, alternative energy prices, and market sentiment, a multi-level input structure is formed, which expands the input dimension of crude oil forecasting and improves both interpretability and robustness.
(2) A novel hybrid model, CEEMDAN–HOA–Transformer–GRU, is proposed to address the nonlinear and non-stationary characteristics of crude oil futures prices. The model combines CEEMDAN for multi-scale decomposition, HOA for efficient hyperparameter optimization, and the complementary strengths of Transformer and GRU for capturing long-term dependencies and temporal dynamics, thereby achieving accurate representation of complex sequence features.
(3) An adaptive model selection strategy based on entropy analysis is introduced to improve adaptability. By quantifying the complexity of CEEMDAN subsequences using fuzzy entropy and sample entropy, the framework adaptively assigns Transformer or GRU to component-specific modeling, which enhances flexibility and generalization when handling heterogeneous data.
(4) Global hyperparameter optimization is conducted using HOA, while early stopping mitigates overfitting during training. A 5-fold time-series cross-validation scheme further evaluates candidate configurations, providing reliable out-of-sample estimates. Together, these strategies enhance generalization, stability, and robustness of the forecasting framework in practical applications.
The remainder of this paper is organized as follows: Section 2 introduces the research methodology employed in this study. Section 3 provides detailed descriptions of the data sources and the construction of the feature indicator system. Section 4 presents the experimental results. Section 5 discusses the findings and offers policy implications based on the experimental analysis. Section 6 concludes the study and summarizes the main contributions.
To enhance the accuracy and reliability of crude oil futures price forecasting, this study proposes a hybrid forecasting model that integrates feature selection, signal decomposition, complexity quantification, deep learning, and intelligent optimization. The model is implemented within a systematic framework comprising data preprocessing, signal decomposition and evaluation, grouped modeling with optimization, and result integration. This framework is designed to fully capture the multi-scale characteristics and nonlinear patterns inherent in crude oil price series, thereby constructing a highly accurate and generalizable prediction model. The following subsections describe the principles of the employed algorithms and their roles within the proposed framework.
Random Forest, an ensemble learning method, improves predictive accuracy and robustness by constructing multiple decision tree classifiers and aggregating their outputs through a voting mechanism [33]. In this study, Random Forest is applied for feature selection, automatically identifying the variables most relevant to crude oil futures prices while filtering out redundant predictors. This reduces model complexity, enhances generalization, and ensures that subsequent forecasting models are trained on the most influential features.
CEEMDAN, an enhanced version of the traditional EMD method [34], addresses the mode-mixing problem by introducing adaptive noise and performing multiple ensemble decompositions. As a powerful tool for analyzing nonlinear and non-stationary time series, it decomposes crude oil futures prices into intrinsic mode functions, effectively separating long-term trends from short-term fluctuations. This process reduces non-stationarity and noise, enabling subsequent models to better capture both stable dynamics and abrupt market shocks.
Fuzzy Entropy (FE) and Sample Entropy (SE) are widely used to quantify the complexity and irregularity of time series. In this framework, entropy analysis is used to evaluate the complexity of each IMF derived from CEEMDAN. This classification allows for distinguishing relatively stable, trend-like components from highly volatile, shock-driven ones. Low-complexity IMFs are assigned to GRU, while high-complexity IMFs are modeled using Transformer, ensuring that the forecasting framework adapts to both smooth dynamics and abrupt fluctuations.
The GRU is an improved architecture of Recurrent Neural Networks (RNN), designed to alleviate the vanishing gradient problem commonly observed in traditional RNNs [35]. It introduces reset and update gates to adaptively control information flow. The reset gate is defined as:
where
The update gate controls the balance between preserving past information and incorporating new input, expressed as:
where
GRU is applied to low-complexity IMFs obtained from CEEMDAN decomposition, which generally represent smooth and stationary trends in crude oil futures prices. GRU is well suited for such components, as it efficiently captures temporal dependencies with fewer parameters, reduces overfitting risks, and ensures stable forecasts of trend-like dynamics.
The Transformer is a sequence modeling architecture based on the self-attention mechanism [36]. Its core innovation lies in enabling parallel computation and capturing global dependencies, thereby overcoming the efficiency bottlenecks associated with traditional RNN when handling long-range dependencies.
As the core component of the Transformer, the multi-head self-attention mechanism maps the input sequence into three matrices, Query (Q), Key (K), and Value (V) to dynamically model dependencies among sequence elements. It is mathematically expressed as:
where
The Transformer is applied to high-complexity IMFs identified through entropy analysis. These components often correspond to volatile, noise-sensitive fluctuations in crude oil futures, typically driven by speculative trading or geopolitical shocks. By leveraging multi-head self-attention, the Transformer effectively models nonlinear dependencies and multi-scale interactions, thereby capturing abrupt price swings and persistent volatility.
The Hiking Optimization Algorithm (HOA) is a metaheuristic inspired by hikers searching for the highest peak (global optimum) [37]. Within the CEEMDAN-based framework, HOA is employed to optimize the hyperparameters of both GRU and Transformer. Compared with other metaheuristics, HOA offers robust global search, fast convergence, parameter adaptability derived from Tobler’s hiking function, and an efficient exploration–exploitation balance that helps escape local optima. These features improve predictive accuracy and stability, particularly under conditions of structural shifts and high volatility.
HOA relies on Tobler’s hiking function for speed:
where
Velocity and position updates are:
With
Initialization within bounds:
where
The execution process of HOA is as follows: First, the initial positions of the hikers are randomly generated, and their fitness values are evaluated. During each iteration, the algorithm computes the walking speed of each hiker and assesses the fitness of their new positions. The leader’s position is updated based on the best fitness value. The algorithm terminates once the maximum number of iterations is reached or a convergence criterion is satisfied.
The HOA-Transformer-GRU model performs hyperparameter optimization for the Transformer and GRU components through the HOA. First, the decomposed IMF components and external factors are divided into training, validation, and testing sets in proportions of 64%, 16%, and 20%, respectively. HOA initializes the hyperparameters, trains the model on the training set, and computes the fitness value on the validation set. If the current fitness is better than the historical optimum, both the optimal fitness and the corresponding hyperparameters are updated; otherwise, the previous parameters are retained. Through its velocity and position update mechanism, HOA iteratively searches the hyperparameter space until the maximum number of iterations is reached. Upon completion, the hyperparameters corresponding to the best fitness value recorded during the search are selected, and predictions are performed on the test set. The results are then output to achieve optimal model performance. The detailed process framework is illustrated in Fig. 1.
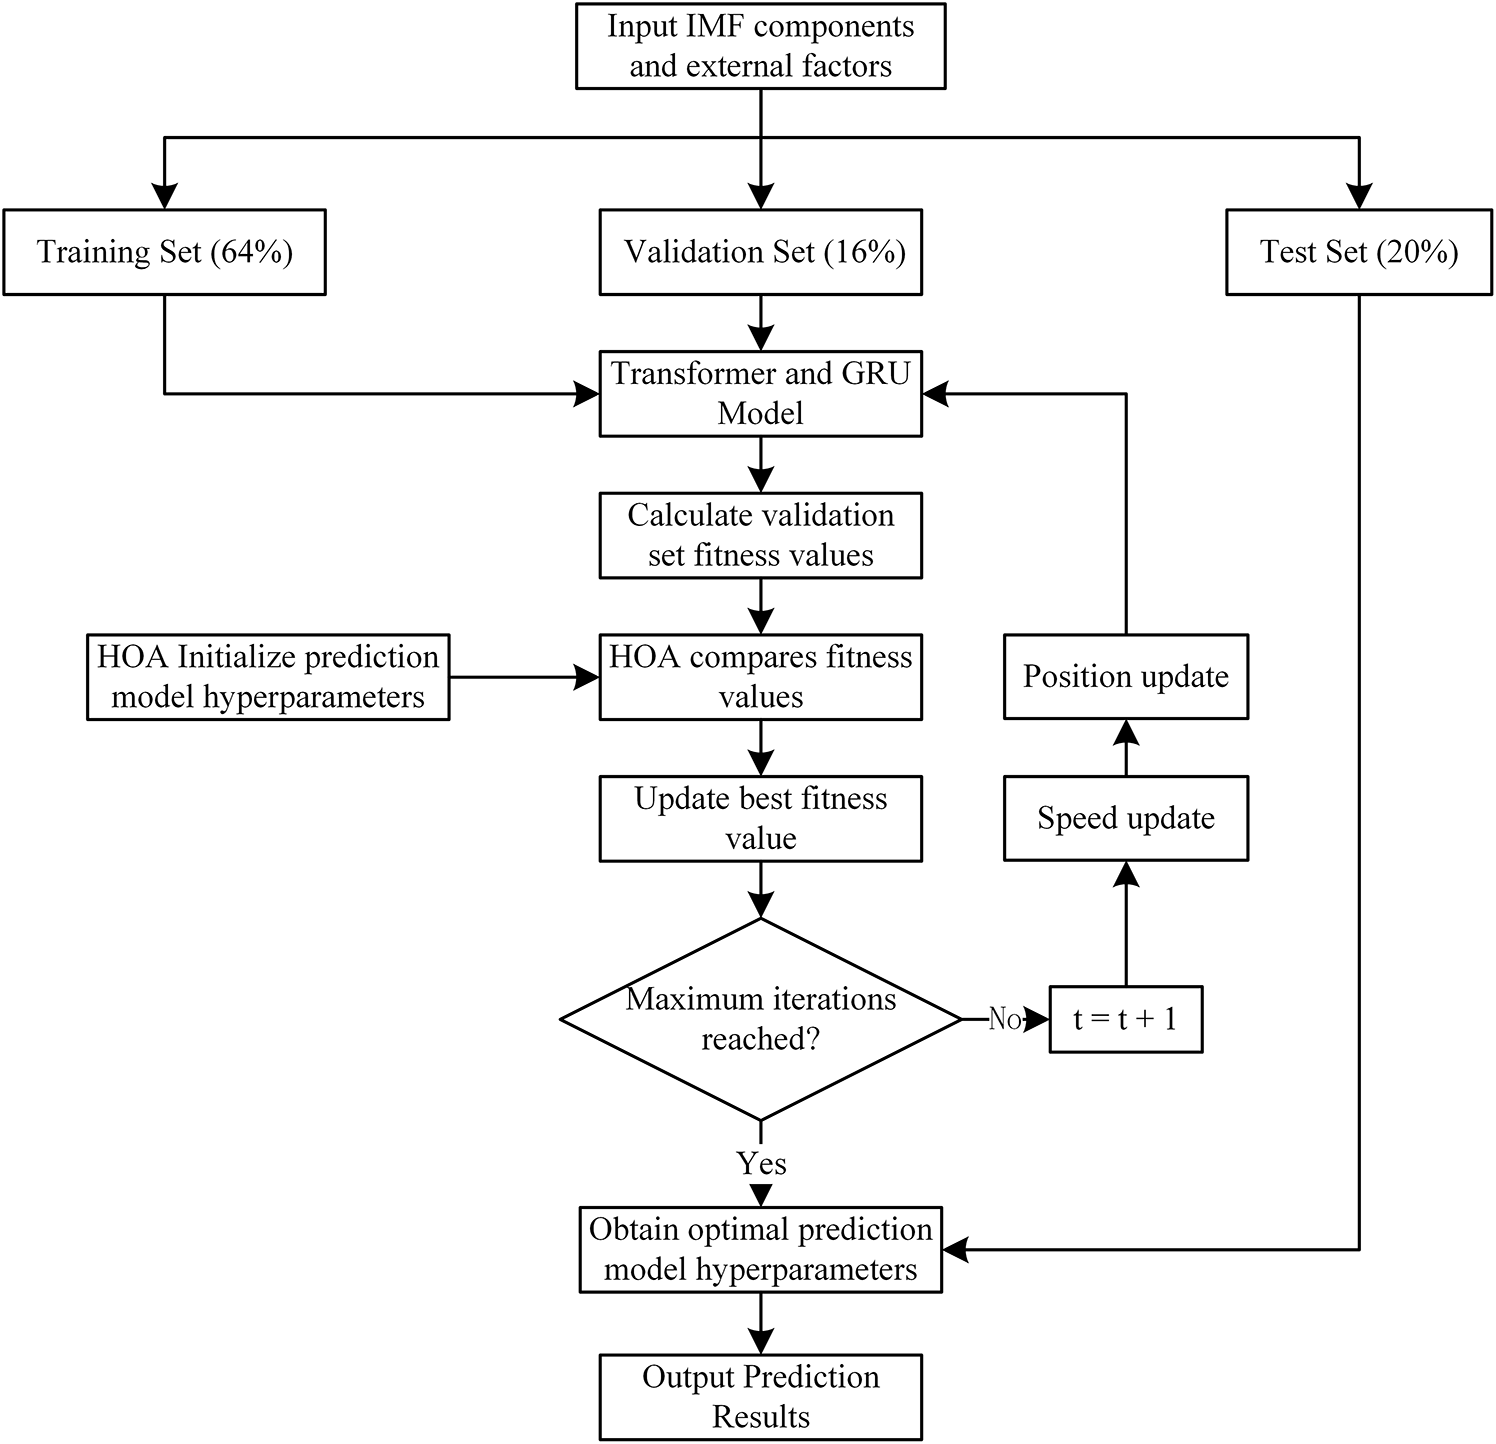
Figure 1: The HOA-Transformer-GRU prediction model framework
2.3 CEEMDAN-HOA-Transformer-GRU Hybrid Model
This study proposes a hybrid model for crude oil price prediction, with the overall framework presented in Fig. 2. The modeling process comprises the following five key steps:
Step 1: Data Decomposition. The CEEMDAN algorithm is applied to decompose the crude oil price time series into multiple IMFs, each characterized by distinct frequency components. This step facilitates the extraction of multi-scale dynamic patterns underlying price fluctuations.
Step 2: Complexity Assessment and Classification. The complexity of each IMF is quantitatively assessed using sample entropy and fuzzy entropy. Based on a predefined threshold, the IMFs are classified into low-complexity and high-complexity groups, enabling the implementation of tailored modeling strategies.
Step 3: Model Construction. A GRU model is employed to capture short-term temporal dependencies in low-complexity IMFs. For high-complexity IMFs, a Transformer model is adopted to improve the learning of long-term dependencies and nonlinear patterns.
Step 4: Hyperparameter Optimization. The HOA algorithm is utilized to jointly optimize the hyperparameters of both GRU and Transformer models, thereby enhancing the overall predictive performance.
Step 5: Result Integration and Prediction. The final crude oil price forecast is generated by aggregating the individual predictions of all IMF components.
To provide a clear and systematic overview of the entire research framework, Fig. 3 presents a comprehensive graphical abstract. Key research gaps are first identified, including inflexible component allocation, limited integration of external drivers, and suboptimal parameter tuning. The diagram illustrates the model’s multidimensional inputs, comprising nonlinear WTI and Brent crude oil futures prices as well as external factors such as macroeconomic indicators and supply–demand dynamics. The original price series are decomposed using CEEMDAN, followed by complexity assessment of each component. Components are adaptively assigned to the Transformer or GRU models according to their complexity, and the entire process is optimized via the HOA algorithm. The information flow ultimately culminates in the final predicted price.
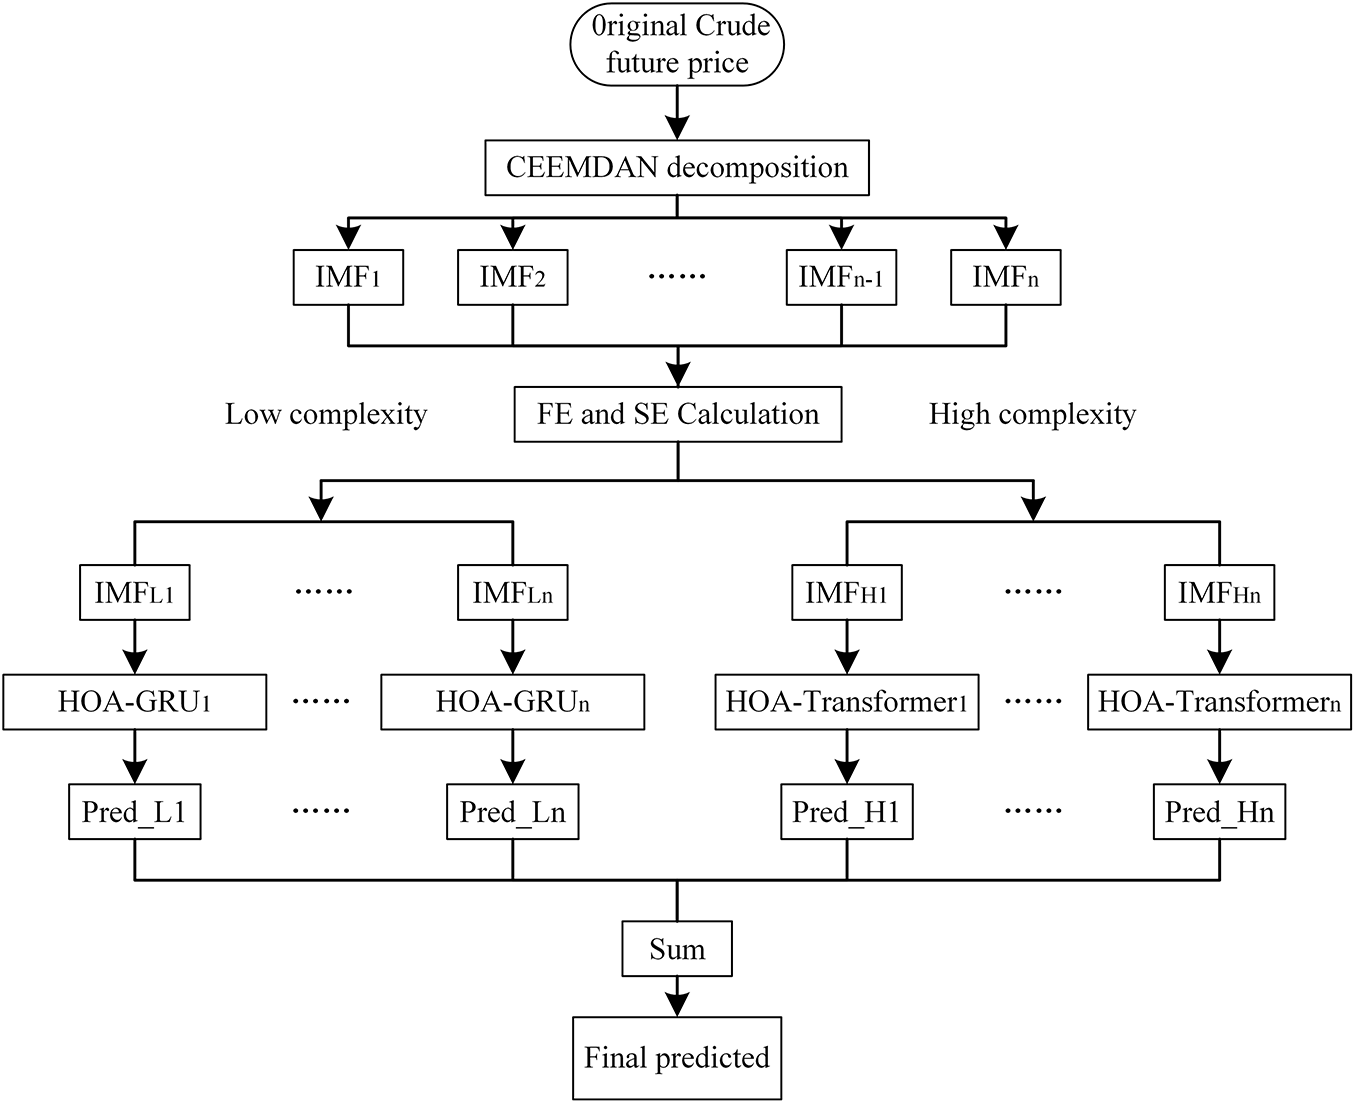
Figure 2: The CEEMDAN-HOA-GRU-Transformer hybrid model prediction framework
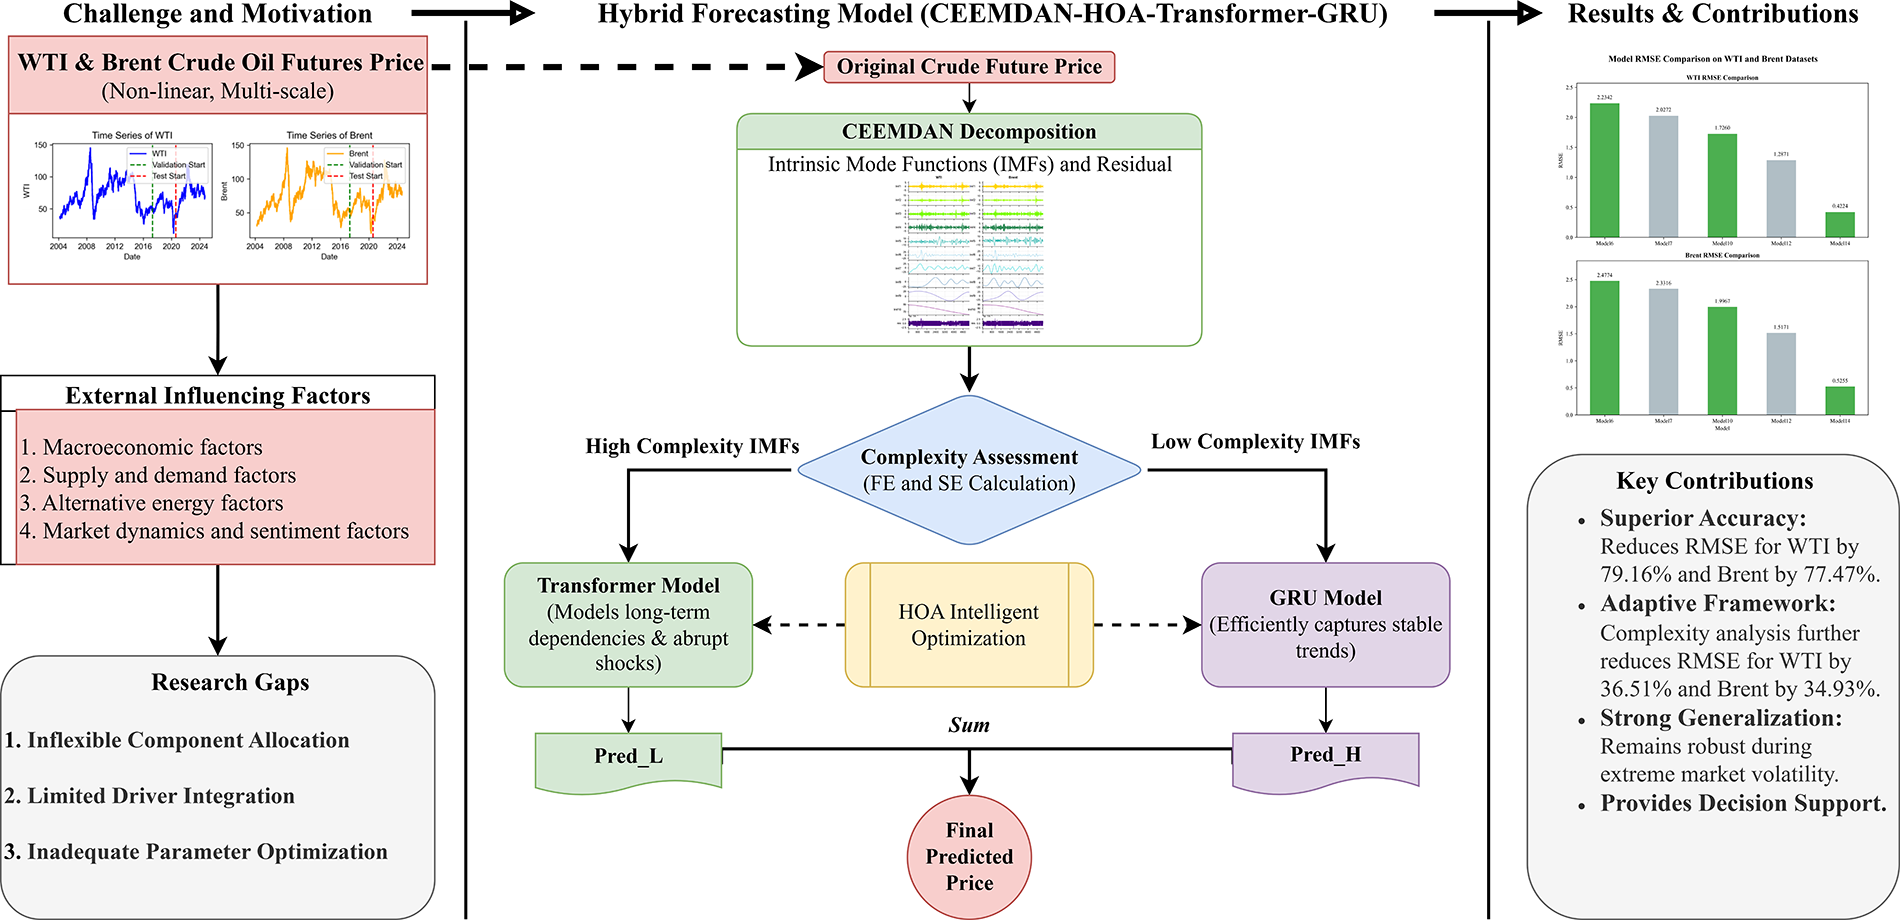
Figure 3: Graphical abstract of the study
3 Experimental Data and Evaluation Metrics
As the two primary global benchmark crudes, WTI and Brent exhibit more pronounced price fluctuations in their futures markets compared to their spot markets. Owing to their high trading volumes and superior liquidity, the most actively traded (main) futures contracts exert a stronger price guidance effect in the market. Accordingly, this study selects the most actively traded futures prices of WTI and Brent crude oil as the research objects for crude oil futures price forecasting. Regarding the data scope, the WTI crude oil futures sample spans from 9 March 2004 to 27 September 2024, comprising 5390 trading days, while the Brent crude oil futures sample covers the period from 01 April 2004 to 29 August 2024, totaling 5326 trading days. The price trends of both series are shown in Fig. 4. The dataset encompasses a variety of market conditions, including upward, downward, and volatile trends, thus representing a relatively complete price cycle. It also incorporates significant market shocks, such as the 2008 global financial crisis, thereby adequately capturing the complexity of crude oil price fluctuations. To ensure data quality and robustness, all data were obtained from authoritative official sources: the U.S. Energy Information Administration https://www.eia.gov/ and the Wind database https://www.wind.com.cn/. Missing values were filled using linear interpolation to maintain continuity, and discrepancies in frequency across sources were standardized to enhance consistency. In terms of geographic dependency, WTI primarily reflects North American crude oil pricing, while Brent represents European and broader international markets; using both benchmarks helps mitigate regional bias and ensures that the dataset captures global crude oil price dynamics. For data partitioning, the original dataset was first divided into training and testing sets in an 8:2 ratio. To further enhance the model’s generalization capability, the last 20% of the training set was designated as the validation set, and an early stopping mechanism was implemented during model training.
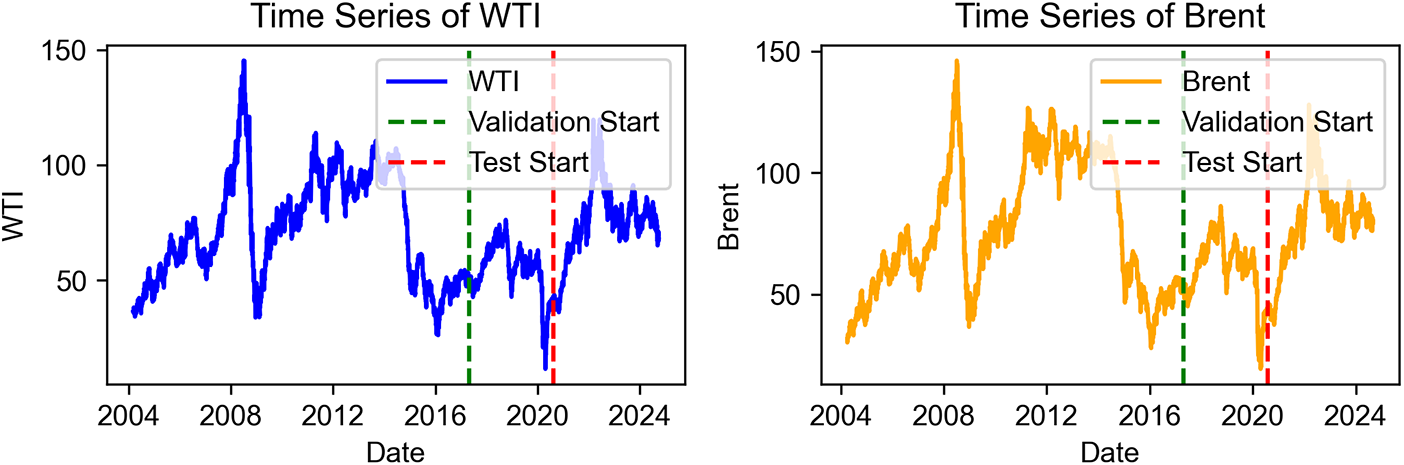
Figure 4: The oil price curve
3.2 Construction of the Indicator System
To comprehensively capture the diverse factors influencing crude oil prices, this study develops a multidimensional indicator system covering macroeconomic conditions, supply–demand fundamentals, alternative energy sources, and market dynamics and sentiment. The macroeconomic environment shapes long-term market trends, supply–demand conditions provide the fundamental basis for pricing, while competition from alternative energy and sentiment factors primarily affect short-term fluctuations. The detailed indicators are listed in Table 2. This multidimensional system establishes a systematic framework for analyzing the impacts of various drivers on oil prices and provides scientific support for forecasting and market decision-making.
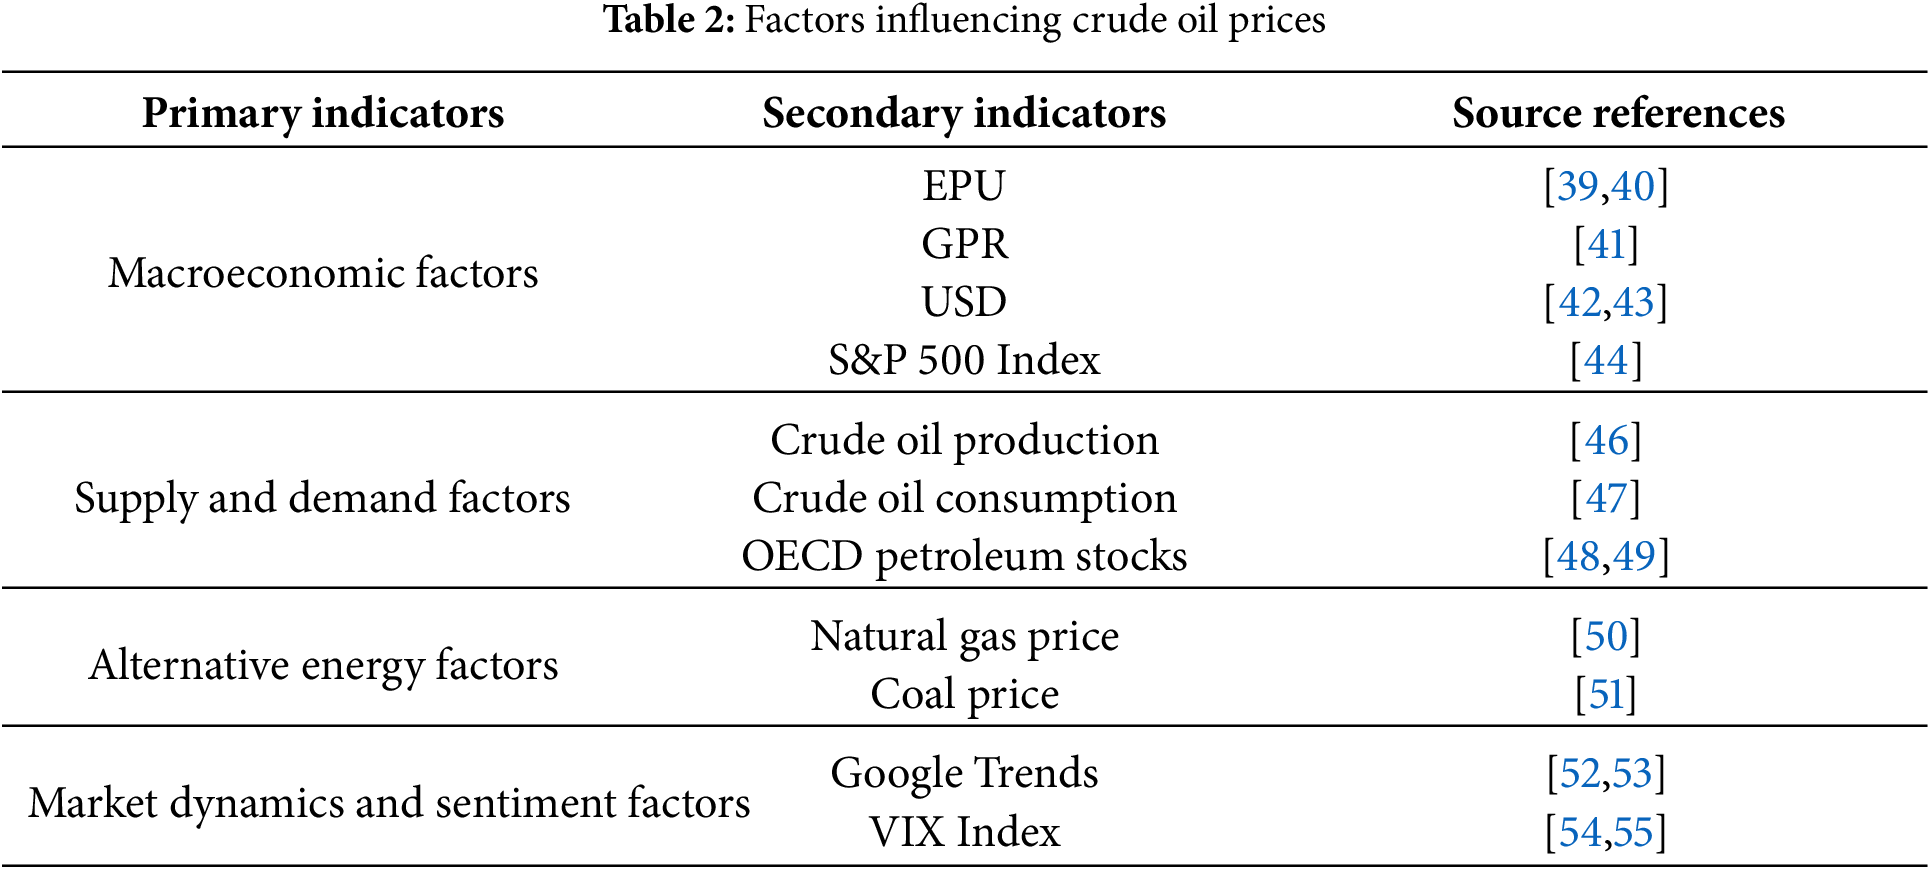
Macroeconomic conditions exert a significant influence on crude oil prices [38]. This study selects four key indicators: the Economic Policy Uncertainty (EPU) Index, the Geopolitical Risk (GPR) Index, the U.S. Dollar Index, and the S&P 500 Index. The EPU Index measures uncertainty in economic policies at global or national levels [39]. High EPU values typically weaken corporate investment and consumer confidence, dampening expectations for growth and oil demand [40]. The GPR Index reflects political tensions on global or regional scales [41]. Events such as wars or sanctions may disrupt oil production and transportation in major producing regions, causing supply interruptions and price increases. The U.S. Dollar Index tracks fluctuations in the dollar’s value against major currencies [42,43]. Since oil is traded globally in dollars, a stronger dollar raises relative costs, reducing demand and suppressing prices, while a weaker dollar stimulates demand and supports prices. The S&P 500 Index represents U.S. economic health [44]. A rising stock market often signals optimism about economic prospects, boosting industrial activity and transportation, thereby increasing oil demand.
3.2.2 Supply and Demand Factors
The supply–demand relationship constitutes the most fundamental determinant of crude oil prices [45]. This study considers key variables from both supply and demand sides, including crude oil production, petroleum product consumption, and oil inventories held by the OECD. Crude oil production directly determines supply levels in the market. An increase in production often leads to oversupply and downward pressure on prices, while a decrease may trigger shortages and drive prices upward [46]. Crude oil consumption reflects the intensity of global economic activity and demand for crude oil and its derivatives [47]. Rising consumption typically indicates robust economic growth, supporting oil prices, whereas declining consumption may signal weak demand and suppress price increases. OECD petroleum stocks serve as a key reference for assessing global supply–demand balance [48]. Rising inventory levels generally indicate oversupply or weakening demand [49], thus exerting downward pressure on prices, whereas falling inventories may reflect tightening supply or strong demand, thereby supporting price levels.
3.2.3 Alternative Energy Factors
The impact of competition from alternative energy sources on crude oil prices warrants consideration. This study includes natural gas prices and coal prices as key indicators to explore their dynamic influence on oil prices. Natural gas prices are a critical factor affecting oil demand [50]. Rising natural gas prices may prompt some industrial and power generation sectors to shift to oil, thereby increasing oil demand. Conversely, declining natural gas prices can reduce substitution costs, weakening oil demand and exerting downward pressure on prices. Coal prices continue to play a significant role in the energy markets of certain regions. Fluctuations in coal prices directly affect its competitiveness with crude oil [51], influencing expectations for oil demand.
3.2.4 Market Dynamics and Sentiment Factors
Market sentiment and investor behavior are important drivers of short-term crude oil price fluctuations. To capture these effects, this study employs the Google Trends Index and the VIX as representative indicators. The Google Trends Index measures the relative frequency of search terms, serving as a proxy for public attention and sentiment dynamics [52]. Prior studies show that increased oil-related searches often signal heightened market concern and potential price volatility [53]. Here, a composite Google Trends indicator is constructed from seven keywords: crude oil price, WTI crude, Brent crude, oil market, crude oil production, oil demand, and oil supply, reflecting both market attention and shifts in public sentiment. The VIX, developed by the Chicago Board Options Exchange, is widely used to gauge market uncertainty and investor fear [54,55]. A rising VIX indicates stronger risk aversion, prompting investors to shift capital toward safer assets such as gold or bonds, which in turn may depress crude oil prices.
3.3 Final Selection of Indicators
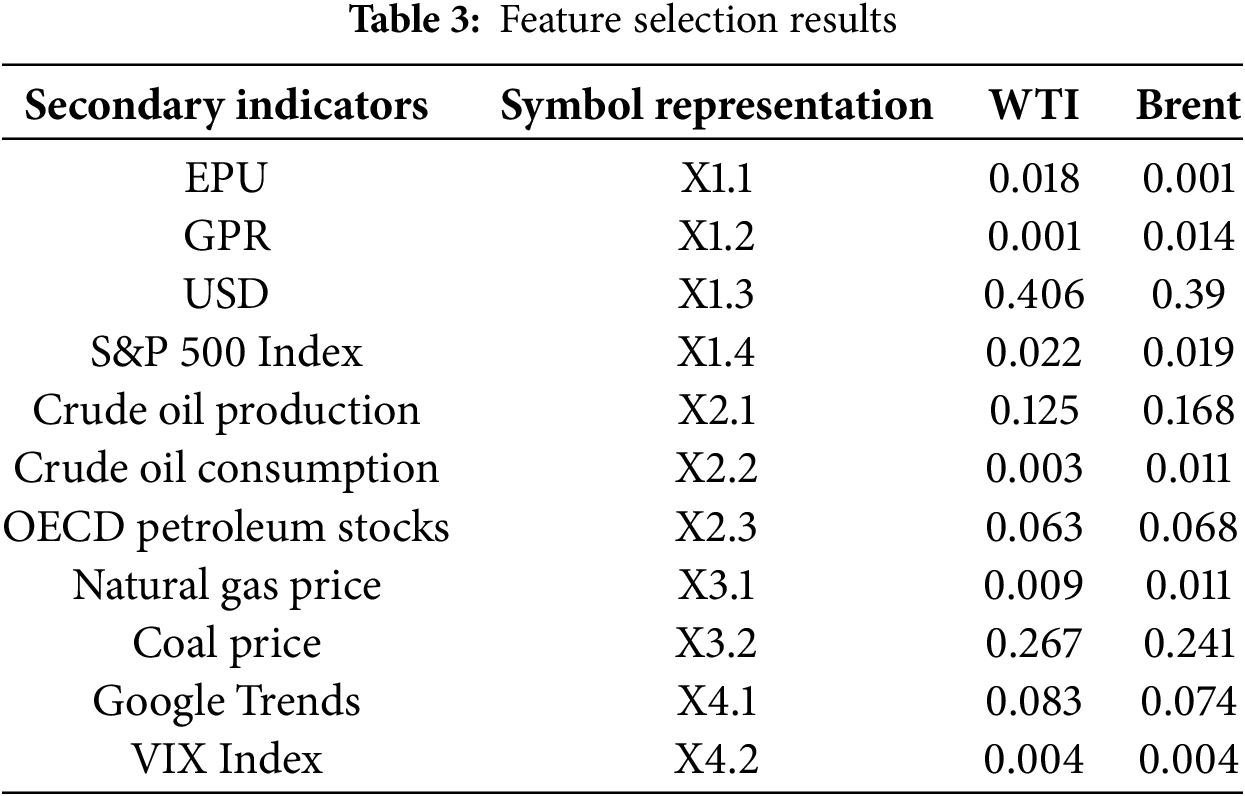
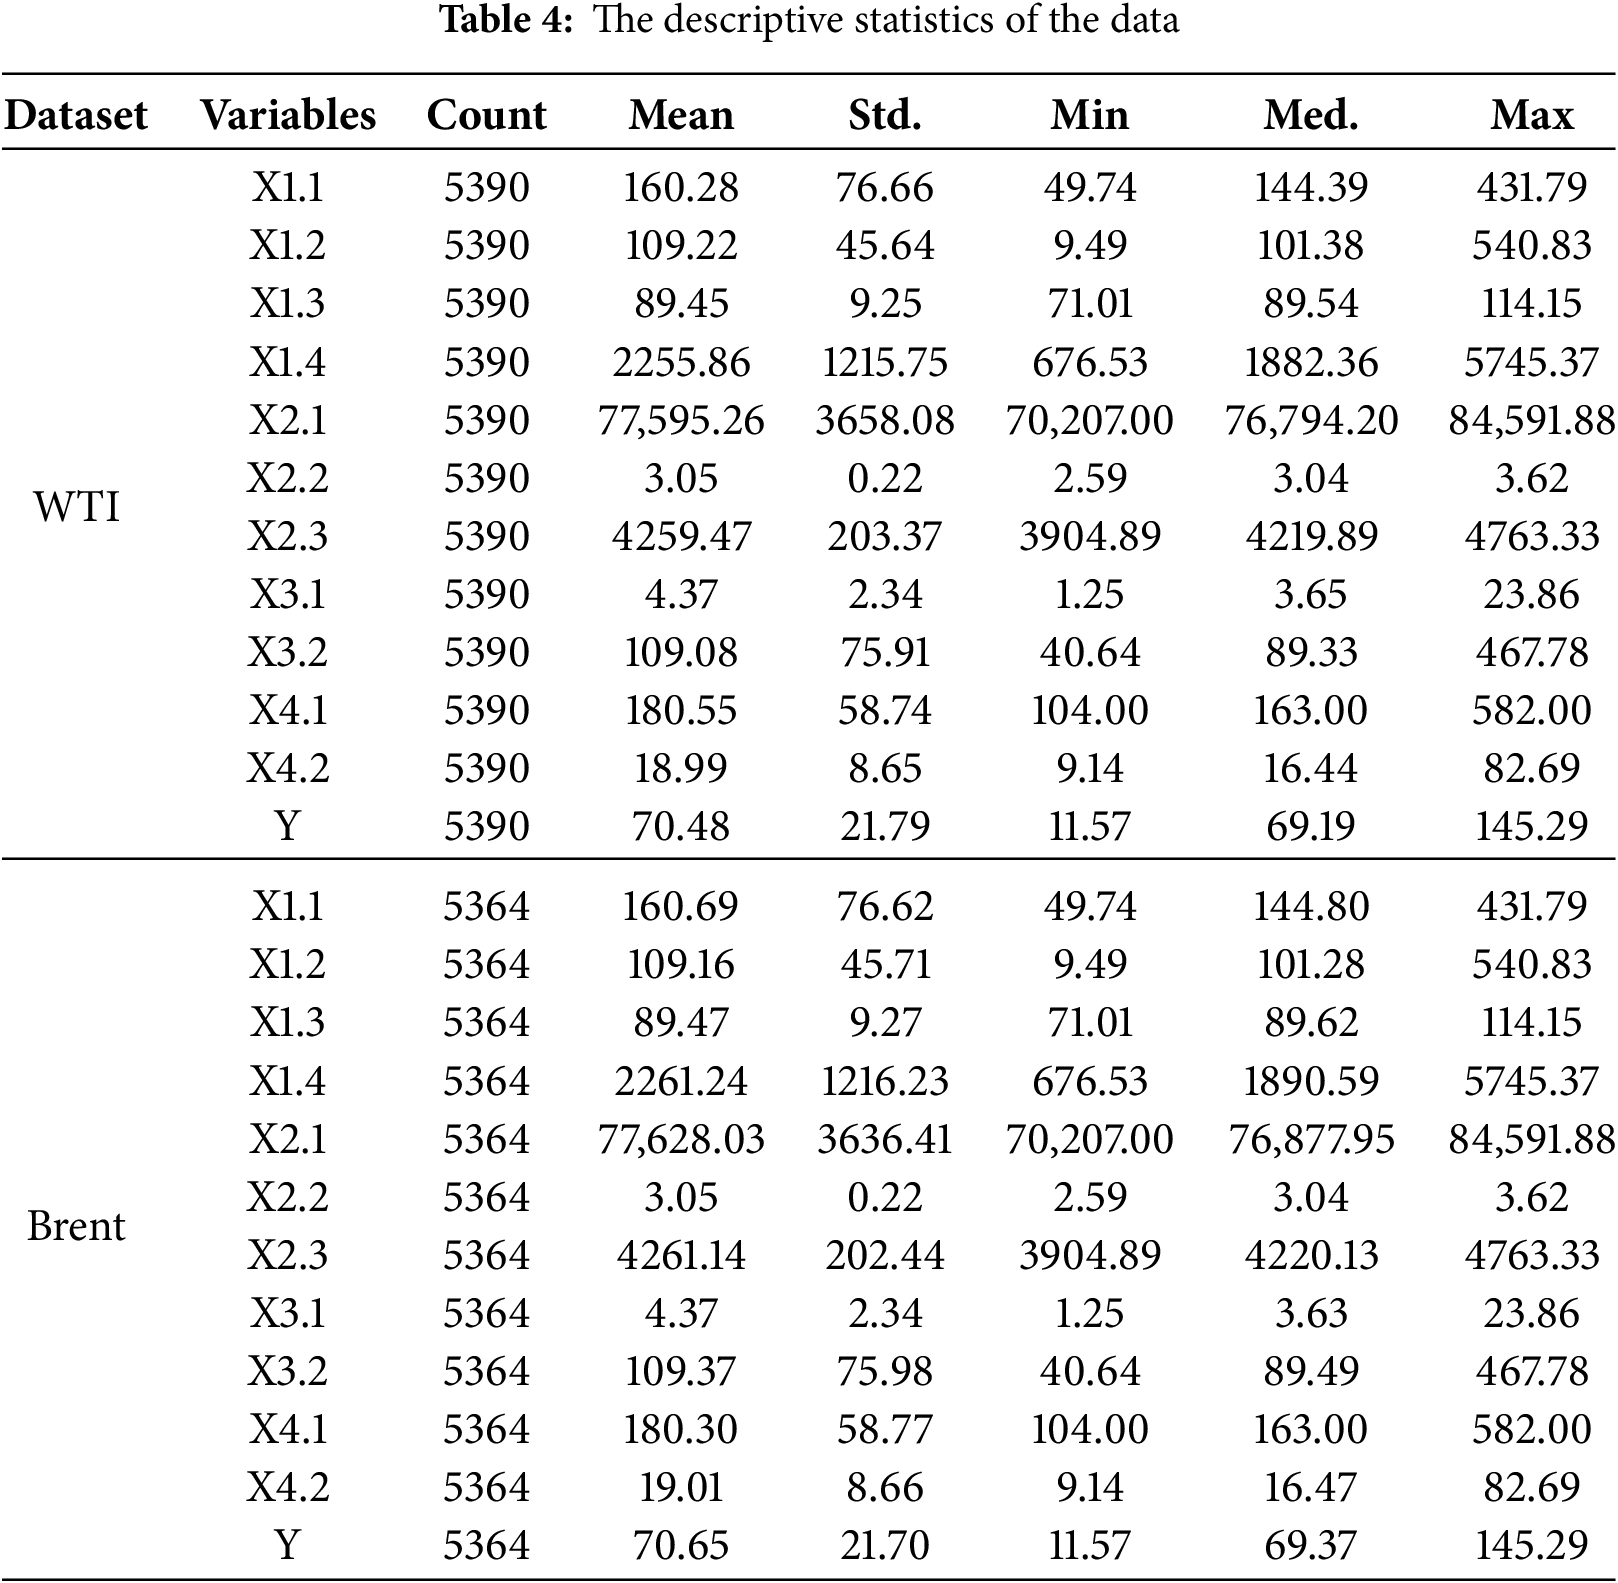
Based on a comprehensive review of the existing literature, a preliminary set of potential factors influencing crude oil prices was identified. To reduce model complexity and eliminate redundancy among input features, the Random Forest algorithm was employed for feature dimensionality reduction, aiming to select the key factors most strongly correlated with crude oil futures prices. The results of the Random Forest feature selection are presented in Table 3. The analysis revealed that the GPR received the lowest importance score for WTI crude oil futures prices, whereas the EPU ranked lowest for Brent crude oil futures prices. Consequently, these two variables were excluded from further analysis. The final sets of external influencing factors were determined as follows: for WTI crude oil futures prices, {X1.1, X1.3, X1.4, X2.1, X2.2, X2.3, X3.1, X3.2, X4.1, X4.2}; and for Brent crude oil futures prices, {X1.2, X1.3, X1.4, X2.1, X2.2, X2.3, X3.1, X3.2, X4.1, X4.2}. Descriptive statistics for both crude oil futures price series and their associated influencing factors are provided in Table 4.
Heterogeneity in the dimensions and differences in numerical ranges among features may cause certain variables to dominate during model training, thereby adversely affecting the overall performance and generalization ability of the model. To address this issue, this study employs normalization to preprocess the original data. This method performs a linear transformation to scale the data into the [0, 1] range, effectively removing dimensional units and ensuring that all features are compared on a uniform scale. The normalization formula is expressed as follows:
where
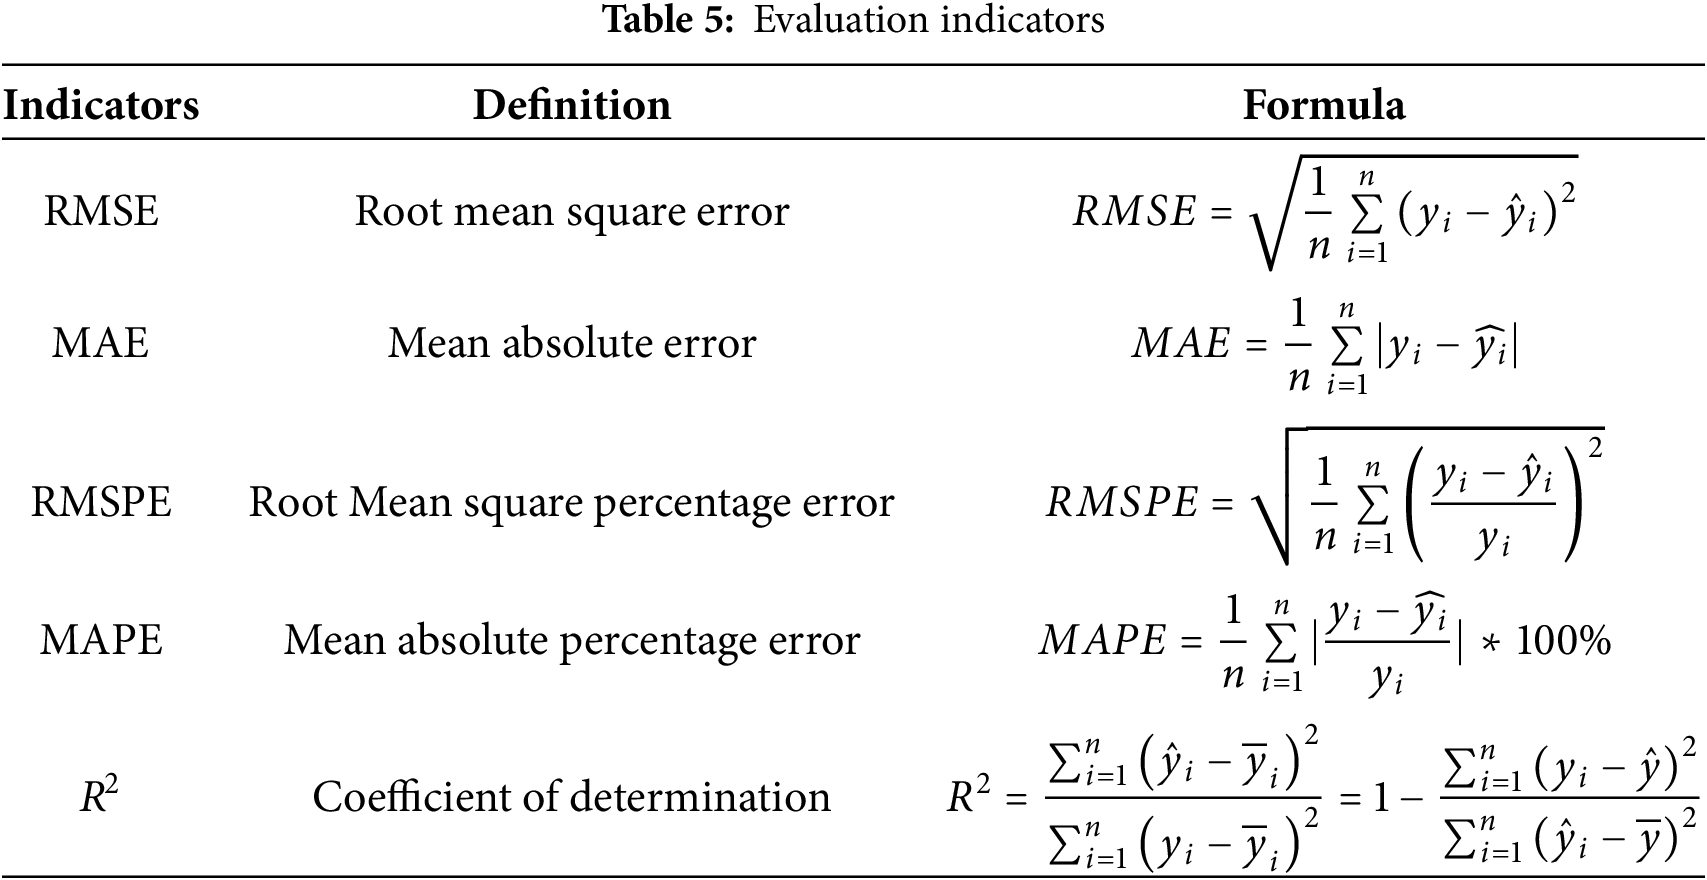
To comprehensively evaluate the predictive performance of the proposed model, five key evaluation metrics are adopted in this study: RMSE, Mean Absolute Error (MAE), Root Mean Squared Percentage Error (RMSPE), Mean Absolute Percentage Error (MAPE), and the Coefficient of Determination (R2). These metrics quantify the deviation between predicted and actual values from different perspectives, thereby providing a multidimensional assessment of the model’s accuracy and robustness. They also serve as important criteria for model optimization and selection. The detailed formulas and interpretations of these evaluation metrics are presented in Table 5.
4 Experimental Design and Analysis
This chapter systematically outlines the experimental design methodology, computational environment, and performance evaluation metrics. The study aims to assess the effectiveness of model architecture selection, signal decomposition strategies, complexity feature extraction, and intelligent optimization techniques through a series of comprehensive comparative experiments. The primary prediction task involves forecasting the crude oil price for the following day using historical data from the preceding three days.
To ensure comparability of experimental results and scientific rigor of the conclusions, all experiments were conducted using a unified dataset, consistent evaluation metrics, and a standardized computing environment. The hardware configuration consisted of a computer equipped with an Intel 14th generation Core i7-14650HX processor.
4.1.1 Model and Algorithm Settings
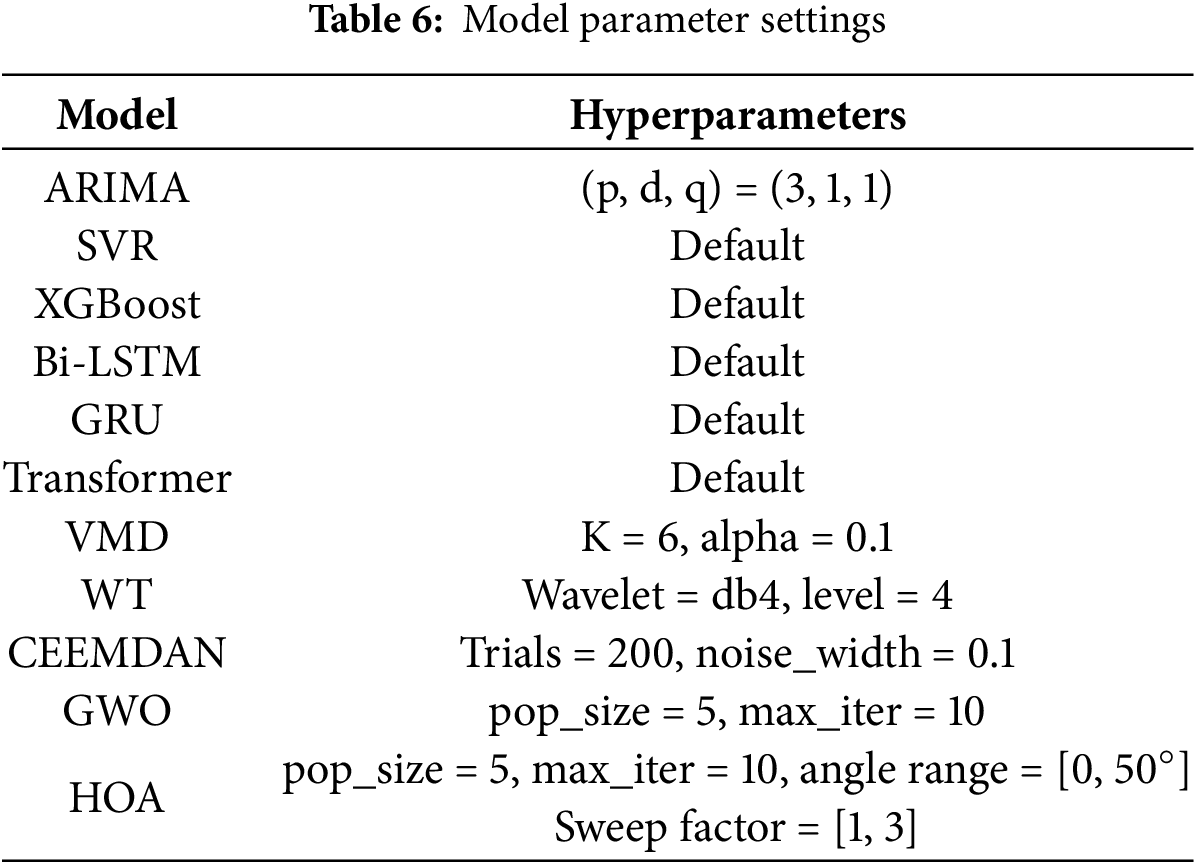
This study employs widely adopted forecasting models, including ARIMA, SVR, XGBoost, Bi-LSTM, GRU, and Transformer, as baseline algorithms. In addition, signal decomposition techniques such as Wavelet Transform (WT), VMD, and CEEMDAN are incorporated for comparative analysis. For the ARIMA model, the order parameters (p, d, q) = (3, 1, 1) are determined based on the partial autocorrelation function (PACF) and autocorrelation function (ACF) plots. Hyperparameter optimization for the forecasting models is conducted using Grey Wolf Optimization (GWO) and the HOA algorithms to further enhance predictive accuracy. The main parameter configurations are summarized in Table 6, with detailed settings provided as follows:
(1) Deep learning training parameters: The number of training epochs is uniformly set to 50, and the batch size is fixed at 64.
(2) Signal decomposition parameters: For VMD, the number of modes was set to six based on both signal characteristics and empirical considerations, striking a balance between decomposition granularity and mode mixing. The parameter α was set to 0.1 to ensure both the smoothness of modal components and bandwidth constraints. In WT, the db4 wavelet was selected for its favorable regularity properties, making it well-suited for nonstationary signal analysis; a four-level decomposition was employed to effectively extract the primary feature frequency bands. For CEEMDAN, 200 realizations and a noise amplitude of 0.1 were used to suppress mode splitting and enhance decomposition stability, while preserving reconstruction accuracy.
(3) GRU hyperparameter optimization bounds: The lower bounds are [32, 0.0001, 32, 10, 0.01], and the upper bounds are [256, 0.001, 64, 50, 0.5], corresponding sequentially to hidden units, learning rate, batch size, epochs, and dropout rate.
(4) Transformer hyperparameter optimization bounds: The lower bounds are [32, 2, 1, 0.1, 0.0001, 10, 8], and the upper bounds are [256, 8, 6, 0.5, 0.001, 50, 64], corresponding respectively to feature dimension (d_model), number of attention heads (num_heads), number of encoder layers (num_layers), dropout rate, learning rate, training epochs, and batch size.
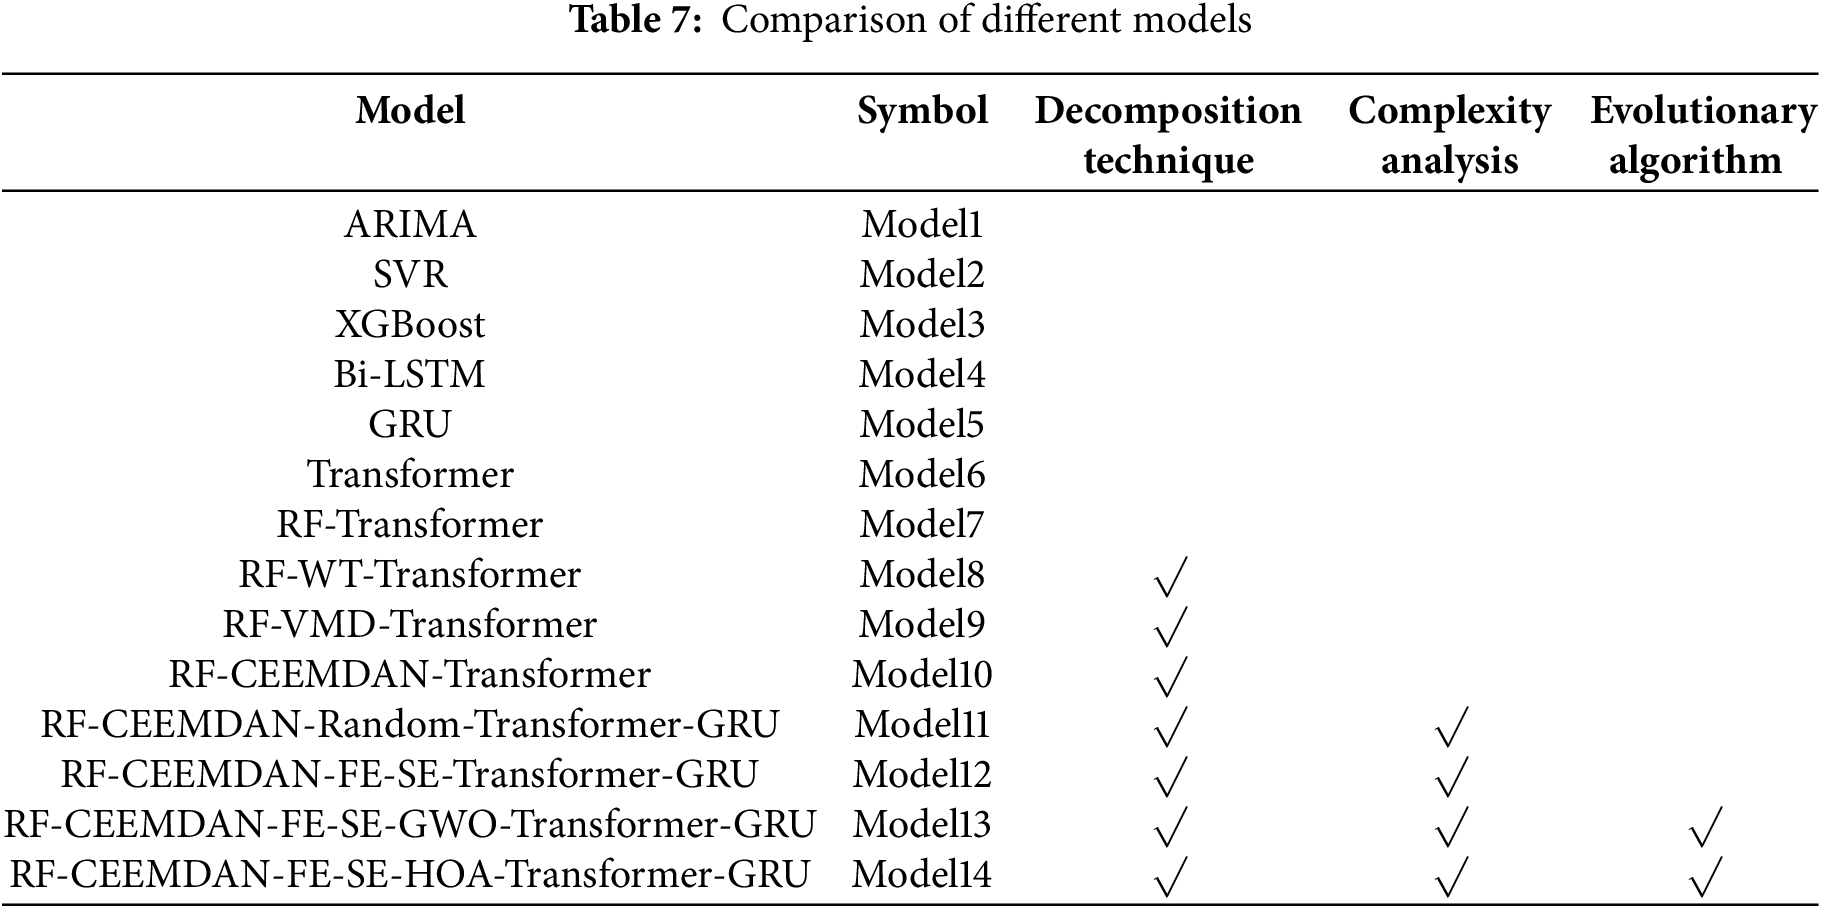
To comprehensively evaluate model performance, this study constructs and compares 14 forecasting models encompassing traditional time series methods, machine learning algorithms, deep learning architectures, signal decomposition hybrid models, and integrated schemes combining complexity feature extraction with intelligent optimization. The configurations and technical characteristics of each model are summarized in Table 7. The models are grouped as follows:
(1) Baseline models: Models 1 to 6 correspond to ARIMA, SVR, XGBoost, Bi-LSTM, GRU, and Transformer, respectively, serving as benchmark models.
(2) Feature selection enhanced model: Model 7 incorporates feature selection via Random Forest (RF) to improve the extraction of key features.
(3) Signal decomposition comparison models: Models 8 to 10 introduce different signal decomposition methods, specifically Wavelet Transform (WT), Variational Mode Decomposition (VMD), and CEEMDAN.
(4) Ablation study model: Model 11 randomly assigns CEEMDAN-decomposed components to GRU and Transformer for prediction, aimed at validating the effectiveness of the component-to-model matching strategy.
(5) Complexity feature classification model: Model 12 builds upon CEEMDAN decomposition by integrating Fuzzy Entropy (FE) and Sample Entropy (SE) for component classification.
(6) Optimization algorithm comparison models: Models 13 and 14 employ GWO and HOA for hyperparameter tuning, respectively. Model 14, proposed herein as the final model, integrates CEEMDAN decomposition, complexity feature extraction, and HOA optimization to thoroughly capture the nonlinear dynamic characteristics and deep temporal structures of crude oil futures price series, thereby enhancing predictive accuracy and generalization capability.
4.2 Component Complexity Analysis
To comprehensively investigate the dynamic characteristics of crude oil futures price series, this study first performed a comparative analysis of three signal decomposition methods: WT, VMD, and CEEMDAN. The results indicate that, compared to WT and VMD, CEEMDAN exhibits superior accuracy and stability in capturing the non-stationarity and intrinsic structure of crude oil price series, effectively isolating fluctuation components across multiple time scales. Consequently, CEEMDAN was selected as the signal decomposition method for this study. Based on CEEMDAN decomposition, both WTI and Brent crude oil futures price series were decomposed into ten IMFs, with their time-domain representations illustrated in Fig. 5.
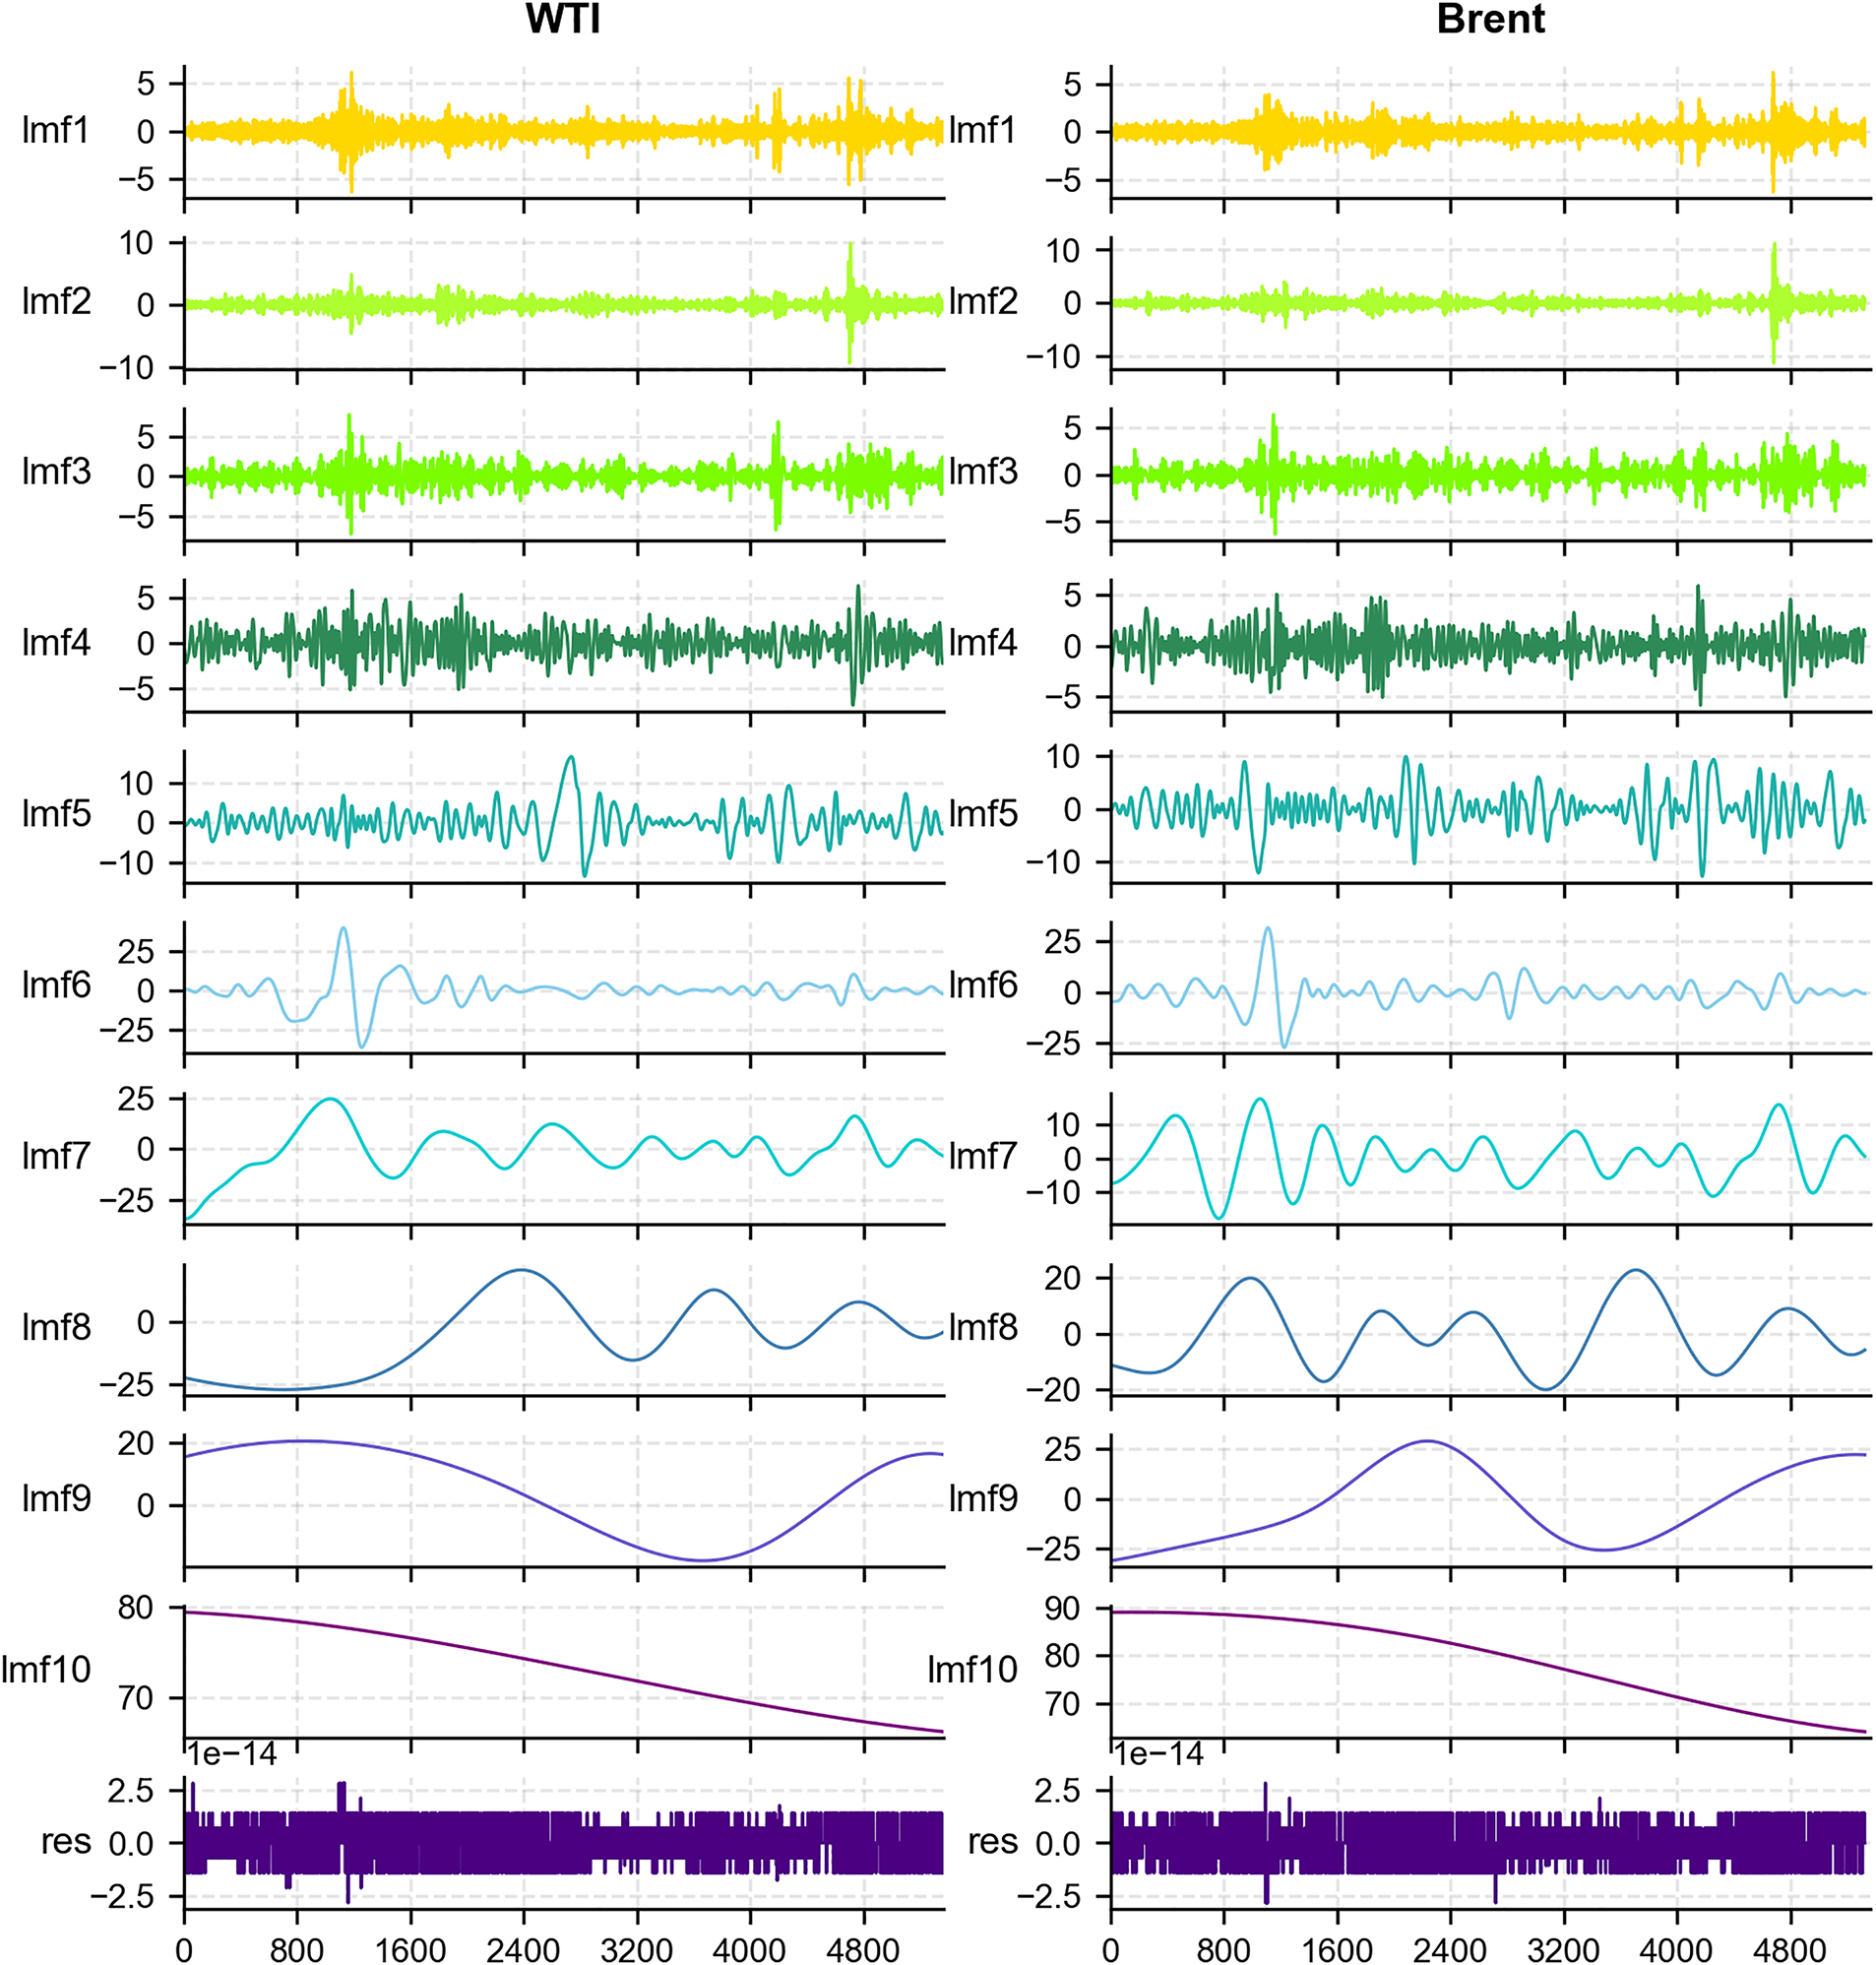
Figure 5: Signal decomposition analysis
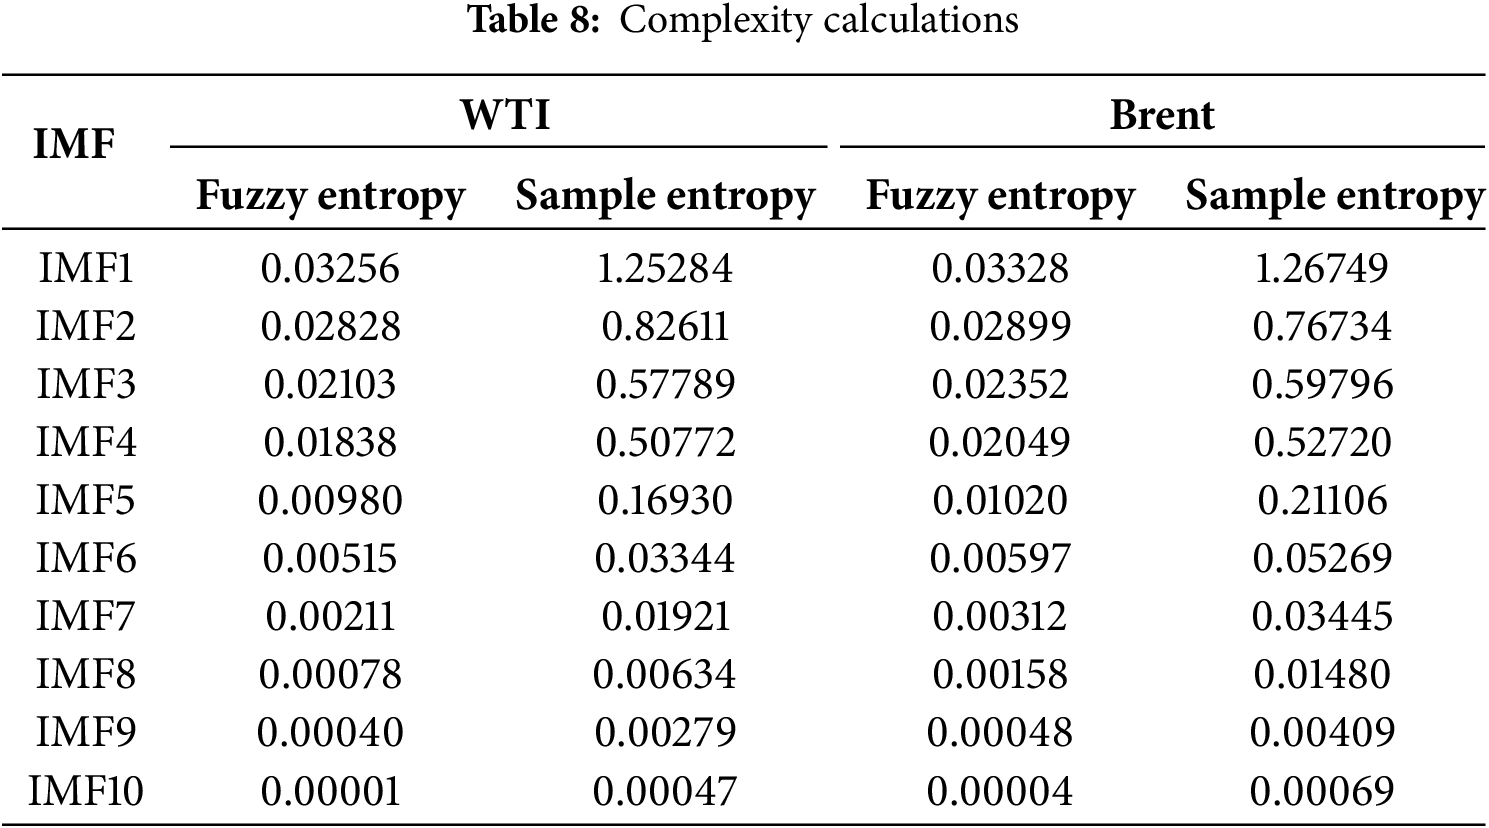
To further quantify the dynamic features of the IMF components, two widely adopted complexity metrics were applied: Fuzzy Entropy and Sample Entropy. Fuzzy Entropy captures the fuzziness and uncertainty inherent in the signal, whereas Sample Entropy highlights its self-similarity and unpredictability. The calculation of these entropy measures revealed clear variations in complexity levels among the IMF components, as shown in Table 8. Following the approach of prior studies [56], which classified IMFs according to entropy distributions, we employed empirically derived thresholds based on the statistical characteristics of our dataset. Components with Fuzzy Entropy values above 0.08 and Sample Entropy values above 0.1 were categorized as high-complexity, while the remaining components were assigned to the low-complexity group. This data-driven classification enhances methodological transparency and provides a reliable foundation for subsequent modeling and analysis.
4.3 Cross-Validation for Model Generalization
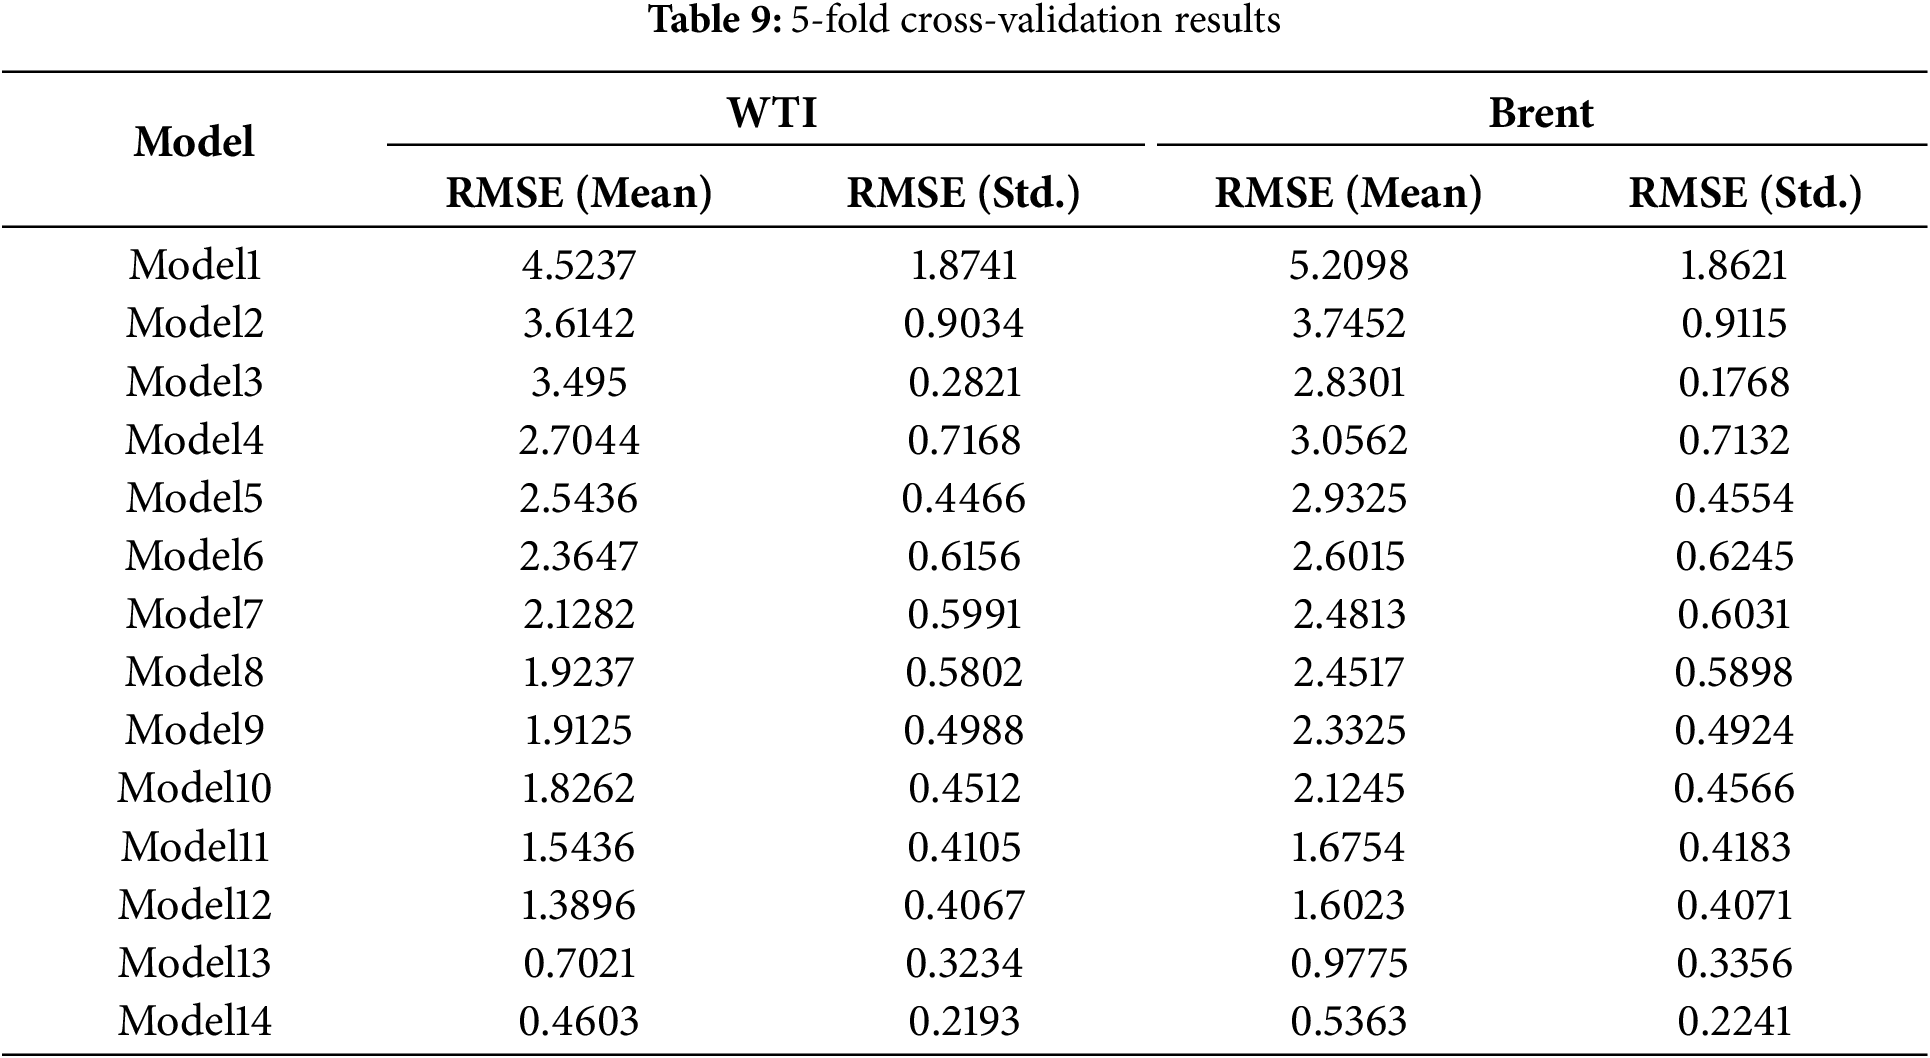
To rigorously examine the generalization capability of the forecasting models, a 5-fold time series cross-validation was performed. In this procedure, the training set was partitioned into five sequential folds, with each fold in turn serving as the validation set while the remaining folds were used for model training. This design preserves the temporal dependence of the data and avoids information leakage, thereby ensuring a reliable assessment of model robustness.
Table 9 presents the mean and standard deviation of the root mean squared errors (RMSEs) across the five folds for both WTI and Brent crude oil futures. The results reveal a progressive enhancement in predictive accuracy as the modeling framework advances from baseline approaches (Models 1–6) to hybrid and optimization-based schemes (Models 7–14). In particular, the proposed Model 14 achieves the lowest mean RMSE with the smallest variance for both datasets (0.4603 for WTI and 0.5363 for Brent), highlighting not only superior accuracy but also improved stability relative to alternative models. These outcomes confirm that the proposed model demonstrates strong generalization performance under cross-validation, thereby providing a reliable basis for subsequent evaluation on the independent test set.
4.4 Results of Crude Oil Price Forecasting
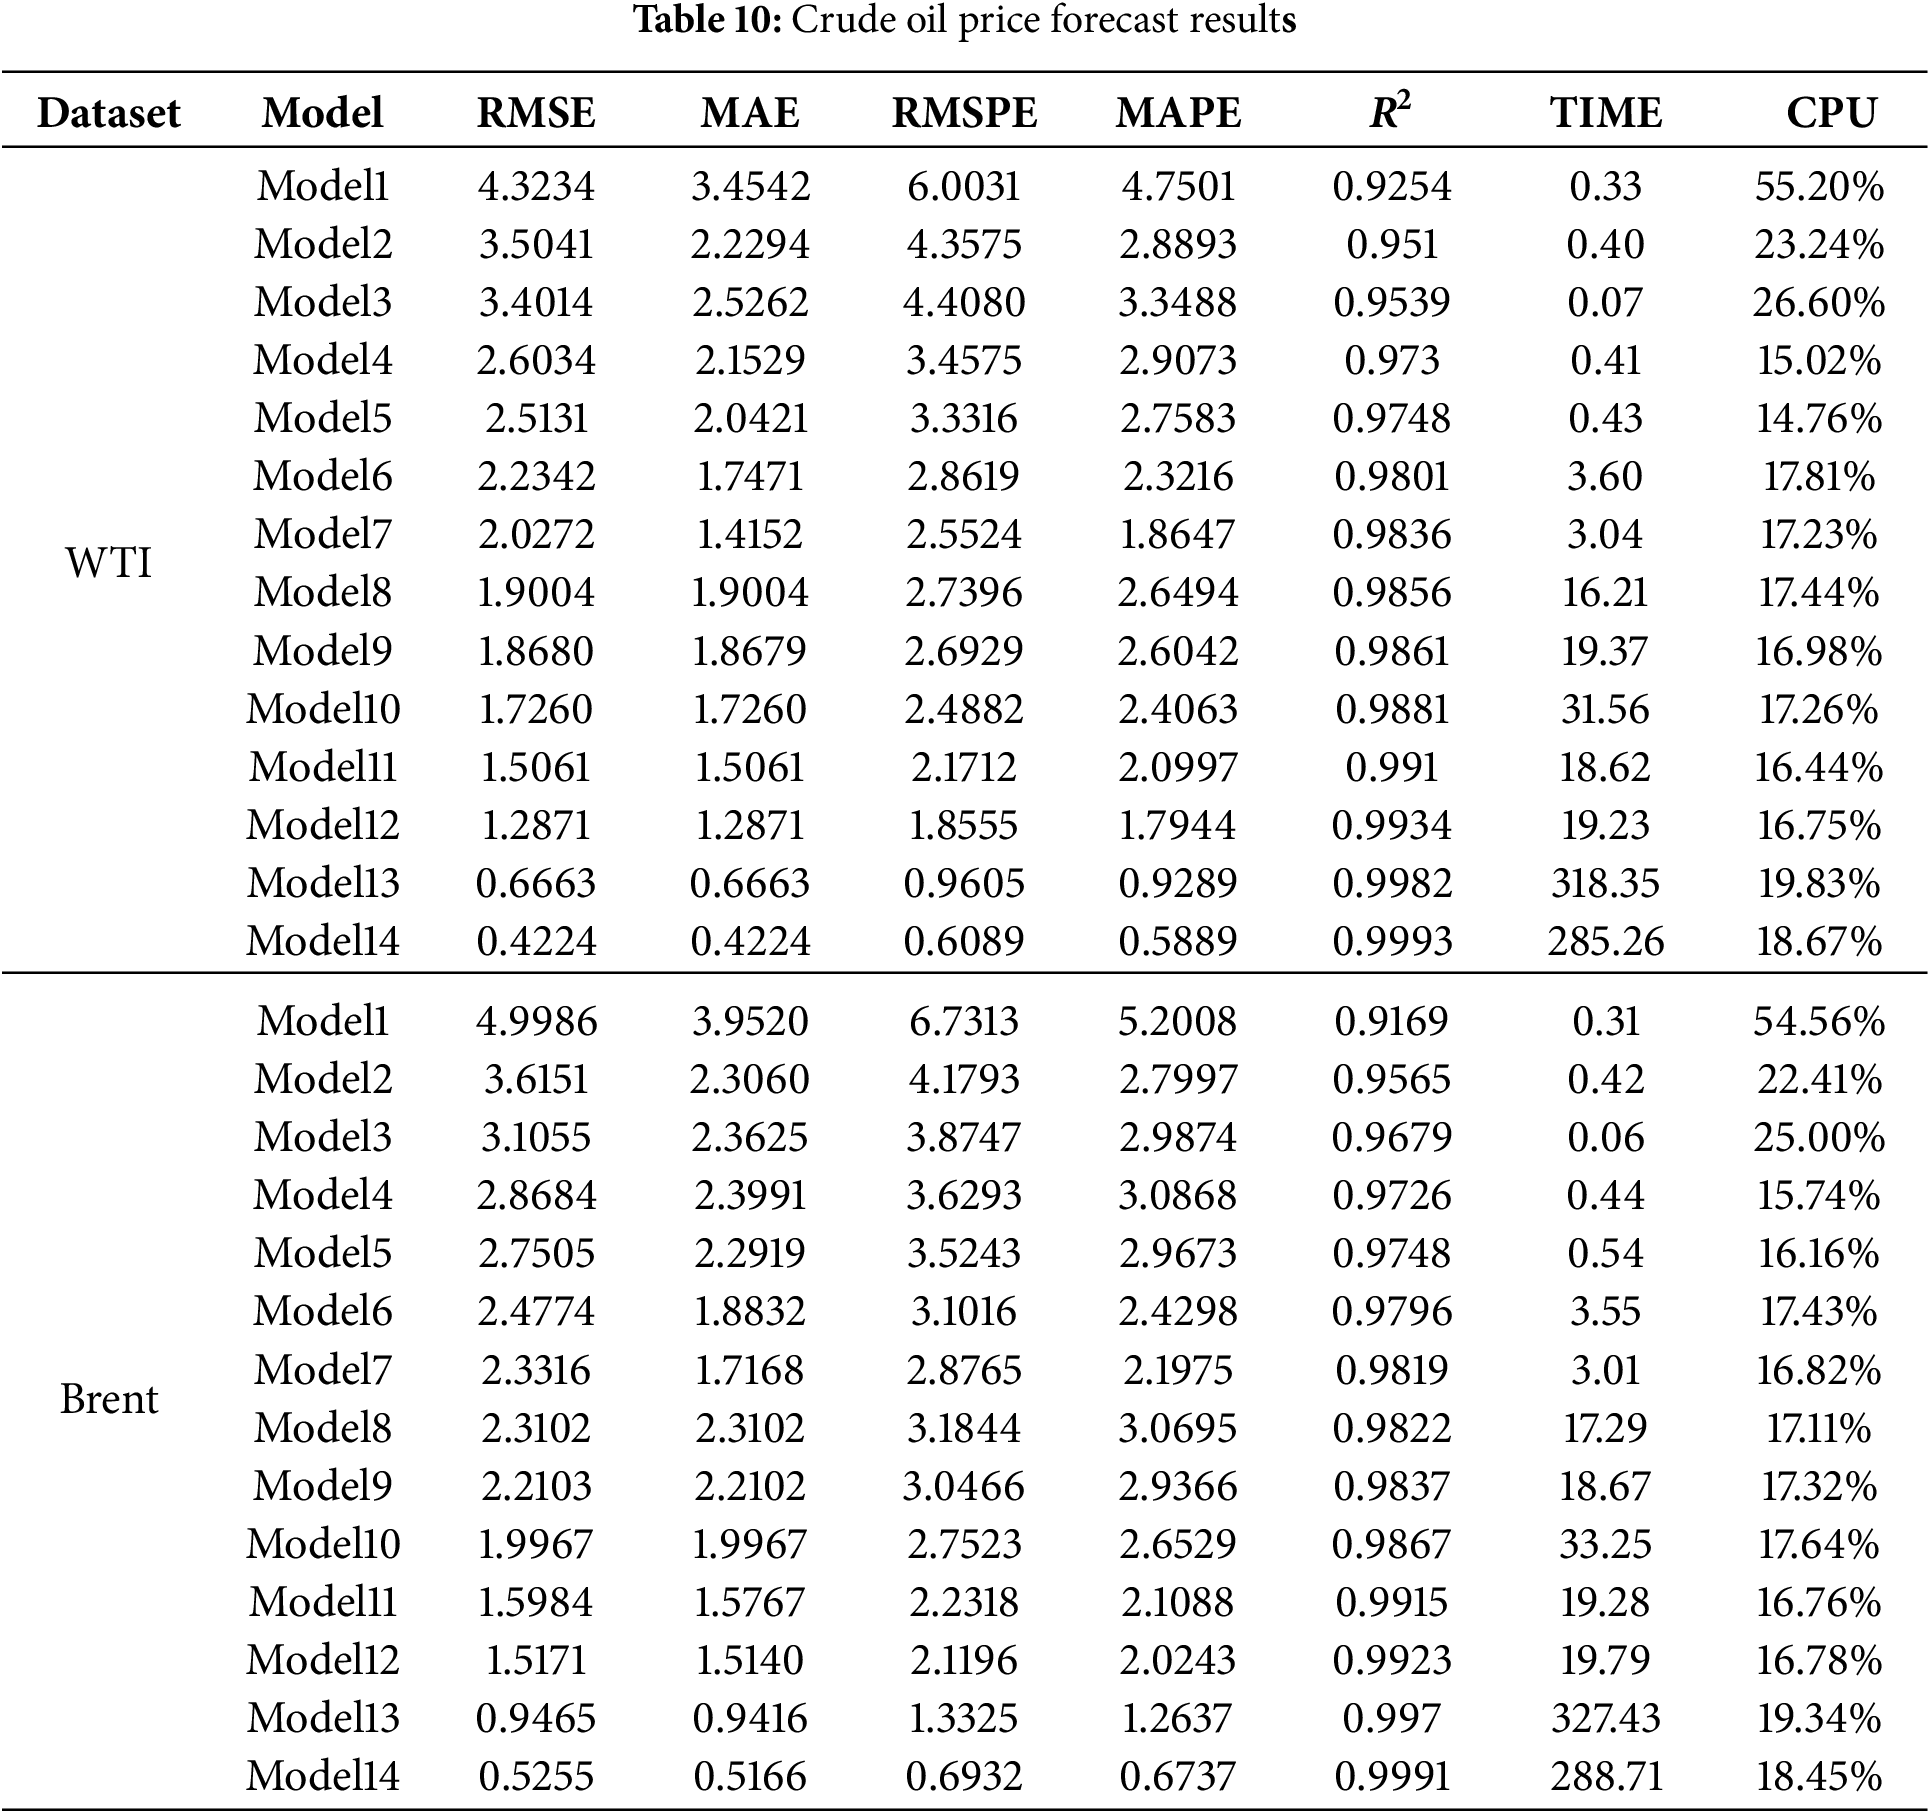
Based on the forecasting results for WTI and Brent crude oil futures (Table 10), the proposed RF–CEEMDAN–FE–SE–HOA–Transformer–GRU hybrid model (Model 14) consistently demonstrates superior performance across both datasets. The RMSE values decrease to 0.4224 and 0.5255, while the R2 values rise to 0.9993 and 0.9991 for WTI and Brent, respectively, confirming outstanding predictive accuracy and robust generalization capability. In contrast, the baseline Transformer (Model 6) yields RMSE values of 2.2342 and 2.4774, with runtimes of about 3.6 min, highlighting a significant performance gap. The integration of Random Forest–based feature selection (Model 7) further improves accuracy and efficiency, underscoring the critical role of feature extraction. Subsequently, the use of signal decomposition methods, including WT, VMD, and CEEMDAN (Models 8 to 10), provides additional accuracy gains. Among these, CEEMDAN achieves RMSE values of 1.7260 and 1.9967, although with longer computation times. The ablation model (Model 11), which randomly allocates decomposed components, shows reduced stability, emphasizing the necessity of appropriate component–model alignment. Incorporating fuzzy entropy and sample entropy for complexity classification (Model 12) further enhances performance, lowering the RMSE to 1.2871 and 1.5171. Finally, optimization algorithms lead to further improvements. The GWO-based model (Model 13) achieves RMSE values of 0.6663 and 0.9465, while the HOA-based model (Model 14) delivers the best results, producing near-perfect fits for both WTI and Brent. Although the computation times are relatively long, the substantial accuracy advantage underscores the effectiveness and scalability of the proposed method.
Figs. 6 and 7 present the predicted price curves of WTI and Brent under different models, with insets highlighting the period from February to June 2022, during which the Russia–Ukraine conflict triggered market panic and extreme oil price volatility. Despite the large amplitude and high frequency of price fluctuations during this period, the proposed model maintained high prediction accuracy, demonstrating strong robustness and adaptability in handling sudden and extreme market events.
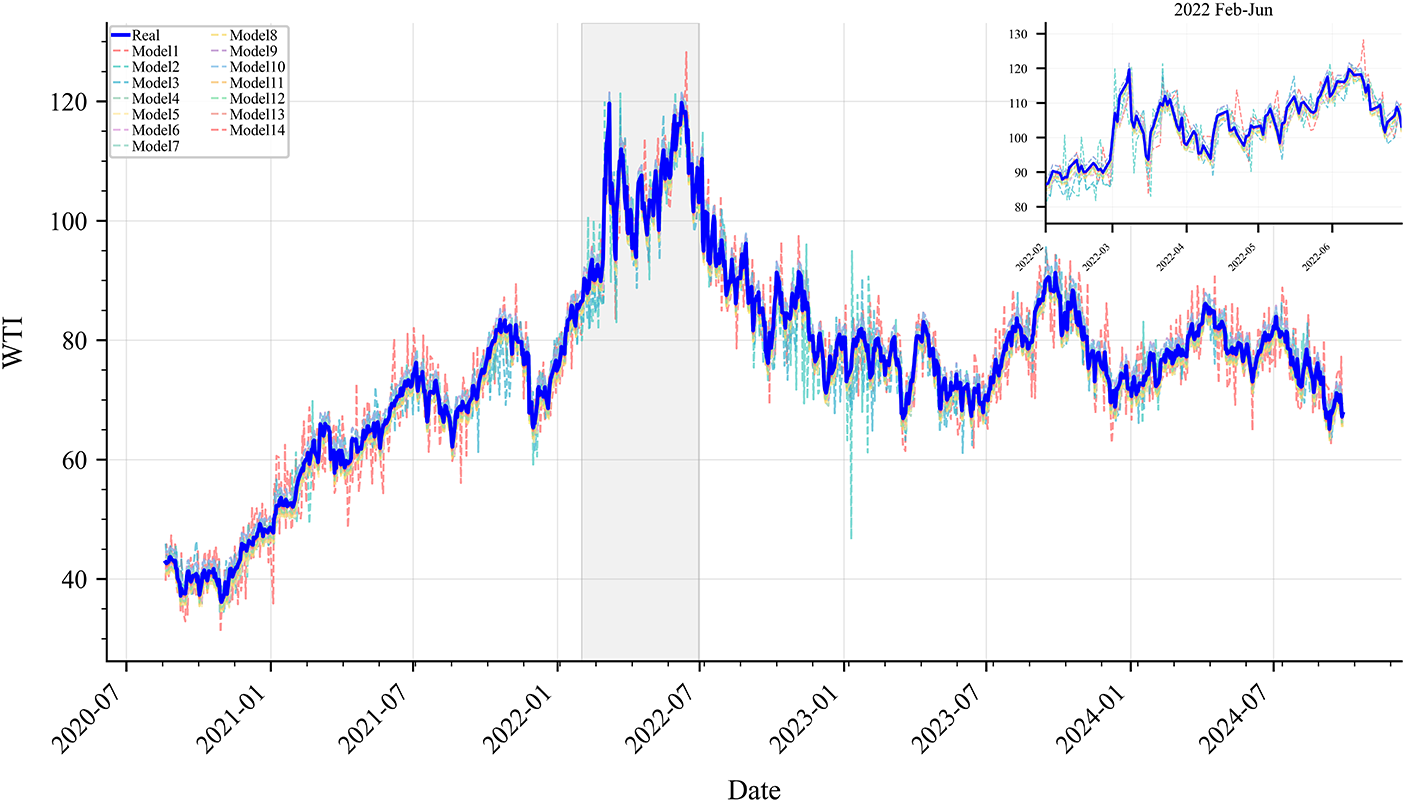
Figure 6: Prediction results of different models on the WTI Test Set
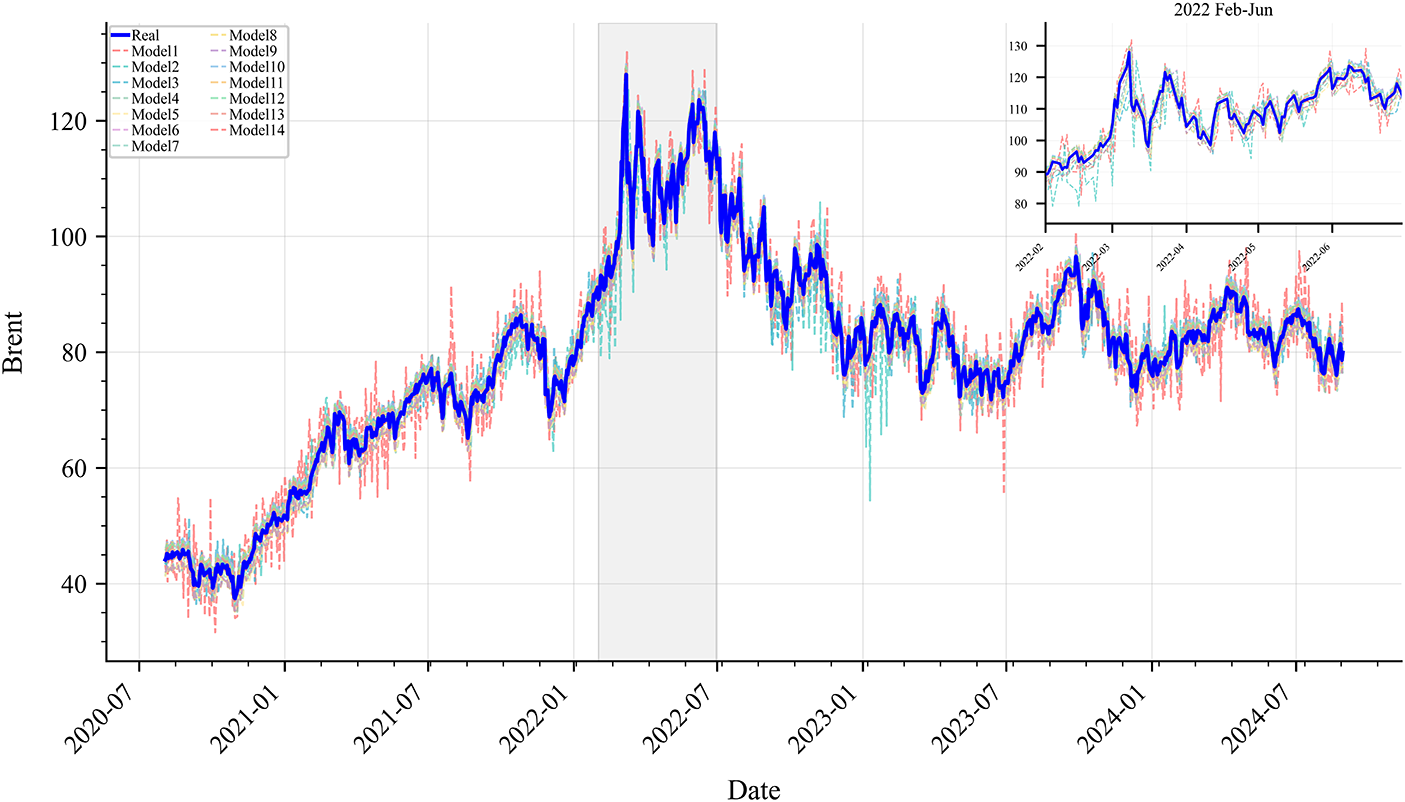
Figure 7: Prediction results of different models on the Brent Test Set
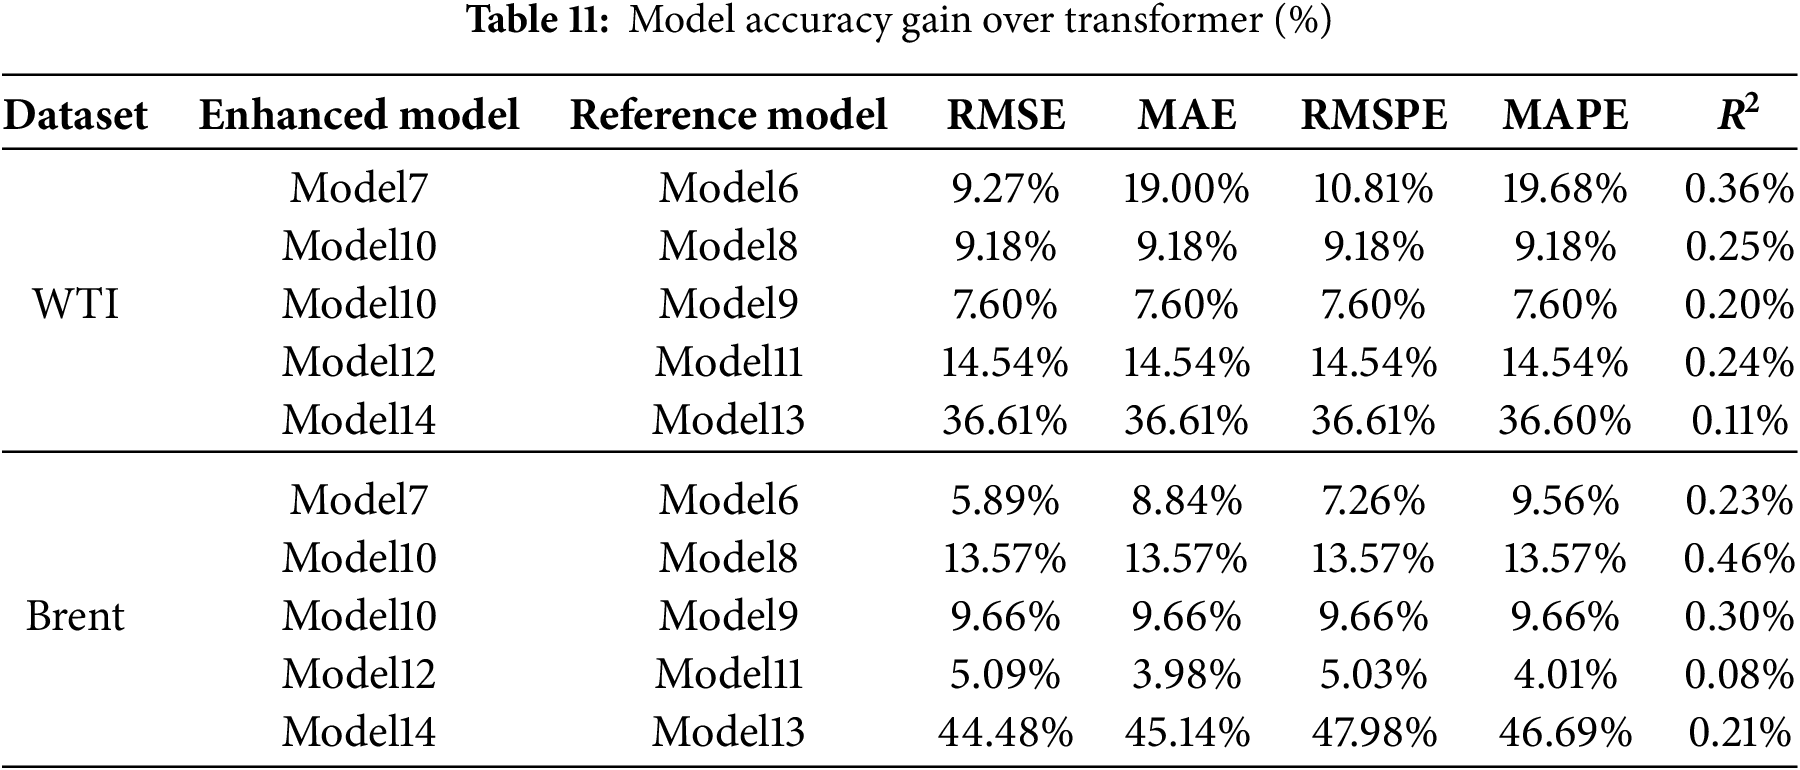
In addition, to provide a more intuitive comparison of the performance gains among different models, Table 11 summarizes the relative improvement percentages of the major models across five evaluation metrics. The analysis of improvement magnitudes indicates that feature selection, signal decomposition, complexity-based feature classification, and intelligent optimization strategies all substantially enhance predictive performance. For WTI forecasting, incorporating feature selection (Model 7) yields an average improvement of approximately 13.3% over the baseline Transformer model (Model 6) across all metrics. The CEEMDAN-based model (Model 10) outperforms the WT-based model (Model 8) and the VMD-based model (Model 9) by approximately 9.2% and 7.6%, respectively. The complexity-based feature classification approach (Model 12) achieves more than a 14% improvement over the random allocation strategy (Model 11), while the final model (Model 14) exhibits an improvement exceeding 36% compared with the GWO (Model 13). For Brent forecasting, the improvement trends are generally consistent with those observed for WTI, with Model 14 achieving an even greater enhancement over Model 13, surpassing 44%. These results provide strong evidence for the effectiveness and robustness of the proposed methodology.
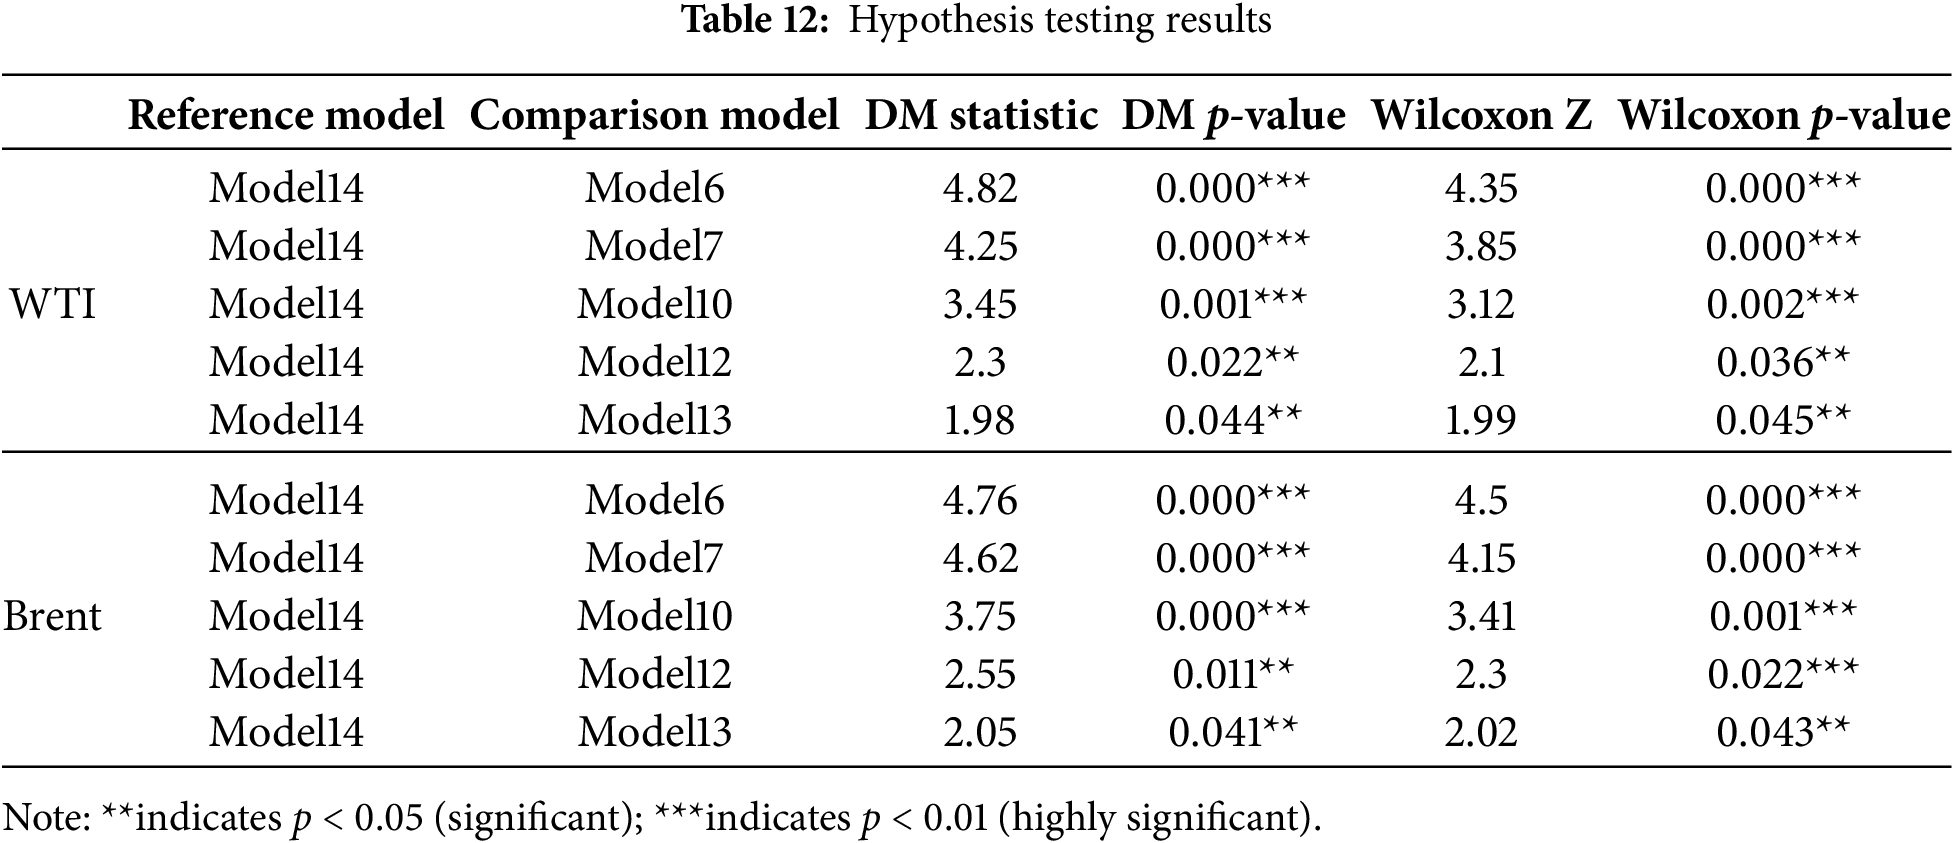
To evaluate the contribution of each model component to forecasting performance, this study applies the Diebold–Mariano (DM) test and the Wilcoxon signed-rank test to compare the root mean squared error of the models. The DM test measures the statistical significance of accuracy differences in time series forecasting, while the Wilcoxon test, as a nonparametric approach, avoids distributional dependence by comparing paired medians. Using both tests enhances the robustness of the conclusions. Detailed results are shown in Table 12. The results indicate that all model improvements are statistically significant, with p-values below 0.05. Model 7 performs significantly better than the baseline Transformer (Model 6) for both WTI and Brent, confirming the effectiveness of Random Forest–based feature selection. Model 10 shows clear gains over Model 6, suggesting that CEEMDAN decomposition reduces the impact of non-stationarity. Model 12 further improves accuracy compared with Model 10 by introducing fuzzy entropy and sample entropy for component classification. Model 13 achieves superior performance over Model 12 through GWO optimization, while the proposed Model 14 with HOA optimization yields the best results across both datasets. Overall, both the DM and Wilcoxon tests consistently confirm the stepwise improvements, demonstrating that Model 14 provides strong statistical reliability and generalization ability in capturing the complex dynamics of crude oil futures prices.
4.5 Feature Importance Analysis
To gain deeper insights into the mechanisms through which different variables contribute to crude oil futures price forecasting, this study employs a gradient-based feature importance analysis. Compared with traditional approaches such as permutation or regression-based importance, the gradient-based method enables a more precise quantification of dynamic effects in complex models such as deep neural networks. It effectively captures nonlinear feature interactions and context-dependent influences, thereby providing a more realistic representation of how each variable shapes the prediction process. To ensure robustness, an ensemble strategy is applied: feature importance is first computed within each decomposed component model and subsequently aggregated and averaged to generate an overall ranking. Following this procedure, the five most influential features are identified for both WTI and Brent models, with the results summarized in Table 13 and discussed below.
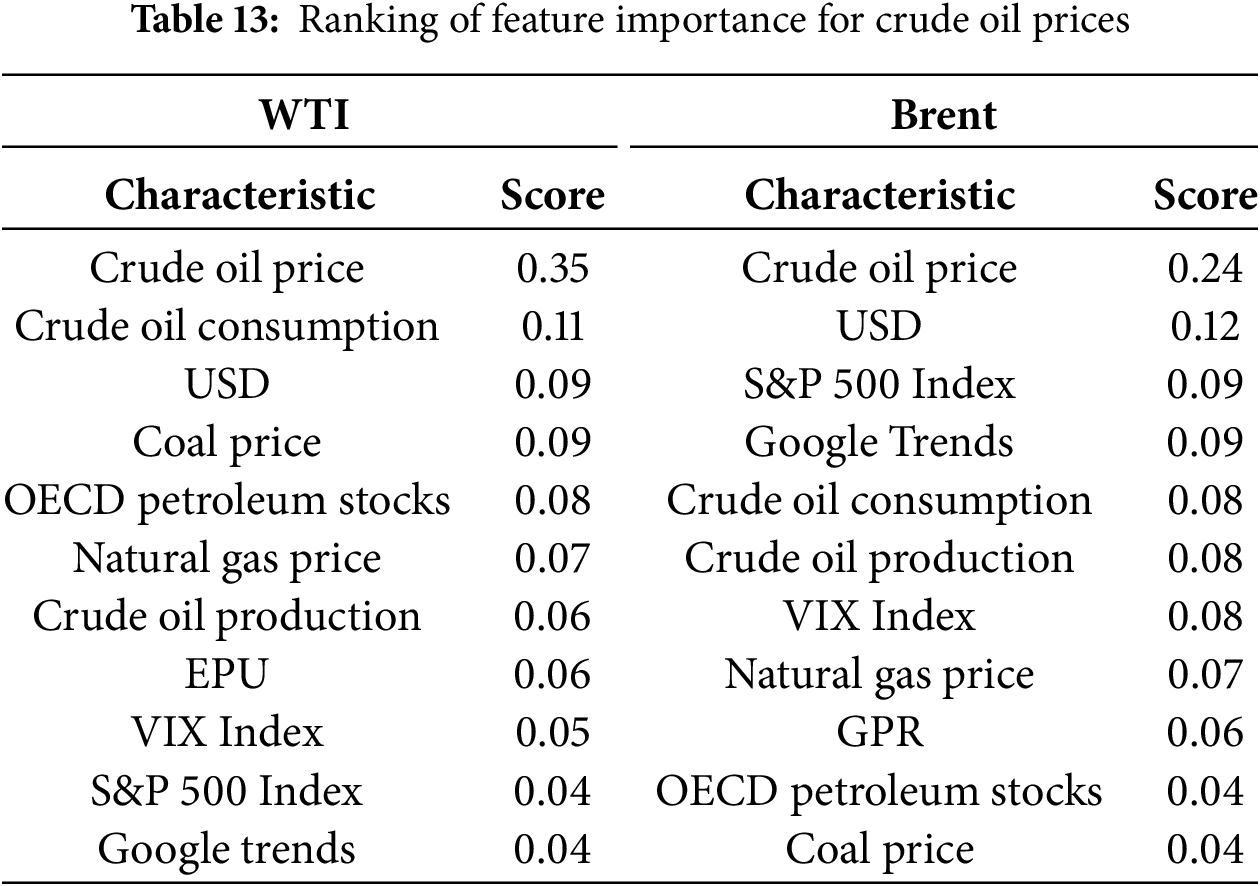
Historical crude oil futures prices emerge as the dominant feature in both the WTI and Brent models, with importance scores significantly surpassing those of other variables. This underscores their strong explanatory power, as historical price information encapsulates the intrinsic time dependence and persistence of crude oil markets. As a commodity with both physical and financial attributes, crude oil futures exhibit pronounced path dependence: current and future prices are heavily conditioned by past trajectories. This finding confirms that historical price series form the fundamental basis for capturing both short-term fluctuations and long-term trend dynamics, making them indispensable to forecasting frameworks.
With respect to supply–demand fundamentals, crude oil consumption ranks second in the WTI model and fifth in the Brent model, highlighting its substantial influence on price volatility. Consumption levels serve as a direct proxy for global energy demand and industrial activity, with higher consumption generally driving prices upward and lower consumption dampening market momentum. Similarly, OECD petroleum stocks appear among the top features in the WTI model (fifth place), reflecting the stabilizing role of inventories. Elevated inventory levels often signal oversupply or weak demand, exerting downward pressure on prices, whereas lower inventories can tighten supply conditions and push prices higher.
Among macroeconomic indicators, the U.S. Dollar Index ranks third in the WTI model and second in the Brent model, underscoring its critical role in global oil pricing. Because crude oil is denominated in U.S. dollars, fluctuations in the currency’s value directly affect international purchasing power. A stronger dollar typically suppresses oil prices by raising costs for non-dollar importers, whereas a weaker dollar has the opposite effect. In addition, the S&P 500 Index ranks third in the Brent model, suggesting that volatility in international equity markets spills over into Brent crude oil futures. This co-movement illustrates the broader financialization of energy commodities and highlights the extent to which investor sentiment and stock market dynamics shape oil price expectations.
Market dynamics and sentiment-driven variables also play a notable role. Google Trends ranks fourth in the Brent model, capturing the predictive power of public attention as a forward-looking indicator. Online search activity reflects shifts in market sentiment and potential opinion shocks, enabling the model to anticipate turning points in price movements that are not immediately apparent from traditional economic indicators. This finding emphasizes the value of incorporating non-traditional, sentiment-oriented data sources into forecasting frameworks.
Alternative energy factors also emerge as relevant predictors. Coal prices rank fourth in the WTI model, reflecting substitution effects and cross-market linkages among traditional energy sources. As coal remains a major alternative fuel, its price fluctuations can indirectly influence oil demand and, consequently, crude oil futures prices. This finding reinforces the importance of accounting for interdependencies across energy markets when constructing predictive models.
In summary, the feature importance analysis reveals that crude oil futures forecasting is shaped by a multidimensional set of drivers, including historical trajectories, macroeconomic conditions, financial market sentiment, supply–demand fundamentals, and cross-energy dynamics. The alignment of statistical significance with established economic mechanisms enhances both the interpretability and credibility of the proposed model, underscoring its practical value for understanding and anticipating crude oil market behavior.
5.1 Performance Analysis of Benchmark and Hybrid Models
This study compares the performance of different models in forecasting crude oil futures prices, emphasizing the advantages of benchmark and hybrid approaches. Results show that GRU consistently outperforms Bi-LSTM, particularly in capturing rapid local fluctuations. Although Bi-LSTM has bidirectional contextual modeling ability, its complex architecture weakens generalization, making it less robust under atypical conditions. By contrast, the Transformer surpasses other models in most metrics, reflecting its strength in modeling long-term dependencies. Given that crude oil futures are influenced by supply–demand dynamics, geopolitical shocks, and market sentiment, the Transformer proves effective in handling such complex volatility. Incorporating RF-based feature selection further reduces redundancy, improves input quality, and enhances predictive accuracy.
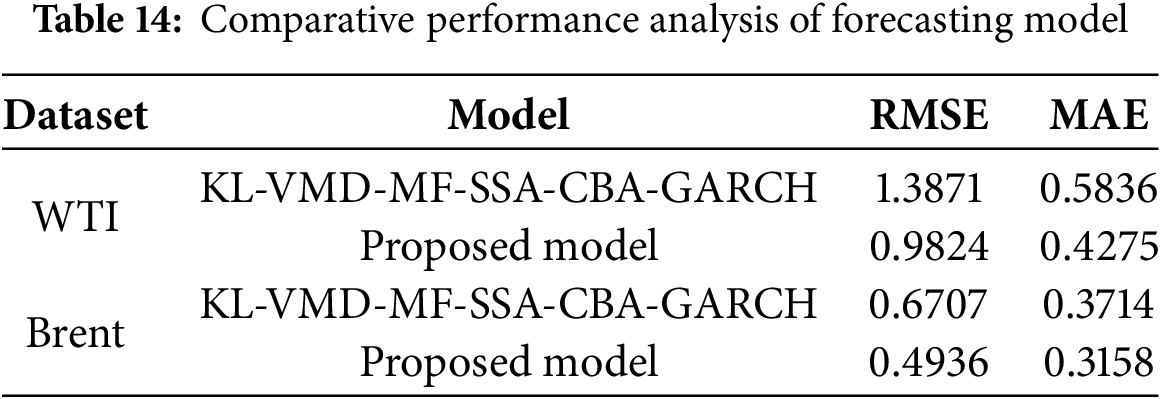
To address the challenges of nonstationary time series, this study proposes a CEEMDAN–HOA–Transformer–GRU hybrid model. CEEMDAN decomposes crude oil prices into stationary components, alleviating non-stationarity and improving data quality for learning. Within the framework, the Transformer captures long-term patterns, while GRU adapts quickly to short-term changes, achieving complementary fusion of global and local information. HOA optimization enables adaptive parameter tuning, reducing overfitting and improving stability. Comparative analyses in Table 9 reveal that as the model architecture becomes more sophisticated and its integration depth increases, forecasting performance improves significantly, confirming the adaptability and superiority of the deeply integrated framework in modeling the complex volatility patterns of crude oil futures prices. To further validate this enhancement, the proposed model was compared with the recent KL-VMD-MF-SSA-CBA-GARCH framework developed by Lu and Huang (2024) [31]. As shown in Table 14, while Lu’s model achieves competitive performance through advanced decomposition and hybridization strategies, the proposed CEEMDAN–HOA–Transformer–GRU consistently achieves lower RMSE and MAE values for both WTI and Brent. This indicates that our approach not only inherits the strengths of decomposition-based modeling but also gains additional robustness and efficiency from adaptive parameter optimization and the complementary roles of Transformer and GRU. The improvement over a recent state-of-the-art hybrid benchmark further confirms the methodological soundness and practical relevance of the proposed framework.
5.2 Suitability of the Hybrid Model for Crude Oil Futures Price Forecasting
Crude oil futures prices are among the most difficult financial and energy variables to forecast because of their high volatility, nonlinear dynamics, and sensitivity to external shocks. Unlike many conventional commodities, they are influenced simultaneously by long-term structural factors such as supply–demand fundamentals, OPEC production policies, and macroeconomic trends, as well as short-term disturbances including geopolitical risks, exchange rate fluctuations, and speculative trading. These interacting forces create highly non-stationary price series with multi-scale fluctuations and abrupt regime shifts, making traditional econometric models inadequate for capturing the full complexity of crude oil markets.
The proposed CEEMDAN–HOA–Transformer–GRU framework is designed to overcome these challenges. CEEMDAN decomposition separates the original futures series into intrinsic mode functions that represent different frequency components. This reduces non-stationarity and enables the model to capture both long-term trends and high-frequency volatility. Entropy-based complexity analysis ensures that each component is matched to an appropriate predictor: irregular components are modeled by the Transformer, which learns long-range dependencies and complex nonlinearities, while smoother components are handled by the GRU, which efficiently captures short-term dynamics with fewer parameters and less risk of overfitting. This adaptive allocation mechanism enhances predictive accuracy and robustness. The HOA further strengthens the framework by automatically optimizing the hyperparameters of the Transformer and GRU. Since oil markets are prone to abrupt regime shifts (for instance, during the 2022 Russia–Ukraine conflict, when fixed parameter settings became ineffective), HOA’s global search capability ensures strong generalization in volatile conditions. Integrating these components within a unified ensemble enables the model to capture both structural patterns and sudden shocks, producing forecasts that are accurate and stable across diverse market environments.
From a practical perspective, the model’s suitability extends beyond technical performance. By incorporating supply–demand fundamentals, macroeconomic indicators, and sentiment-related variables, it generates forecasts that reflect the real drivers of oil prices. This improves interpretability and policy relevance, offering reliable support for risk management, investment strategies, and policy decisions. Consequently, the proposed hybrid model represents not only a methodological advance but also a valuable decision-support tool for stakeholders navigating uncertain energy markets.
5.3 Limitations and Future Research Directions
Although the proposed method demonstrates significant structural innovation and its performance advantages have been validated through experimental results, several limitations remain to be addressed in future research. First, the integration of CEEMDAN decomposition, HOA optimization, and multi-model parallel learning substantially increases model complexity and training time, thereby requiring considerable computational resources and advanced hardware support. This limitation may restrict the model’s applicability in real-time forecasting and high-frequency trading scenarios. Future research could explore approximate algorithms, model pruning, distributed computing, or lightweight architectures to reduce computational burden and enhance efficiency. Second, the model’s predictive accuracy is highly dependent on the quality of CEEMDAN decomposition; suboptimal decomposition may weaken the effectiveness of subsequent learners and lead to unstable predictions. Therefore, further studies could investigate more robust or adaptive decomposition techniques, or consider jointly optimizing the decomposition and prediction stages to improve stability and generalization. Third, although an indicator system incorporating external variables has been established, the current integration mechanism remains insufficiently developed and cannot fully capture the complex interactions between market, macroeconomic, and sentiment factors. Future research should focus on effectively incorporating multi-source heterogeneous data, for instance, by employing attention mechanisms to dynamically adjust the weights of external variables, or by developing multimodal learning frameworks that allow richer feature interactions and improved interpretability.
Using WTI and Brent crude oil futures as case studies, this research develops a multi-source integrated forecasting model and identifies key variables driving price fluctuations through gradient-based feature importance analysis. To strengthen forward-looking governance, improve regulatory effectiveness, and enhance market resilience, the following policy recommendations are proposed:
(1) Institutionalize the use of historical price data in decision-making. Historical crude oil prices exert the greatest influence in forecasting models, underscoring their persistence and temporal dependence. Government agencies should establish data-driven early-warning systems that integrate time series modeling with machine learning to anticipate cyclical fluctuations and adjust policy tools such as strategic reserves and taxation. Energy firms can incorporate historical trend analysis into production scheduling and hedging strategies to stabilize revenues, while traders are advised to embed historical signals into algorithmic trading systems to reduce exposure to abrupt shocks.
(2) Strengthen macroeconomic surveillance and enhance cross-national coordination. The strong predictive power of the U.S. Dollar Index and global stock indices highlights crude oil’s sensitivity to macroeconomic and financial conditions. Policymakers should integrate domestic and international indicators into comprehensive monitoring frameworks and pursue coordinated policy responses through platforms such as the G20 and IEA to mitigate spillover risks. At the same time, energy companies and large trading institutions should track global financial conditions in their investment and risk-management strategies to better align with shifting capital flows and monetary policies.
(3) Improve transparency and timeliness of supply–demand information. Crude oil consumption and OECD petroleum stocks demonstrate significant predictive power and directly shape market expectations. Governments should mandate standardized and high-frequency disclosure of production, inventory, and consumption data through centralized, open-access platforms. Producers can complement this by disclosing real-time operational data to reduce asymmetry, while market participants—including institutional and individual traders—can leverage such transparency to refine demand forecasts and lower reliance on speculative trading.
(4) Develop cross-energy market monitoring and regulatory mechanisms. The significance of coal prices in the WTI model reflects substitution effects and cross-market linkages among major energy commodities. Governments should implement integrated oversight frameworks that monitor oil–coal–gas interactions and design coordinated policy responses to systemic risks. Energy firms, in turn, can diversify their production portfolios and adjust outputs dynamically based on cross-price signals, while traders can hedge portfolios across multiple commodities to manage substitution-driven volatility.
(5) Incorporate sentiment indicators into monitoring and trading strategies. The importance of Google Search Trends in the Brent model illustrates the predictive value of public attention and market sentiment. Regulators should establish platforms that systematically track online search trends, news sentiment, and social media data to strengthen early-warning capabilities for sudden events and irrational market behavior. Energy companies can integrate sentiment analysis into market research and customer demand forecasting, while traders can use such indicators to improve short-term forecasting accuracy and adapt trading strategies in response to emerging market signals.
In conclusion, crude oil price volatility is jointly shaped by historical persistence, macroeconomic dynamics, supply–demand fundamentals, cross-energy market linkages, and market sentiment. Addressing this complexity requires coordinated actions by governments, firms, and market participants. By improving information transparency, enhancing forward-looking monitoring, and fostering multi-actor collaboration, an intelligent and integrated energy price management framework can be constructed to safeguard market stability and ensure energy security.
Accurate forecasting of crude oil futures prices is critical for ensuring energy security, supporting investment decision-making, and maintaining market stability. To address the inherent complexity and nonlinearity of crude oil futures price series, this study proposes a multi-stage ensemble forecasting framework that integrates CEEMDAN decomposition, complexity measurement, a Transformer–GRU hybrid model, and the HOA optimization algorithm. A systematic empirical analysis is conducted using datasets from WTI and Brent, the two primary international crude oil futures benchmarks. The main findings are as follows:
(1) Sequence decomposition and feature extraction. The CEEMDAN method effectively decomposes complex crude oil futures price series into IMFs, thereby capturing multi-scale temporal patterns. Compared with direct modeling of the raw series, the CEEMDAN-based decomposition strategy significantly improves predictive accuracy and model stability, confirming its suitability and value for complex energy time series modeling.
(2) Hybrid model construction and selection. By quantifying the complexity of IMF components using fuzzy entropy and sample entropy, and dynamically assigning either the Transformer or GRU for prediction, the proposed approach leverages the complementary strengths of both models. Empirical results show that this complexity-driven hybrid strategy outperforms single models and indiscriminate ensembles in terms of accuracy and generalization, demonstrating superior adaptability and representational capacity.
(3) Model parameter optimization. The HOA algorithm demonstrates robust global search and local exploitation capabilities, substantially enhancing the performance of the hybrid framework. Compared with conventional optimization methods, HOA achieves significantly higher predictive accuracy across different datasets, highlighting the importance of intelligent optimization in the development of advanced deep learning models.
(4) Policy implications and practical value. Based on feature importance analysis, this study proposes policy recommendations across three levels: governments should strengthen macroeconomic monitoring, supply–demand disclosure, and early-warning mechanisms; enterprises are advised to adopt data-driven strategies for hedging, inventory, and energy transition; and individual traders should leverage predictive models for portfolio optimization and volatility management. These multi-level implications enhance the model’s relevance for regulation, industry practice, and investment decisions.
In conclusion, the proposed CEEMDAN–HOA–Transformer–GRU ensemble forecasting framework offers distinct advantages in methodological design and predictive performance, confirming its effectiveness for modeling complex energy time series. Furthermore, the multi-level policy recommendations derived from feature importance analysis broaden the practical applicability of the framework to governmental energy management, corporate strategy, and individual trading decisions. The findings provide both theoretical foundations and methodological guidance for forecasting practices and policy development in the energy sector.
Acknowledgement: Not applicable.
Funding Statement: This research was funded by the Henan Provincial Natural Science Foundation (grant no. 242300421257).
Author Contributions: The authors confirm contributions to the study as follows: Yibin Guo: writing—review and editing; Lingxiao Ye: methodology and writing—original draft; Xiang Wang: conceptualization; Di Wu: validation; Zirong Wang: data curation; Hao Wang: software. All authors contributed to the discussion of results, reviewed the manuscript, and approved the final version for submission. All authors reviewed the results and approved the final version of the manuscript.
Availability of Data and Materials: The data supporting the findings of this study are available from the corresponding author, Lingxiao Ye, upon reasonable request. In addition, the dataset has been made publicly accessible on GitHub at https://github.com/ye200105-del/crude-oil-futures-price-Dataset.git (accessed on 15 October 2025).
Ethics Approval: Not applicable.
Conflicts of Interest: The authors declare no conflicts of interest to report regarding the present study.
References
1. Wu XF, Chen GQ. Global overview of crude oil use: from source to sink through inter-regional trade. Energy Policy. 2019;128:476–86. doi:10.1016/j.enpol.2019.01.022. [Google Scholar] [CrossRef]
2. Al-Sasi BO, Taylan O, Demirbas A. The impact of oil price volatility on economic growth. Energy Sources Part B Econ Plan Policy. 2017;12(10):847–52. doi:10.1080/15567249.2017.1312641. [Google Scholar] [CrossRef]
3. Abdelsalam MAM. Oil price fluctuations and economic growth: the case of MENA countries. Rev Econ Polit Sci. 2023;8(5):353–79. doi:10.1108/reps-12-2019-0162. [Google Scholar] [CrossRef]
4. Bagadeem S. Oil volatility and economic growth: evidences from top oil trading countries. Int J Energy Econ Policy. 2023;13(6):381–7. doi:10.32479/ijeep.14841. [Google Scholar] [CrossRef]
5. Moreno P, Figuerola-Ferretti I, Muñoz A. Forecasting oil prices with non-linear dynamic regression modeling. Energies. 2024;17(9):2182. doi:10.3390/en17092182. [Google Scholar] [CrossRef]
6. Chen Y, Zhang C, He K, Zheng A. Multi-step-ahead crude oil price forecasting using a hybrid grey wave model. Phys A Stat Mech Appl. 2018;501:98–110. doi:10.1016/j.physa.2018.02.061. [Google Scholar] [CrossRef]
7. Xiang Y, Zhuang XH. Application of ARIMA model in short-term prediction of international crude oil price. Adv Mater Res. 2013;798–799:979–82. doi:10.4028/www.scientific.net/amr.798-799.979. [Google Scholar] [CrossRef]
8. Murat A, Tokat E. Forecasting oil price movements with crack spread futures. Energy Econ. 2009;31(1):85–90. doi:10.1016/j.eneco.2008.07.008. [Google Scholar] [CrossRef]
9. Ma YR, Ji Q, Pan J. Oil financialization and volatility forecast: evidence from multidimensional predictors. J Forecast. 2019;38(6):564–81. doi:10.1002/for.2577. [Google Scholar] [CrossRef]
10. Gupta R, Wohar M. Forecasting oil and stock returns with a Qual VAR using over 150 years off data. Energy Econ. 2017;62:181–6. doi:10.1016/j.eneco.2017.01.001. [Google Scholar] [CrossRef]
11. Nademi A, Nademi Y. Forecasting crude oil prices by a semiparametric Markov switching model: OPEC, WTI, and Brent cases. Energy Econ. 2018;74:757–66. doi:10.1016/j.eneco.2018.06.020. [Google Scholar] [CrossRef]
12. Xiao D, Peng Z, Lin Z, Zhong X, Wei C, Dong Z, et al. Incorporating financial entities into spot electricity market with renewable energy via holistic risk-aware bilevel optimization. Appl Energy. 2025;398:126449. doi:10.1016/j.apenergy.2025.126449. [Google Scholar] [CrossRef]
13. Mirmirani S, Li HC. A comparison of var and neural networks with genetic algorithm in forecasting price of oil. In: Applications of artificial intelligence in finance and economics. Leeds, UK: Emerald Publishing Limited; 2004. p. 203–23. doi:10.1016/s0731-9053(04)19008-7. [Google Scholar] [CrossRef]
14. Weng F, Zhang H, Yang C. Volatility forecasting of crude oil futures based on a genetic algorithm regularization online extreme learning machine with a forgetting factor: the role of news during the COVID-19 pandemic. Resour Policy. 2021;73:102148. doi:10.1016/j.resourpol.2021.102148. [Google Scholar] [PubMed] [CrossRef]
15. Hu Z. Crude oil price prediction using CEEMDAN and LSTM-attention with news sentiment index. Oil Gas Sci Technol—Rev IFP Energies Nouvelles. 2021;76:28. doi:10.2516/ogst/2021010. [Google Scholar] [CrossRef]
16. Tissaoui K, Zaghdoudi T, Hakimi A, Nsaibi M. Do gas price and uncertainty indices forecast crude oil prices? Fresh evidence through XGBoost modeling. Comput Econ. 2022;62(2):663–87. doi:10.1007/s10614-022-10305-y. [Google Scholar] [PubMed] [CrossRef]
17. Wang J, Zhou H, Hong T, Li X, Wang S. A multi-granularity heterogeneous combination approach to crude oil price forecasting. Energy Econ. 2020;91:104790. doi:10.1016/j.eneco.2020.104790. [Google Scholar] [CrossRef]
18. Ramyar S, Kianfar F. Forecasting crude oil prices: a comparison between artificial neural networks and vector autoregressive models. Comput Econ. 2019;53(2):743–61. doi:10.1007/s10614-017-9764-7. [Google Scholar] [CrossRef]
19. Gao S, Lei Y. A new approach for crude oil price prediction based on stream learning. Geosci Front. 2017;8(1):183–7. doi:10.1016/j.gsf.2016.08.002. [Google Scholar] [CrossRef]
20. Yu L, Zhao Y, Tang L. A compressed sensing based AI learning paradigm for crude oil price forecasting. Energy Econ. 2014;46:236–45. doi:10.1016/j.eneco.2014.09.019. [Google Scholar] [CrossRef]
21. Liu J, Huang X. Forecasting crude oil price using event extraction. IEEE Access. 2021;9:149067–76. doi:10.1109/access.2021.3124802. [Google Scholar] [CrossRef]
22. Qin Q, Huang Z, Zhou Z, Chen C, Liu R. Crude oil price forecasting with machine learning and Google search data: an accuracy comparison of single-model versus multiple-model. Eng Appl Artif Intell. 2023;123:106266. doi:10.1016/j.engappai.2023.106266. [Google Scholar] [CrossRef]
23. Hasan M, Abedin MZ, Hajek P, Coussement K, Sultan MN, Lucey B. A blending ensemble learning model for crude oil price forecasting. Ann Oper Res. 2025;353(2):485–515. doi:10.1007/s10479-023-05810-8. [Google Scholar] [CrossRef]
24. Zhang K, Wang Y, Hu Z, Zhou L. BRT oil price combination forecasting based on the dispersion degree of triangular fuzzy numbers. J Intell Fuzzy Syst. 2024;46(1):1143–66. doi:10.3233/jifs-230741. [Google Scholar] [CrossRef]
25. Zhao Z, Sun S, Sun J, Wang S. A novel hybrid model with two-layer multivariate decomposition for crude oil price forecasting. Energy. 2024;288:129740. doi:10.1016/j.energy.2023.129740. [Google Scholar] [CrossRef]
26. Shen L, Bao Y, Hasan N, Huang Y, Zhou X, Deng C. Intelligent crude oil price probability forecasting: deep learning models and industry applications. Comput Ind. 2024;163:104150. doi:10.1016/j.compind.2024.104150. [Google Scholar] [CrossRef]
27. Fang Y, Wang W, Wu P, Zhao Y. A sentiment-enhanced hybrid model for crude oil price forecasting. Expert Syst Appl. 2023;215:119329. doi:10.1016/j.eswa.2022.119329. [Google Scholar] [CrossRef]
28. Wang X, Yang P, Zhou X, Wang Z. Crude oil price forecasting: an ensemble-driven long short-term memory model based on CEEMDAN decomposition and ALS-PSO optimization. Energy Sci Eng. 2023;11(11):4054–76. doi:10.1002/ese3.1561. [Google Scholar] [CrossRef]
29. Zhang S, Luo J, Wang S, Liu F. Oil price forecasting: a hybrid GRU neural network based on decomposition-reconstruction methods. Expert Syst Appl. 2023;218:119617. doi:10.1016/j.eswa.2023.119617. [Google Scholar] [CrossRef]
30. Lin H, Sun Q. Crude oil prices forecasting: an approach of using CEEMDAN-based multi-layer gated recurrent unit networks. Energies. 2020;13(7):1543. doi:10.3390/en13071543. [Google Scholar] [CrossRef]
31. Lu W, Huang Z. Crude oil prices forecast based on mixed-frequency deep learning approach and intelligent optimization algorithm. Entropy. 2024;26(5):358. doi:10.3390/e26050358. [Google Scholar] [PubMed] [CrossRef]
32. Alruqimi M, Di Persio L. Enhancing multi-step Brent oil price forecasting with ensemble multi-scenario Bi-GRU networks. Int J Comput Intell Syst. 2024;17(1):225. doi:10.1007/s44196-024-00640-3. [Google Scholar] [CrossRef]
33. Breiman L. Random forests. Mach Learn. 2001;45(1):5–32. doi:10.1023/A:1010933404324. [Google Scholar] [CrossRef]
34. Torres ME, Colominas MA, Schlotthauer G, Flandrin P. A complete ensemble empirical mode decomposition with adaptive noise. In: Proceedings of the 2011 IEEE International Conference on Acoustics, Speech and Signal Processing (ICASSP); 2011 May 22–27; Prague, Czech Republic. doi:10.1109/icassp.2011.5947265. [Google Scholar] [CrossRef]
35. Cho K, van Merrienboer B, Gulcehre C, Bahdanau D, Bougares F, Schwenk H, et al. Learning phrase representations using RNN encoder-decoder for statistical machine translation. In: Proceedings of the 2014 Conference on Empirical Methods in Natural Language Processing (EMNLP); 2014 Oct 26–28; Doha, Qatar. doi:10.3115/v1/d14-1179. [Google Scholar] [CrossRef]
36. Vaswani A, Shazeer N, Parmar N, Uszkoreit J, Jones L, Gomez AN, et al. Attention is all you need. In: 31st Conference on Neural Information Processing Systems (NIPS 2017); 2017 Dec 4–9; Long Beach, CA, USA. [Google Scholar]
37. Oladejo SO, Ekwe SO, Mirjalili S. The Hiking optimization algorithm: a novel human-based metaheuristic approach. Knowl Based Syst. 2024;296:111880. doi:10.1016/j.knosys.2024.111880. [Google Scholar] [CrossRef]
38. Perifanis T, Dagoumas A. Crude oil price determinants and multi-sectoral effects: a review. Energy Sources Part B Econ Plan Policy. 2021;16(9):787–860. doi:10.1080/15567249.2021.1922956. [Google Scholar] [CrossRef]
39. Baker SR, Bloom N, Davis SJ. Measuring economic policy uncertainty. Q J Econ. 2016;131(4):1593–636. doi:10.1093/qje/qjw024. [Google Scholar] [CrossRef]
40. Feng Y, Xu D, Failler P, Li T. Research on the time-varying impact of economic policy uncertainty on crude oil price fluctuation. Sustainability. 2020;12(16):6523. doi:10.3390/su12166523. [Google Scholar] [CrossRef]
41. Devi P, Kumar S, Kumar P, Kumar S, Khan I, Kumar P. Temporal multifractal analysis of extreme events in the crude oil market. J Korean Phys Soc. 2022;81(4):354–60. doi:10.1007/s40042-022-00534-7. [Google Scholar] [CrossRef]
42. Akram QF. Commodity prices, interest rates and the dollar. Energy Econ. 2009;31(6):838–51. doi:10.1016/j.eneco.2009.05.016. [Google Scholar] [CrossRef]
43. Jia Y, Dong Z, An H. Study of the modal evolution of the causal relationship between crude oil, gold, and dollar price series. Int J Energy Res. 2023;2023:7947434. doi:10.1155/2023/7947434. [Google Scholar] [CrossRef]
44. Bâra A, Georgescu IA, Oprea SV, Cristescu MP. Exploring the dynamics of Brent crude oil, S&P500 and Bitcoin prices amid economic instability. IEEE Access. 2024;12:31366–85. doi:10.1109/access.2024.3370029. [Google Scholar] [CrossRef]
45. Kim MS. Impacts of supply and demand factors on declining oil prices. Energy. 2018;155:1059–65. doi:10.1016/j.energy.2018.05.061. [Google Scholar] [CrossRef]
46. Miao H, Ramchander S, Wang T, Yang D. Influential factors in crude oil price forecasting. Energy Econ. 2017;68:77–88. doi:10.1016/j.eneco.2017.09.010. [Google Scholar] [CrossRef]
47. Khan MI. Falling oil prices: causes, consequences and policy implications. J Petrol Sci Eng. 2017;149:409–27. doi:10.1016/j.petrol.2016.10.048. [Google Scholar] [CrossRef]
48. Cavero S, Laguna M, Pardo EG. Solving a short sea inventory routing problem in the oil industry. Comput Ind Eng. 2024;189:109978. doi:10.1016/j.cie.2024.109978. [Google Scholar] [CrossRef]
49. Gong X, Chen L, Lin B. Analyzing dynamic impacts of different oil shocks on oil price. Energy. 2020;198:117306. doi:10.1016/j.energy.2020.117306. [Google Scholar] [CrossRef]
50. Ghosh S, Tiwari AK, Doğan B, Abakah EJA. The dynamic relationship between gas and crude oil markets and the causal impact of US shale gas. Comput Econ. 2024;63(6):2501–24. doi:10.1007/s10614-023-10415-1. [Google Scholar] [CrossRef]
51. Bildirici ME, Bakirtas T. The relationship among oil, natural gas and coal consumption and economic growth in BRICTS (Brazil, Russian, India, China, Turkey and South Africa) countries. Energy. 2014;65:134–44. doi:10.1016/j.energy.2013.12.006. [Google Scholar] [CrossRef]
52. Li X, Zhang X, Wang S, Ma J. Attention matters: an exploration of relationship between google search behaviors and crude oil prices. J Syst Sci Complex. 2019;32(5):1438–59. doi:10.1007/s11424-019-7257-6. [Google Scholar] [CrossRef]
53. Li J, Tang L, Wang S. Forecasting crude oil price with multilingual search engine data. Phys A Stat Mech Appl. 2020;551:124178. doi:10.1016/j.physa.2020.124178. [Google Scholar] [CrossRef]
54. Ding Z, Liu Z, Zhang Y, Long R. The contagion effect of international crude oil price fluctuations on Chinese stock market investor sentiment. Appl Energy. 2017;187:27–36. doi:10.1016/j.apenergy.2016.11.037. [Google Scholar] [CrossRef]
55. Sari R, Soytas U, Hacihasanoglu E. Do global risk perceptions influence world oil prices? Energy Econ. 2011;33(3):515–24. doi:10.1016/j.eneco.2010.12.006. [Google Scholar] [CrossRef]
56. Wang F, Li M, Wang R. A new forecasting approach for oil price using the recursive decomposition-reconstruction-ensemble method with complexity traits. Entropy. 2023;25(7):1051. doi:10.3390/e25071051. [Google Scholar] [PubMed] [CrossRef]
Cite This Article
 Copyright © 2026 The Author(s). Published by Tech Science Press.
This work is licensed under a Creative Commons Attribution 4.0 International License , which permits unrestricted use, distribution, and reproduction in any medium, provided the original work is properly cited.
 Downloads
 Citation Tools