
 Submit a Paper
 Propose a Special lssue
 Open Access
ARTICLE

Assessment of Carbon Reduction Potential Driven by High Energy Consumption Enterprises’ Electricity Usage Behavior
1 Dongguan Power Supply Bureau of Guangdong Power Grid Co., Ltd., Dongguan, 523129, China
2 Foshan Graduate School of Innovation, Northeastern University, Foshan, 528312, China
* Corresponding Author: Xiaoshun Zhang. Email:
(This article belongs to the Special Issue: Low-Carbon Situational Awareness and Dispatch Decision of New-Type Power System Operation)
Energy Engineering 2026, 123(5), 2 https://doi.org/10.32604/ee.2025.072462
Received 27 August 2025; Accepted 22 October 2025; Issue published 27 April 2026
 View Full Text
 Download PDF
Abstract
Addressing global climate challenges necessitates urgent low carbon transitions in high energy consuming enterprises (HECEs). This study proposes a comprehensive framework to assess their carbon reduction potential (CRP) by integrating electricity usage behavior analysis and dynamic carbon emission factor (DCEF) prediction. HECEs are classified into “electricity reduction” and “electricity transfer” categories based on load characteristics, enabling tailored optimization strategies. The framework employs machine learning to predict DCEFs, capturing real time variations in grid carbon intensity. A low carbon optimization model is then formulated to minimize emissions while adhering to production requirements and grid constraints, solved efficiently by a swarm intelligence algorithm (Chinese Pangolin Optimizer). Case studies demonstrate the framework’s effectiveness in quantifying emission reduction pathways and guiding differentiated strategies for HECEs. User A and User C, designated as “electricity transfer” types, achieved significant carbon reductions of 9.3% and 8.4% respectively through optimizing electricity usage timing. User B, categorized as “electricity reduction,” realized a notable 6.7% carbon reduction by cutting electricity consumption, exceeding its predefined target. This highlights substantial CRP achievable via DCEF guided behavioral optimization. The Chinese Pangolin Optimizer (CPO) algorithm exhibits superior convergence and computational efficiency compared to the Genetic Algorithm, ensuring robust and stable low carbon solutions. This systematic approach prioritizes behavioral and operational adjustments, fostering sustainable development aligned with global climate goals.Graphic Abstract
Keywords
While global climate change necessitates urgent decarbonization, existing strategies for High Energy Consuming Enterprises (HECEs) remain largely confined to technological upgrades and economic dispatch based on static, average carbon emission factors [1]. This paradigm neglects the substantial, yet untapped, carbon reduction potential that could be achieved by guiding HECEs’ electricity usage behavior in response to the grid’s dynamic carbon intensity [2]. Consequently, this research introduces a comprehensive assessment framework that centers on behavioral optimization driven by real-time carbon signals to bridge this critical gap [3].
In recent years, research on curbing emissions from HECEs has centered on technological upgrading, energy mix adjustment, and price driven economic dispatch [4–7]. Reference [8] quantified the abatement potential of state of the art energy saving technologies; Reference [9] evaluated the influence of shifts in the energy structure; and References [10,11] exploited time of use tariffs and other economic signals to minimize electricity costs. Collectively, these works have furnished a diversified toolkit for HECEs emission reduction [12].
However, the above studies suffer from clear limitations. They overwhelmingly target minimum economic cost and rely on static, year average emission factors, overlooking the power system’s real time generation mix and the resulting temporal volatility of carbon intensity [13–15]. This static lens cannot faithfully capture how adjustments in electricity use patterns translate into actual emissions, and it therefore offers little guidance for exploiting the grid’s inherently “cleaner” time windows [16,17]. Furthermore, the investigations stop short of probing HECEs’ own load profiles and their built in flexibility; differentiated, behavior aware low-carbon strategies remain largely absent [18].
As the grid’s dynamic carbon signature becomes better understood, academia has shifted toward dynamic emission accounting and toward load scheduling keyed to real time carbon signals, opening fresh research avenues. Yet a systematic, fine grained framework for quantifying the carbon reduction potential of HECEs is still missing.
Against this backdrop, the paper introduces a comprehensive assessment framework that quantifies the carbon-reduction potential of HECEs by integrating granular electricity consumption pattern analysis with high temporal resolution forecasts of dynamic grid carbon intensity. By excavating multi year, sub-hourly meter data and aligning them with real time marginal emission factors, the method translates every feasible kilowatt-hour of demand adjustment into its exact marginal CO2 saving. Central to the framework is a behavior centric taxonomy that first decomposes individual load profiles into shape, flexibility and volume metrics and then assigns each facility to one of two mutually exclusive optimization archetypes: “electricity reduction” type, whose main lever is aggregate energy curtailment, and “electricity transfer” type, whose lever is temporal reallocation of an unchanged energy budget toward cleaner generation intervals. This ex-ante classification yields site specific abatement supply curves, enabling policymakers and plant managers to design differentiated, data driven low-carbon strategies without altering the original energy throughput targets of the enterprise.
To ensure the feasibility and practicality of the optimization strategies, generic operational constraints are established for each behavioral type. For the “electricity transfer” type, the total optimized electricity consumption must remain equal to (or very close to) the original planned consumption, ensuring production output is maintained while allowing flexible load shifting across time periods. Conversely, for the “electricity reduction” type, an additional constraint is applied where the total optimized electricity consumption must be less than or equal to the original consumption multiplied by a permissible reduction coefficient, directly linking energy savings to emission cuts. The power consumption in each time period for both types is bounded by the maximum and minimum operating limits of the enterprise’s equipment. These constraints ensure that the optimization results are both theoretically sound and practically feasible, while also providing sufficient flexibility for load adjustment to achieve carbon reduction goals. The main innovations are as follows:
⮚ A differentiated evaluation framework based on electricity consumption behavior classification has been developed. By analyzing load characteristics, HECEs are categorized into the “carbon reduction type by cutting electricity consumption” and the “carbon reduction type by shifting electricity consumption”, which lays the groundwork for devising targeted low carbon optimization strategies.
⮚ An efficient optimization algorithm has been applied and verified. The Chinese Pangolin Optimizer (CPO) was used to solve the model, and case studies confirmed its effectiveness in handling such complex optimization problems. The CPO is a novel bio inspired metaheuristic algorithm, and its performance has been demonstrated to be effective and convergent in solving complex numerical optimization problems.
The rest of this paper is organized as follows: Section 2 covers electricity consumption analysis, classification, and DCEF forecasting. Section 3 explains the construction and solution of the carbon reduction potential assessment model. Section 4 presents case studies and result analysis. Section 5 summarizes the entire paper.
2 Feature Analysis and Modeling
2.1 Analysis of HECEs Electricity Usage Behavior
2.1.1 Data Acquisition and Preprocessing
To study the electricity consumption behavior of HECEs, it is essential to obtain their high time resolution electricity load data. The sources of such data typically include real time load data recorded by enterprise energy management systems (EMS) or supervisory control and data acquisition (SCADA) systems, user side electricity consumption data collected by smart meters, and billing data from electricity marketing systems. The acquired data generally require preprocessing. The main steps involve:
⮚ Data Cleaning: Handling missing values, abnormal values, and duplicate entries.
⮚ Data Alignment and Unification: Ensuring that data timestamps are aligned and the time resolution is unified.
⮚ Data Normalization: Normalizing load data as needed for analysis to eliminate the impact of different scales.
2.1.2 Electricity Consumption Behavior Feature Extraction
In studying the electricity consumption behavior of HECEs, it’s vital to extract multiple features from different dimensions to fully describe their electricity usage characteristics. This includes reflecting their load patterns, volatility, periodicity, and regulation capacity. Common features cover basic statistical features, time series features, and pattern related features.
Basic statistical features include daily/weekly/monthly/annual electricity consumption, max./min./avg. load, peak valley difference, load ratio, load standard deviation (STD) or variation coefficient, which measure load volatility. Time series features cover typical daily load curve shape, load ramp up/down rates, and features like autocorrelation and periodicity obtained via Fourier transform and autocorrelation function analysis. Pattern related features focus on differences between workday and non workday load patterns, seasonal load changes, and load patterns under special events.
2.1.3 Enterprise Classification Based on Electricity Consumption Behavior
When evaluating the carbon reduction potential of HECEs, classification by electricity consumption behavior is essential. Differences in production processes, management standards and market conditions create distinct load pattern signatures; accordingly, the paper groups HECEs into two classes that reflect their dominant consumption traits and the corresponding optimization pathways.
The first type is the Electricity Reduction Type. These companies run a flat, predictable load because their core processes demand a rock steady supply. Moving demand is either impossible or prohibitively expensive, and kilowatt hours track output almost one for one. Typical examples are aluminum electrolysis pots, continuously fed chemical units, and certain glass furnaces. Their decarbonization playbook is limited to efficiency upgrades, tighter production scheduling, and conservation technology; they cut total kWh to cut CO2 while still hitting output targets, but they have little room to play with timing. The upside is almost entirely in better efficiency and tighter overall control.
The second type is the Electricity Transfer Type. These shops can juggle production schedules—some units run only when needed, can be started or stopped at will, or sit behind a buffer of stored energy or material. Their load profile is highly elastic in time, so peaks and valleys can swing wide and weekday vs. weekend or day vs. night use can look like two different plants. Typical cases are electric-arc furnaces in steel mills, cement finish grinding mills, certain machining lines, interruptible data center workloads, or any site with chilled water or heat storage tanks. Their decarbonization lever is the hourly spread in grid carbon intensity: they slide adjustable kWh from high-carbon hours to low-carbon hours, trimming CO2 while leaving the monthly meter reading essentially flat. They are the first address for behavior based optimization and carry the largest demand response and carbon reduction upside.
The rationale for this differentiation lies in avoiding two critical pitfalls of a unified approach. Imposing load-shifting targets on inflexible Reduction-Type enterprises sets them up for failure, while neglecting to leverage the scheduling flexibility of Transfer-Type enterprises underutilizes their substantial carbon reduction potential. A tailored strategy is therefore essential to set achievable targets and maximize overall emission reductions.
In terms of classification methods, unsupervised clustering algorithms can be employed to analyze the extracted power consumption behavior features for automatic classification. Common clustering algorithms include K-Means, DBSCAN, hierarchical clustering, and deep learning based clustering. Through cluster analysis, combined with expert experience and an understanding of enterprises’ production processes, the category to which each enterprise belongs is ultimately determined.
2.2 Dynamic Carbon Emission Factor
The dynamics of carbon emission intensity in the power system mainly stem from the following aspects:
⮚ Time varying power generation structure leads to fluctuations in carbon emission intensity. Different types of power generation units exhibit significant differences in carbon emission intensity. As wind, solar, and other renewable energy sources generate power intermittently, and conventional power sources adjust their output to balance supply and demand, the output proportion of various power sources in the grid changes in real time, thereby causing fluctuations in the average or marginal carbon emission intensity of the grid.
⮚ Changes in grid operation modes also affect carbon emission characteristics. Factors such as transmission congestion, network losses, and cross regional power exchange influence the actual power supply sources and their carbon emission characteristics in specific regions or nodes.
⮚ Variations in fuel types and efficiency cause minor fluctuations in emission factors. Changes in the coal type, gas type, and operational efficiency of thermal power units all lead to fluctuations in emission factors.
2.2.2 Definition of Dynamic Carbon Emission Factor
The Electricity Carbon Factor (ECF) serves as a critical indicator for evaluating the environmental impact of electricity consumption behavior, quantifying the carbon emissions per unit of electricity consumed. In this study, the DCEF is employed to precisely reflect temporal variations in the carbon intensity of electricity consumption, thereby providing a scientific basis for users to optimize their energy utilization patterns.
Calculating the ECF requires an integrated look at the generation mix, load profile, and carbon signature of the grid. Regional systems draw on coal and gas fired plants, hydro, nuclear, and renewables such as wind and solar, each with sharply different carbon intensities. The share contributed by any one technology shifts hour to hour, and the swings are largest in grids that carry a high penetration of renewables.
Seasonal and within day swings in load shape the ECF the same way. When demand peaks, the system calls on extra peaking plants that emit more CO2 per megawatt-hour than the baseload fleet; when load troughs, wind and solar usually make up a larger share and the ECF falls. Transmission losses and any power imported or exported across regional ties feed directly into the final number as well.
Incorporating these considerations, this study develops a time-dimensional dynamic ECF calculation model. The model’s core formulation is expressed as:
where
3 Carbon Reduction Potential Assessment Model Construction
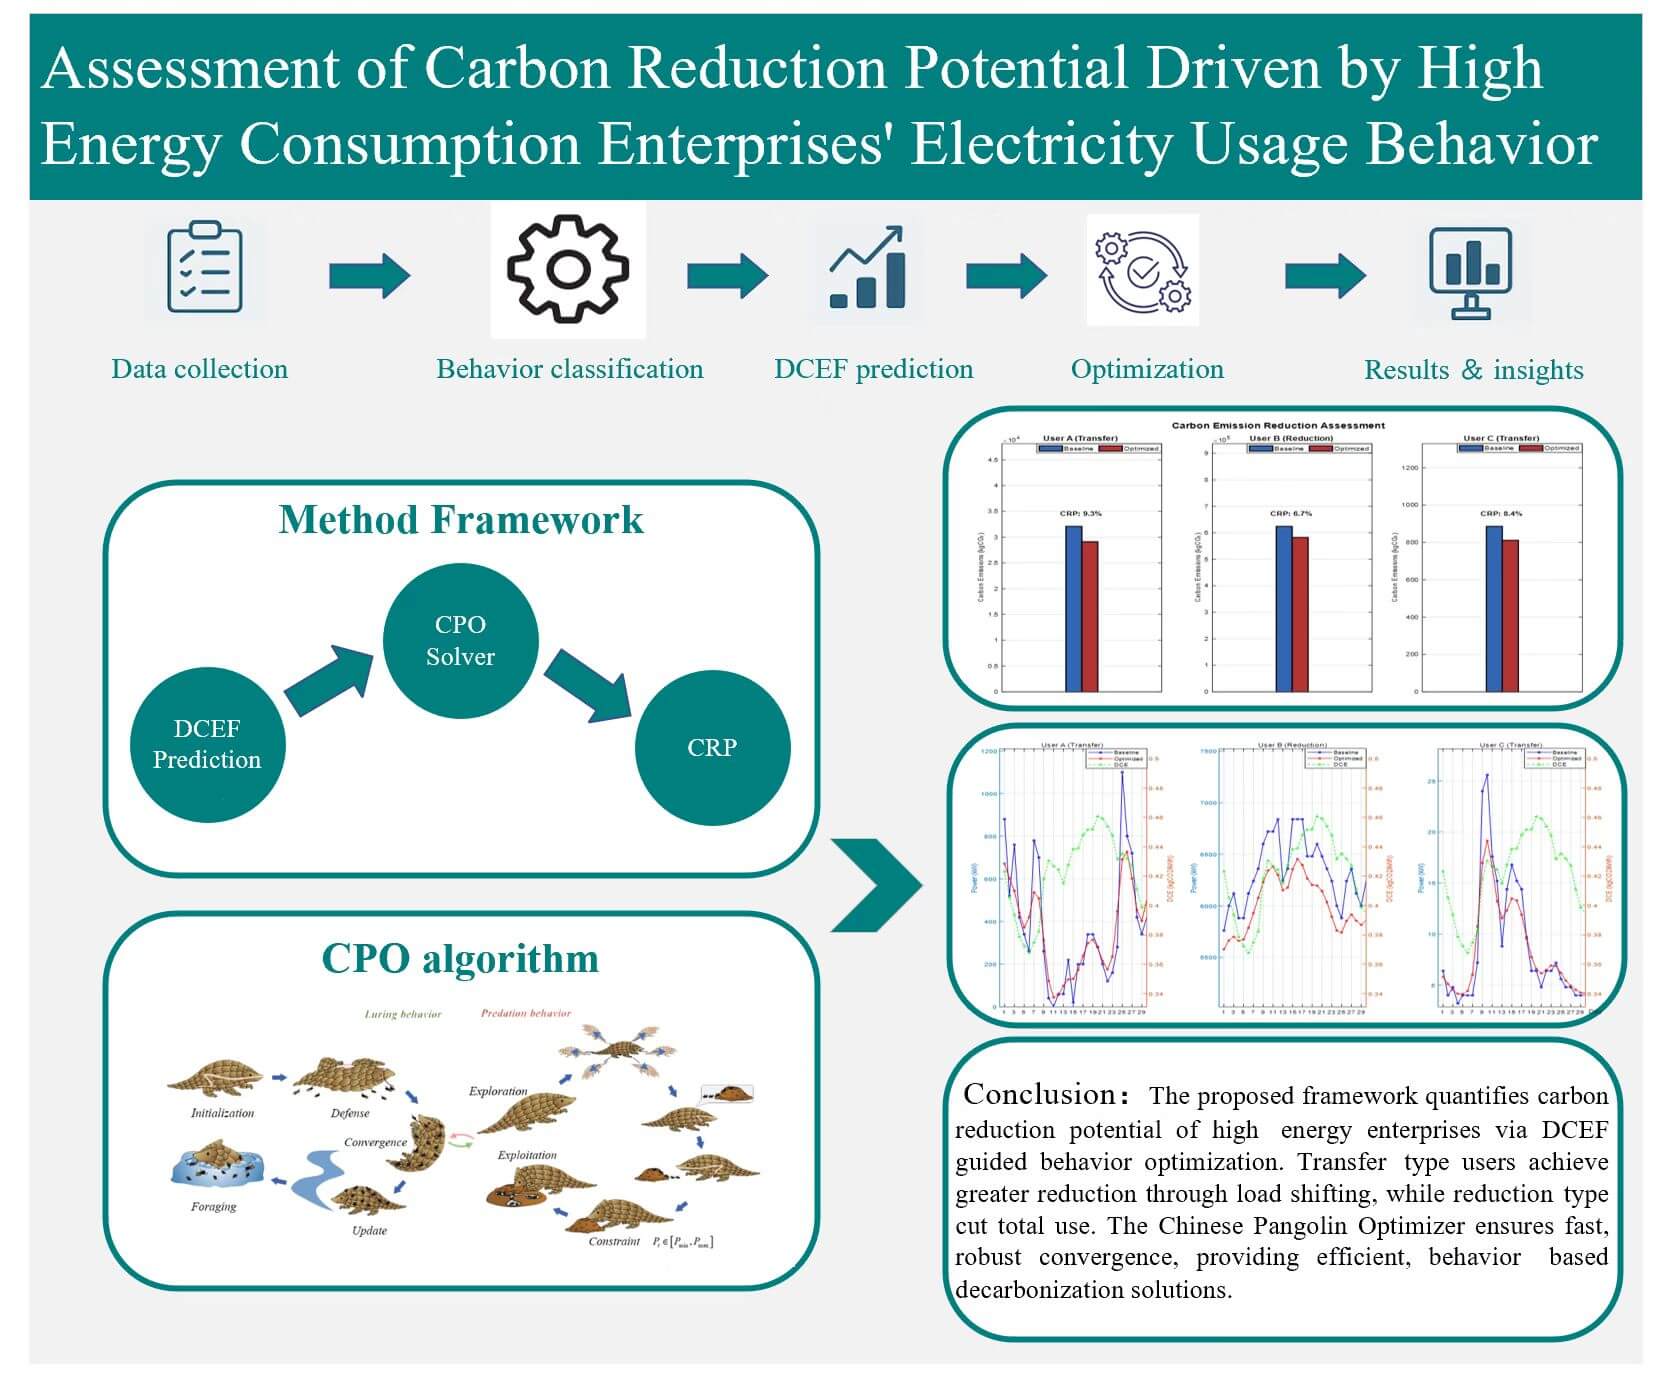
The systematic CRP assessment framework is visualized in Fig. 1. It coordinates user behavior classification, dynamic carbon awareness, and swarm intelligence optimization to quantify emission reduction potential.

Figure 1: Framework for assessing carbon reduction potential
The core objective of low carbon electricity consumption optimization is to minimize the total carbon emissions within the evaluation period
where
The objective function aims to identify an optimal power consumption schedule sequence
The optimization variable
where
For electricity transfer type enterprises, the total optimized electricity consumption should be equal to (or very close to) the original planned total electricity consumption
where
For electricity reduction type enterprises, the total optimized electricity consumption should be less than or equal to the original planned total electricity consumption multiplied by a permissible reduction coefficient (e.g., based on the objective of
where
Certain processes may require that a specific amount of electricity consumption be completed within a defined time period.
The rate of power change between adjacent periods must not exceed the equipment’s maximum allowed value.
where
Combining the objective function (1) with the relevant constraints (2)–(6) forms a comprehensive low carbon electricity optimization model, which is typically a nonlinear programming (NLP) or mixed integer nonlinear programming (MINLP) problem.
3.2 Optimization Algorithm Design
An appropriate optimization algorithm is required to solve the above optimization model. Given the model’s nonlinearity, potential multiple local optima, and complex constraints, population based metaheuristic algorithms are a common and effective choice. Numerous such algorithms have been proposed and applied in energy optimization, including Particle Swarm Optimization (PSO), Genetic Algorithm (GA) [20], Differential Evolution (DE), and the recently developed CPO.
The selection of algorithms for this study was driven by the intent to compare a novel, promising algorithm against a well established benchmark. The GA was chosen as a baseline for comparison because it is one of the most mature and widely used metaheuristic algorithms globally. Its performance in solving complex optimization problems, including those in the energy domain, is well-documented, making it an excellent reference point for evaluating the effectiveness of any new method.
Conversely, the CPO was selected as the primary solving algorithm due to its demonstrated advantages in preliminary tests and its design principles that are well-suited to this problem’s structure. As a newer algorithm, CPO is reported to exhibit a balanced search strategy between exploration and exploitation, which is crucial for navigating the complex constraint landscape of the HECE low-carbon optimization problem and avoiding premature convergence [21]. Its efficacy in handling continuous variable optimization problems with constraints aligns with the requirements of our model.
While other algorithms like PSO and DE are also viable, this study focuses on the contrast between a proven classic (GA) and a novel, bio-inspired approach (CPO) to provide a clear performance benchmark for future research in this domain.
3.2.2 Application of the CPO Algorithm to This Model
Taking CPO as an example, the steps of applying it to solve formula and constraints mainly include three key parts: encoding, population initialization, and fitness function design. Fig. 2 depicts a conceptual framework of a pangolin inspired optimization algorithm, modeling its behavioral cycle through distinct phases of luring and predation.

Figure 2: The illustration of the CPO algorithm
During encoding, the decision variables, namely the electricity consumption of T periods
In the population initialization phase, an initial population with N individuals is randomly generated. The values of each dimension of an individual
The fitness function scores every candidate consumption plan by computing its carbon emissions and tacking on a penalty for any constraint violation. Using the penalty function approach, each breach is converted into a cost term that is added to the objective, turning the constrained problem into an unconstrained one and steering the algorithm toward feasible schedules.
where

Upon algorithm termination, the found optimal power consumption schedule
3.2.3 Carbon Reduction Potential Calculation
Once the optimal electricity consumption plan
Meanwhile, it is necessary to calculate the carbon emissions
Finally, the overall Carbon Reduction Potential (CRP) achieved by high energy consuming enterprises through power consumption behavior optimization can be calculated using the following formula:
This CRP value quantifies the percentage reduction in carbon emissions achievable through optimized power consumption behaviors (reduction or shifting) relative to the baseline scenario, under the satisfaction of constraints.
4.1 Data Sources and Parameter Settings
The data set pairs anonymized load profiles with regional DCEF values. Following the energy intensive enterprise taxonomy and the study’s objectives, three unnamed users—A, B, and C—are selected. Users A and C are labeled Transfer Types: they pursue the minimum carbon footprint while keeping total daily kilowatt hours fixed. User B is designated a Reduction Type: it seeks the lowest emissions attainable under a pre-set cut in daily energy use. Load data span August 2024 through February 2025 for all three users; the companion DCE series is extracted from the same-period emission factor record of the host city.
The optimization model and algorithm parameters are set as follows: The evaluation period is 24 h (T = 24). The lower limit of user power consumption is 0, and the upper limit is 1.2 times the user’s historical maximum daily load (specific boundary conditions should be precisely defined based on actual conditions). The total electricity constraint is enforced with a large penalty factor of 1 × 10⁷. The CPO algorithm is used for solving the model, with a population size of 50 and a maximum of 200 iterations.
4.2.1 Classification Result Validation
In the computational part of this case study, we predefined Users A and C as transfer type and User B as reduction type. This was to apply different optimization constraints and evaluate their potential. The predefinition is based on general typical energy intensive user behavior patterns.
In a full scale research framework, validating the classification is a must. The standard route is to pull statistical and time series features out of historical load data, run a clustering algorithm, and assign labels [22]. After that, a typical day curve is plotted for each class and within group similarity and between group separation are scored to see whether the clusters line up with both the actual production process and the predefined types: reduction type users usually show a smooth, flat profile, whereas transfer type users exhibit pronounced peaks and valleys or clear operational cycles.
However, because this calculation is intended to showcase the carbon reduction potential assessment process and its results under the given labels, the implementation and validation of a user classification algorithm are outside the scope; the predefined categories are taken as the starting point for all subsequent evaluation.
4.2.2 Carbon Reduction Potential Assessment
Based on the user classification and parameters set in advance, the CPO algorithm was utilized to optimize the low carbon electricity consumption strategies for the three users. The key optimization results, including the baseline carbon emissions, optimized carbon emissions, and CRP, are summarized in Table 1 and visually compared in Fig. 3.


Figure 3: Bar chart of the comparison of carbon reduction potential assessment results for each User
The evaluation confirms that carbon reduction potential is type dependent. User A (transfer) posted a 9.3% drop by rescheduling demand, underscoring the payoff from load shifting. User B (reduction) delivered a 6.7% cut by trimming overall use, matching the preset target. User C (transfer) recorded 8.4%, again through timing tweaks. Both routes work, yet transfer type users, thanks to their load shifting headroom, usually post the larger gain. The spread among them also shows that the size of the timing bonus hinges on individual load signatures and the contemporaneous DCE pattern [23].
To deeply analyze the optimization behavior, Fig. 4 shows the pre and post optimization load curves and DCE curves for each user over approximately 30 days. The optimization model operates on an hourly resolution (T = 24) to generate optimal load schedules for each hour. To visualize the long-term effectiveness and trends of the optimization strategy, the results are aggregated and presented on a daily basis in Fig. 4. The daily load values represent the sum of the optimized hourly consumption for each day, offering a clear overview of the overall impact over the approximately 30-day period. The DCE curves are also aligned with this daily perspective for consistency.

Figure 4: Comparison chart of load curves before and after optimization with DCE
The subplots for Users A and C make the time shift explicit. As intended for transfer type accounts, the solver trims demand whenever the DCE spikes and pushes the same energy back into low DCE windows. User C’s optimized curve spikes precisely when carbon intensity bottoms out, locking in the cleanest power. User A follows the same rule, but the upward bumps are flatter and more spread out, so the low-carbon capture is visibly weaker. That difference in how each load hugs the DCE trough explains why their carbon savings diverge. User B’s plot shows the contrasting reduction strategy: the whole profile drops, with extra cuts timed for the highest DCE hours, so the savings come from both fewer kilowatt hours and cleaner kilowatt hours [24].
The superior performance of the CPO algorithm, as evidenced in Table 2, can be attributed to its balanced exploration and exploitation capabilities, which are particularly well-suited for the complex low-carbon optimization problem at hand. The search space is highly constrained by operational limits and is non-linear due to the time-varying carbon emission factors. While traditional algorithms like GA can struggle with premature convergence in such landscapes, CPO’s bio-inspired triple behavior strategy enables it to dynamically navigate this complexity. It effectively explores broad regions of the solution space to avoid local optima while precisely exploiting promising areas, which is crucial for identifying robust schedules that minimize emissions without violating production constraints. This inherent advantage translates into faster convergence, higher solution quality, and greater constraint satisfaction compared to the GA baseline.

Fig. 5 tracks the convergence of CPO and GA for all three users. Each curve plunges in the first iterations and then flattens out. Across the board, CPO bottoms out at a lower final emission figure than GA, confirming its stronger search capability. User B opens with a high fitness value caused by an early constraint violation that the algorithm repairs almost immediately. Users A and C start from lower initial fitness levels and converge just as reliably.

Figure 5: CPO and GA convergence curve comparison
4.2.3 The Necessity of a Differentiated Framework
To explicitly contrast our differentiated framework with previous monolithic approaches, we conducted a counterfactual analysis by applying mismatched optimization strategies to the enterprises. This analysis demonstrates the pitfalls of applying a single, uniform optimization logic to all HECEs. The results are summarized in Table 3.

This counterfactual analysis reveals the critical limitations of a monolithic approach through two distinct failure modes: when forcibly implementing a transfer type on emission reducing enterprises (User B), only 2.3% carbon reduction potential (CRP) can be achieved, while enforcing a reduction strategy on transfer type enterprises (Users A & C) yields suboptimal results (5.2% and 4.8% CRP), which are both technically and economically inferior to their load shifting potential. Consequently, our differentiated framework, by tailoring strategies to inherent enterprise archetypes, provides more realistic, actionable, and economically viable carbon reduction pathways, effectively overcoming the constraints of prior one size fits all methodologies.
4.3 Discussion and Limitations
The specific CRP values are contingent on the local grid’s generation mix, which dictates the volatility of the DCEF. Consequently, the reported CRP percentages may not directly transfer to regions with stable, low-carbon grids (e.g., hydro or nuclear dominated), where load shifting potential for “transfer type” users is diminished. Nevertheless, the differentiated evaluation framework itself remains universally applicable and valid, providing a robust methodological approach for assessing enterprise level CRP across diverse energy contexts.
Furthermore, the transferability of our findings differs significantly between the two enterprise archetypes. For “reduction type” enterprises, the core strategy of lowering aggregate electricity consumption remains a universally viable and effective carbon reduction pathway. This is because it directly decouples emissions from production activity, regardless of the grid’s carbon intensity profile, making it applicable even in stable, low-carbon grids. In contrast, the efficacy of strategies for “transfer type” enterprises is highly context-dependent. Their potential is intrinsically linked to the temporal volatility of the grid’s DCEF. In systems with minimal carbon intensity variations (e.g., hydro or nuclear dominated grids), the marginal benefit of load shifting diminishes. Therefore, the primary strength of our proposed framework lies in its ability to diagnose this very distinction, ensuring that realistic and economically rational strategies are applied to each enterprise type based on the local energy context.
This paper proposes a novel evaluation framework to assess the CRP driven by the unique power consumption behaviors of HECEs. The core strength of this framework lies in its departure from one size fits all optimization models. Unlike prior studies that often employ a monolithic strategy, our approach explicitly differentiates between “transfer” and “reduction” archetypes. This differentiation is critical, as it provides more realistic and actionable carbon reduction pathways by aligning optimization objectives with the inherent flexibility or lack thereof in an enterprise’s production processes. Based on case studies of three HECE user groups classified by behavior (transfer type/reduction type), three conclusions can be summarized as follows:
⮚ The framework successfully quantifies the CRP achievable through DCEF guided behavioral optimization. Transfer type users (Users A and C) demonstrated significant emission reduction potential via load shifting, achieving CRPs of 9.3% and 8.4% respectively. This highlights the effectiveness of adjusting electricity usage timing based on DCEF. The “reduction type” user (User B) achieved a notable CRP of 6.7%. This outcome exceeds their base 5% power reduction target and is primarily attributed to the strategy of prioritizing load cuts during high DCEF periods while meeting the overall reduction constraint;
⮚ The effectiveness of the proposed framework relies on a robust optimization algorithm. The Chinese Pangolin Optimization algorithm adopted in this study is proven effective, exhibiting good convergence performance and efficiently determining stable low carbon operation strategies under complex constraints. Comparative analysis with the Genetic Algorithm demonstrated that CPO consistently achieved better optimization results (lower final carbon emissions) across all user types within the same number of iterations;
⮚ The results highlight that the effectiveness of emission reduction potential via load shifting (as seen in Users A and C) hinges on the volatility of DCEF and users’ specific load characteristics and operational flexibility. Differences in their shifting patterns relative to the DCE curve lead to variations in achievable CRP. The findings also confirm that even targeted power reduction (User B) can significantly benefit from time-aware scheduling based on dynamic carbon intensity, leading to CRP exceeding the simple volume-based reduction target.
Furthermore, the behavioral and operational focus of our framework constitutes a major practical advantage. It offers a low-cost and readily implementable alternative to capital intensive technology upgrades. For many HECEs, particularly those facing financial or technical constraints, optimizing electricity usage patterns represents an accessible and effective first step toward reducing their carbon footprint, potentially unlocking capital for deeper, long-term technological investments later.
This study lays the groundwork for assessing the carbon reduction potential of HECEs through behavioral optimization. Several promising directions emerge for future research to extend and enhance the proposed framework:
⮚ Advanced Optimization with Reinforcement Learning: The current model utilizes a metaheuristic approach for deterministic optimization. Future work will explore the application of Reinforcement Learning (RL) methods to develop more adaptive and intelligent decision-making systems. RL is particularly suited for sequential decision-making in uncertain environments, such as the power grid. Following the paradigm demonstrated in [25] for offshore wind farms, an RL based agent could be trained to continuously learn and refine HECEs’ load shifting strategies in real-time, directly interacting with a simulated or actual grid environment to maximize long term carbon reduction rewards;
⮚ Robust Optimization under Uncertainty: A key limitation to address is the inherent uncertainty in predicting DCEFs. To enhance the robustness and reliability of the optimization results, our future models will incorporate these uncertainties explicitly. We plan to adopt a stochastic optimization framework that distinguishes between exogenous uncertainty (e.g., from renewable generation and fuel prices) and endogenous uncertainty (e.g., from the evolution of grid infrastructure and market rules), as conceptualized in [26]. This approach will yield optimization strategies that are resilient to a wide range of possible future carbon intensity scenarios, ensuring more dependable carbon savings;
⮚ Linking Operational Flexibility to Strategic Grid Planning: Finally, we intend to investigate how the quantified demand side flexibility from HECEs can inform long-term, strategic grid investment planning. The methodological framework presented in [27] for differentiating between strategic and incremental grid investments provides a powerful lens for this analysis. By modeling the collective carbon reduction potential and load-shifting capacity of HECEs, our future research will explore how this flexible demand can defer or reduce the need for costly grid reinforcement, thereby optimizing infrastructure investments and accelerating the transition to a low-carbon power system.
Acknowledgement: The authors gratefully acknowledge the support of the Science and Technology Project of China Southern Power GridCo., Ltd. (031900KC24040022(GDKJXM20240391)).
Funding Statement: The authors gratefully acknowledge the support of the Science and Technology Project of China Southern Power GridCo., Ltd. (031900KC24040022(GDKJXM20240391)).
Author Contributions: The authors confirm contribution to the paper as follows: Conceptualization, Junwei Zhang; methodology, Pei Liu; software, Huihang Li; formal analysis, Guokang Huang; writing—original draft preparation, Bozheng Yuan; writing—review and editing, Wenjing Wei; supervision, project administration, and correspondence, Xiaoshun Zhang. All authors reviewed the results and approved the final version of the manuscript.
Availability of Data and Materials: The data that support the findings of this study are available from the corresponding author upon reasonable request.
Ethics Approval: Not applicable.
Conflicts of Interest: The authors declare no conflicts of interest to report regarding the present study.
References
1. Xu B, Huang Y, Peng D. Considering the carbon trading mechanism for collaborative optimization of source and load operations in high energy consuming enterprises. In: Proceedings of the 2024 6th International Conference on Electrical Engineering and Control Technologies (CEECT); 2024 Dec 20–22; Shenzhen, China. p. 435–9. doi:10.1109/ceect63656.2024.10898958. [Google Scholar] [CrossRef]
2. Tang T, Sun Y, Zhou Q, Peng D, Zhao H. Design of energy carbon measurement and carbon emission control platform for high-energy-consuming enterprises. In: Proceedings of the 2023 5th International Conference on Electrical Engineering and Control Technologies (CEECT); 2023 Dec 15–17; Chengdu, China. p. 554–8. doi:10.1109/ceect59667.2023.10420601. [Google Scholar] [CrossRef]
3. Dey B, Krishnamurthy S, Fose N, Ratshitanga M, Moodley P. A metaheuristic approach to analyze the techno-economical impact of energy storage systems on grid-connected microgrid systems adapting load-shifting policies. Processes. 2025;13(1):65. doi:10.3390/pr13010065. [Google Scholar] [CrossRef]
4. Jin Y, Xu S, Guo Q, Xiong N. Analysis of the impact of electricity emission factor selection on high energy-consuming industries under the national carbon market expansion. In: Proceedings of the 2024 4th International Conference on Energy, Power and Electrical Engineering (EPEE); 2024 Sep 20–22; Wuhan, China. p. 1050–3. doi:10.1109/epee63731.2024.10875432. [Google Scholar] [CrossRef]
5. Kuang H, Zhang Z, Zhong H, Ma Y, Zhong Y. Energy Internet oriented emission reduction strategy of high energy consuming industrial parks. In: Proceedings of the 2023 5th Asia Energy and Electrical Engineering Symposium (AEEES); 2023 Mar 23–26; Chengdu, China. p. 1323–9. doi:10.1109/aeees56888.2023.10114085. [Google Scholar] [CrossRef]
6. Neuwirth M, Fleiter T, Hofmann R. Modelling the transformation of energy-intensive industries based on site-specific investment decisions. Sci Rep. 2024;14(1):30552. doi:10.1038/s41598-024-78881-7. [Google Scholar] [PubMed] [CrossRef]
7. Wen J, Liu R, Miao B, Zhou X, Wang X, Liu C. Study on the assessment method of carbon emission reduction potential in electricity transmission and distribution project construction. In: Proceedings of the 2025 Asia-Europe Conference on Cybersecurity, Internet of Things and Soft Computing (CITSC); 2025 Jan 10–12; Rimini, Italy. p. 113–8. doi:10.1109/citsc64390.2025.00028. [Google Scholar] [CrossRef]
8. Du Z, Guo Q, Zhang X, Guo Q, Ma X, Wu X. Research on assessment method of regional power carbon emission reduction potential. In: Proceedings of the 2024 4th International Conference on Energy Engineering and Power Systems (EEPS); 2024 Aug 9–11; Hangzhou, China. p. 1327–31. doi:10.1109/eeps63402.2024.10804323. [Google Scholar] [CrossRef]
9. Ghasemi A, Gerami N. A review on demand response based ancillary services offered by industries. J Power Technol. 2024;104(1):32–55. [Google Scholar]
10. Zhuang Z, Liu X, Shang H, Dou J, Cheng H. Assessment method for potential carbon reduction in electricity considering marginal cost-effectiveness. In: Proceedings of the 2024 5th International Symposium on New Energy and Electrical Technology (ISNEET); 2024 Dec 27–29; Hangzhou, China. p. 545–53. doi:10.1109/isneet64164.2024.10956008. [Google Scholar] [CrossRef]
11. Verpoort PC, Gast L, Hofmann A, Ueckerdt F. Impact of global heterogeneity of renewable energy supply on heavy industrial production and green value chains. Nat Energy. 2024;9(4):491–503. doi:10.1038/s41560-024-01492-z. [Google Scholar] [CrossRef]
12. Liu J. Cluster analysis of electricity consumption characteristics and electricity consumption behavior of typical industry users. In: Proceedings of the 2023 5th Asia Energy and Electrical Engineering Symposium (AEEES); 2023 Mar 23–26; Chengdu, China. p. 1389–95. doi:10.1109/aeees56888.2023.10114302. [Google Scholar] [CrossRef]
13. Wu Y, Li H. Additive model for user electricity consumption behavior analysis. In: Proceedings of the 2019 IEEE 4th Advanced Information Technology, Electronic and Automation Control Conference (IAEAC); 2019 Dec 20–22; Chengdu, China. p. 1703–7. doi:10.1109/iaeac47372.2019.8997882. [Google Scholar] [CrossRef]
14. Li Y, Wu W, Yang H, Gong G, Zhang Y, Luo S, et al. Dynamic carbon emission factors in source-network–storage power system planning: a focus on inverse modelling. Energies. 2024;17(24):6346. doi:10.3390/en17246346. [Google Scholar] [CrossRef]
15. Xu M, Lv Z, Wang H, Lang S, Wang S, Li S. Theoretical research on carbon emission factors of distributed smart distribution network under high proportion of renewable energy access. E3S Web Conf. 2024;520:04025. doi:10.1051/e3sconf/202452004025. [Google Scholar] [CrossRef]
16. Ma F, Ying L, Cui X, Yu Q. Research on a low-carbon optimization strategy for regional power grids considering a dual demand response of electricity and carbon. Sustainability. 2024;16(16):7000. doi:10.3390/su16167000. [Google Scholar] [CrossRef]
17. Xia S, Wang Q, Zhu B, Peng D, Xu B, Zhao H. Considering demand response for collaborative optimization of source and load operations in high energy consuming enterprises. In: Proceedings of the 2024 4th Power System and Green Energy Conference (PSGEC); 2024 Aug 22–24; Shanghai, China. p. 697–701. doi:10.1109/psgec62376.2024.10721138. [Google Scholar] [CrossRef]
18. Zhang S, Li Y, Du E, Wang W, Wang M, Feng H, et al. Research on carbon-reduction-oriented demand response technology based on generalized nodal carbon emission flow theory. Energies. 2024;17(18):4672. doi:10.3390/en17184672. [Google Scholar] [CrossRef]
19. Zhang X, Guo Z, Pan F, Yang Y, Li C. Dynamic carbon emission factor based interactive control of distribution network by a generalized regression neural network assisted optimization. Energy. 2023;283:129132. doi:10.1016/j.energy.2023.129132. [Google Scholar] [CrossRef]
20. Gu Z, Lu W, Fan Y, Gao Y. Automated simplified structural modeling method for megatall buildings based on genetic algorithm. J Build Eng. 2023;77:107485. doi:10.1016/j.jobe.2023.107485. [Google Scholar] [CrossRef]
21. Guo Z, Liu G, Jiang F. Chinese Pangolin Optimizer: a novel bio-inspired metaheuristic for solving optimization problems. J Supercomput. 2025;81(4):517. doi:10.1007/s11227-025-07004-4. [Google Scholar] [CrossRef]
22. Veeramachaneni V. Optimizing renewable energy integration in AI-driven data centers using quantum algorithms. J Netw Secur Data Min. 2025;8(1):36–48. [Google Scholar]
23. Zhou B, Huang Y, Su H, Wang J. Mechanism conflicts: carbon reduction pathways and optimization in China’s Big Data Policy. Humanit Soc Sci Commun. 2025;12(1):560. doi:10.1057/s41599-025-04805-z. [Google Scholar] [CrossRef]
24. Guo Z, Zhang X, Pan F, Yang Y, Li J. Dynamic electricity-carbon factors driven fast day-ahead coordination and optimization of source-load-storage in distribution networks with a white box accelerator. Energy. 2025;331:137049. doi:10.1016/j.energy.2025.137049. [Google Scholar] [CrossRef]
25. Fu Y, Ren Z, Wei S, Huang L, Li F, Liu Y. Dynamic optimal power flow method based on reinforcement learning for offshore wind farms considering multiple points of common coupling. J Mod Power Syst Clean Energy. 2024;12(6):1749–59. doi:10.35833/mpce.2023.000765. [Google Scholar] [CrossRef]
26. Giannelos S, Konstantelos I, Zhang X, Strbac G. A stochastic optimization model for network expansion planning under exogenous and endogenous uncertainty. Electr Power Syst Res. 2025;248:111894. doi:10.1016/j.epsr.2025.111894. [Google Scholar] [CrossRef]
27. Giannelos S, Zhang T, Pudjianto D, Konstantelos I, Strbac G. Investments in electricity distribution grids: strategic versus incremental planning. Energies. 2024;17(11):2724. doi:10.3390/en17112724. [Google Scholar] [CrossRef]
Cite This Article
 Copyright © 2026 The Author(s). Published by Tech Science Press.
This work is licensed under a Creative Commons Attribution 4.0 International License , which permits unrestricted use, distribution, and reproduction in any medium, provided the original work is properly cited.
 Downloads
 Citation Tools