
 Login
Login Register
 Submit a Paper
 Propose a Special lssue
 Open Access
ARTICLE

Hybrid Life Cycle Assessment of a Nano-Enhanced Phase Change Material (NEPCM) Integrated Double-Effect Single-Slope Solar Still in Nigeria
1 Department of Mechanical Engineering, Federal University of Technology Owerri, Nigeria
2 Department of Environment Management, Federal University of Technology Owerri, Nigeria
3 Centre for Energy Efficient and Sustainable Technologies, Brunel University, London, UK
* Corresponding Author: Princewill Ikpeka. Email:
Energy Engineering 2026, 123(6), 25 https://doi.org/10.32604/ee.2026.077231
Received 04 December 2025; Accepted 05 March 2026; Issue published 27 May 2026
 View Full Text
 Download PDF
Abstract
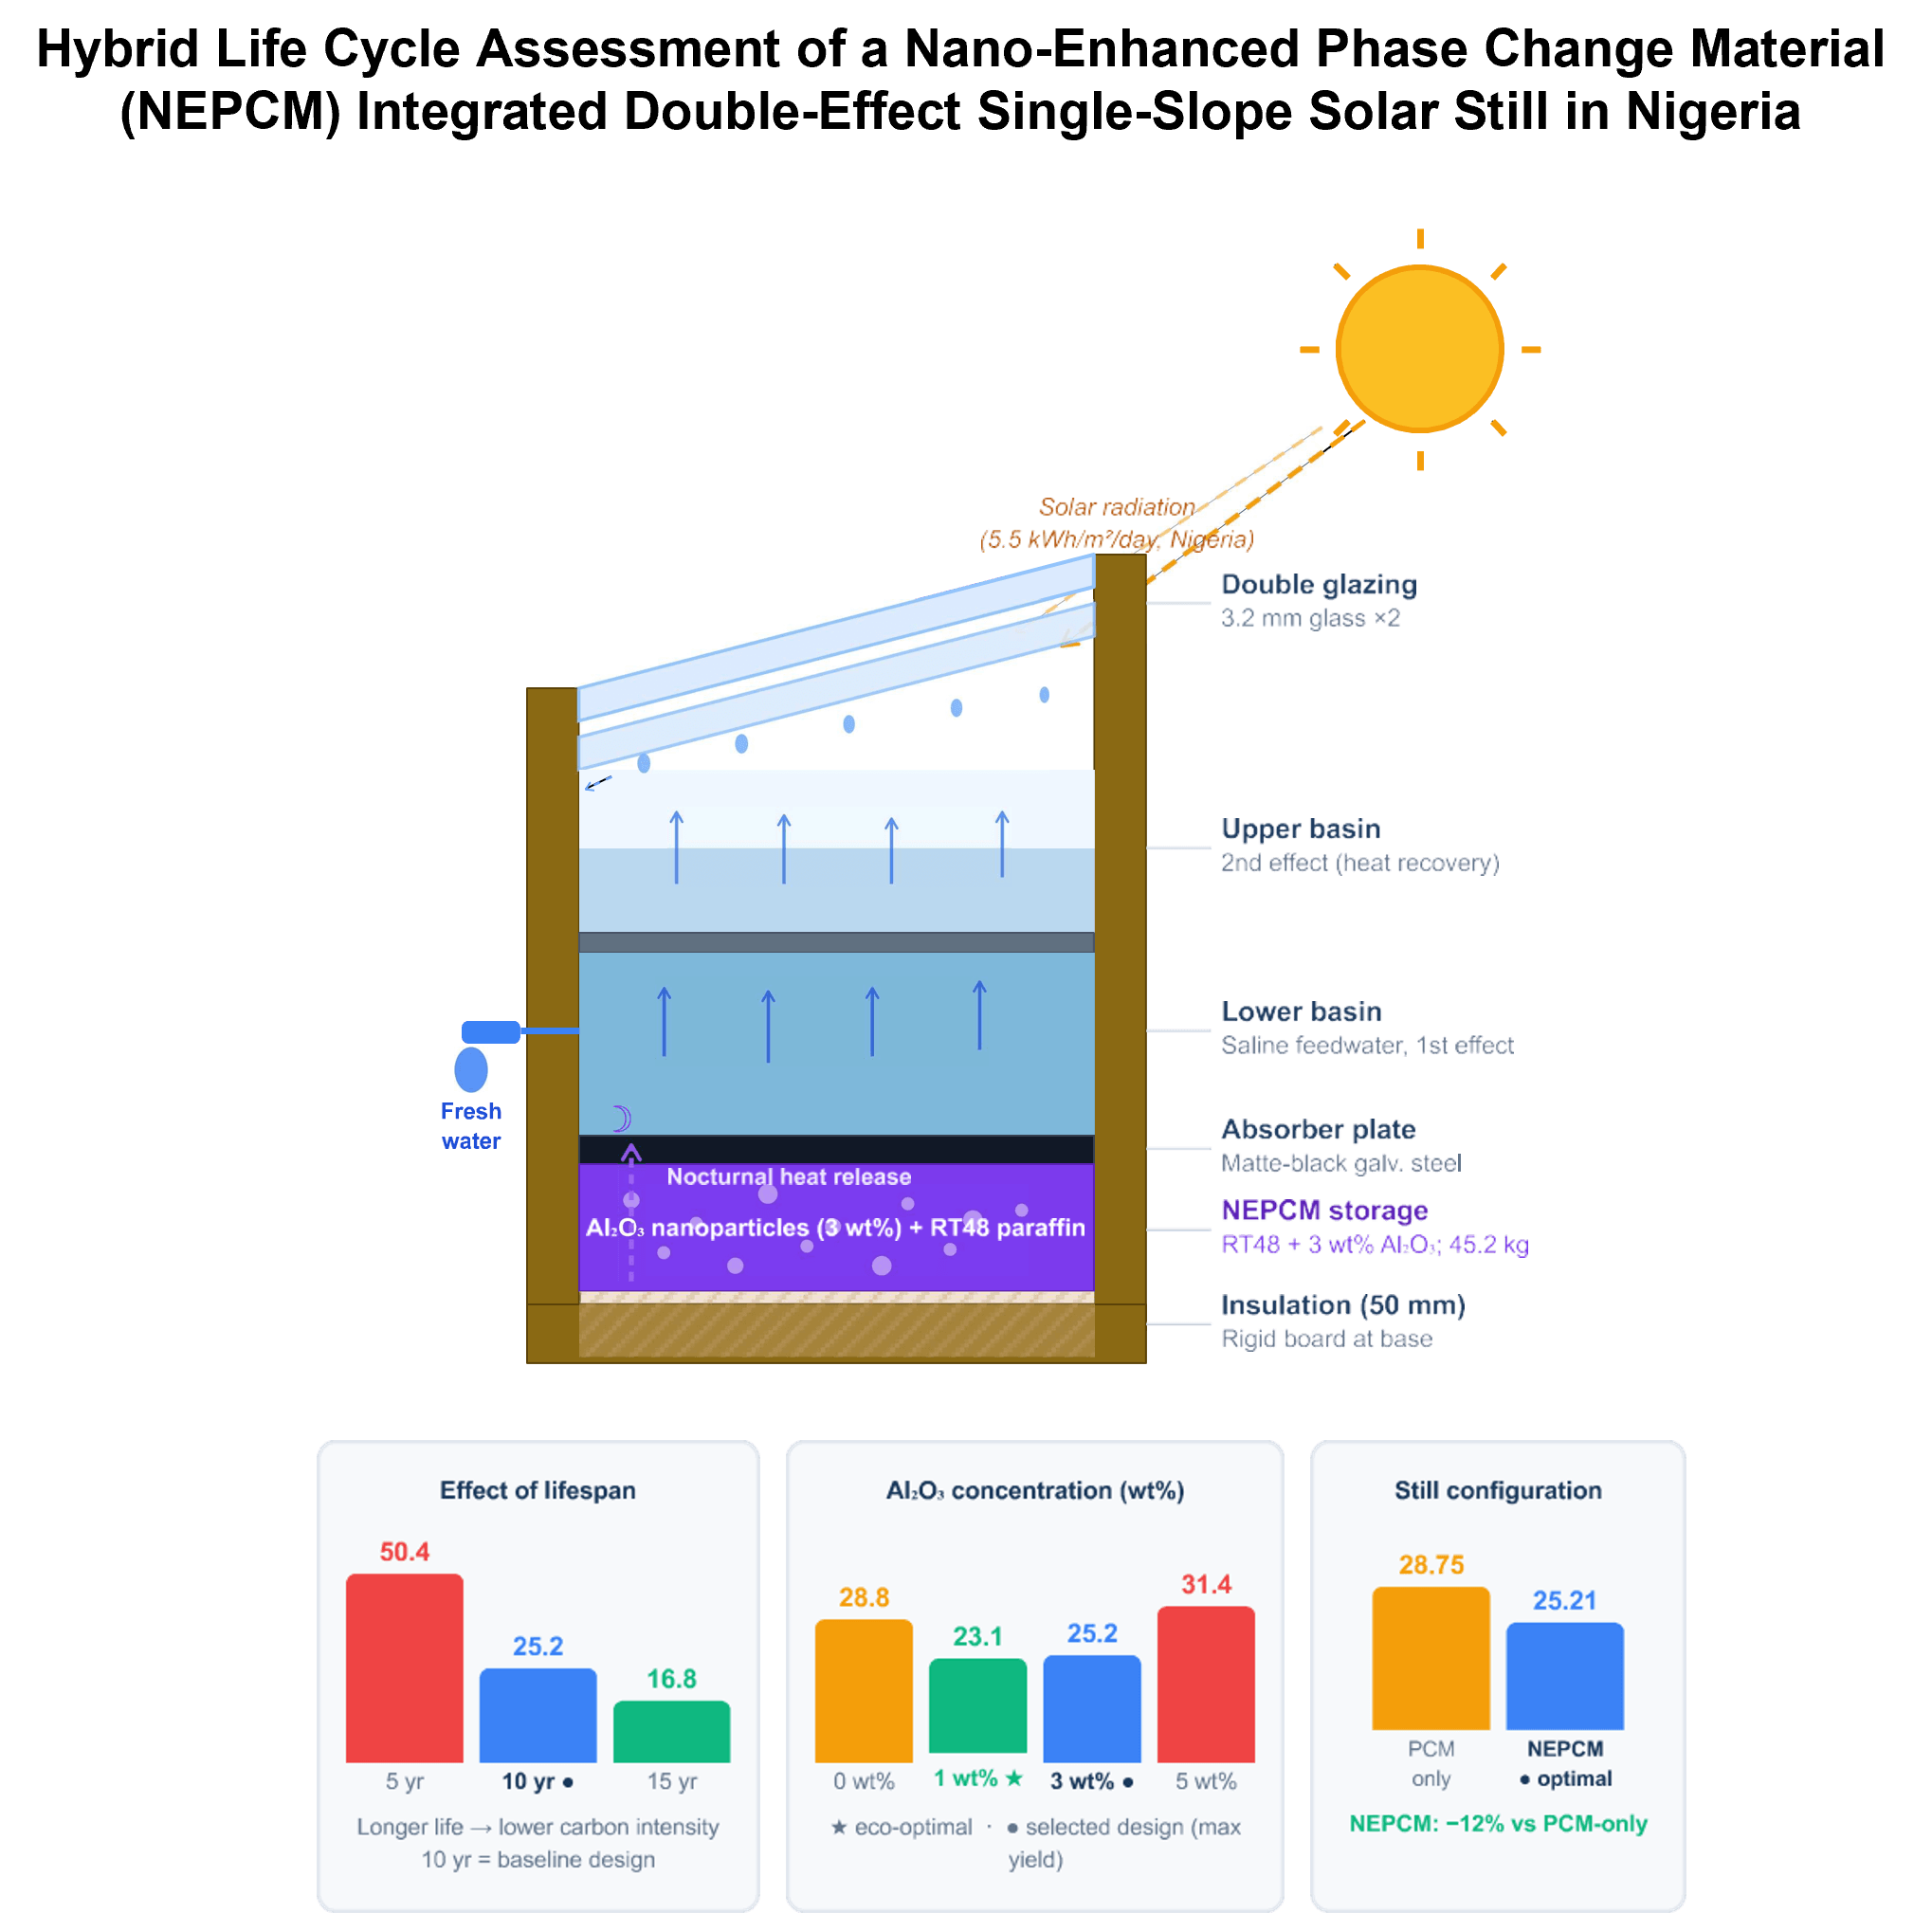
Increasing demand for freshwater and the need to reduce the carbon intensity of conventional desalination have accelerated interest in solar-driven distillation technologies. This study performs a cradle-to-grave Life-Cycle Assessment (LCA) of a nano-enhanced, double-effect single-slope Solar Still fabricated in Nigeria to quantify its embodied environmental impacts and identify material-level hotspots. Modeling was conducted in openLCA v2.4.1 using the Australian Life-Cycle Inventory (2019) database as a proxy. The functional unit was defined as the production of 1 m3 of freshwater distillate over a ten-year operational lifetime. From the analysis, the total Global Warming Potential (GWP100) of the fabricated Solar Still was 337.3 kg CO2-eq, which corresponds to a normalized carbon intensity of 25.21 kg CO2-eq m−3 for a lifetime yield of 13.38 m3. Contribution analysis revealed that Al2O3 nanoparticles (31.5%), paraffin wax PCM (22%), and galvanized steel (19%) and glass (13%) together account for more than 85% of total embodied emissions, confirming that the Solar-Still’s footprint is materials-dominated. When benchmarked against conventional desalination, the system’s carbon intensity lies above reverse osmosis but within the upper range of multi-stage flash distillation, with the advantage of zero operational emissions. Sensitivity analyses were performed to examine the influence of nano-enhanced PCM content, alumina concentration, and system lifespan on overall impacts. The novelty of this study lies in the hybrid-LCI approach adopted to provide a replicable framework for evaluating nanomaterial-enhanced renewable-energy systems in emerging regions. Key opportunities for improvement through bio-based or recyclable PCMs, low-impact nanomaterial synthesis, and design optimization to enhance productivity and material circularity were also highlighted in the study.Graphic Abstract
Keywords
Freshwater is an indispensable but finite resource. Although water covers about 71% of the Earth’s surface [1], roughly 97% of the planet’s waters are saline, leaving less than 3% as freshwater, most of which are locked in ice or deep aquifers [2,3]. Population growth, industrialization, and climate change are placing unprecedented pressure on these limited reserves. The per-capita freshwater availability in many arid and semi-arid regions, including large parts of Africa, continues to decline each year, threatening food security, economic productivity, and public health [4,5].
Desalination, the process of converting saline water into potable freshwater, has therefore become an essential component of global water-supply strategies [6]. Commercial desalination is broadly classified according to its separation mechanism into thermal and membrane technologies [7,8]. Thermal desalination uses heat of evaporation to separate water and salt, and includes multi-stage flash (MSF) and multi-effect distillation (MED), while membrane processes, principally reverse osmosis (RO) and electrodialysis, rely on selective diffusion through semi-permeable membranes [9]. Modern desalination systems can produce water of high purity but are energy intensive. The electricity or steam that drives them is often fossil-based, resulting in carbon footprints ranging from 1.8–3.6 kg CO2-eq m−3 for RO [10–12] to 9–25 kg CO2-eq m−3 for MSF [13–16], depending on the energy mix. These operational emissions worsen global warming and increase operating costs.
In contrast, solar-driven desalination offers lower carbon-intensity pathway. Among its variants, the passive solar still is mechanically simple, requires no external energy supply, and is particularly suited to off-grid, rural settings with high solar irradiation such as Nigeria (5.5 kWh m−2 day−1) [17]. Solar Stills harness solar energy to evaporate saline feedwater and condense freshwater on a cooled surface. Despite its environmental appeal, the technology suffers from low daily productivity, typically 3–6 L m−2 day−1 and a limited understanding of its embodied environmental burden [18]. To overcome low daily productivity due to the intermittency of solar radiation, thermal energy storage (TES) has emerged as a critical advancement in solar distillation. Latent Heat Storage (LHS) using Phase Change Materials (PCMs), such as paraffin wax, has shown to be particularly effective due to its high energy storage density and isothermal phase transition. However, conventional organic PCMs suffer from low thermal conductivity (~0.2 W m−1 K−1), which retards the rate of heat charging and discharging, thereby limiting system efficiency.
Recent research has focused on overcoming this thermal bottleneck by dispersing high-conductivity nanoparticles (e.g., Al2O3, CuO, TiO2) into the PCM matrix. These ‘Nano-Enhanced PCMs’ (NEPCMs) significantly improve thermal diffusivity, enabling faster energy transfer and higher daily yields. Studies, for example, [18–22] have reported increases in daily yield ranging from approximately 10% to over 120% when using PCMs and from 18% to 180% with the use of NEPCMs [19,23–25].
In particular, a study by Chaichan and Kazem [19] have shown that dispersing 3 wt.% Al2O3 into paraffin can increase water productivity by 60.53%. Dsilva Winfred Rufuss et al. [26] reported that TiO2 and CuO nanoparticles improved productivity by 39.3% and 43.2%, respectively; this finding has also been discussed by other researchers [27]. Furthermore an 83.7% increase in productivity was achieved using graphene oxide [28]. These results highlight the pivotal role of nanoparticle integration in enhancing the nocturnal performance of solar stills.
Thus, while the operation of passive solar stills is emission-free and NEPCMs have shown promise in boosting daily distillate yield, the materials and fabrication of the Still, as well as the use of NEPCMs, may carry substantial hidden environmental impacts.
This study addresses this knowledge gap by:
i. Performing a cradle-to-grave Life-Cycle Assessment (LCA) of a locally fabricated double-effect, single-slope Solar Still equipped with Nano-Enhanced Phase Change Material (NEPCM) thermal storage.
ii. Quantifying the embodied carbon footprint (kg CO2-eq per m3 distillate) and related midpoint indicators such as energy use, ecotoxicity, and resource depletion.
iii. Identifying environmental hotspots within the Solar Still’s material composition and life-cycle stages.
iv. Benchmarking environmental performance against conventional desalination technologies and identifying material or design pathways for impact reduction.
2.1 Life-Cycle Assessment Framework
Life-Cycle Assessment (LCA) is a standardized method (ISO 14040/14044) for quantifying the environmental impacts of a product system from cradle-to-grave, encompassing resource extraction, manufacturing, use, and end-of-life. In this study, modeling was performed using openLCA v2.4.1 with the Australian Life-Cycle Inventory (OzLCI 2019) database as a proxy for Nigerian conditions, owing to the absence of a national LCI. Impact characterization employed IMPACT World+ v1.29 [29], which provides globally regionalized midpoint indicators including Global Warming Potential (GWP100), energy-resource depletion, toxicity, and water-scarcity metrics. The functional unit (FU) for this system is set up as the delivery of 1 m3 of purified distillate at the Still outlet. This specific FU provides a standardized metric, enabling a direct and meaningful comparison of the still’s embodied impacts against other desalination and solar distillation technologies. A comprehensive cradle-to-grave methodology, assessing the complete life cycle of the Solar Still from raw material extraction through manufacturing, transportation, operational use, and end-of-life disposal was conducted. Sensitivity testing and data-quality transparency approaches emphasized in recent reviews of renewable-energy LCAs [30] were adopted here to ensure robustness.
In this study, we attempt to quantify the embodied carbon footprint and associated environmental impacts of a passive double-effect single-slope Solar Still, integrated with a nano-enhanced phase change material (NEPCM) for thermal energy storage as shown in Fig. 1. This Solar Still analysis is based on a full-scale double-effect, single-slope prototype previously fabricated and tested at the Federal University of Technology, Owerri, Nigeria (5.49°N, 7.02°E) (See Fig. 2). A detailed thermal and productivity analysis of this prototype when loaded with PCM (paraffin wax) was reported in [31] while its thermal and productivity analysis without PCM (Base Case) can be found in [32].

Figure 1: Schematics of fabricated solar still.

Figure 2: Actual fabricated solar still.
The experimental rig consists of a galvanized-steel absorber plate (2 mm thickness, 1.1 m2 area) coated matte black, two shallow basins, double 3.2 mm glass glazing, and a thermal energy storage layer attached beneath the absorber. The basins and glazing share the same footprint (1.0 m × 1.1 m), with a front height of 0.56 m, back height of 0.74 m, and a 10° glazing tilt. The wooden casing is insulated at the base with 50 mm of rigid insulation. Fig. 1. shows a schematic diagram of the Solar Still, while Fig. 2. shows the actual rig.
The thermal storage component utilizes RT48 paraffin wax doped with 3 wt.% Al2O3 nanoparticles, forming a nano-enhanced PCM (NEPCM). This NEPCM integration is intended to improve heat storage by approximately 63% and release uniformity during continuous day-night operations.
The system operates on a passive double-effect distillation cycle enhanced by latent heat thermal energy storage. During insolation hours, short-wave solar radiation transmits through the double-glazing cover and is absorbed by the saline water and the mild steel absorber plate.
The double-effect mechanism relies on heat recovery: As water in the lower basin evaporates, it rises via buoyancy and diffusion to condense on the underside of the upper glazing. Crucially, the latent heat released during this condensation conducts through the glazing to heat the saline water in the upper (second) basin. This recovered energy drives a secondary evaporation cycle towards the top glazing, thereby increasing overall thermal efficiency compared to a single effect Still.
Simultaneously, the thermal energy storage layer, comprising RT48 Paraffin Wax enhanced with 3 wt.% Al2O3 nanoparticles, absorbs energy from the absorber plate via conduction. As the plate temperature exceeds the wax’s melting point (48°C), the PCM undergoes a solid-to-liquid transition, storing energy as latent heat. After sunset, a reverse temperature gradient is established. The NEPCM re-solidifies, releasing its stored heat back through the absorber plate to the basin water. This sustains the evaporation process into the nocturnal hours, significantly extending the system’s daily productivity.
To accurately compute the carbon intensity of the Solar Still, foreground system data, which includes material quantities and process linkages, were derived directly from the experimental rig’s bill of materials. All background processes, such as steel production, paraffin wax manufacturing, and the electricity mix, were sourced from the corresponding OzLCI datasets. An inventory of all the materials used to produce the Solar still is outlined in Table 1. The inventory includes 45.20 kg of paraffin wax (RT48) for the PCM and 1.36 kg of Al2O3 nanoparticles as the NEPCM additive and has a total gross mass of approximately 113.9 kg. The structural housing consists of 27.58 kg of structural marine plywood (FSC certified), while the basin and frame are made from 21.00 kg of galvanized steel (Z350, 3.6% PCR). The double-glazing component requires 18.53 kg of 6 mm clear flat glass, and the piping uses 0.27 kg of uPVC conduit. All material and process data, with the exception of the nanoparticles, were proxied using OzLCI datasets (e.g., ‘Glass manufacture’, ‘Steel, cold rolled’, ‘Paraffin wax’, ‘Plywood, kiln dried’, and ‘PVC extrusion’). The inventory also includes inbound transport, modeled as 6.69 km of road freight.

2.4 Hybrid Life-Cycle Inventory (LCI) Development
The background processes for conventional construction materials (glass, steel, plywood, PVC, paraffin wax) are available in major LCI databases (OzLCI, GaBi, ecoinvent), engineered nanomaterials such as Al2O3 nanoparticles are absent [33], mainly because they are typically produced at laboratory or pilot scale. Consequently, the environmental profile of the alumina nanoparticles used in this study was derived using a hybrid-LCI approach, i.e., combining database datasets for conventional materials with a literature-based inventory for the nano-additive.
Barberio et al. [34] report cradle-to-gate impacts for “BASE CASE—nanofluid of alumina (two-stage)”, a system in which alumina nanoparticles are synthesized (stage 1) and subsequently dispersed into a liquid carrier (stage 2). The total Global Warming Potential (GWP100) reported from their work for the production of 1000 kg of nanofluid was 7066.44 kg CO2-eq. The nanofluid contained 9 wt.% Al2O3, therefore the resulting nanoparticle mass within this functional unit was 90 kg. Assuming that the reported GWP value reflects the combined burdens of nanoparticle synthesis + dispersion, the GWP per kilogram of alumina nanoparticles was obtained by dividing the total GWP (7066.44 kg CO2-eq) by mass of Al2O3 (90 kg), resulting in an estimated 78.527 kg CO2-eq per kg Al2O3.
This interpretation is consistent with the two-stage system boundary described by Barberio et al. [34], where nanoparticle synthesis energy dominates the environmental profile, and dispersion energy contributes a comparatively small share. To avoid double counting, the base PCM (RT48 paraffin wax) is modeled separately using OzLCI, and no additional mixing energy is added in openLCA, because the two-stage nanofluid dataset already includes the energy required to disperse nanoparticles into a carrier fluid. A custom process named “Alumina nanoparticles” was created in openLCA, and the derived emission factor (78.52 kg CO2-eq kg−1) was incorporated manually into the “Emissions to air” tab. This process was then linked to the solar-still manufacturing model as the upstream input for the 1.356 kg of nanoparticles (3 wt.%) used in the NEPCM formulation.
2.5 Operational Parameters of the Solar Still
A conservative design lifetime

No major component replacements were modeled, as the primary glass, PCM, and structural elements are expected to last the full design life. Cleaning is assumed to consist only of water-only rinsing (approximately 3 L/month), which is considered to have a negligible impact. The system has an effective area (A) of 1.1 m2. The daily freshwater yield was derived using a two-step estimation approach. First, the baseline productivity was anchored to primary experimental data from the solar still when paraffin wax PCM was used and reported in [31]. To verify the functional unit (1 m3 distillate) for the Nano-Enhanced (NEPCM) variant, the yield projection was validated against peer-reviewed experimental literature. While the base prototype produced an established baseline yield, the integration of Al2O3 nanoparticles is projected to increase productivity. A performance enhancement factor of 63% was applied to derive the daily yield of 4.0 L m−2 day−1. This projection is conservative, lying at the lower bound of experimental results for Al2O3-enhanced paraffin storage, where reported improvements range from 55% [39], 60% [40] to over 116% [41]. By selecting a conservative enhancement factor, the study minimizes the risk of overestimating the ‘environmental return on investment’ of the nanomaterials. The Still is projected to produce a total lifetime distillate volume of 13.38 m3, as summarized in Table 2.
The lifetime distillate yield (
where:
A = the solar aperture area of the still (in m2)
Y = the average daily water yield (in L/m2/d)
U = the utilisation factor, representing the fraction of operational days per year
L = the operational lifespan of the device (in years)
1000 = the conversion factor from Liters to m3
From the lifetime production volume, a scaling factor (
This allocation was implemented in openLCA software using a two-process model. A primary process, representing the production of one solar still (‘item’), was created to contain all cradle-to-grave material and energy flows from its Materials (given in Table 1). A secondary process was created to represent the functional unit (1 m3 of distillate), which consumes the primary process as an input, scaled by the allocation factor
where
Transportation of the manufactured unit from the factory to the installation site was modelled using a process for an 18–25 tonne semi-trailer. The environmental impact was calculated based on allocated vehicle-kilometers (vkm) rather than simple tonne-kilometres, as the logistics for such products are often constrained by volume or shared freight arrangements. The required vehicle-kilometres were calculated using Eq. (4):
where:
M = total mass to inputs to ship (kg)
It is important to clarify that the transport value listed in the inventory (6.69 km) represents the allocated burden, not the absolute geographic distance. Since the Solar Still (mass:114 kg) occupies only a fraction of the modeled 25-tonne truck’s capacity, the actual geographic distances were scaled down to reflect the product’s actual share of the vehicle’s emissions. Consequently, this figure is not a fixed universal value but a weighted average specific to the supply chain scenario of this study.
2.6 Life Cycle Impact Assessment (LCIA)
To address uncertainties in waste management practices, the end-of-life (EoL) phase was modeled using a Landfill Scenario, a conservative baseline assumption in which 100% of the product’s components are routed to landfill streams upon completion of their operational lifespan. The Life Cycle Impact Assessment (LCIA) was conducted using the IMPACT World+ (v1.29) characterization method at the midpoint level. The primary indicator selected for this analysis is Global Warming Potential (GWP100), expressed in kg CO2-equivalents. This primary focus is supported by a comprehensive suite of secondary indicators to ensure a thorough environmental profile. These include fossil and nuclear energy use (MJ deprived), freshwater ecotoxicity (CTUe), human toxicity (both cancer and non-cancer, CTUh), mineral resource use (kg deprived), eutrophication (marine and freshwater), photochemical oxidant formation (kg NMVOC), particulate matter formation (kg PM2.5 eq), terrestrial acidification (kg SO2 eq), ozone layer depletion (kg CFC-11 eq), and water scarcity (m3 world eq). To maintain consistency with the functional unit, all impact assessment results are normalized to 1 m3 of purified distillate output. The results of the analysis were expressed using several key metrics, including the total embodied GWP per Still (kg CO2-eq unit−1) and the GWP intensity per unit of distillate (kg CO2-eq m−3). The assessment also provides a process contribution breakdown, detailing the percentage share of each material, alongside normalized and aggregated midpoint impacts. Data quality was addressed through temporal representativeness (2019–2024) and completeness checks. Although Australian datasets were used as a regional proxy for Nigeria, the analysis focuses on relative contribution patterns, which are expected to remain robust across different datasets.
3.1 Life Cycle Impact Assessment Results
Processes excluded from this analysis, such as operator travel, minor maintenance, and cleaning consumables were deemed negligible, as they were estimated to contribute less than 1% of the total embodied impact. The midpoint environmental impact obtained for the functional unit of 1 m3 of purified distillate is summarized by Table 3. The embodied Global Warming Potential (GWP100) of the passive double-effect Solar Still was found to be 25.21 kg CO2-eq m−3, corresponding to a total cradle-to-grave footprint of 337.3 kg CO2-eq per Still unit. Given the 10-year lifespan, aperture area of 1.1 m2, average yield of 4 L·m−2·day−1, and a utilization factor of 0.83, the total freshwater output was calculated as 13.38 m3 over the still’s operational life. Dividing the total embodied emissions by this output yields a normalized footprint of 25.21 kg CO2-eq m−3, representing the final carbon intensity of the Still.

Although the numerical values derived from the modelling are specific to the prototype and database used, the hotspot hierarchy and relative contribution patterns are generalizable because they arise from material-inherent life-cycle burdens rather than local operating conditions. Sensitivity testing confirmed that the dominance of NEPCM, paraffin wax, steel, and glass remain structurally consistent across variations in lifetime, productivity, and background datasets, suggesting that the findings are broadly representative of solar stills incorporating PCM/NEPCM thermal storage.
Furthermore, this value is comparable to the results of Jijakli et al. [42] and other small-scale solar desalination systems, it is significantly higher than grid-powered reverse osmosis (RO) systems (1.8–3.6 kg CO2-eq m−3) and lies near the upper limit of multi-stage flash (MSF) distillation (9–25 kg CO2-eq m−3). This finding underscores that, despite being passive and emission-free in operation, the low lifetime yield of such small-scale systems amplifies their embodied carbon when normalized per cubic meter of product water.
In addition to GWP, notable environmental contributions were observed for fossil and nuclear energy use (364.7 MJ deprived m−3), freshwater ecotoxicity (25.1 CTUe), and mineral resource use (1.51 kg deprived m−3). Toxicity indicators (human cancer and non-cancer) and eutrophication potentials were comparatively minor.
A detailed contribution (hotspot) analysis was conducted to decompose the still’s total 337.3 kg CO2-eq into material-level shares (Fig. 3). The analysis identified three clear hotspots: Alumina nanoparticles (31.5%), modeled using the custom “Alumina NPs (from Barberio et al. [34])” process, dominate the manufacturing-stage emissions due to the high energy intensity of nanoparticle synthesis. Paraffin wax (22%), the petroleum-derived PCM, represents the second-largest source, primarily from refining and end-of-life incineration. Steel and Glass (19% and 13%) contribute moderate shares through energy-intensive smelting and forming processes. Wood and other minor components (12% and 3%) account for residual contributions from the casing fabrication and transport.

Figure 3: Embodied climate impact breakdown per 1 m3 of distillate (Bar chart showing contributions from Al2O3 NPs, paraffin wax, galvanized steel, flat glass, plywood, freight, and uPVC).
Collectively, these four components account for over 85% of the total GWP, confirming that the Solar Still’s environmental profile is materials-driven rather than dominated by use-phase or transport emissions.
This hierarchy mirrors findings from earlier LCA studies on solar desalination systems, where PCM manufacturing and metal components consistently represent the largest embodied energy sources. The large share of Al2O3 nanoparticles stems from energy-intensive synthesis processes, consistent with Barberio et al. [34], who reported cradle-to-gate GWP values exceeding 70 kg CO2-eq kg−1 Al2O3. The paraffin wax, though lower in emission intensity, dominates by mass (45 kg per still). The embodied carbon associated with glass production (12% of total) primarily arises from high-temperature melting of silica feedstocks, while the plywood contribution (12%) reflects kiln-drying energy demand and resin-based binders. The very low PVC and freight shares (<3%) confirm the dominance of material production over logistics.
3.3 Life Cycle Energy and Resource Demand
Beyond its climate impacts, the Solar Still had a cumulative primary energy demand of approximately 365 MJ per cubic meter of distilled water. Approximately half of this embodied energy originates from the paraffin-based PCM production chain, followed by contributions from steel fabrication, glass manufacturing, and nanoparticle synthesis. These upstream processes collectively dominated the system’s resource and energy requirements. To better understand the broader environmental profile, Fig. 4 presents a log-normalized radar plot of midpoint impact categories. Log-scaling was required due to differences spanning several orders of magnitude across categories. This transformation more clearly highlights the relative contributions across all impact pathways.

Figure 4: Log-normalized environmental impact profile of the NEPCM-integrated solar still (IMPACT World + midpoint).
The results reveal that fossil and nuclear energy use, freshwater ecotoxicity, climate change, and particulate matter formation are the most influential categories in the embodied footprint of the system. These impacts stem primarily from the energy and chemical-intensive production of paraffin wax and alumina nanoparticles, as well as metal processing for the structural frame. In contrast, categories such as eutrophication, acidification, ozone depletion, ionizing radiation, and water scarcity exhibit negligible contributions, even after log-scaling. This indicates that while the system is materially intensive, it does not impose significant burdens on nutrient-loading or atmospheric depletion pathways.
Overall, the expanded impact profile confirms that the incorporation of advanced materials particularly NEPCM introduces additional toxicity and resource-related burdens that do not appear in simpler Solar Still designs. These findings underscore the importance of material optimization and sustainable sourcing when integrating NEPCMs into thermal energy storage systems.
4 Benchmark against Other Desalination Technologies
Comparing embodied Carbon Intensity of the Solar still against those from major desalination technologies, we pooled the mean of literature-reported operational emissions for Reverse Osmosis (RO) [43–46] and Multistage Flash (MSF) [44,47] with the embodied greenhouse gas intensity of our fabricated NEPCM-integrated Solar Still. The result of this benchmark is given in Fig. 5. Reverse osmosis (RO) systems generally exhibit operational climate intensities in the range of 3–7 kg CO2-eq m−3, while multi-stage flash (MSF) technologies report considerably higher values, typically 8–15 kg CO2-eq m−3, depending on plant scale and energy source. In contrast, the Solar Still evaluated in this study exhibits an embodied cradle-to-grave climate intensity of 25.21 kg CO2-eq m−3. While this value lies above the operational intensities of RO and MSF, it reflects a fundamentally different emissions boundary: the Solar Still incurs almost no operational emissions, as water production is driven entirely by passive solar energy with no external electricity or thermal input.

Figure 5: Comparative carbon intensity of desalination technologies.
Consequently, when considered in remote, off-grid, or fuel-constrained contexts, the Solar Still offers a distinct decarbonization pathway. Its total life-cycle carbon burden is fixed upfront, and unlike RO and MSF does not scale with throughput, grid carbon intensity, or energy price volatility. Over an extended service life, this results in a stable, low-maintenance, and emission-free operational profile, positioning the NEPCM-enhanced Solar Still as a viable complementary technology for sustainable small-scale desalination.
To determine the environmental justification of integrating thermal storage materials, a comparative scenario analysis was conducted across three system configurations of the same still: Base Still (no PCM), PCM-only Still, and the Still with NEPCM added. The result of this analysis is presented in Fig. 6 which reveals the trade-off between embodied carbon intensity and lifetime distillate productivity.

Figure 6: Comparative life-cycle performance of base, PCM-only, and NEPCM-enhanced solar stills.
The Base Still had the lowest carbon intensity due to minimal material use, but it also had the lowest productivity (45% less water) which makes it less desirable. The PCM-only variant exhibits the highest carbon intensity (28.75 kg CO2-eq m−3), indicating that the yield gains from plain paraffin wax are insufficient to offset its embodied emissions. Adding Alumina nanoparticles increases the total manufacturing emissions of the Still. However, the nanoparticles significantly improved the thermal conductivity and storage of the wax, leading to a massive increase in Lifetime Water Yield, thereby lowering the carbon intensity to 25.21 kg CO2-eq m−3. In context, the output of one NEPCM Still is equivalent to approximately two Base Stills, which would double the land area required. Therefore, the NEPCM Still represents the optimal configuration for users requiring nocturnal production, as it mitigates the environmental penalty of the PCM by approximately 12% compared to the non-enhanced alternative. Furthermore, it is most suitable for space-constrained and high-demand applications.
4.2 Sensitivity Analysis: The Influence of System Lifespan (5 Years, 10 Years vs. 15 Years)
Given that the environmental impact of the NEPCM solar still is entirely embodied in its manufacturing phase, the functional lifespan of the system serves as the most critical determinant of its sustainability profile. A sensitivity analysis was conducted to evaluate how variations in operational longevity affect the normalized Global Warming Potential (GWP).
The results indicate a hyperbolic decay in carbon intensity as the lifespan extends as seen in Fig. 7. When the operational life was reduced to 5 years, the impact of premature failure or severe weather damage doubled the carbon intensity to 50.42 kg CO2-eq m−3, making the system environmentally uncompetitive compared to conventional desalination. Conversely, extending the lifespan to 15 years through durable material selection (e.g., galvanized steel, marine plywood) reduces the intensity to 16.81 kg CO2-eq m−3, a 33% reduction from the baseline. This finding underscores that mechanical durability and maintenance are not merely economic factors but are central to the environmental viability of passive solar desalination systems.

Figure 7: Effect of lifespan on carbon intensity.
4.3 Optimization of Nanoparticle Concentration (0–5 wt.%)
To validate the selection of a 3 wt.% nanoparticle concentration, a sensitivity analysis was performed across a range of loading fractions (0–5 wt.%). The alumina concentration for each scenario in the analysis is given in Table 4. The results, presented in Fig. 8, reveal a non-linear optimization curve.


Figure 8: Optimization of nanoparticle concentration.
The PCM-only variant (0 wt.%) exhibited a high carbon intensity of 28.75 kg CO2-eq m−3, which indicates that without the thermal enhancement of nanoparticles, the paraffin wax is an environmentally inefficient storage medium. The introduction of 1 wt.% Al2O3 drastically improved performance, lowering the intensity to the theoretical minimum of 23.14 kg CO2-eq m−3 as seen in Fig. 8.
However, the 3 wt.% design (25.21 kg CO2-eq m−3) was selected as the optimal configuration. While slightly more carbon-intensive than the 1 wt.% case, it provides a higher total distillate yield (13.38 m3), maximizing the utility of the fixed structural components (glass/steel). Conversely, increasing the concentration to 5 wt.% resulted in a sharp penalty, driving intensity up to 31.39 kg CO2-eq m−3. This aligns with findings by Samara et al. [48], who noted that higher concentrations lead to particle agglomeration and reduced latent heat capacity, thereby degrading system efficiency despite higher material costs.
This study conducted a cradle-to-grave Life Cycle Assessment (LCA) of a nano-enhanced, double-effect single-slope Solar Still fabricated in Nigeria to quantify its embodied environmental impacts and identify key design hotspots. The analysis, carried out in openLCA using the IMPACT World+ (v1.29) method and the OzLCI (2019) database, provides one of the first comprehensive assessments of a passive solar distillation system integrating Nano-Enhanced Phase Change Material (NEPCM) storage.
The total Global Warming Potential (GWP100) associated with producing one Still was approximately 337.3 kg CO2-eq, corresponding to a normalized carbon intensity of 25.21 kg CO2-eq m−3 of freshwater over its ten-year lifetime and a total yield of 13.38 m3. Although the system operates without external energy input, the results reveal that its environmental footprint is materials-dominated, driven largely by the manufacturing and end-of-life treatment of its components.
Hotspot analysis showed that Al2O3 nanoparticles (31.5%), paraffin wax PCM (22%), and structural steel and glass (19% and 13%) together contribute more than 85% of the total embodied carbon. In contrast, transport, PVC fittings, and other minor inputs had negligible influence (<3%). These findings confirm that the overall sustainability of Solar Stills is determined primarily by the choice and quantity of construction materials, rather than by operational factors.
The results highlight that material selection, particularly the choice of PCM and nanomaterials, exerts a dominant influence on total embodied impacts. Substituting high-impact Al2O3 nanoparticles with bio-derived or lower-energy synthesis routes could significantly improve environmental performance. Similarly, increasing yield through geometric optimization or reflective coatings can proportionally reduce the GWP intensity. Recycling of metals and glass at end-of-life presents another low-cost mitigation route. Overall, this LCA demonstrates that the carbon intensity of passive solar distillation can be maintained within the range of active desalination systems while eliminating operational energy demand.
When benchmarked against industrial desalination technologies, the NEPCM-integrated still’s carbon intensity lies above grid-powered reverse osmosis (1.8–3.6 kg CO2-eq m−3) and within the upper range of multi-stage flash distillation (9–25 kg CO2-eq m−3). However, unlike these energy-intensive systems, the passive Still operates solely on solar radiation, yielding zero operational emissions and offering an attractive low-maintenance solution for decentralized or off-grid communities.
From a design perspective, the study underscores the need to:
i. Reduce nanomaterial content or adopt lower-impact synthesis routes for Al2O3.
ii. Explore bio-based or recyclable PCMs as substitutes for petroleum-derived paraffins.
iii. Employ recyclable alloys and modular construction for end-of-life recovery; and
iv. Increase Still productivity through geometric and thermal optimization to dilute embodied impacts over greater water output.
The hybrid LCI approach adopted—integrating literature-based nanomaterial inventories with standard LCA datasets—proved effective for capturing the environmental significance of advanced materials absent from conventional databases. This methodology can serve as a template for future sustainability assessments of nanomaterial-enhanced renewable energy systems.
In conclusion, while the present NEPCM-integrated Solar Still demonstrates a moderate embodied carbon footprint relative to its operational benefits, its environmental performance can be markedly improved through informed material selection, recycling strategies, and performance scaling. The findings provide an evidence base for guiding eco-design, local manufacturing, and policy decisions aimed at achieving sustainable water production in resource-constrained and solar-rich regions.
Several assumptions and limitations were defined to maintain model simplicity and transparency. Minor components, including sealants, gaskets, fasteners, and coatings, were excluded from the inventory, as their small mass fractions (<1%) were assumed to contribute negligibly to the overall impacts. Insulation was considered an embedded component of the plywood structural layer. The baseline scenario assumes all materials are landfilled. Furthermore, while cleaning water and brine disposal are discussed qualitatively, they are excluded from quantitative assessment. This is justified by the operational model, which assumes brine evaporates naturally within the basin, consistent with passive Solar Still operation.
Acknowledgement: Not applicable.
Funding Statement: The authors received no specific funding for this study.
Author Contributions: The authors confirm contribution to the paper as follows: conceptualization, Obinna I. Anyanwu and Princewill Ikpeka; methodology, Emmanuel Anyanwu; software, Princewill Ikpeka; validation, Obinna I. Anyanwu and Emmanuel Anyanwu; formal analysis, Obinna I. Anyanwu and Princewill Ikpeka; investigation, Obinna I. Anyanwu; resources, Obinna I. Anyanwu and Princewill Ikpeka; writing—original draft preparation, Obinna I. Anyanwu and Princewill Ikpeka; writing—review and editing, Obinna I. Anyanwu and Princewill Ikpeka; visualization, Obinna I. Anyanwu and Princewill Ikpeka; supervision, Emmanuel Anyanwu; project administration, Emmanuel Anyanwu. All authors reviewed and approved the final version of the manuscript.
Availability of Data and Materials: Not applicable.
Ethics Approval: Not applicable.
Conflicts of Interest: The authors declare no conflicts of interest.
Nomenclature
| LCI | Life Cyle Inventory |
| LCIA | Life-Cycle Impact Assessment |
| NEPCM | Nano-Enhanced Phase Change Material |
| PCM | Phase Change Material |
| GWP100 | Global Warming Potential (100-year) |
| OzLCI | Australian Life-Cycle Inventory |
| FSC | Forest Stewardship Council |
| PCR | Post-Consumer Recycled |
| PVC | Polyvinyl Chloride |
| RT48 | Paraffin wax (melting temperature ~48°C) |
References
1. Grassl H. Chapter 1.1 climate and oceans. In: Siedler G, Church J, Gould J, editors. International geophysics. Cambridge, MA, USA: Academic Press; 2001. p. 3–9. doi: 10.1016/s0074-6142(01)80108-x. [Google Scholar] [CrossRef]
2. U.S. Geological Survey, Water Science School. How much water is there on Earth? 2019 [cited 2026 Jan 1]. Available from: https://www.usgs.gov/water-science-school/science/how-much-water-there-earth. [Google Scholar]
3. Sharghi K. NASA scientific visualization studio. The Three Percent. 2014 [cited 2025 Nov 25]. Available from: https://svs.gsfc.nasa.gov/11595/. [Google Scholar]
4. Angeler DG, Allen CR, Birgé HE, Drakare S, McKie BG, Johnson RK. Assessing and managing freshwater ecosystems vulnerable to environmental change. Ambio. 2014;43(1):113–25. doi:10.1007/s13280-014-0566-z. [Google Scholar] [PubMed] [CrossRef]
5. UNESCO. The United Nations world water development report 2023: partnerships and cooperation for water. London, UK: United Nations Educational, Scientific and Cultural Organization; 2023. [Google Scholar]
6. Dhakal N, Salinas-Rodriguez SG, Hamdani J, Abushaban A, Sawalha H, Schippers JC, et al. Is desalination a solution to freshwater scarcity in developing countries? Membranes. 2022;12(4):381. doi:10.3390/membranes12040381. [Google Scholar] [PubMed] [CrossRef]
7. Gohil PP, Desai H, Kumar A, Kumar R. Current status and advancement in thermal and membrane-based hybrid seawater desalination technologies. Water. 2023;15(12):2274. doi:10.3390/w15122274. [Google Scholar] [CrossRef]
8. Basile A, Curcio E, Inamuddin. Current trends and future developments on (bio-) membranes: membrane desalination systems: the next generation. Amsterdam, The Netherlands: Elsevier; 2018. [Google Scholar]
9. Bin AM, Wahab RA, Salam MA, Gzara L, Moujdin IA. Desalination technologies, membrane distillation, and electrospinning, an overview. Heliyon. 2023;9(2):e12810. doi:10.1016/j.heliyon.2023.e12810. [Google Scholar] [PubMed] [CrossRef]
10. Panagopoulos A, Haralambous KJ, Loizidou M. Desalination brine disposal methods and treatment technologies—a review. Sci Total Environ. 2019;693(1):133545. doi:10.1016/j.scitotenv.2019.07.351. [Google Scholar] [PubMed] [CrossRef]
11. Schantz AB, Xiong B, Dees E, Moore DR, Yang X, Kumar M. Emerging investigators series: prospects and challenges for high-pressure reverse osmosis in minimizing concentrated waste streams. Environ Sci. 2018;4(7):894–908. [Google Scholar]
12. Valladares Linares R, Li Z, Yangali-Quintanilla V, Ghaffour N, Amy G, Leiknes T, et al. Life cycle cost of a hybrid forward osmosis—low pressure reverse osmosis system for seawater desalination and wastewater recovery. Water Res. 2016;88(2):225–34. doi:10.1016/j.watres.2015.10.017. [Google Scholar] [CrossRef]
13. Kesieme UK, Milne N, Aral H, Cheng CY, Duke M. Economic analysis of desalination technologies in the context of carbon pricing, and opportunities for membrane distillation. Desalination. 2013;323(1–3):66–74. doi:10.1016/j.desal.2013.03.033. [Google Scholar] [CrossRef]
14. Deyab MA. Enhancement of corrosion resistance in MSF desalination plants during acid cleaning operation by cationic surfactant. Desalination. 2019;456:32–7. doi:10.1016/j.desal.2019.01.018. [Google Scholar] [CrossRef]
15. Filippini G, Al-Obaidi MA, Manenti F, Mujtaba IM. Performance analysis of hybrid system of multi effect distillation and reverse osmosis for seawater desalination via modelling and simulation. Desalination. 2018;448(4):21–35. doi:10.1016/j.desal.2018.09.010. [Google Scholar] [CrossRef]
16. Ihm S, Al-Najdi OY, Hamed OA, Jun G, Chung H. Energy cost comparison between MSF, MED and SWRO: case studies for dual purpose plants. Desalination. 2016;397:116–25. doi:10.1016/j.desal.2016.06.029. [Google Scholar] [CrossRef]
17. Ohunakin OS, Adaramola MS, Oyewola OM, Matthew OJ, Fagbenle RO. The effect of climate change on solar radiation in Nigeria. Sol Energy. 2015;116(8):272–86. doi:10.1016/j.solener.2015.03.027. [Google Scholar] [CrossRef]
18. Al-Harahsheh M, Abu-Arabi M, Ahmad M, Mousa H. Self-powered solar desalination using solar still enhanced by external solar collector and phase change material. Appl Therm Eng. 2022;206:1030–40. [Google Scholar]
19. Chaichan MT, Kazem HA. Single slope solar distillator productivity improvement using phase change material and Al2O3 nanoparticle. Sol Energy. 2018;164(5):370–81. doi:10.1016/j.solener.2018.02.049. [Google Scholar] [CrossRef]
20. Dashtban M, Tabrizi FF. Thermal analysis of a weir-type cascade solar still integrated with PCM storage. Desalination. 2011;279(1–3):415–22. doi:10.1016/j.desal.2011.06.044. [Google Scholar] [CrossRef]
21. Deore K, Salunke NP, Pawar SB. Phase change materials (PCMs) in solar still—a review of use to improve productivity of still. Mater Today Proc. 2023;102:186–93. doi:10.1016/j.matpr.2023.04.499. [Google Scholar] [CrossRef]
22. Kabeel AE, Abdelgaied M. Improving the performance of solar still by using PCM as a thermal storage medium under Egyptian conditions. Desalination. 2016;383(10):22–8. doi:10.1016/j.desal.2016.01.006. [Google Scholar] [CrossRef]
23. Arunkumar T, Denkenberger D, Ahsan A, Jayaprakash R. The augmentation of distillate yield by using concentrator coupled solar still with phase change material. Desalination. 2013;314:189–92. doi:10.1016/j.desal.2013.01.018. [Google Scholar] [CrossRef]
24. Behura A, Gupta HK. Use of nanoparticle-embedded phase change material in solar still for productivity enhancement. Mater Today Proc. 2021;45:3904–7. doi:10.1016/j.matpr.2020.06.285. [Google Scholar] [CrossRef]
25. Shoeibi S, Kargarsharifabad H, Rahbar N. Effects of nano-enhanced phase change material and nano-coated on the performance of solar stills. J Energy Storage. 2021;42:103061. doi:10.1016/j.est.2021.103061. [Google Scholar] [CrossRef]
26. Dsilva Winfred Rufuss D, Suganthi L, Iniyan S, Davies PA. Effects of nanoparticle-enhanced phase change material (NPCM) on solar still productivity. J Clean Prod. 2018;192:9–29. [Google Scholar]
27. Nazari S, Bahiraei M, Moayedi H, Safarzadeh H. A proper model to predict energy efficiency, exergy efficiency, and water productivity of a solar still via optimized neural network. J Clean Prod. 2020;277(1):123232. doi:10.1016/j.jclepro.2020.123232. [Google Scholar] [CrossRef]
28. Safaei MR, Goshayeshi HR, Chaer I. Solar still efficiency enhancement by using graphene oxide/paraffin nano-PCM. 2019 [cited 2024 Jul 8]. Available from: www.mdpi.com/journal/energies. [Google Scholar]
29. ISO 14040. Environmental management—life cycle assessment—principles and framework. Geneva, Switzerland: International Organization for Standardization (ISO); 2006. [Google Scholar]
30. Portillo F, Alcayde A, Garcia RM, Fernandez-Ros M, Gazquez JA, Novas N. Life cycle assessment in renewable energy: solar and wind perspectives. Environments. 2024;11(7):147. doi:10.20944/preprints202405.0148.v1. [Google Scholar] [CrossRef]
31. Nwosu EC, Nsofor K, Nwaji GN, Ononogbo C, Ofong I, Ogueke NV, et al. Extended experimental investigation of a double-effect active solar still with a paraffin wax, in Owerri. Nigeria J Therm Eng. 2023;9(5):1189–207. doi:10.18186/thermal.1374686. [Google Scholar] [CrossRef]
32. Nwosu EC, Nwaji GN, Ononogbo C, Ofong I, Ogueke NV, Anyanwu EE. Effects of water thickness and glazing slope on the performance of a double-effect solar still. Sci Afr. 2023;21(265):e01777. doi:10.1016/j.sciaf.2023.e01777. [Google Scholar] [CrossRef]
33. Gavankar S, Suh S, Keller AA. The role of scale and technology maturity in life cycle assessment of emerging technologies: a case study on carbon nanotubes. J Ind Ecol. 2015;19(1):51–60. doi:10.1111/jiec.12175. [Google Scholar] [CrossRef]
34. Barberio G, Scalbi S, Buttol P, Masoni P, Righi S. Combining life cycle assessment and qualitative risk assessment: the case study of alumina nanofluid production. Sci Total Environ. 2014;496(3):122–31. doi:10.1016/j.scitotenv.2014.06.135. [Google Scholar] [PubMed] [CrossRef]
35. Kaviti AK, Yadav A, Shukla A. Inclined solar still designs: a review. Renew Sustain Energy Rev. 2016;54(1–4):429–51. doi:10.1016/j.rser.2015.10.027. [Google Scholar] [CrossRef]
36. Conserva VR, Silva CB, Ramirez RC, da Silva KS, de Medeiros KM, de Lima CAP. Influence of the wind generator and thermal electrical modules in the solar still in the continuous production of fresh water. ACS ES and T Water. 2024;4(11):5039–52. doi:10.1021/acsestwater.4c00636. [Google Scholar] [CrossRef]
37. Prakash O, Ahmad A, Kumar A, Chatterjee R, Chattopadhyaya S, Sharma S, et al. Performance analysis, and economic-feasibility evaluation of single-slope single-basin domestic solar still under different water-depths. Energies. 2022;15(22):8517. [Google Scholar]
38. Vigneswaran VS, Kumar PG, Sakthivadivel D, Balaji K, Meikandan M, Dinakar BV, et al. Energy, exergy, and economic analysis of low thermal conductivity basin solar still integrated with phase change material for energy storage. J Energy Storage. 2021;34(1–3):102194. doi:10.1016/j.est.2020.102194. [Google Scholar] [CrossRef]
39. Saeed MMA, Hachim DM, Hameed HG. Numerical investigation for single slope solar still performance with optimal amount of nano-PCM. J Adv Res Fluid Mech Therm Sci. 2019;63(2):302–16. [Google Scholar]
40. Shoeibi S, Kargarsharifabad H, Mirjalily SAA, Sadi M, Arabkoohsar A. A comprehensive review of nano-enhanced phase change materials on solar energy applications. J Energy Storage. 2022;50(2):104262. doi:10.1016/j.est.2022.104262. [Google Scholar] [CrossRef]
41. Kabeel AE, Omara ZM, Essa FA. Improving the performance of solar still by using nanofluids and providing vacuum. Energy Convers Manag. 2014;86(2):268–74. doi:10.1016/j.enconman.2014.05.050. [Google Scholar] [CrossRef]
42. Jijakli K, Arafat H, Kennedy S, Mande P, Theeyattuparampil VV. How green solar desalination really is? Environmental assessment using life-cycle analysis (LCA) approach. Desalination. 2012;287:123–31. [Google Scholar]
43. Environmental Balance Company. Greenhouse gas emission estimation and carbon footprint assessment report, Rabigh-3-IWP (SWRO desalination plant). Report. 2025 May [cited 2026 Jan 1]. Available from: https://acwapower.com/media/hmmb4mxp/rabigh-3-iwp-greenhouse-gas-and-carbon-footprint-assessment.pdf. [Google Scholar]
44. Bordbar B, Khosravi A, Orkomi AA, Peydayesh M. Life cycle assessment of hybrid nanofiltration desalination plants in the persian gulf. Membranes. 2022;12(5):467. doi:10.3390/membranes12050467. [Google Scholar] [PubMed] [CrossRef]
45. Leon F, Ramos-Martin A, Perez-Baez SO. Study of the ecological footprint and carbon footprint in a reverse osmosis sea water desalination plant. Membranes. 2021;11(6):377. doi:10.3390/membranes11060377. [Google Scholar] [PubMed] [CrossRef]
46. Fayyaz S, Khadem Masjedi S, Kazemi A, Khaki E, Moeinaddini M, Irving Olsen S. Life cycle assessment of reverse osmosis for high-salinity seawater desalination process: potable and industrial water production. J Clean Prod. 2023;382:135299. doi:10.1016/j.jclepro.2022.135299. [Google Scholar] [CrossRef]
47. Do Thi HT, Tóth AJ. Investigation of carbon footprints of three desalination technologies: reverse osmosis (ROmulti-stage flash distillation (MSF) and multi-effect distillation (MED). Period Polytech Chem Eng. 2023;67(1):41–8. doi:10.3311/PPch.20901. [Google Scholar] [CrossRef]
48. Samara H, Hamdan M, Al-Oran O. Effect of Al2O3 nanoparticles addition on the thermal characteristics of paraffin wax. Int J Thermofluids. 2024;22(11):100623. doi:10.1016/j.ijft.2024.100623. [Google Scholar] [CrossRef]
Cite This Article
 Copyright © 2026 The Author(s). Published by Tech Science Press.
This work is licensed under a Creative Commons Attribution 4.0 International License , which permits unrestricted use, distribution, and reproduction in any medium, provided the original work is properly cited.
 Downloads
 Citation Tools
