
 Login
Login Register
 Submit a Paper
 Propose a Special lssue
 Open Access
ARTICLE

Analyze the Impact of Weather on Rooftop Solar Power Generation by Applying Ensemble Learning: Lessons from Kurunegala, Sri Lanka
1 Department of Electronics, Faculty of Applied Sciences, Wayamba University of Sri Lanka, Kuliyapitiya, Sri Lanka
2 Department of Electrical Engineering, University of Malaya, Kuala Lumpur, Malaysia
3 Faculty of Engineering and Design, Atlantic Technological University, Sligo, Ireland
* Corresponding Author: Upaka Rathnayake. Email:
(This article belongs to the Special Issue: Artificial Intelligence Applications in Renewable Energy Forecasting: Methods, Challenges, and Future Directions)
Energy Engineering 2026, 123(9), 23 https://doi.org/10.32604/ee.2026.085002
Received 03 May 2026; Accepted 09 June 2026; Issue published 06 August 2026
 View Full Text
 Download PDF
Abstract
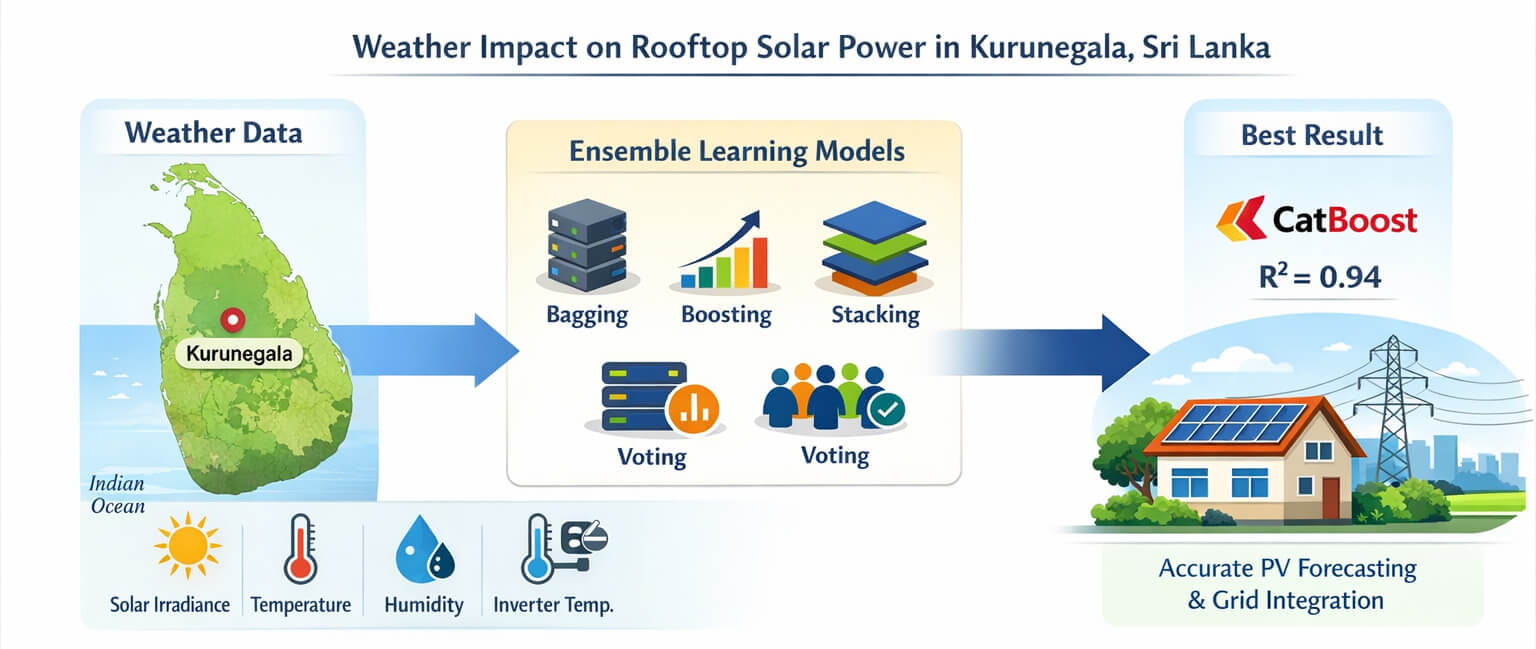
Rooftop solar photovoltaic (PV) systems operate under weather conditions that differ significantly from Standard Test Conditions (STC), particularly in tropical regions. This study examines the impact of climatic factors on rooftop PV power generation in the Kurunegala district of Sri Lanka using measured power output and meteorological data. Three grid-connected PV systems with a capacity of 5 kW were monitored over six months, with hourly power output and inverter temperature recorded during the daytime. Corresponding weather data, including solar irradiance, ambient temperature, relative humidity, and cloud cover, were used in this research to identify their impact on power generation. In addition, monthly power generation data over 30 months were analyzed to assess seasonal trends. The results confirm that solar irradiance is the primary driver of PV power generation, while ambient temperature, inverter temperature, and relative humidity have notable secondary effects. Several deep learning and conventional machine learning techniques were applied to develop power prediction models based on the corresponding weather conditions. In addition to individual training, the models were trained using ensemble techniques of bagging, boosting, stacking, and voting. A comparative assessment of the model performance shows that ensemble learning approaches outperform individual machine learning techniques for limited, high-quality datasets. The CatBoost model that was trained using the ensemble technique of boosting achieved the highest predictive accuracy, with the highest coefficient of determination (R2 = 0.94) and the lowest Mean Squared Error (MSE = 0.09). The developed models effectively capture diurnal and short-term variations, demonstrating strong potential for reliable rooftop PV forecasting and grid integration in tropical climates.Graphic Abstract
Keywords
The performance of solar photovoltaic (PV) systems is defined based on Standard Test Conditions (STC) [1,2]. The STC for a PV solar system is defined as being 1000 W/m2 of full solar irradiance when the panel and cells are at a standard ambient temperature of 25°C with a sea level air mass. However, the actual condition of the rooftop solar systems in Sri Lanka is considerably different from the STC [3]. Solar PV systems are highly sensitive to changes in operating conditions, particularly when there are deviations from the nominal operating cell temperature [4,5]. Factors such as temperature, humidity, solar irradiance, cloud cover, and other environmental variables directly influence the efficiency and energy output of these panels. Particularly, temperature increases can lead to thermal losses, while humidity and other atmospheric elements may cause voltage drops, reducing the overall power generation.
The regression analysis done by Al–Bashir et al. [6] showed that the solar irradiance has a coefficient of determination of 96.5% with solar power generation, thus indicating that it is the most dominant factor, as expected. In addition, a study conducted by Iqbal et al. [7] explores the difference between real-time measured and theoretically calculated temperature values using weather data to assess the impact of temperature differences on the power loss of PV systems. Results showed that power losses for PV systems installed at different locations were significant, highlighting the influence of installation location. Furthermore, an experimental investigation to examine how three factors, installation height, roof type, and air velocity, affect the performance of photovoltaic panels in Colombia was presented by Osma-Pinto & Ordóñez-Plata [8]. Rinchi et al. [9] proposed a computationally efficient stacked ensemble model for predicting daily photovoltaic energy generation. It combined the strengths of five machine learning techniques and was compared with Bayesian optimization and equal-weighted ensemble methods in terms of prediction accuracy and computational efficiency. The results indicate that the Differential Evolution-based ensemble achieves superior performance with lower computational complexity.
Touati et al. [10] examined the sensitivity of PV systems to environmental factors such as dust, temperature, and relative humidity in Qatar’s desert climate. It was found that dust accumulation significantly reduces the performance, more so than temperature or humidity. Nezamisavojbolaghi et al. [11], Almukhtar et al. [12] and Vedulla et al. [13] support these findings from Touati et al. [10]. Gordo et al. [14] collected data on solar power production efficiency, assessing the effects of four specific factors: cloud cover, sun intensity, heat buildup, and relative humidity. They kept all other variables constant to isolate their individual effects on the efficiency of each type of solar panel mounting. Though this controlled approach ensures that the influence of each factor is accurately measured without interference from the others, the setup is different from the real-world scenario.
While there has been substantial research analyzing the impact of weather on solar power generation across different regions of the world, no specific study has been conducted in the Sri Lankan context to comprehensively examine these influences based on measured data. Though Amarasinghe & Abeygunawardane [15] performed case studies to forecast solar power generation of Buruthakanda solar park in Hambantota using machine learning, the analysis was limited to three different weather conditions namely, clear (sunny), partly cloudy, and overcast (cloudy). Nevertheless, Sri Lanka has explored the significant potential of generating renewable energy through solar PVs, including large-scale solar farms and rooftop solar systems at individual households [16,17].
However, there are ongoing challenges in operating a ring-type power grid in Sri Lanka due to the variability of renewable energy generation, particularly rooftop solar PV. During periods of low electricity demand, high solar penetration can create grid stability issues [18]. As a result, the power utility, namely the Ceylon Electricity Board (CEB), Sri Lanka has, at times, required small-scale (micro) solar PV systems to curtail or temporarily disconnect generation in order to maintain the balance between supply and demand. Despite these operational challenges, household demand for rooftop solar PV systems remains high, primarily due to the comparatively high cost of grid electricity and the potential for long-term cost savings. Therefore, there is an essential need for predicting solar power generation holistically but at different scales and different areas of the country, in seeking sustainable solutions for not only reaching renewable energy targets but also to balance the existing grid energy. Therefore, this paper aims to identify the key climatic parameters that affect the performance of rooftop solar panels installed in Sri Lanka. Measured power generation data and weather records of the Kurunegala region in the Northwestern Province were used to assess the panels’ response to Sri Lankan weather conditions.
It is important to employ state-of-the-art methods to obtain valid and accurate findings from solar power prediction because it is a complex process due to high dependence on climate conditions, which fluctuate over time. Wu et al. [19] and Tsai et al. [20] have presented that many researchers have paid attention to machine learning methods in the field of forecasting solar power generation. However, the techniques are yet to be explored in the Sri Lankan context. Therefore, eleven conventional machine learning and deep learning models were applied in this research for the prediction of power generation as the first ever comprehensive study in the context of Sri Lanka. Section 2 presents the study area and the data collected for this research, ensemble learning methods used for modelling data, and the methodology followed. Section 3 describes the research findings in terms of the correlation analysis, performance of each individual model, and performance of ensemble models. Moreover, the major research outcomes are discussed. Finally, the conclusions are briefed in Section 4.
2.1 Study Area and Data Collection
Three solar power plants with a capacity of 5 kW, which are located in the Kurunegala district, Sri Lanka, were considered for this research (refer to Fig. 1a). In all the plants, rooftop Grid-Tied Half-Cell Multi-Busbar Solar Panels were mounted. Each plant comprises 10 solar panels connected in two strings. The solar PV panels have a rated maximum power of 560 W and a module efficiency of 21.7%. The grid-connected PV inverter has a maximum input DC voltage of 600 V and a maximum input DC current of 15 A. Its output rated AC voltage is 220/230 V, output rated AC power is 5 kW, and output rated frequency is 50/60 Hz.


Figure 1: Study area (a) Kurunegala district in Sri Lanka (b) Variation of solar irradiance (c) Variation of hourly power generation (d) Variation of ambient temperature and inverter temperature (e) Monthly power generation.
Technical information of the solar plants, power generation data, and inverter temperature data were collected directly from three solar power plants, capturing variations during daytime (6.00 a.m. to 6.00 p.m.) and under different weather conditions. Power output and inverter temperature readings were extracted at one-hour intervals from the online portal connected to the inverters of the power plants. The key climatic parameters collected include solar irradiance, ambient temperature, relative humidity, and the extent of cloud cover. Hourly weather data over the same duration as the power generation data were purchased from the Department of Meteorology, Sri Lanka. However, the department measures cloud cover data at 3-h intervals. This data was collected over a period of 6 months. In addition, monthly power generation was obtained for 30 months to understand the seasonal variation and for visualization purposes.
The solar irradiance during the day follows the typical diurnal solar irradiance pattern in tropical regions like Sri Lanka (refer to Fig. 1b). Solar irradiance increases rapidly after sunrise due to the rising solar elevation angle and reaches progressively higher values as the sun moves toward its zenith. The irradiance peaks between 11 a.m. and 1 p.m., which corresponds to the period when the sun is almost directly overhead. Sri Lanka, being located close to the equator, receives high-intensity solar radiation during midday due to shorter atmospheric path length and minimal seasonal tilt effects. After solar noon, irradiance begins to decline steadily as the sun’s elevation decreases, resulting in a reduction in energy reaching the surface. This smooth decline reflects the decreasing angle of incidence, increased atmospheric scattering, and longer path through the atmosphere in the late afternoon. The effects can be clearly seen in Fig. 1b.
The hourly power generation closely follows the typical diurnal pattern of solar irradiance (refer to Fig. 1c). The generation increases steadily from morning to midday as irradiance rises, peaking around solar noon when sunlight intensity is highest. Matching the period of peak solar irradiance, when the Sun is nearly overhead, the PV modules receive maximum energy with minimal atmospheric scattering. After midday, power generation declines gradually. Ambient temperature rises from early morning to a midday peak and then falls toward evening (refer to Fig. 1d). The inverter temperature increases more steeply during the morning, reaches a peak in the early afternoon, and then declines in the late afternoon. The inverter temperature is driven by two main factors: ambient temperature and internal heat generation from electrical losses that scale with power throughput. As solar irradiance and PV output increase toward midday, inverter electrical loading and associated losses increase, producing a rapid internal temperature rise well above ambient. As a result, inverter temperature has a larger amplitude than ambient and peaks slightly after or near the irradiance power peak.
Average monthly power generation over the past few years is shown in Fig. 1e. The monthly average power generation data shows a clear seasonal pattern influenced primarily by variations in solar irradiance and weather conditions. The highest energy outputs are recorded from February to March and again in September, corresponding to periods of higher solar insolation and relatively clear atmospheric conditions. In contrast, November and January show the lowest generation values. These reductions can be attributed to decreased solar intensity and higher cloudiness during the monsoon and transition periods. Mid-year months (April–August) show moderate production, influenced by reduced irradiance during the southwest monsoon. Overall, the data demonstrate that solar power generation is highly sensitive to seasonal climatic variations and atmospheric conditions.
The descriptive statistics of the dependent and independent variables are summarized in Table 1. The mean and median of power generation are close, indicating a fairly balanced distribution. Power generation ranges from 0.1 to 4.1 kW, with the standard deviation suggesting moderate variability. Most output occurs in the lower to mid ranges (<3.6 MW), while higher levels close to the plant’s full capacity are rare. Ambient temperature varies between 23.0°C and 34.1°C and shows a fairly symmetric distribution. Most temperatures fall between 26°C and 32°C, with 30°C–32°C being the most common range. Inverter temperatures are relatively consistent but show higher variability than ambient temperatures, ranging from 38.3°C to 67.7°C. Extreme values below 41°C or above 59°C are uncommon. Humidity has a generally balanced distribution between 52% and 96%, though it shows noticeable variability. Solar irradiance, in contrast, fluctuates widely and is highly variable, while values above 800 W/m2 are rare. For all variables, 50% of observations fall between the first and third quartiles, reflecting the central spread of the data.

Ensemble learning has been popularized among researchers due to its prediction accuracy over traditional regression models [21–23]. Ensemble learning refers to a machine learning technique where multiple base learners are trained and their output is combined, to solve the same problem. The fundamental idea is that the aggregate output of the base learners should exhibit higher accuracy compared to any individual learner. Numerous theoretical and empirical studies have demonstrated that ensemble learning outperforms individual models. Base learners can be any pre-trained machine learning models [24]. There are two types of ensembles, those that use a single algorithm to produce homogeneous base learners or a combination of multiple algorithms to produce heterogeneous learners [21]. The following ensemble methods, which have been widely used in the literature, are applied in this research.
2.2.1 Bagging (Bootstrapped Aggregation)
Bagging is an ensemble learning strategy in machine learning designed to enhance the stability and accuracy of a model by joining the outcomes of several instances of the same base algorithm, each trained on distinct randomly picked subsets of the training data (refer to Fig. 2a). Bagging reduces model variance by averaging predictions from multiple instances, hence decreases the chance of overfitting to the training data [25]. Researchers often use bagging when working with decision trees, although it can be applied to any base learning method. Among the most popular bagging algorithms is the Random Forest, which extends the aforementioned concept by building multiple decision trees and aggregating their predictions. However, the success of Bagging prediction will rely heavily on the quality and size of the training data as well as the choice of the base algorithm [26,27].

Figure 2: Ensemble learning frameworks (a) Bagging (b) Boosting (c) Stacking (d) Voting.
Boosting algorithms iteratively combine weak learners into a strong learner by emphasizing previously misclassified samples and assigning weights to the training instances. During boosting, the original dataset is partitioned into several subgroups (refer to Fig. 2b). The subset is used to train the classifier, which results in a sequence of models with modest performance [28]. The elements that were incorrectly categorized by the prior model are used to build new subsets. The ensembling procedure then improves its performance by integrating the weak models using a cost function. It explained that, unlike bagging, each model functions independently before aggregating the inputs, with no model selection at the end. Boosting is a method of consecutively placing multiple weak pupils flexibly. Intuitively, the new model focuses on the discoveries that are the most difficult to match up until now, resulting in a good learner with less bias at the end of the process [29]. Boosting can be used to solve regression and identification problems, such as bagging. Popular boosting algorithms include AdaBoost, Gradient Boosting, CatBoost, and XGBoost [23,30].
Stacking is a machine learning ensemble technique that combines the prediction results of multiple models to increase the overall accuracy of a single prediction (refer to Fig. 2c) [31,32]. When comparing with bagging and boosting, stacking trains a meta-model that uses the predictions of multiple base models as its input features to generate the final prediction [33]. The idea behind stacking is to combine the strengths of multiple base models to produce a more accurate prediction. Any machine learning algorithm can be trained as the base model. The key point of stacking is to select the meta-model carefully to leverage the base models’ predictions effectively [34,35].
Voting is a broader concept in ensemble learning where multiple models (classifiers or regressors) are first trained individually. (refer to Fig. 2d) [36,37]. The final prediction is made by summing the expected probabilities across all models and choosing the class with the highest average probability [38]. Weighted voting allows multiple models to have different influences on the final forecast, which can be assigned manually or learned automatically based on the performance of the individual models. Because of this diversity, different models can affect the final prediction differently. Therefore, voting increases overall performance and robustness, especially when distinct models have diverse properties and generate independent predictions [39]. Voting can overcome biases or limits in a single model and produce more accurate and trustworthy predictions by using the collective decision-making of numerous models.
As the initial step, data was preprocessed. Data preprocessing involved the removal of records corresponding to missing power generation records caused by internet connectivity interruptions at the solar plants. As a result, a continuous and consistent dataset was constructed for analysis. As the second step, the input and output variables were tested for their Spearman correlation. In the third phase of the research, prediction models were developed. Power generation was considered the output variable, while environmental factors and inverter temperature served as input variables to develop the prediction formulation, as given in Eq. (1).
where,
The following assumptions and simplifications were used in developing this mathematical formulation. Solar irradiance, ambient temperature, inverter temperature, and relative humidity were considered the primary variables influencing solar power generation. In addition, panel degradation, shading effects from natural barriers like growing trees, dust accumulation, possible inverter faults and maintenance shutdowns were not considered in this research work and assumed to be relatively constant during the study period. Furthermore, the observed relationships were assumed to remain stable throughout the study period, enabling the development of predictive models from the available dataset.
The mathematical formulation presented in Eq. (1) was developed using deep learning and conventional machine learning algorithms to predict solar power generation based on a pre-processed dataset. These models are listed in Table 2. The complete dataset was split into training and testing subsets for modeling, with proportions of 80% and 20%, respectively.

The best performing models were selected based on the performance matrices, including the coefficient of determination (R2) and mean squared error (MSE). The best models were then used to develop ensemble models. Four ensemble learning models, namely, bagging, boosting, stacking, and voting, were developed in this research. Random Forest was used in bagging, while CatBoost was used in boosting. Linear Regression, Lasso Regression, Ridge Regression, Bayesian Ridge Regression, Random Forest, and CatBoost were used in stacking and voting techniques.
All machine learning algorithms were implemented using Python v3.11 within the Google Colab environment, running on Ubuntu 22.04.4 LTS. Model development and performance evaluation were conducted using the scikit-learn (v1.6.1) library. GridSearchCV and RandomizedSearchCV were used for hyperparameter tuning. Data manipulation and numerical operations were handled via Pandas (v2.2.2) and NumPy (v2.0.2), specifically for processing datasets in Comma-Separated Value (CSV) format.
Simpler models such as Linear Regression, Ridge Regression, Lasso Regression, Bayesian Ridge Regression, Decision Tree, and Power Regression exhibited comparatively low computational complexity and faster training and prediction times. Support Vector Machine (SVM) and Multilayer Perceptron (MLP) models required moderate computational power due to kernel operations and iterative optimization processes. Ensemble methods such as Random Forest, CatBoost, Stacking Regressor, and Voting Regressor demonstrated higher computational complexity because of multiple model training and hyperparameter tuning procedures. Long Short-Term Memory (LSTM) networks showed the highest computational complexity due to sequential learning, backpropagation through time, and large parameter optimization requirements. The overall methodology used in this research is illustrated in Fig. 3 as a flowchart.

Figure 3: Overall methodology.
The Spearman correlation matrix between each pair of input and output variables is shown in Fig. 4. Correlation values above 0.7 are considered highly correlated, while correlation values between 0.3 and 0.7 are considered slightly correlated, and correlation values between −0.3 and 0.3 are considered not significant. Correlation values between −0.3 and −0.7 indicate a considerable negative correlation, while those of less than −0.7 are considered highly negatively correlated.

Figure 4: Spearman correlation matrix.
Based on the findings, significant correlations were observed among five variable pairs: Power Generation vs. Solar Irradiance, Power Generation vs. Inverter Temperature, Power Generation vs. Ambient Temperature, Inverter Temperature vs. Ambient Temperature, and Solar Irradiance vs. Inverter Temperature. Humidity exhibited a highly negative correlation with Ambient Temperature and a notable negative correlation with Inverter Temperature, Power Generation, and Solar Irradiance. In contrast, Cloud cover showed no notable correlation with any other variable. As cloud cover data was available only in 3-h intervals, the use of that input parameter in modeling reduces the size of the dataset. In order to avoid that, cloud cover data was not used in modelling.
3.2 Individual Model Performance
Table 3 compares the performance of deep learning and conventional machine learning models in terms of the coefficient of determination and the mean squared error. The best performing models are Linear Regression, Lasso Regression, Ridge Regression, and Bayesian Ridge Regression, demonstrating R2 ≥ 0.91 and MSE ≤ 0.12.

3.3 Ensemble Model Performance
Table 4 compares the performance of the prediction models after incorporating ensemble techniques. The four best-performing models identified during individual training were combined using stacking with a linear regression meta-learner and a weighted voting regressor. In addition, Random Forest and CatBoost models were trained using the ensemble techniques of bagging and boosting, respectively. According to the results, all ensemble models achieved higher prediction accuracy than individually trained models presented in Table 3. The CatBoost model demonstrates the best overall performance with the highest coefficient of determination (R2 = 0.94) and the lowest Mean Squared Error (MSE = 0.09). The uncertainty analysis for the results indicates uncertainty of 0.02 for R2 and MSE in each ensemble learning model.

Fig. 5 visually displays the performance of the models for which ensemble learning has been applied. They present the predicted power generation against the actual power generation. All these plots show a strong linear relationship between the predicted and the actual power generation, clustering around the 1:1 reference line with minor deviations. The graphs indicate the capability of ensemble-based models in predicting power generation when the meteorological parameters are given.

Figure 5: Predicted vs. actual power generations for ensemble models (a) Bagging (b) Boosting (c) Stacking (d) Voting.
In order to prove the capability of the CatBoost model, a new set of data was used to predict the power generation. Fig. 6 presents the predicted power generation and actual power generation during the daytime over 4 days. The comparison clearly showcases the model’s capabilities in capturing temporal dynamics and the diurnal variation of power generation. This is extremely important for an accurate and reliable prediction model. More importantly, the predicted peak power generations almost match the peaks of actual generation. Similar observations are for the troughs of power generation. This strong alignment between the two series suggests that the model is reliable in predicting power generation patterns.

Figure 6: Temporal variation of power generation, predicted vs. actual.
The results showcased the dominant role of solar irradiance in determining rooftop solar power generation in the Kurunegala district, Sri Lanka. It is a well-known fact that Kurunegala has good sunshine hours throughout the year. Therefore, power generation via solar PV panels is reliable in the area. This finding is consistent with some of the previous studies conducted in similar regions of the world [6], and the model performance is comparable (Table 5). Inverter temperature and ambient temperature also exhibit notable positive correlations with power generation. The increase in inverter temperature reflects higher electrical loading and internal losses during periods of elevated power output, particularly around midday. While ambient temperature contributes indirectly by influencing module and inverter operating conditions, excessive temperatures may also lead to thermal derating and efficiency losses. This dual role of temperature is particularly relevant in tropical climates such as Sri Lanka, where elevated ambient temperatures persist throughout the year.

Further improvement to the prediction model can be performed even though the present CatBoost ensemble model achieved acceptable performance (R2 = 0.94; MSE = 0.09). Integration of metaheuristic techniques would be a promising approach. Techniques such as genetic algorithms, particle swarm optimization, etc., can be effectively used in future studies. They can optimize the model hyperparameters and feature selection process. Thus, the prediction errors can be reduced.
Importantly, the proposed research framework can be extended to a nationwide scale to assess solar power generation potential. Such data-driven approaches can support effective planning and optimal utilization of solar energy in meeting Sri Lanka’s daily electricity demand. By incorporating forecasted meteorological parameters, future solar power availability can be anticipated with greater accuracy. Currently, solar plant owners are occasionally instructed to disconnect their systems from the national grid during low-demand periods due to grid overloading. With reliable prediction mechanisms in place, renewable energy generation could be better prioritized, enabling a reduction in reliance on costly conventional power sources during such periods. This would enable a higher share of renewable energy in the energy mix, reduce expenditure, and prevent revenue losses for solar plant owners caused by forced shutdowns during periods of high irradiance. Overall, this work contributes to improved energy planning in a developing country characterized by uneven electricity demand across residential and industrial sectors, supporting Sri Lanka’s transition toward a more sustainable and resilient energy future.
Nevertheless, the findings of this study contribute directly to the achievement of Sustainable Development Goal 7 (Affordable and Clean Energy) by supporting more accurate and reliable prediction of rooftop solar power generation. Improved forecasting reduces uncertainty in system performance, encourages rooftop solar adoption, and enhances the effectiveness of net-metering schemes. Furthermore, the study aligns with Sustainable Development Goal 13 (Climate Action) by facilitating better integration of renewable energy sources into the power grid. Accurate solar power prediction supports climate-resilient energy planning and reduces reliance on fossil fuel-based backup generation, thereby contributing to greenhouse gas emission reduction in climate-vulnerable tropical regions such as Sri Lanka.
This study investigated the influence of environmental factors on rooftop solar power generation in the Kurunegala district of Sri Lanka using measured power output and meteorological data. The analysis confirmed that solar irradiance is the dominant factor governing PV power generation, while ambient temperature, inverter temperature, and relative humidity play significant secondary roles under tropical climatic conditions. A comprehensive comparison of deep learning and conventional machine learning models demonstrated that ensemble learning approaches outperform classical models when applied to limited, high-quality datasets. Among all the models, CatBoost, in which the boosting algorithm was applied, achieved the highest predictive accuracy, with a coefficient of determination of approximately 0.94 and the lowest MSE of 0.09.
All the models successfully captured diurnal and short-term temporal variations, highlighting their suitability for real-world rooftop solar forecasting and grid integration applications. Overall, this research demonstrates the potential of data-driven machine learning and ensemble approaches to improve rooftop solar power prediction in tropical regions, contributing to sustainable energy development and climate action initiatives at both national and regional scales. Despite these promising results, the study is limited to a single geographical region and a limited period of time. Future research should extend this framework to multiple climatic zones across Sri Lanka, incorporate longer-term datasets, and explore the integration of satellite-based cloud indices. The application of explainable artificial intelligence techniques could further enhance model transparency and support policy-level decision-making. Moreover, the possibility of improving model performance by incorporating metaheuristic algorithms will be explored.
Acknowledgement: The owners of the three solar power plants are thanked for providing access to power generation and inverter temperature data.
Funding Statement: Authors are thankful to the Wayamba University of Sri Lanka for funding this research through Wayamba University Research Grant 2024 (SRHDC/URG/2024/05).
Author Contributions: Jeevani Jayasinghe—Overall Coordination, Data Collection, Writing; Chee-Onn Chow—Supervise Ensemble Learning, Proofreading the Research Paper; Lasini Wickramasinghe—Applying Machine Learning, Writing, Formatting; Upaka Rathnayake—Structuring the Paper, Writing. All authors reviewed and approved the final version of the manuscript.
Availability of Data and Materials: Data and Material collected and processed by authors will be made available on reasonable request after the completion of the research.
Ethics Approval: Not applicable.
Conflicts of Interest: The authors declare no conflicts of interest.
References
1. Golive YR, Kottantharayil A, Vasi J, Shiradkar N. Determining the optimal standard test condition correction procedure for high-throughput field I–V measurements of photovoltaic modules. Prog Photovolt Res Appl. 2022;30(1):13–26. doi:10.1002/pip.3457. [Google Scholar] [CrossRef]
2. Huang X, Wang H, Yang Y, Chen Z, He F, Yang Q, et al. Effect of errors in STC maximum power on reliability evaluation and power warranty period determination of photovoltaic modules. Renew Energy. 2025;247(9):123063. doi:10.1016/j.renene.2025.123063. [Google Scholar] [CrossRef]
3. Lucas JR. Analysis of instantaneous, daily and monthly statistics 2017–2021 of rooftop solar energy. J Natl Sci Found. 2023;50(4):799. doi:10.4038/jnsfsr.v50i4.11079. [Google Scholar] [CrossRef]
4. Aslam A, Ahmed N, Qureshi SA, Assadi M, Ahmed N. Advances in solar PV systems; a comprehensive review of PV performance, influencing factors, and mitigation techniques. Energies. 2022;15(20):7595. doi:10.3390/en15207595. [Google Scholar] [CrossRef]
5. Kumar S, Subbarao PMV. An improved numerical model to predict the operating temperature and efficiency of solar photovoltaic systems. Environ Sci Pollut Res Int. 2025;32(22):13179–92. doi:10.1007/s11356-023-27650-6. [Google Scholar] [PubMed] [CrossRef]
6. Al-Bashir A, Al-Dweri M, Al-Ghandoor A, Hammad B, Al-Kouz W. Analysis of effects of solar irradiance, cell temperature and wind speed on photovoltaic systems performance. Int J Energy Econ Policy. 2020;10(1):353–9. doi:10.32479/ijeep.8591. [Google Scholar] [CrossRef]
7. Iqbal S, Khan SN, Sajid M, Khan J, Ayaz Y, Waqas A. Impact and performance efficiency analysis of grid-tied solar photovoltaic system based on installation site environmental factors. Energy Environ. 2023;34(7):2343–63. doi:10.1177/0958305x221106618. [Google Scholar] [CrossRef]
8. Osma-Pinto G, Ordóñez-Plata G. Measuring factors influencing performance of rooftop PV panels in warm tropical climates. Sol Energy. 2019;185(1):112–23. doi:10.1016/j.solener.2019.04.053. [Google Scholar] [CrossRef]
9. Rinchi B, Al-Dahidi S, Abdalla MEB, Ayadi O, Alrbai M. An evolutionary stacked ensemble for improving accuracy and computational efficiency in daily photovoltaic energy prediction. IEEE Access. 2026;14:28282–302. doi:10.1109/access.2026.3666442. [Google Scholar] [CrossRef]
10. Touati F, Al-Hitmi M, Bouchech H. Towards understanding the effects of climatic and environmental factors on solar PV performance in arid desert regions (Qatar) for various PV technologies. In: Proceedings of the 2012 First International Conference on Renewable Energies and Vehicular Technology; 2012 Mar 26–28; Nabeul, Tunisia. p. 78–83. doi:10.1109/revet.2012.6195252. [Google Scholar] [CrossRef]
11. Nezamisavojbolaghi M, Davodian E, Bouich A, Tlemçani M, Mesbahi O, Janeiro FM. The impact of dust deposition on PV panels’ efficiency and mitigation solutions: review article. Energies. 2023;16(24):8022. doi:10.3390/en16248022. [Google Scholar] [CrossRef]
12. Almukhtar H, Lie TT, Al-Shohani WAM, Anderson T, Al-Tameemi Z. Comprehensive review of dust properties and their influence on photovoltaic systems: electrical, optical, thermal models and experimentation techniques. Energies. 2023;16(8):3401. doi:10.3390/en16083401. [Google Scholar] [CrossRef]
13. Vedulla G, Geetha A, Senthil R. Review of strategies to mitigate dust deposition on solar photovoltaic systems. Energies. 2023;16(1):109. doi:10.3390/en16010109. [Google Scholar] [CrossRef]
14. Gordo E, Khalaf N, Strangeowl T, Dolino R, Bennett N. New Mexico supercomputing challenge—factors affecting solar power production efficiency. Gallup, NM, USA: Miyamura High School; 2015. [Google Scholar]
15. Amarasinghe PAGM, Abeygunawardane SK. Application of machine learning algorithms for solar power forecasting in Sri Lanka. In: Proceedings of the 2018 2nd International Conference on Electrical Engineering (EECon); 2018 Sep 28; Colombo, Sri Lanka. p. 87–92. doi:10.1109/eecon.2018.8541017. [Google Scholar] [CrossRef]
16. Ratnasingam G. Application of alternative energy sources as a sustainable strategy in Sri Lanka: cases review. JURISMA J Ris Bisnis Manaj. 2023;13(2):217–36. doi:10.34010/jurisma.v13i2.11020. [Google Scholar] [CrossRef]
17. Koswatte I, Iddawala J, Kulasekara R, Ranaweera P, Dasanayaka CH, Abeykoon C. Can Sri Lanka be a net-zero nation by 2050?—current renewable energy profile, opportunities, challenges, and recommendations. Clean Energy Syst. 2024;8(7):100126. doi:10.1016/j.cles.2024.100126. [Google Scholar] [CrossRef]
18. Bambaravanage T, Perera C, Rodrigo A. An effective stability solution for small power systems with high distributed generation. Discov Energy. 2025;5(1):17. doi:10.1007/s43937-025-00077-5. [Google Scholar] [CrossRef]
19. Wu YK, Huang CL, Phan QT, Li YY. Completed review of various solar power forecasting techniques considering different viewpoints. Energies. 2022;15(9):3320. doi:10.3390/en15093320. [Google Scholar] [CrossRef]
20. Tsai WC, Tu CS, Hong CM, Lin WM. A review of state-of-the-art and short-term forecasting models for solar PV power generation. Energies. 2023;16(14):5436. doi:10.3390/en16145436. [Google Scholar] [CrossRef]
21. Zhang Y, Liu J, Shen W. A review of ensemble learning algorithms used in remote sensing applications. Appl Sci. 2022;12(17):8654. doi:10.3390/app12178654. [Google Scholar] [CrossRef]
22. Yang Y, Lv H, Chen N. A survey on ensemble learning under the era of deep learning. Artif Intell Rev. 2023;56(6):5545–89. doi:10.1007/s10462-022-10283-5. [Google Scholar] [CrossRef]
23. Mahajan P, Uddin S, Hajati F, Moni MA. Ensemble learning for disease prediction: a review. Healthcare. 2023;11(12):1808. doi:10.3390/healthcare11121808. [Google Scholar] [PubMed] [CrossRef]
24. Khan W, Walker S, Zeiler W. Improved solar photovoltaic energy generation forecast using deep learning-based ensemble stacking approach. Energy. 2022;240(17):122812. doi:10.1016/j.energy.2021.122812. [Google Scholar] [CrossRef]
25. Al-shanableh N, Alzyoud M, Al-husban RY, Alshanableh NM, Al-Oun A, Al-Batah MS, et al. Advanced ensemble machine learning techniques for optimizing diabetes mellitus prognostication: a detailed examination of hospital data. Data Metadata. 2024;3:363. doi:10.56294/dm2024.363. [Google Scholar] [CrossRef]
26. Sharma T, Jatain A, Bhaskar S, Pabreja K. Ensemble machine learning paradigms in software defect prediction. Procedia Comput Sci. 2023;218(5):199–209. doi:10.1016/j.procs.2023.01.002. [Google Scholar] [CrossRef]
27. Ahmada MT, Akbar S. Energy consumption prediction using data reduction and ensemble learning techniques. J ICT Res Appl. 2022;16(3):197–209. doi:10.5614/itbj.ict.res.appl.2022.16.3.1. [Google Scholar] [CrossRef]
28. Sarwar J, Khan SA, Azmat M, Khan F. An application of hybrid bagging-boosting decision trees ensemble model for riverine flood susceptibility mapping and regional risk delineation. Water Resour Manag. 2025;39(2):547–77. doi:10.1007/s11269-024-03995-6. [Google Scholar] [CrossRef]
29. Mohammed Hassoon I. Boosting learning algorithms for chronic diseases prediction: a review. Iraqi J Comput Inform. 2024;50(2):22–30. doi:10.25195/ijci.v50i2.506. [Google Scholar] [CrossRef]
30. Alrbai M, Al-Dahidi S, Alahmer H, Shboul B, Rinchi B, Al-Ghussain L, et al. Applications of machine learning and multi-objective optimization in agricultural waste management: a techno-economic study of hydrogen production from olive waste via combined air-steam gasification. Bioresour Technol. 2025;434:132844. doi:10.1016/j.biortech.2025.132844. [Google Scholar] [PubMed] [CrossRef]
31. Yin X, Liu Q, Pan Y, Huang X, Wu J, Wang X. Strength of stacking technique of ensemble learning in rockburst prediction with imbalanced data: comparison of eight single and ensemble models. Nat Resour Res. 2021;30(2):1795–815. doi:10.1007/s11053-020-09787-0. [Google Scholar] [CrossRef]
32. Gu J, Liu S, Zhou Z, Chalov SR, Zhuang Q. A stacking ensemble learning model for monthly rainfall prediction in the Taihu Basin, China. Water Switz. 2022;14(3):492. doi:10.3390/w14030492. [Google Scholar] [CrossRef]
33. Gul A. A novel hybrid ensemble framework for stock price prediction: combining bagging, boosting, dagging, and stacking. Comput Econ. 2026;67(4):2765–95. doi:10.1007/s10614-025-10979-0. [Google Scholar] [CrossRef]
34. Yin C, Ou L. Application of stacking ensemble learning in predicting copper’s flotation concentrate grade. Minerals. 2024;14(4):424. doi:10.3390/min14040424. [Google Scholar] [CrossRef]
35. van Loon W, Fokkema M, Szabo B, de Rooij M. View selection in multi-view stacking: choosing the meta-learner. Adv Data Anal Classif. 2025;19(3):579–617. doi:10.1007/s11634-024-00587-5. [Google Scholar] [PubMed] [CrossRef]
36. Peppes N, Daskalakis E, Alexakis T, Adamopoulou E, Demestichas K. Performance of machine learning-based multi-model voting ensemble methods for network threat detection in agriculture 4.0. Sensors. 2021;21(22):7475. doi:10.3390/s21227475. [Google Scholar] [PubMed] [CrossRef]
37. Hadhri S, Hadiji M, Labidi W. A voting ensemble classifier for stress detection. J Inf Telecommun. 2024;8(3):399–416. doi:10.1080/24751839.2024.2306786. [Google Scholar] [CrossRef]
38. Chithuloori P, Kim JM. Soft voting ensemble classifier for liquefaction prediction based on SPT data. Artif Intell Rev. 2025;58(8):228. doi:10.1007/s10462-025-11230-w. [Google Scholar] [CrossRef]
39. Sesmero MP, Iglesias JA, Magán E, Ledezma A, Sanchis A. Impact of the learners diversity and combination method on the generation of heterogeneous classifier ensembles. Appl Soft Comput. 2021;111(3):107689. doi:10.1016/j.asoc.2021.107689. [Google Scholar] [CrossRef]
40. Hasman NAB, Ahmad Mustafa NBB, Chik MN. Deep learning models performance comparison for solar energy generation forecasting in a large-scale solar farm. IOP Conf Ser Earth Environ Sci. 2025;1560(1):012041. doi:10.1088/1755-1315/1560/1/012041. [Google Scholar] [CrossRef]
41. Krechowicz M, Krechowicz A, Lichołai L, Pawelec A, Piotrowski JZ, Stępień A. Reduction of the risk of inaccurate prediction of electricity generation from PV farms using machine learning. Energies. 2022;15(11):4006. doi:10.3390/en15114006. [Google Scholar] [CrossRef]
Cite This Article
 Copyright © 2026 The Author(s). Published by Tech Science Press.
This work is licensed under a Creative Commons Attribution 4.0 International License , which permits unrestricted use, distribution, and reproduction in any medium, provided the original work is properly cited.
 Downloads
 Citation Tools
