
 Submit a Paper
 Propose a Special lssue
 Open Access
ARTICLE

Influence of Different Transition Modes on the Performances of a Hydraulic Turbine
1 School of Energy and Power Engineering, Lanzhou University of Technology, Lanzhou, 730050, China
2 Key Laboratory of Fluid Machinery and Systems of Gansu, Lanzhou, 730050, China
* Corresponding Author: Yucai Tang. Email:
Fluid Dynamics & Materials Processing 2023, 19(10), 2481-2497. https://doi.org/10.32604/fdmp.2023.028416
Received 04 January 2023; Accepted 05 May 2023; Issue published 25 June 2023
 View Full Text
 Download PDF
Abstract
In order to analyze the response of a hydraulic turbine to a variation in the operating conditions, different laws of variation in time of the mass flow rate have been considered. After validating the overall numerical framework through comparison with relevant experiments, the performances of the considered turbine have been analyzed from a fluid-dynamic point of view. The results show that different time profiles of the mass flow rate (in this work, for simplicity, referred to as “transition functions”) have a varying influence on the transient behavior of the turbine. When a quadratic function is considered for the case of large flow, the transient head and torque increase gradually with time, the fluctuation amplitude of the transient hydraulic efficiency at the main frequency is the largest, and the fluctuation amplitude of the radial force is the smallest. For the small flow case, the time profile with exponential nature leads to the best results. The transient head and torque decrease gradually with time, the pulsation amplitude of the transient hydraulic efficiency is the largest at the main frequency, and the pulsation amplitude of the radial force is the smallest.Graphic Abstract
Keywords
Nomenclature
| D1 | Impeller inlet diameter [mm] |
| D2 | Impeller outlet diameter [mm] |
| dh | Hub diameter [mm] |
| b1 | Inlet width [mm] |
| Z | Impeller outlet diameter [mm] |
| D3 | Volute base circle diameter [mm] |
| b3 | Volute outlet width [mm] |
| D | Volute inlet diameter [mm] |
| Greek Symbols | |
| | Inlet placement corner [ |
| | Blade wrapping angle [ |
When the centrifugal pump is used as a hydraulic turbine in reverse, it can recover the residual pressure energy of the high-pressure fluid in the petrochemical industry, coal chemical industry, seawater desalination and other industrial processes and convert it into mechanical energy or electric energy for secondary utilization [1,2]. The hydraulic turbine usually works under optimal working conditions. However, when transient conditions such as opening, stopping, or failure occur it will deviate from the optimal working condition to the small flow or large flow condition. In the transition process, the coordinated working state of the whole turbine unit is destroyed, adverse effects on the unit will occur, such as water hammer, noise intensification, and influence on the operating life of turbine units [3,4]. Therefore, for the safe and reliable operation of turbine units, it is of significance to analyze and study the transient characteristics of the hydraulic turbine during the variable flow transition process.
The transient transition process refers to the intermediate process that the fluid begins to transition to another stable condition when it is disturbed, in which the various performance parameters of the fluid will be changed dramatically in a short time [5]. The transient process characteristics during the power outage of centrifugal pumps were studied in [6], it is found that the pump parameters fluctuate significantly over time during this period, and this fluctuation leads to high-pressure pulsations during the flow process. The angular momentum equation and energy equation were used to predict the changes in parameters such as torque, power and head during the transient transition process by Dazin et al. [7]. The rapid start-up process of centrifugal pumps was studied in [8], it was proposed that the transient characteristics are related to the flow field changing with time, and the flow field in the pump is not fully developed in the initial transient compared with the quasi-steady change. Tsukamoto et al. [9] studied the low specific speed centrifugal pump (ns = 62), assumed that its operating speed changes according to the sinusoidal law, and found that the pulsation frequency change of the rotational speed has a significant impact on the performance changes of transient and quasi-steady state. Wang et al. [10,11] studied the transient hydraulic characteristics and internal flow mechanism of the transition process from designed to non-designed working conditions of centrifugal pumps and nuclear main pumps, defined the boundary conditions that change over time by an ANSYS CEL custom function language, and controlled the mass flow of the transition process by the inlet boundary conditions, and found that the increase in flow rate during the large flow transition had little impact on hydraulic characteristics, and the hydraulic characteristics had a great effect on the hydraulic characteristics due to the existence of secondary backflow and other factors when transitioning to small flow; in the numerical calculation of the variable flow transition process by Wang [12], it was assumed that the flow rate varies linearly and the transient process in which the flow rate decreases from the design flow rate to zero will be increased part of the head of the nuclear main pump and the hydraulic efficiency of the nuclear main pump is also improved compared to the transient flow in the steady-state condition. In the literature [13], it was assumed that the variable flow transition process of the nuclear main pump follows a linear transition, and the change of impeller radial force under variable vane number was investigated. Referring to the transient transition process characteristics of the centrifugal pump and the nuclear main pump, Su [14] will be divided into the process industry common pump for turbine transition process into constant pressure acceleration and deceleration and constant flow acceleration and deceleration of these four categories, and found that the most disordered moment of the flow field in the transition process occurs at the starting moment, and the transient acceleration process is accelerated motion with decreasing acceleration, and deceleration process is decelerated motion with decreasing acceleration, so the quadratic function type of speed transition is used, and the joint pump as turbine is calculated synchronously with the load, which can obtain more accurate results of the transition process.
To analyze the influence of different transition processes on the transient hydraulic performance of hydraulic turbines, this paper the numerical calculation of the non-stationary characteristics of the transition process from the optimum condition (
2 The Main Geometric Parameters of Hydraulic Turbine
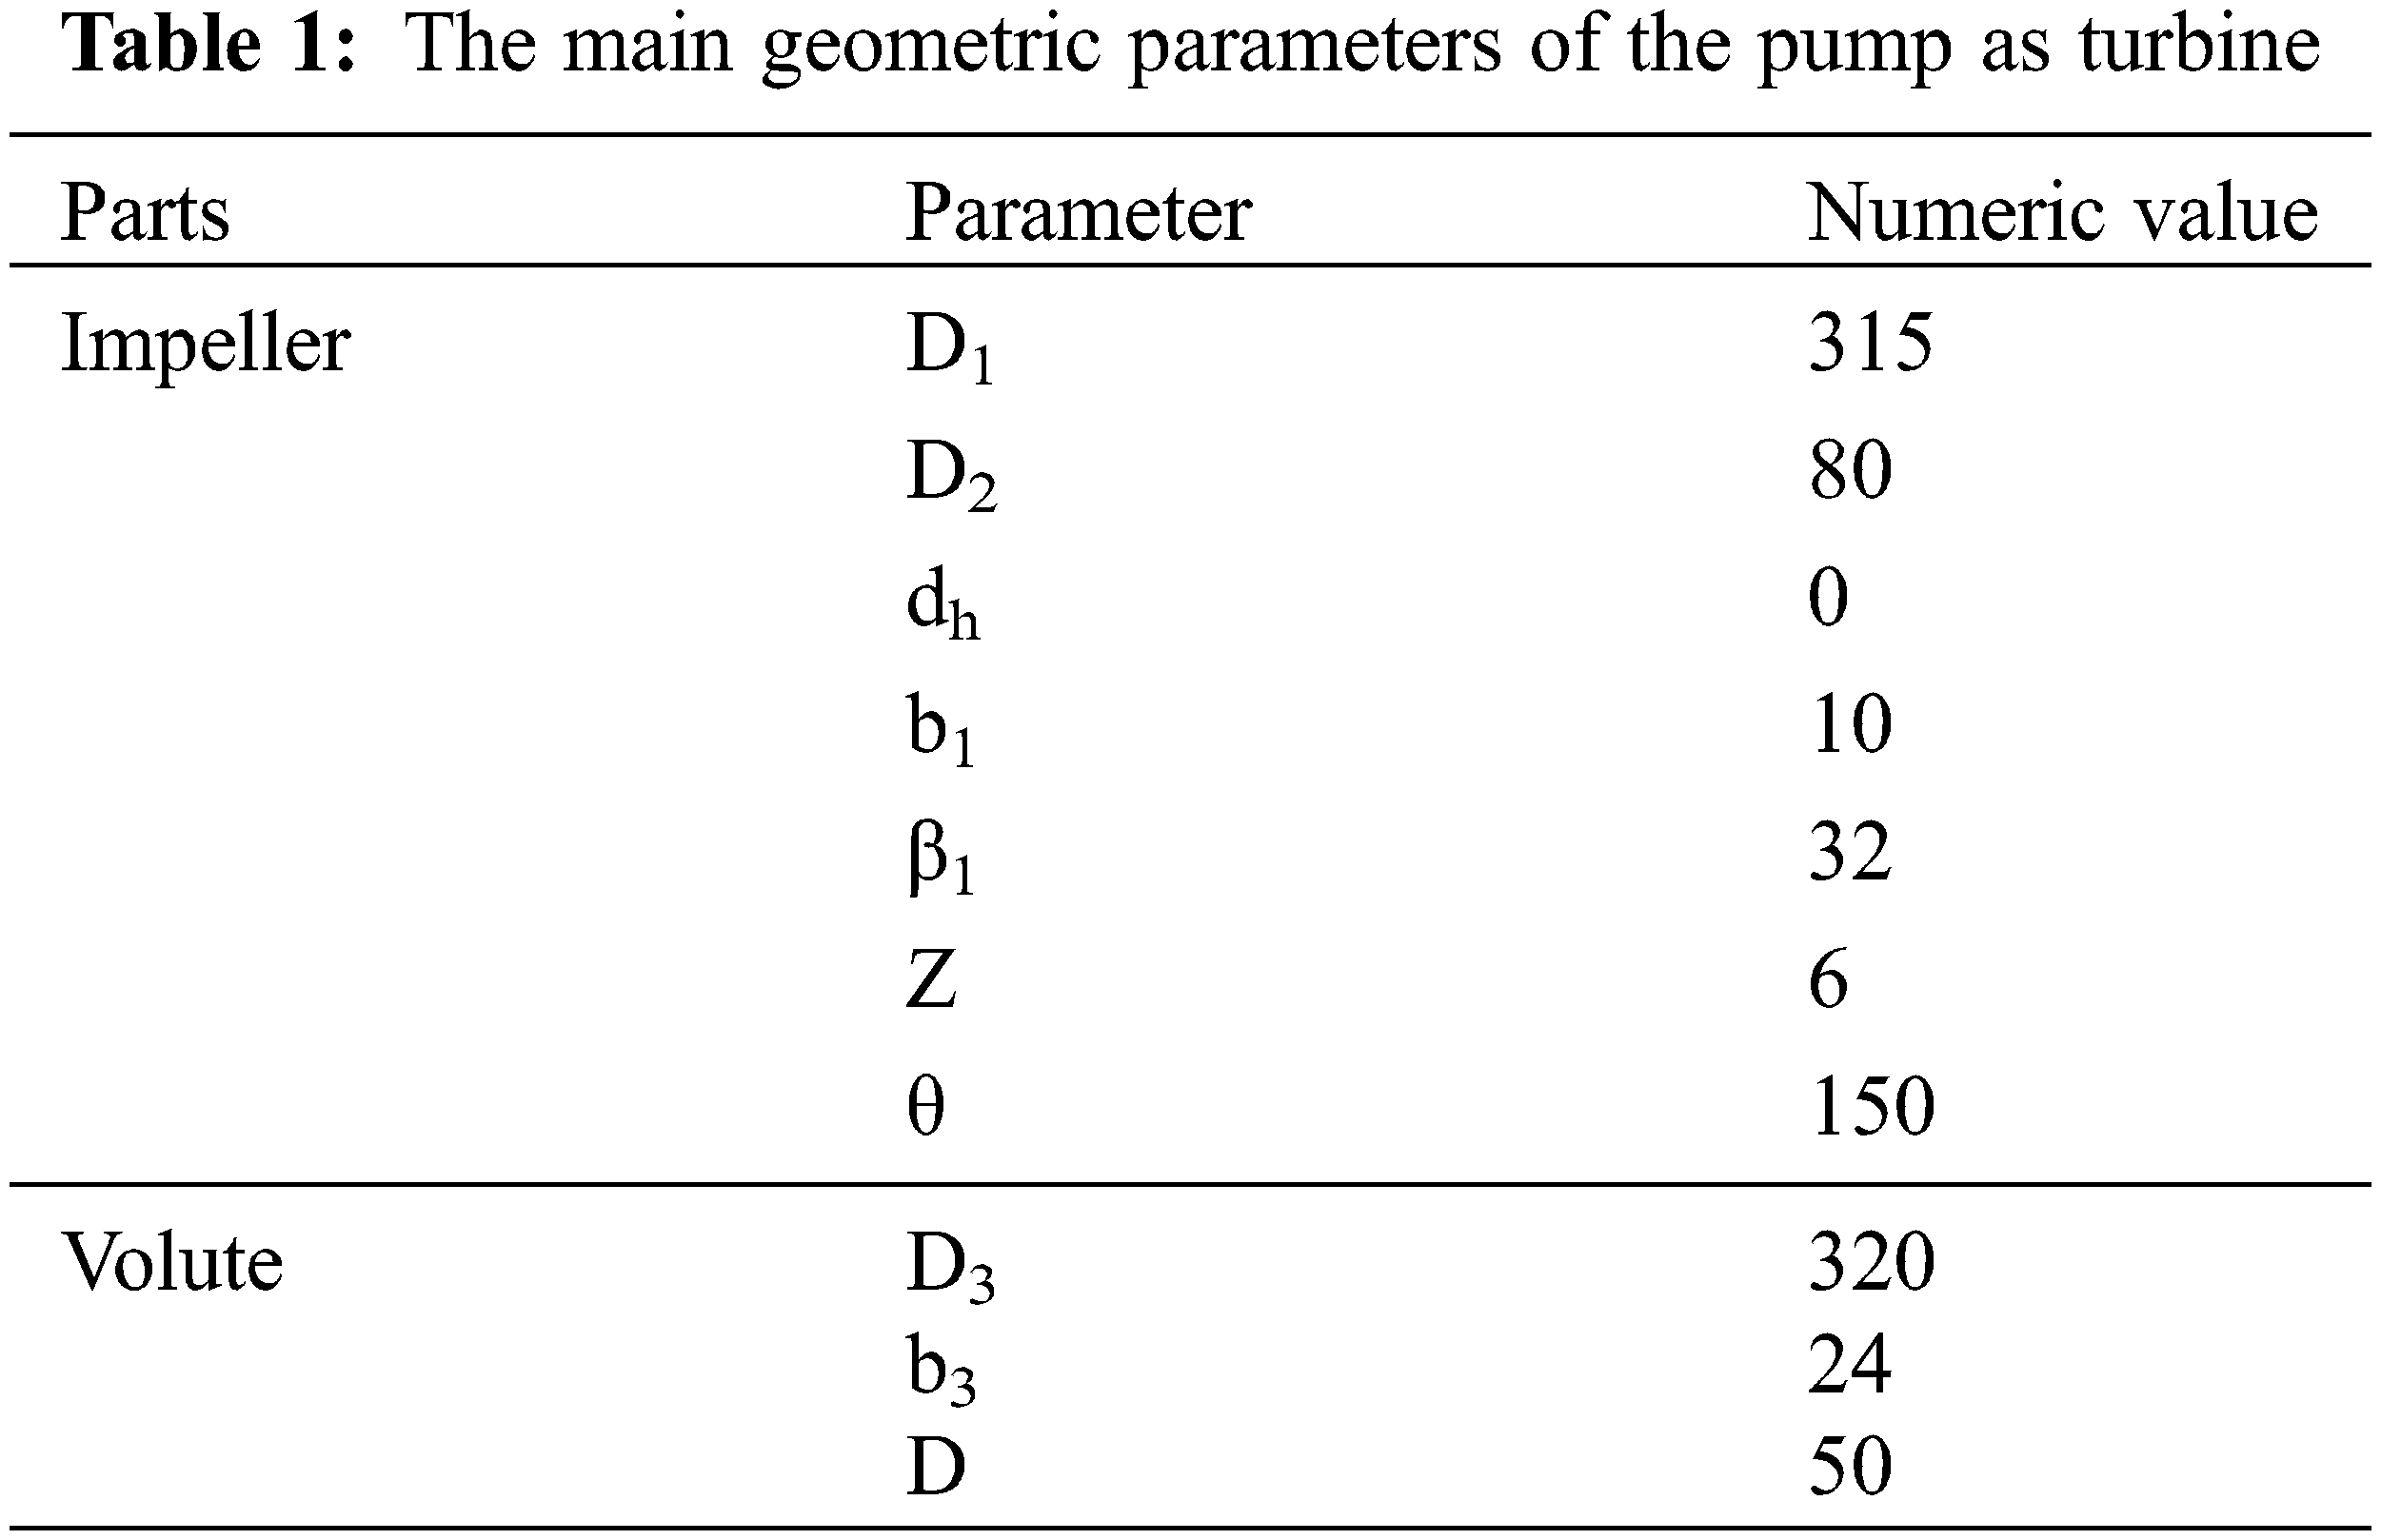
An IS80-50-315 low specific speed centrifugal pump (ns = 33) reversing for hydraulic is used as the research object, as is shown in Fig. 1. The original external characteristic parameters of the centrifugal pump are: Qp = 25 m3/h, head Hp = 32 m, and the specific speed of the pump nsp = 33 (‘p’ refers to the pump working condition). The main geometric parameters of the hydraulic turbine are shown in Table 1 [15], when reversed for turbine use, the rotational speed nt = np (‘t’ refers to the turbine condition).
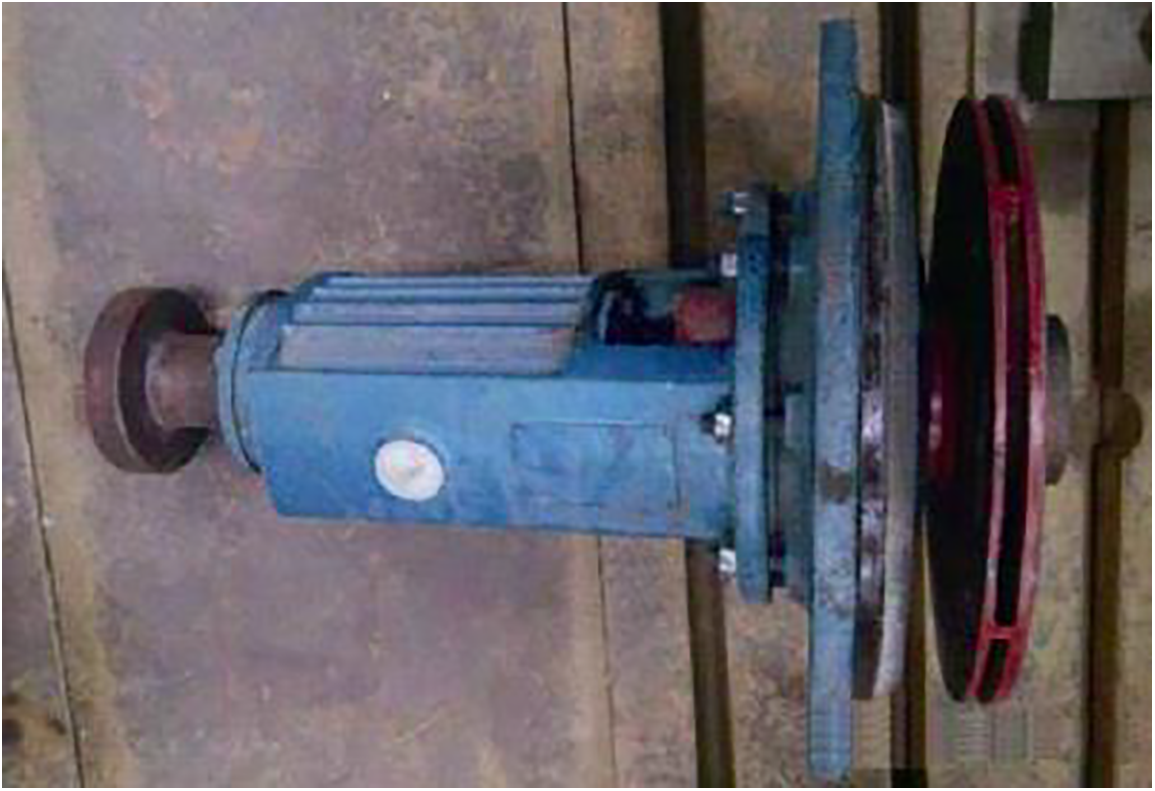
Figure 1: IS 80-50-315 centrifugal pump
3.1 Calculation Domain Selection and Meshing
According to the main geometric parameters of the impeller and volute casing of the hydraulic turbine in Table 1 for two-dimensional hydraulic design, the Pro/Engineer software is used to model the components, to improve the accuracy and precision of the numerical simulation, the inlet and outlet sections of the calculation model were extended appropriately, and the main reason for extending the inlet and outlet sections is to allow the fluid to flow more fully in front of the pump at turbulence level, and also to get closer to the actual work. The whole model includes five parts, After the calculation domain is generated, it is important into ICEM CFD for meshing. Since the hexahedral mesh can well control the flow distribution and the orthogonality of the boundary layer direction, the five parts of the hydraulic turbine impeller, volute, gap, inlet extension and the tail pipe are all mashed with the hexahedral structured grid, and the near wall area is encrypted, as shown in Fig. 2, and the mash of the blade inlet area is locally enlarged.
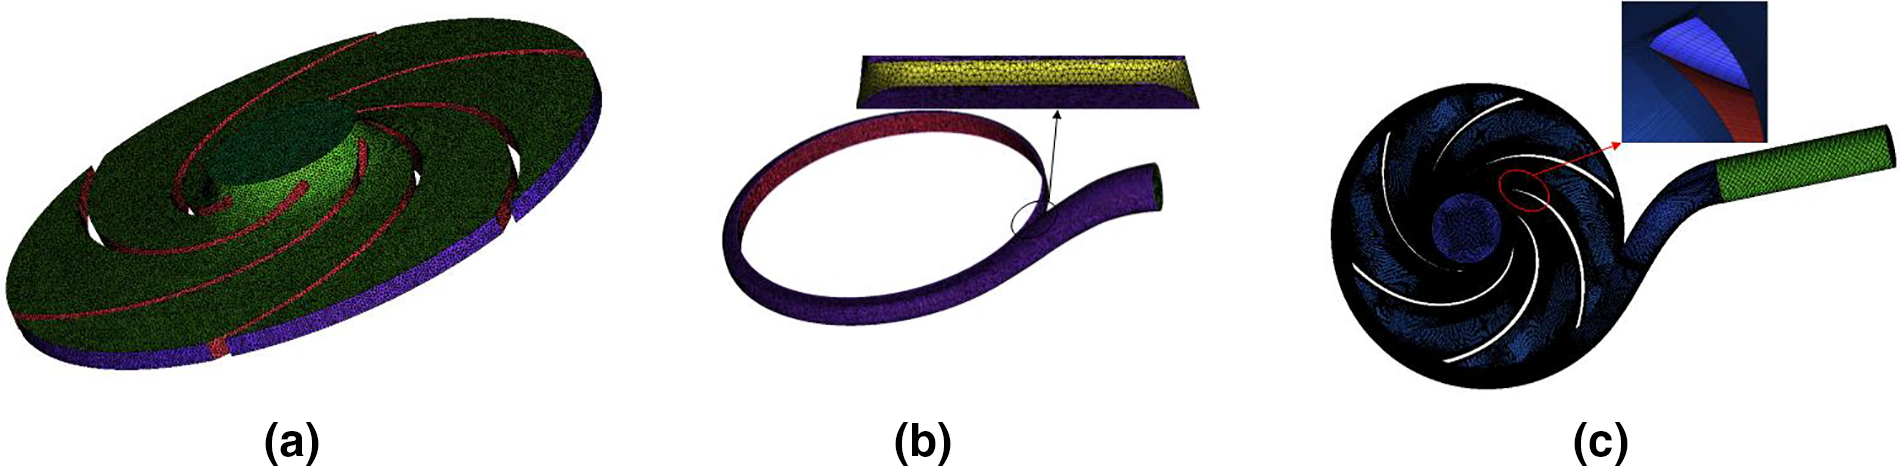
Figure 2: Impeller grid and full flow field grid assembly diagram (a) impeller grid (b) volute grid (c) assemble the mesh as a whole
The standard k-ε turbulence model is used to solve the internal flow characteristics of the hydraulic turbine, so the Y+ value of the mesh nodes from the wall should be controlled within the range to basically meet the requirements for the quality of the grid in the near-wall area [16], Fig. 3 shows the grid Y+ value in the near-wall area of the model, and it can be seen from the figure that the Y+ is within the permitted range. On the basis of satisfying the grid Y+ value in the near-walled area, the model was checked for grid independence, as shown in Fig. 4, when the efficiency fluctuation is less than 0.3%, it can be considered that the grid irrelevance assumption requirement is satisfied, and the total number of grids of the model under the final design blade number is 3.39 million.
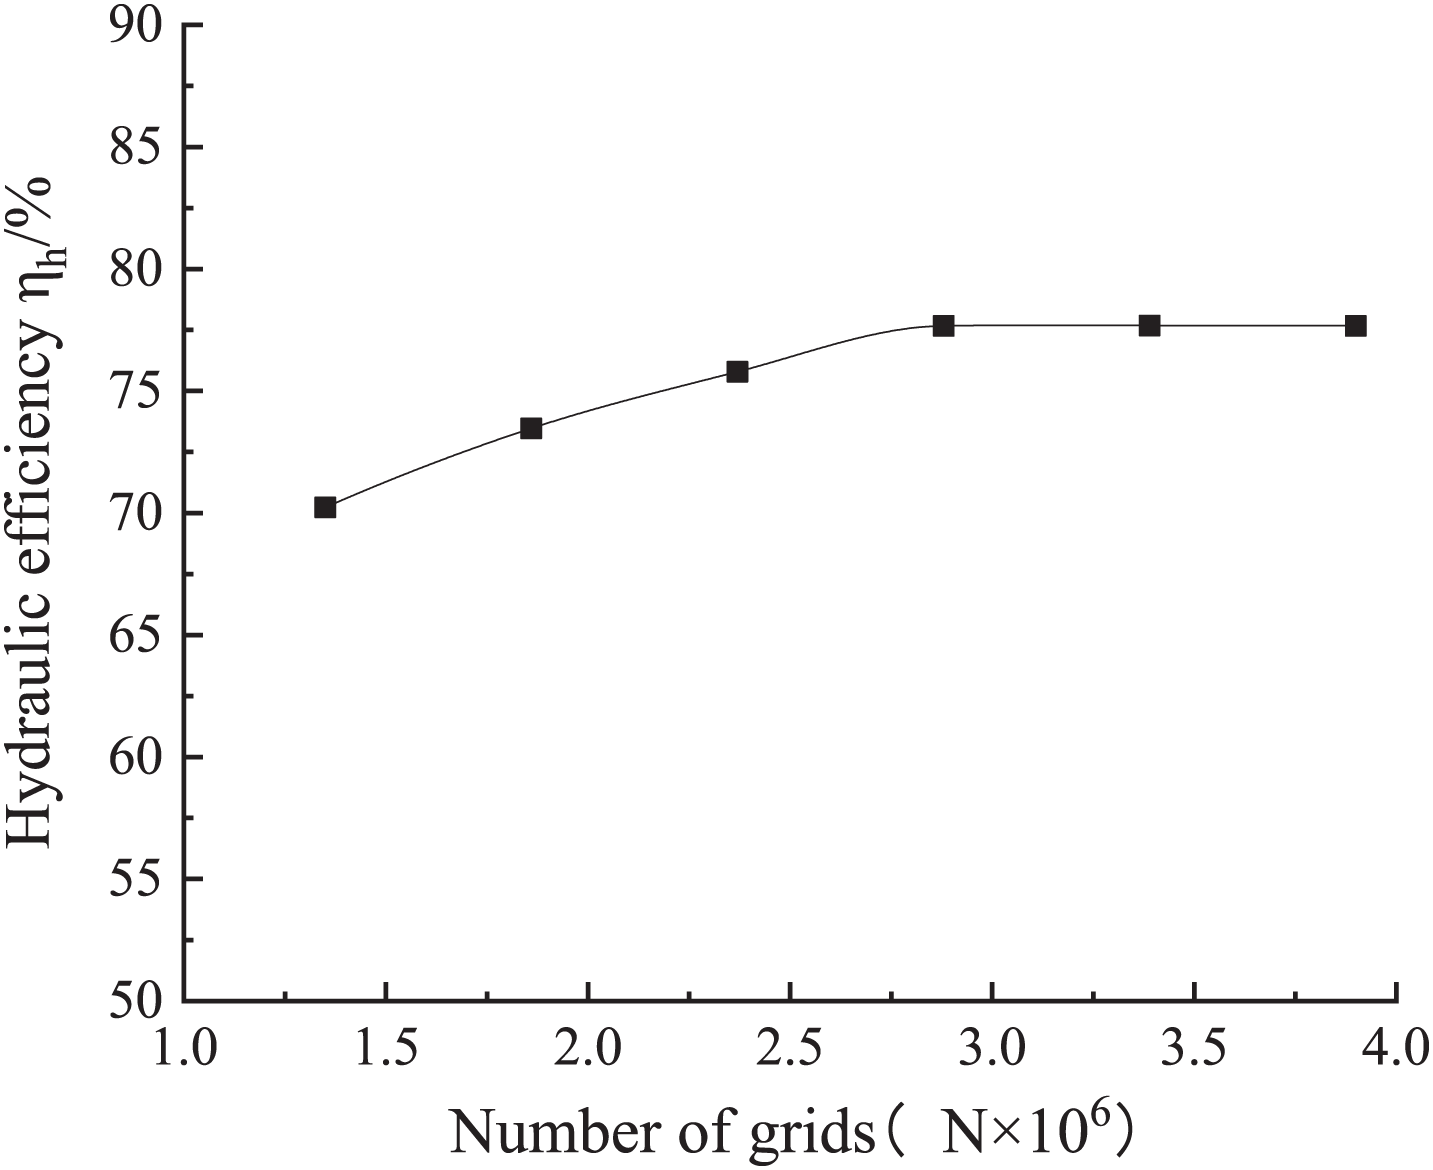
Figure 3: Grid independence test
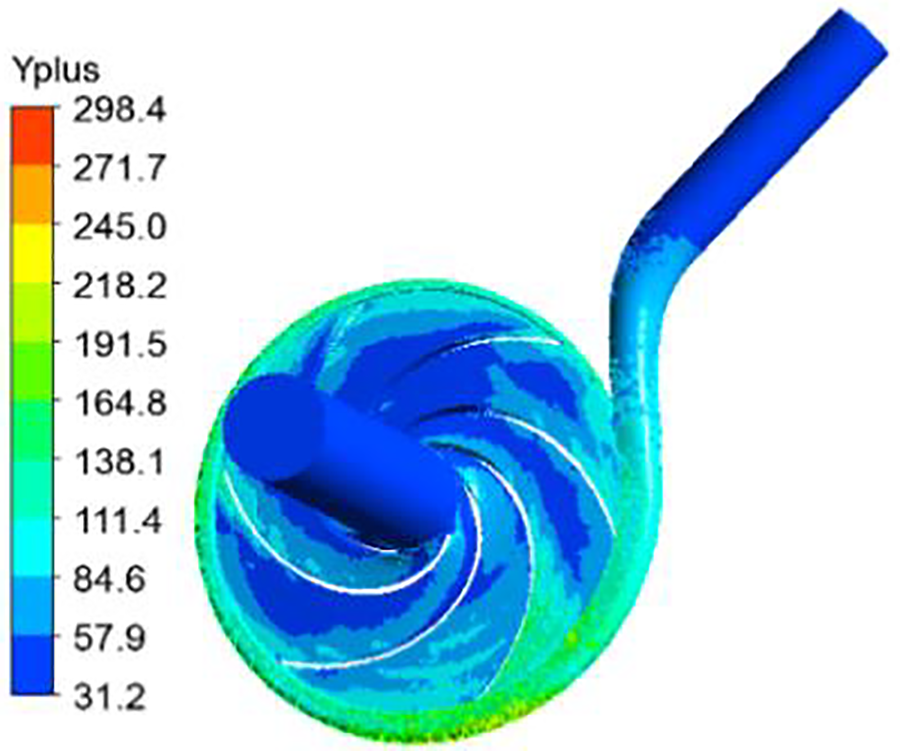
Figure 4: The Y+ value of the grid near the wall
In the transition process of variable flow rate, the mass flow rate is adopted for the inlet boundary condition, to prevent cavitation, the outlet boundary condition is set as the pressure outlet. And the pressure value is 0.5 MPa. In order to ensure the accuracy of the simulation results, the transition to a high or low flow rate after running 0.1 s at the optimum condition firstly, and to monitor the internal flow law of the turbine, the hydraulic turbine is transitioned to high and low flow rate conditions according to four basic functions in this paper, and these description functions are expressed as ANSYS CEL custom function language, as shown in Eqs. (1)–(8).
1) Linear function:
Large flow transition:
Small flow transition:
2) Quadratic function:
Large flow transition:
Small flow transition:
3) Exponential function type I:
Large flow transition:
Small flow transition:
4) Exponential function type II:
Large flow transition:
Small flow transition:
where, mi— inlet mass flow, kg/s; t— time, s; the step function is shown in Eq. (9); the mass flow rate at the optimal operating condition is 14.56 kg/s; the mass flow rate at the large flow rate operating condition is 18.03 kg/s; the mass flow rate at the low flow rate operating condition is 11.09 kg/s; the mass flow rate coefficients are 3.47, 2.02, and 5.48, respectively; 0.1 s is the initial running time; the mass flow rate of this model is controlled by the inlet boundary condition, and the mass flow rate is plotted in 0.1 to 1.1 s with time, as shown in Fig. 5, the 0.1 s mass flow rate is in the optimal condition (
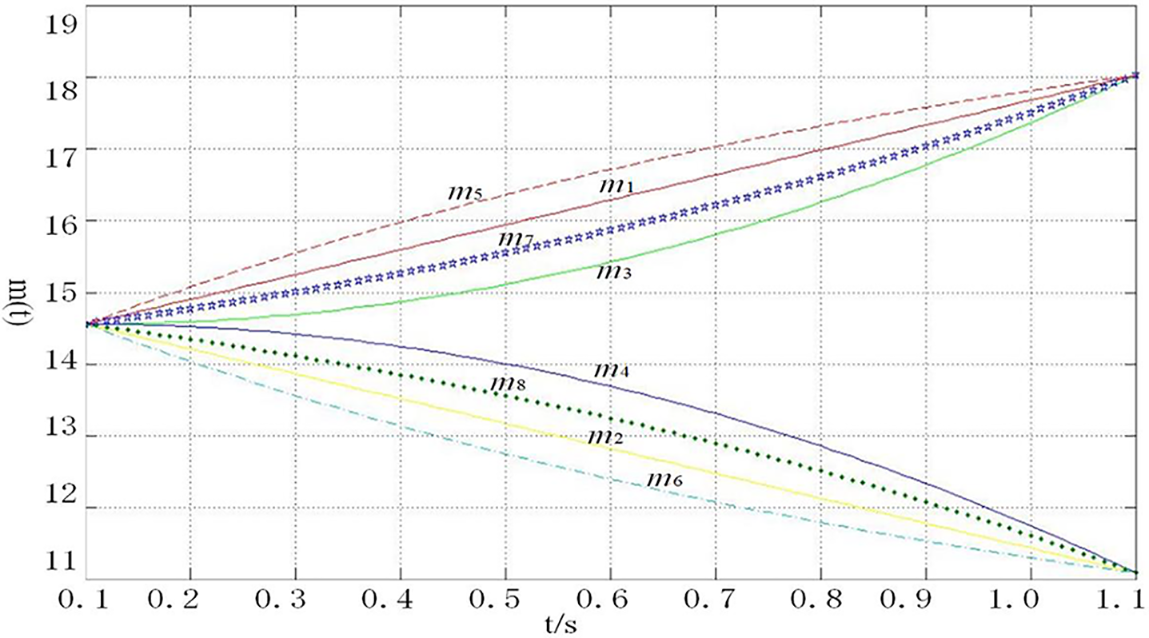
Figure 5: Variation curves of different transition functions
3.3 Unsteady Simulation Settings
For the non-constant numerical calculation, the impeller rotates 4° in one time step, then one time step is 4.6 × 10⁻⁴ s, so the total calculation time is 1.1 s. The internal flow is described by the Navier-Stokes (N-S) equation with Reynolds time uniform non-pressure, and the standard k-ε turbulence model is used, and the momentum and the continuous equations are solved by SIMPLE-C algorithm jointly. The interface between the dynamic and static calculation domains of the hydraulic turbine is set as transient dynamic-static rotor model, the standard wall function is used near the surface of the wall, the boundary condition of the wall is set to an adiabatic no-slip wall, the working medium is clear water at room temperature, and the convergence accuracy is set to 10−6.
4.1 Calculation Accuracy Verification
In order to verify the feasibility and accuracy of the numerical calculation method, the numerical calculation result of the external characteristics of the IS 80-50-315 centrifugal pump reversed as a turbine are compared with the test values, and the schematic diagram of the hydraulic turbine experiment is shown in Fig. 6, on which the test bench is built, as shown Fig. 7, and the accuracy level of the test bench is B grade. The parameters to be measured are flow rate, head, torque and speed. The inlet and outlet pressure of the hydraulic turbine is measured by ABG-1151/3351DP7S23B-M2 differential pressure sensor with a range of 0 to 2 MPa and a measurement accuracy of ±0.1%; the display head is LED liquid crystal display, and the turbine impeller speed and torque are measured by NJ1 torque sensor with a rated torque of 100 N. m, and a speed range of 0∼6000 r/min, and its calibration coefficient is 8522, the accuracy level is 0.2, the flow rate is measured by MF200-101 electromagnetic flow meter, the range of measurable flow rate is 0.9044∼217.03 m3/h, the accuracy is ±0.1% [15].
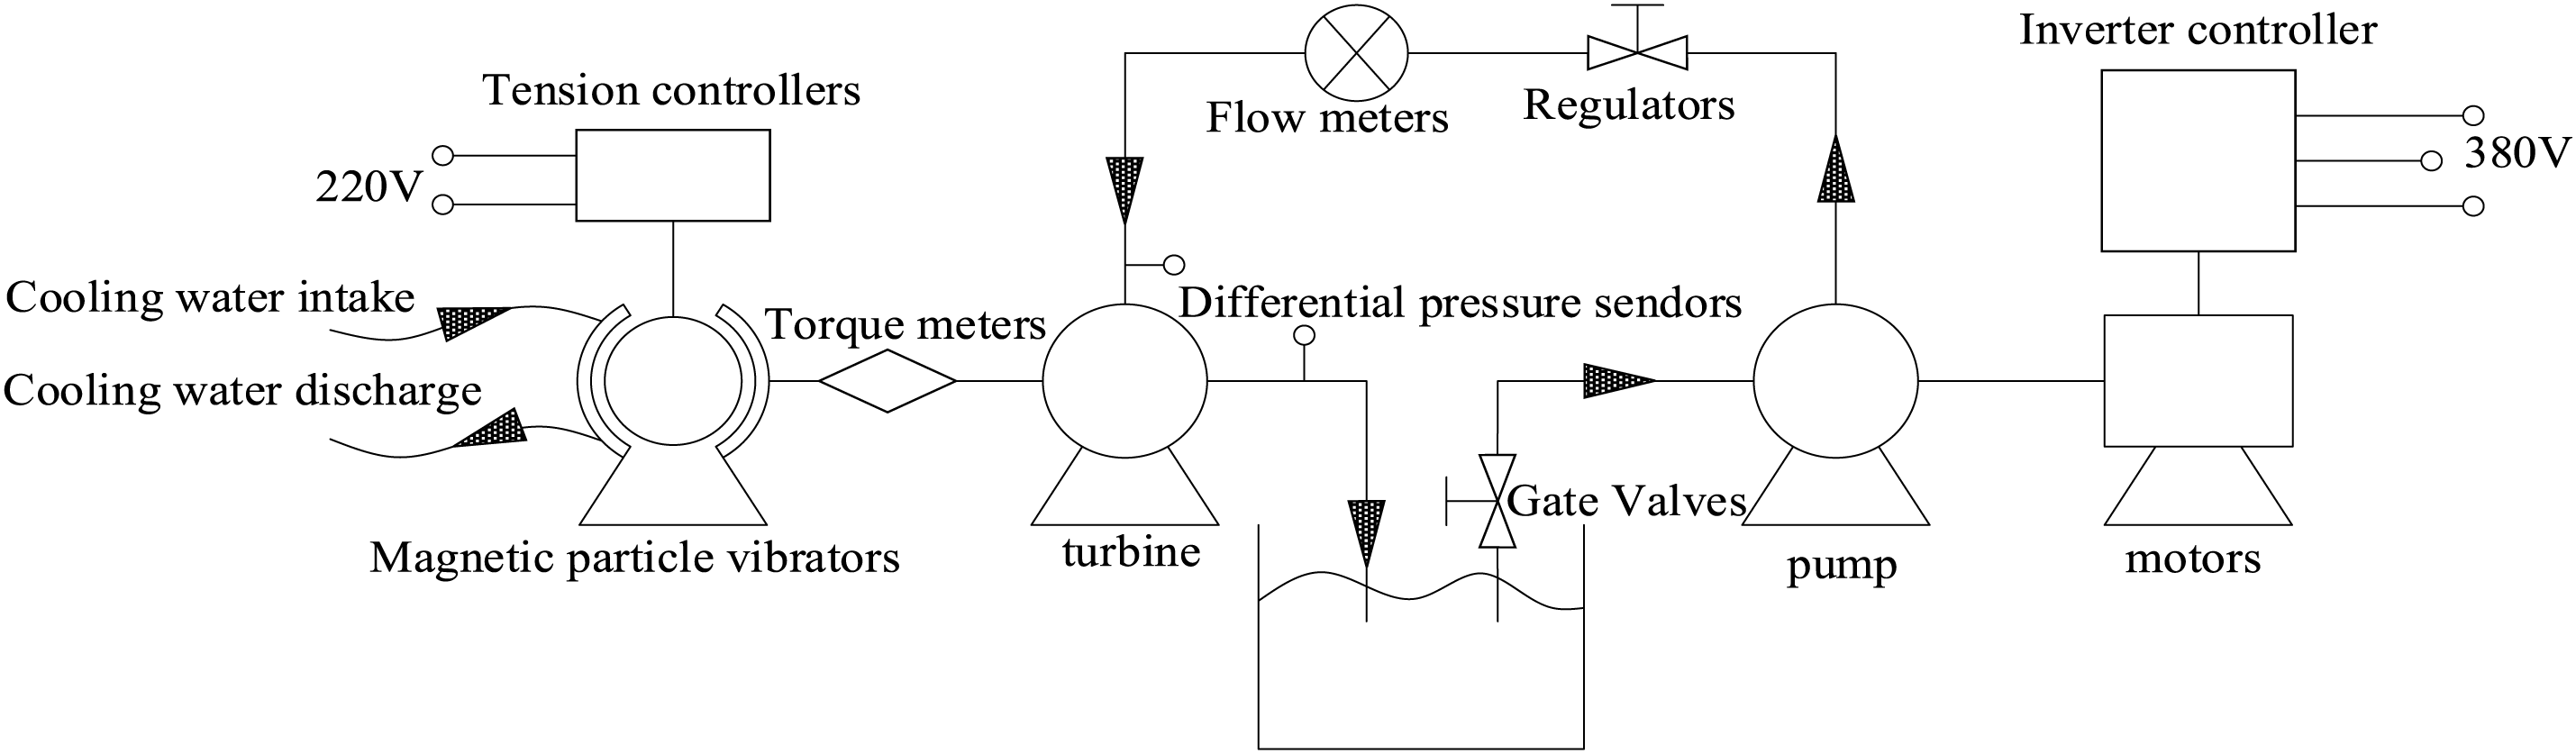
Figure 6: Schematic diagram of the hydraulic turbine test bench
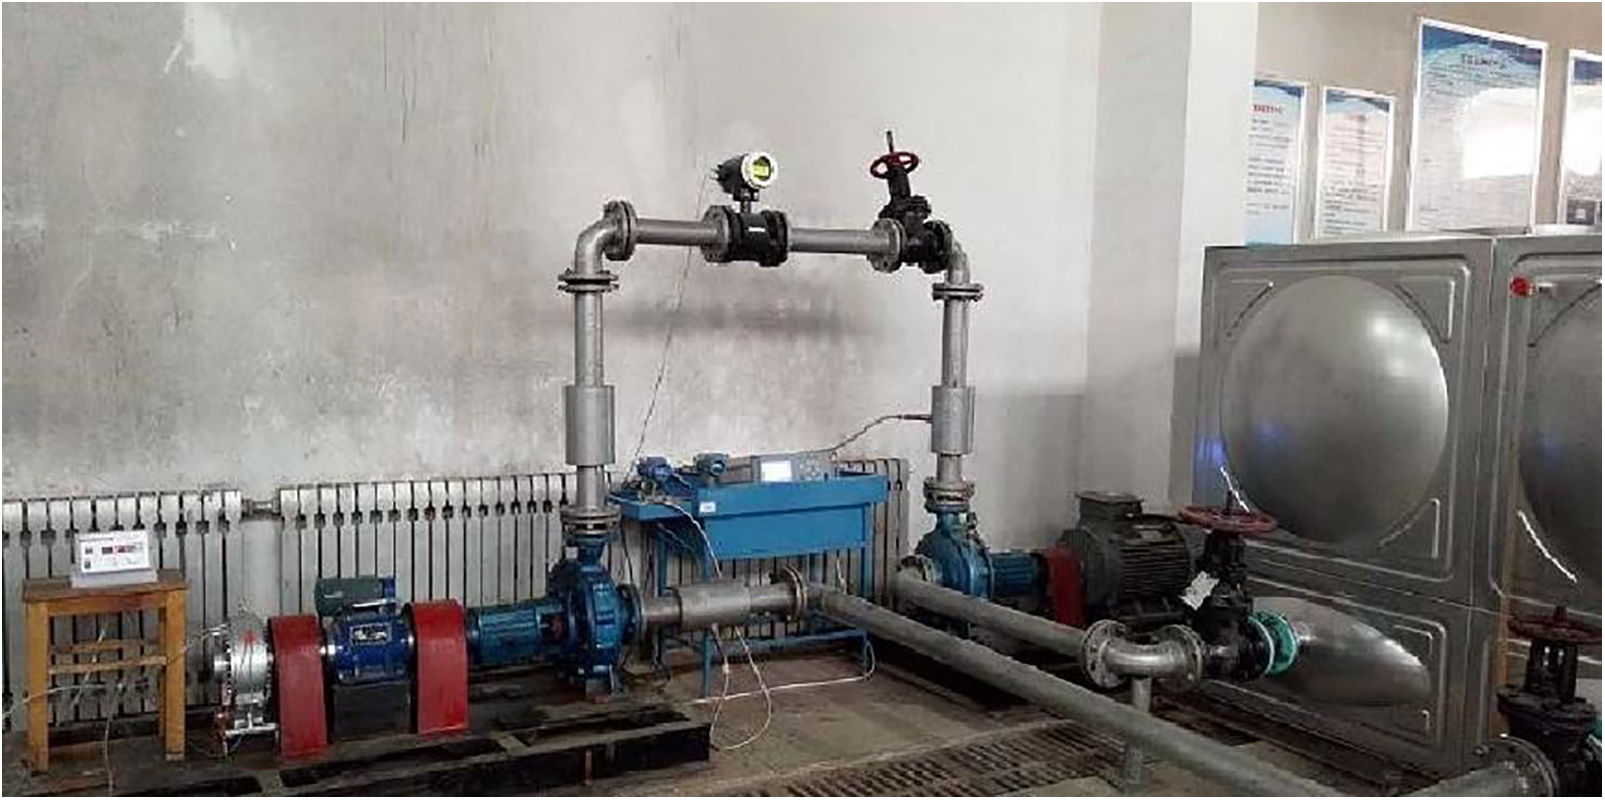
Figure 7: Hydraulic turbine test bench
Fig. 8 shows the comparison curves of the test efficiency and head measured in the test bench and the numerical calculation [15], which shows that the efficiency of the turbine increases and then decreases with the increase of the flow rate. The numerical calculated value is 1.6% smaller than the experimental value because the flow in the front and rear chambers of the hydraulic losses in the inlet and outlet pipes are not considered in the numerical simulation, but the results are still within an acceptable range [17,18], which proved that the numerical calculation method for this model is feasible.
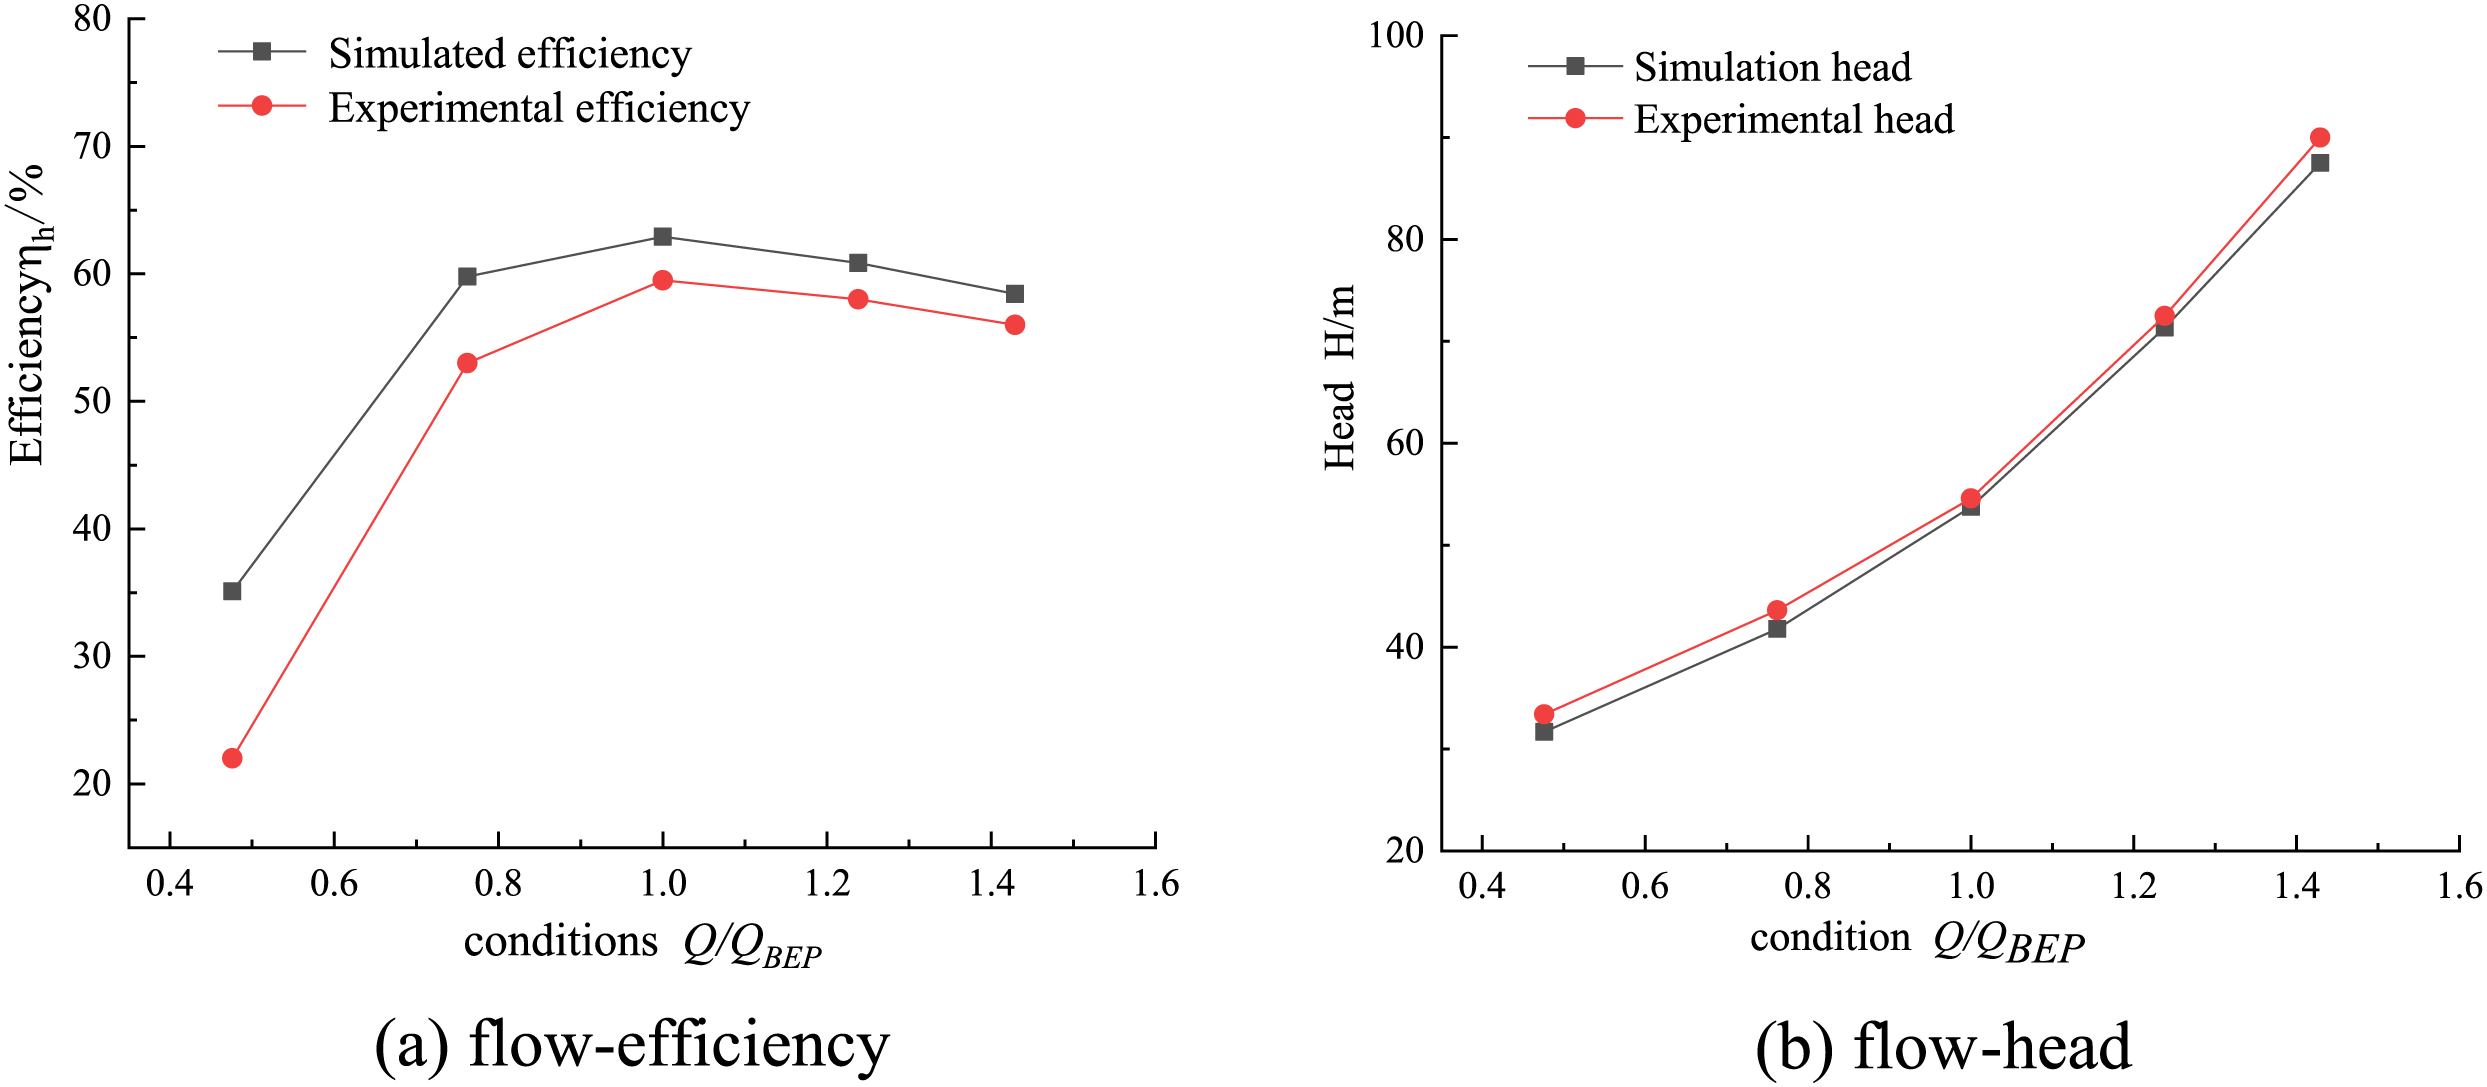
Figure 8: Comparison of simulation and test result
4.2 Transient Hydraulic Performance Analysis
CFX is used to define the function of transient head H and transient torque M changing with time and monitor their changing rules. The time-domain diagrams of transient head and torque transitioning to large flow rate and small flow rate, respectively, can be obtained as shown in Figs. 9 and 10. Acceleration exists in all kinds of transient operations and transition processes, so it is necessary to use generalized Euler equation to represent the theoretical head. Zhang [5] theoretically derived the expression of the transient head and found that in addition to steady-state head, there is an additional head in the transition process. Therefore, the theoretical head expression is:
where, ΩJ, ΩM, —blade influence coefficient; the first term refers to the formula for calculating the head under stable conditions, and the last two refer to the additional head in the transition process.
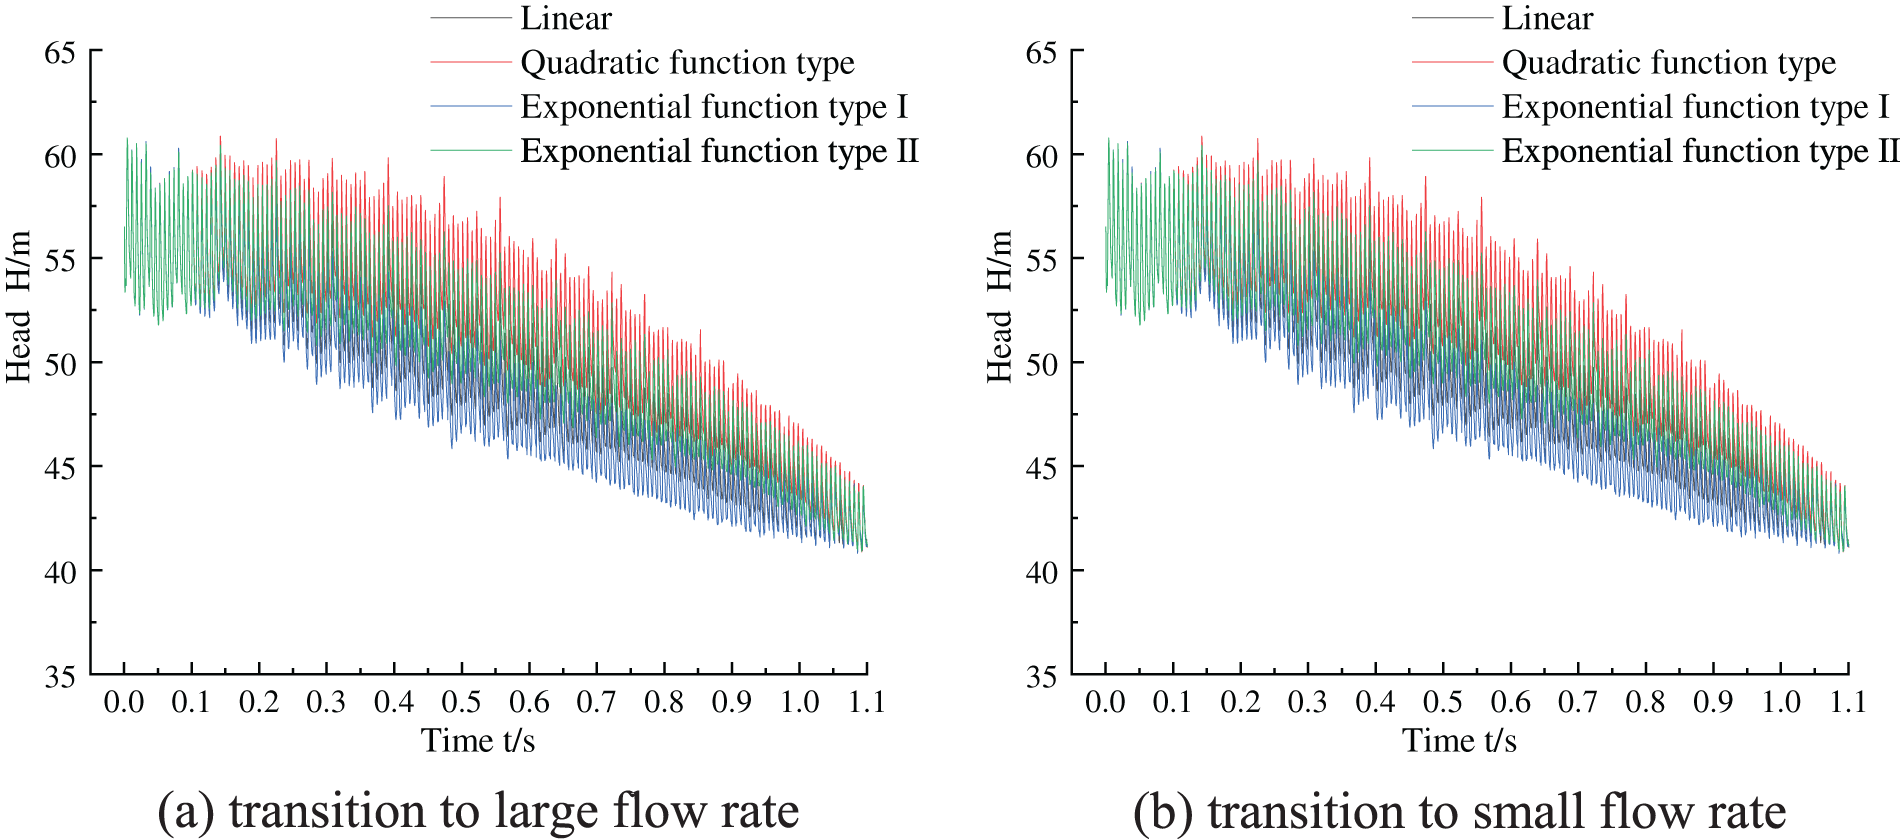
Figure 9: Transient head transition process curve
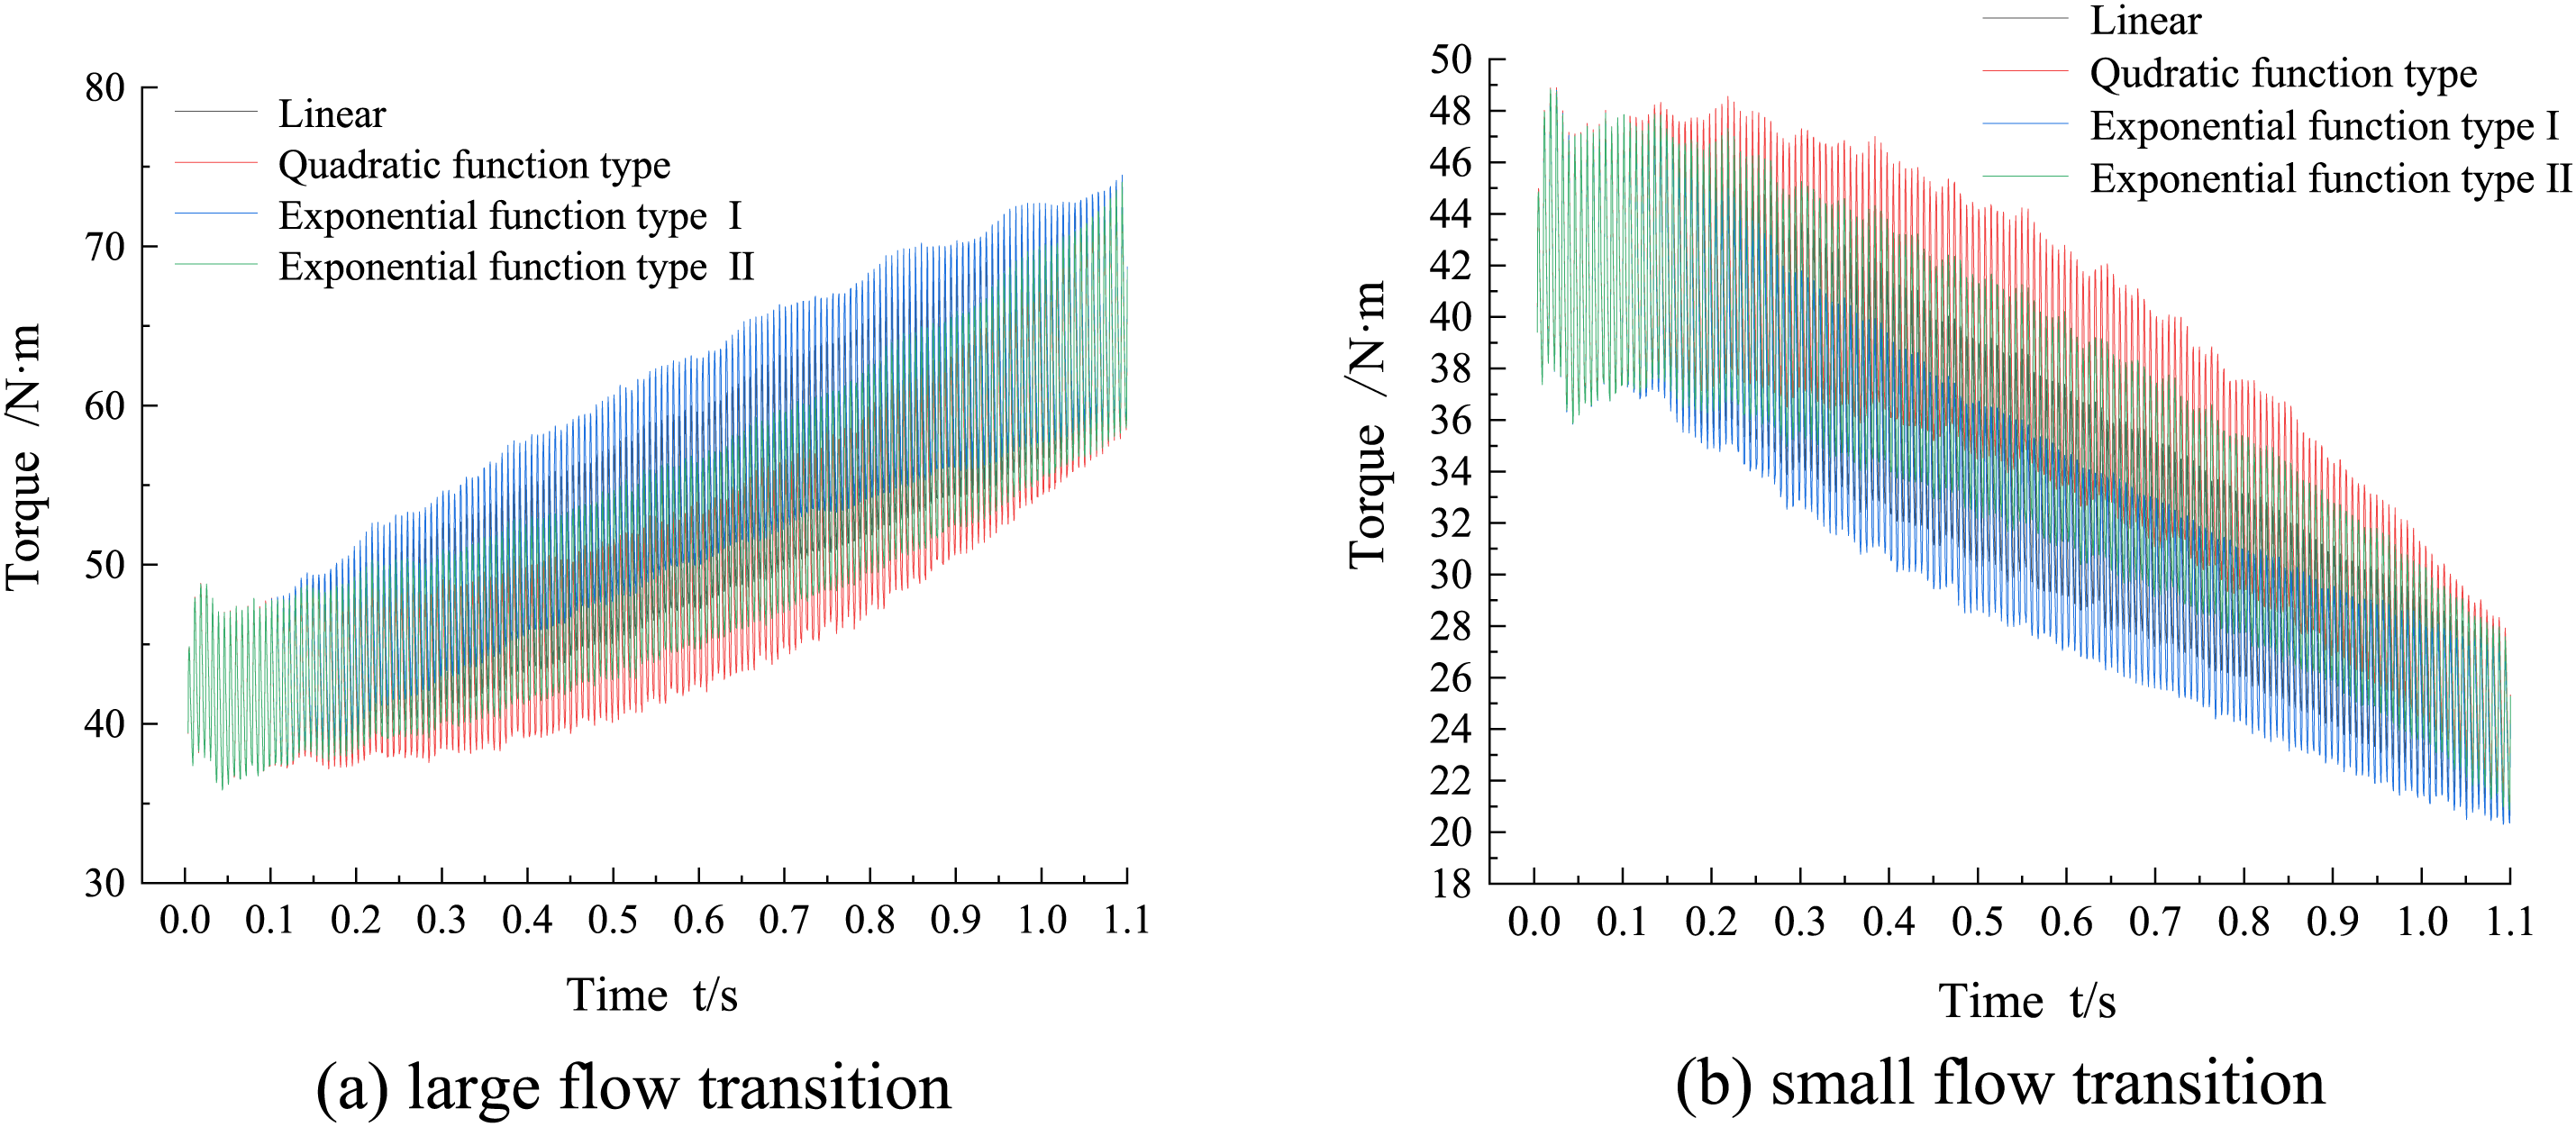
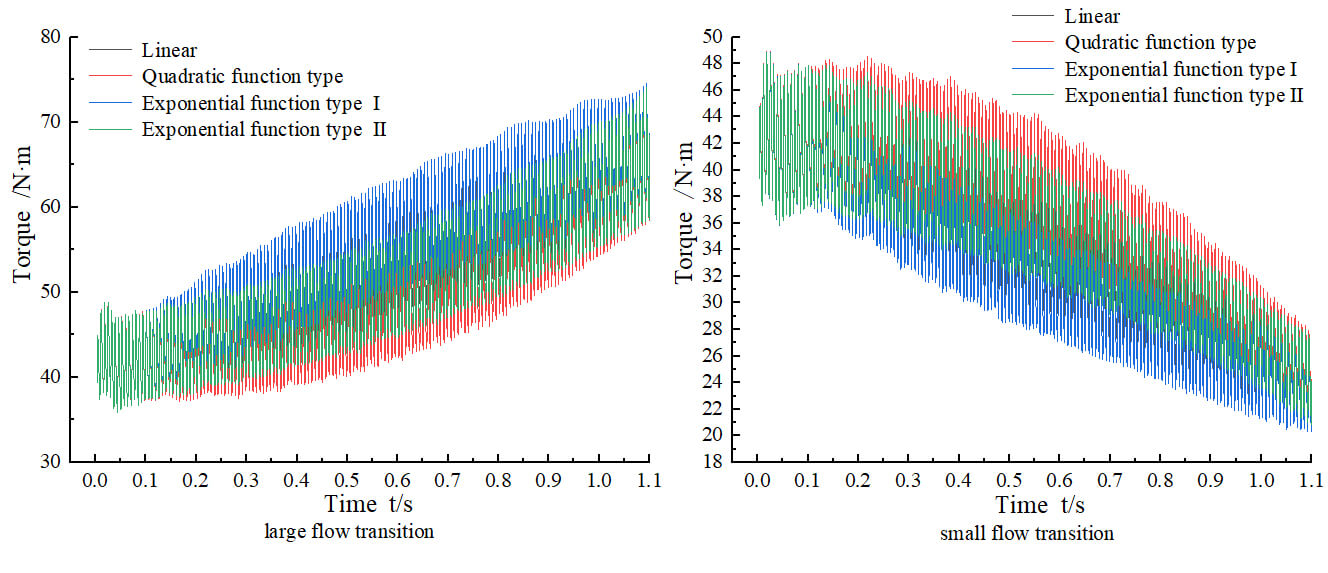
Figure 10: Transient torque transition process curve
For Fig. 9, during the transition process of variable flow, the head fluctuates up and down within a fixed range within 0∼0.1 s. After 0.1 s, for the large flow transition, the transient head increases with the increase of time, and the fluctuation range of the head also increases gradually. For the small flow transition, the transient head decreases gradually with the increase of time, and its fluctuation range also decreases gradually. In Fig. 9a, during the transition to a large flow, compared with the transient flow under stable conditions within 0∼0.1 s, part of the transient head of the hydraulic turbine is increased, namely, the additional head term in Eq. (10). This result is consistent with the experimental results in the literature [19], and the additional head is caused by the acceleration of the fluid flow. Similarly, the transition to low flow in Fig. 9b is also due to the existence of an additional head, which is caused by the deceleration of fluid flow. In addition, whether it is a transition to a large flow or a small flow, the variation trend of head presented by different function forms under the same transition situation is consistent.
Obviously, when transitioning to a large flow rate, the exponential function type I transition function has the largest transient head compared with the other three functions, while the quadratic transition function has the smallest transient head. In the case of transition to low flow, the changing trend is just the opposite, that is, the quadratic function transition function has the largest transient head, and the exponential function type I transition function has the smallest transient head.
During the operation of the hydraulic turbine, the high pressure fluid from the volute acting on the impeller blades produces a non-constant torsional torque on the impeller, which converts the pressure energy of the fluid into the mechanical energy of the impeller rotation, and its magnitude directly affects the magnitude of the turbine’s work capacity, and the magnitude of this non-constant torque will change with the changes of the hydraulic turbine operating conditions [20], especially in the process of variable flow transition, if the transient torque characteristics of the hydraulic turbine can be obtained, the overflow components of the hydraulic turbine can be more targeted to optimize the design.
Fig. 10 shows the time-domain diagram of transient torque changing with time in the process of variable flow transition. The torque changes periodically within 0∼0.1 s, and after 0.1 s the unit transitions to large flow, the transient torque gradually increases with the increase of time, and the fluctuation range also gradually increases. On the contrary, the transient torque decreases with the increase of time, and the fluctuation range also decreases. It can be seen that the exponential function type I transition function has the maximum transient torque and the quadratic function type transition function has the minimum transient torque. In Fig. 10b, transitions to low flow, the quadratic function type transition function is used, which has the maximum transient head, and the exponential function type I transition function is used, which has the minimum transient torque.
The equation for the hydraulic efficiency of the hydraulic turbine is:
where,
There are three variables in Eq. (11), in addition to the transient torque M and head H, the volume flow rate q also varies with time, and the torque and head are monitored by setting formula in the numerical calculation of the transition process, and the obtained data are shown in Figs. 9 and 10, respectively. The mass flow rate is obtained according to Eqs. (1) to (8), and the mass flow rate curve is shown in Fig. 5. The mass flow rate is converted to the volume flow rate and substituted into Eq. (11) to obtain the change curve of the hydraulic turbine hydraulic efficiency during the transition of variable flow rate, as shown in Fig. 11.
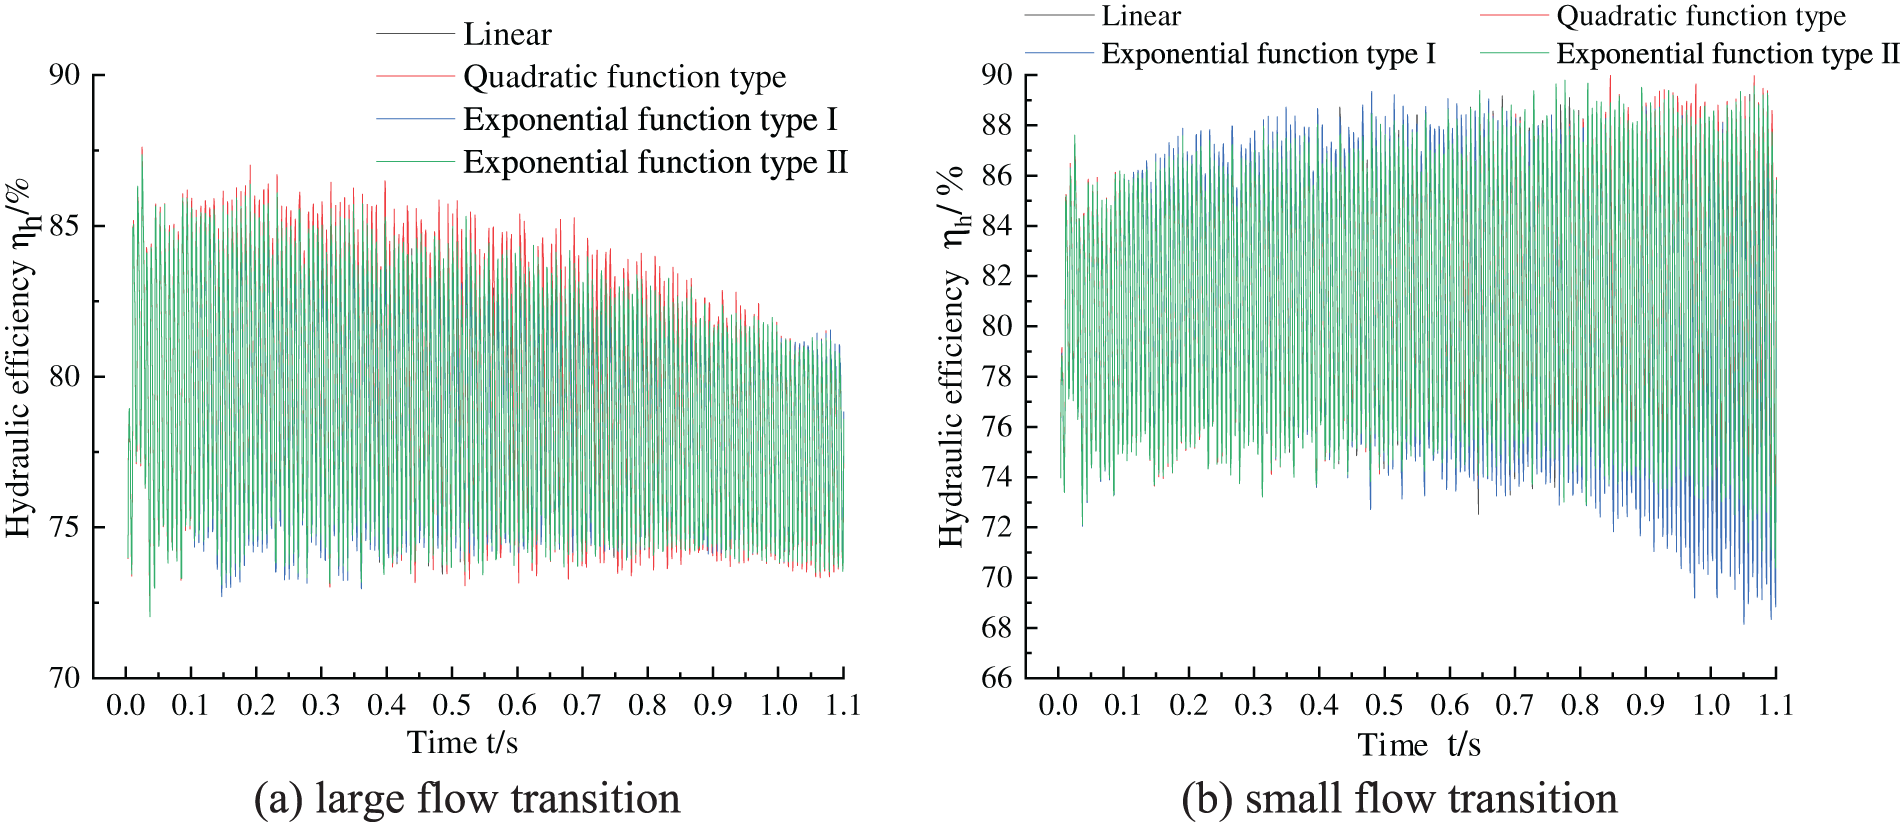
Figure 11: Transient hydraulic efficiency curve of transition process
Fig. 11a shows the hydraulic efficiency curve with time when different types of functions are adopted to large flow transition, it can be found that the maximum value of hydraulic efficiency in 0∼0.1 s, but in this time range of hydraulic efficiency fluctuations are also large, the reason is that the flow does not change during this time, the fluid flow pattern in the flow channel has been fully developed; after 0.1 s, with the increases of time, the peak of the hydraulic efficiency gradually decreases, and its fluctuation range is also gradually reduced, in the transition time period 0.1 to 1.1 s hydraulic efficiency trough value is basically stable at about 73%, At this time, the peak value of hydraulic efficiency in the transition from quadratic function to large flow rate is larger than the other three transition functions. Especially at 0.19 s, the hydraulic efficiency of the quadratic function transition is 4.11% larger than that of the exponential function I transition, and there is little difference between the trough values of the hydraulic efficiency using these four transition functions.
Fig. 11b shows the time-varying curve of hydraulic efficiency when different types of functions are used to transition to a low flow rate. It can be found that the fluctuation range of hydraulic efficiency in the transition to a low flow rate is larger than that in the transition to a large flow rate. As a result, the fluctuation range of hydraulic efficiency also gradually increases within this time range, especially after 0.5 s, the trough values of each transition function have an obvious decline range. In the transition period of 0.1–1.1 s, the trough value of hydraulic efficiency of the transition from exponential function type I to small flow rate is obviously smaller than that of the other three transition functions, that is, the fluctuation range of hydraulic efficiency of the transition from exponential function type I to small flow rate is the largest, and the hydraulic efficiency of the transition from exponential function type I to small flow rate is 7.8% smaller than that of the quadratic function type at 1.05 s. The peak values of hydraulic efficiency using these four transition functions have little difference.
In conclusion, during the transient transition process from the optimal working condition to large flow conditions, compared with the transient hydraulic efficiency in stable conditions, the hydraulic efficiency wave peak of the hydraulic turbine has a significant downward trend, while the size of the wave trough does not change much; while during the transient transition process from optimal condition to the small flow condition, in contrary to the large flow transition, the hydraulic efficiency wave trough of the hydraulic turbine has a significant downward trend, while the size of the wave peak size does not change much.
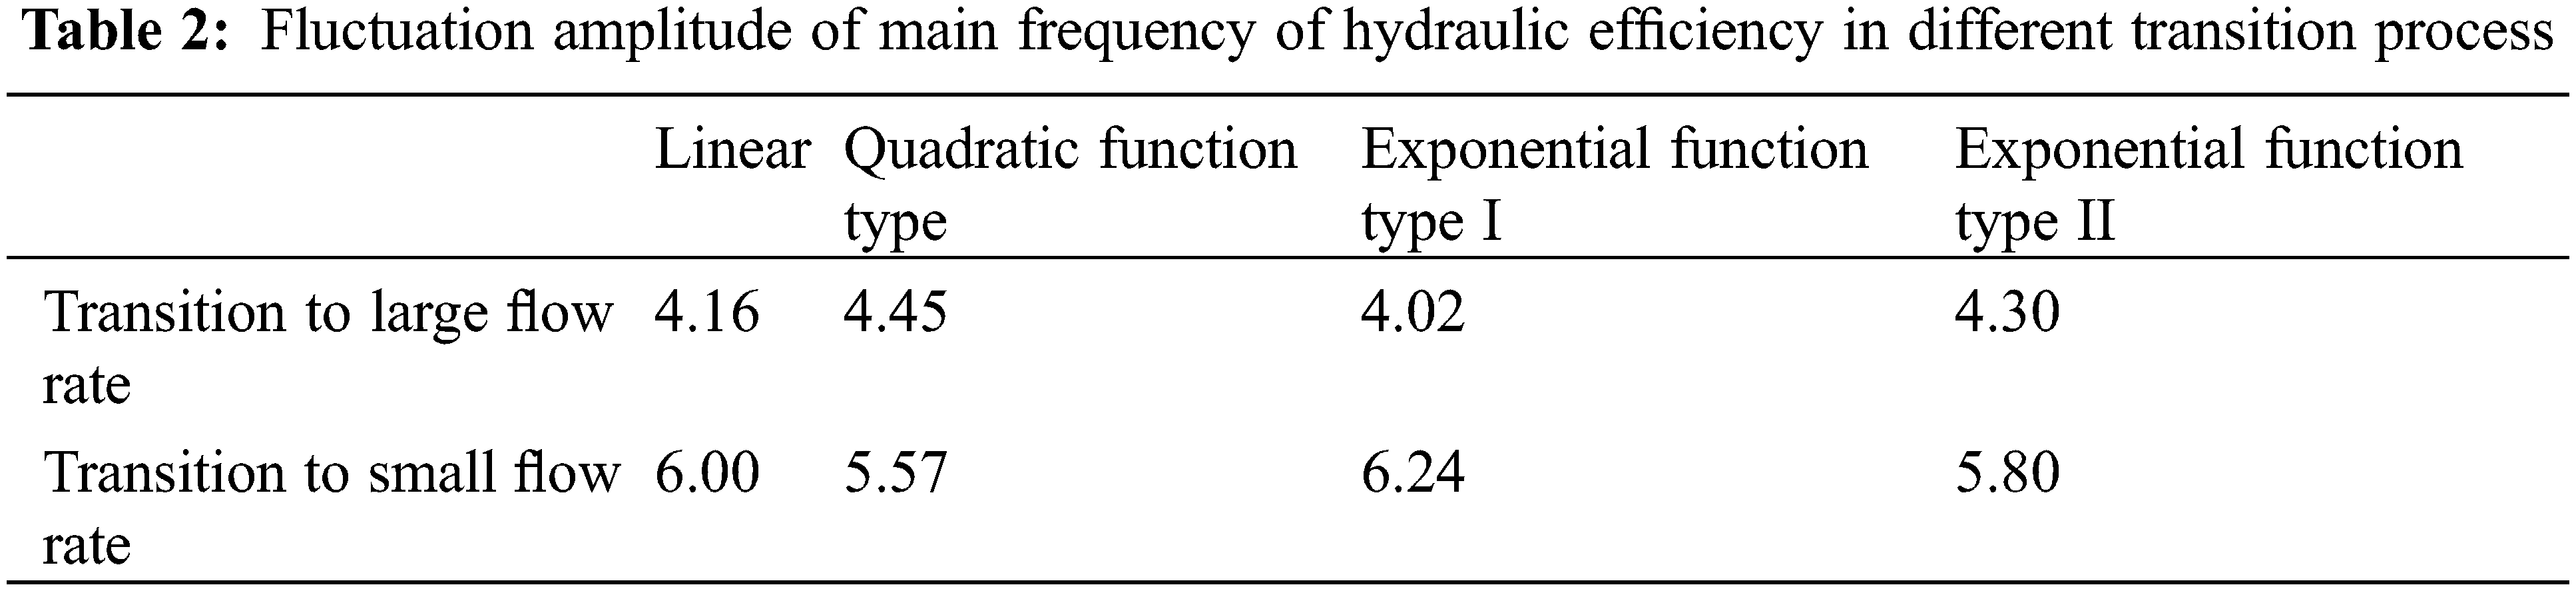
In order to further study the influence of different transition processes on the transient hydraulic efficiency of the hydraulic turbine, the hydraulic efficiency within 0 to 1.1 s was selected for analysis, and the fast Fourier transform (FFT) was used to obtain the frequency domain diagram of the transient hydraulic efficiency during the transition process of variable flow, as shown in Fig. 12, where the horizontal coordinate is frequency f and the vertical coordinate is the amplitude of the hydraulic efficiency pulsation, Figs. 12a and 12b represent the frequency domain diagrams of the large flow transition and small flow transition of the hydraulic efficiency of the frequency domain diagram. It is shown that the two transition process hydraulic efficiency pulsation main frequency is equal to the leaf frequency. Extract the pulsation amplitude at the main frequency of the hydraulic efficiency of the transition process of different variable flow as shown in Table 2. It can be found that the transition process to large flow rate using the quadratic function type pulsation amplitude is largest, using the exponential function I type pulsation amplitude, the difference between the two is 10.56%; to the small flow rate transition process using the exponential function I type pulsation amplitude is the largest, using the quadratic function type pulsation amplitude is the smallest, the difference between the two is 12.02%.
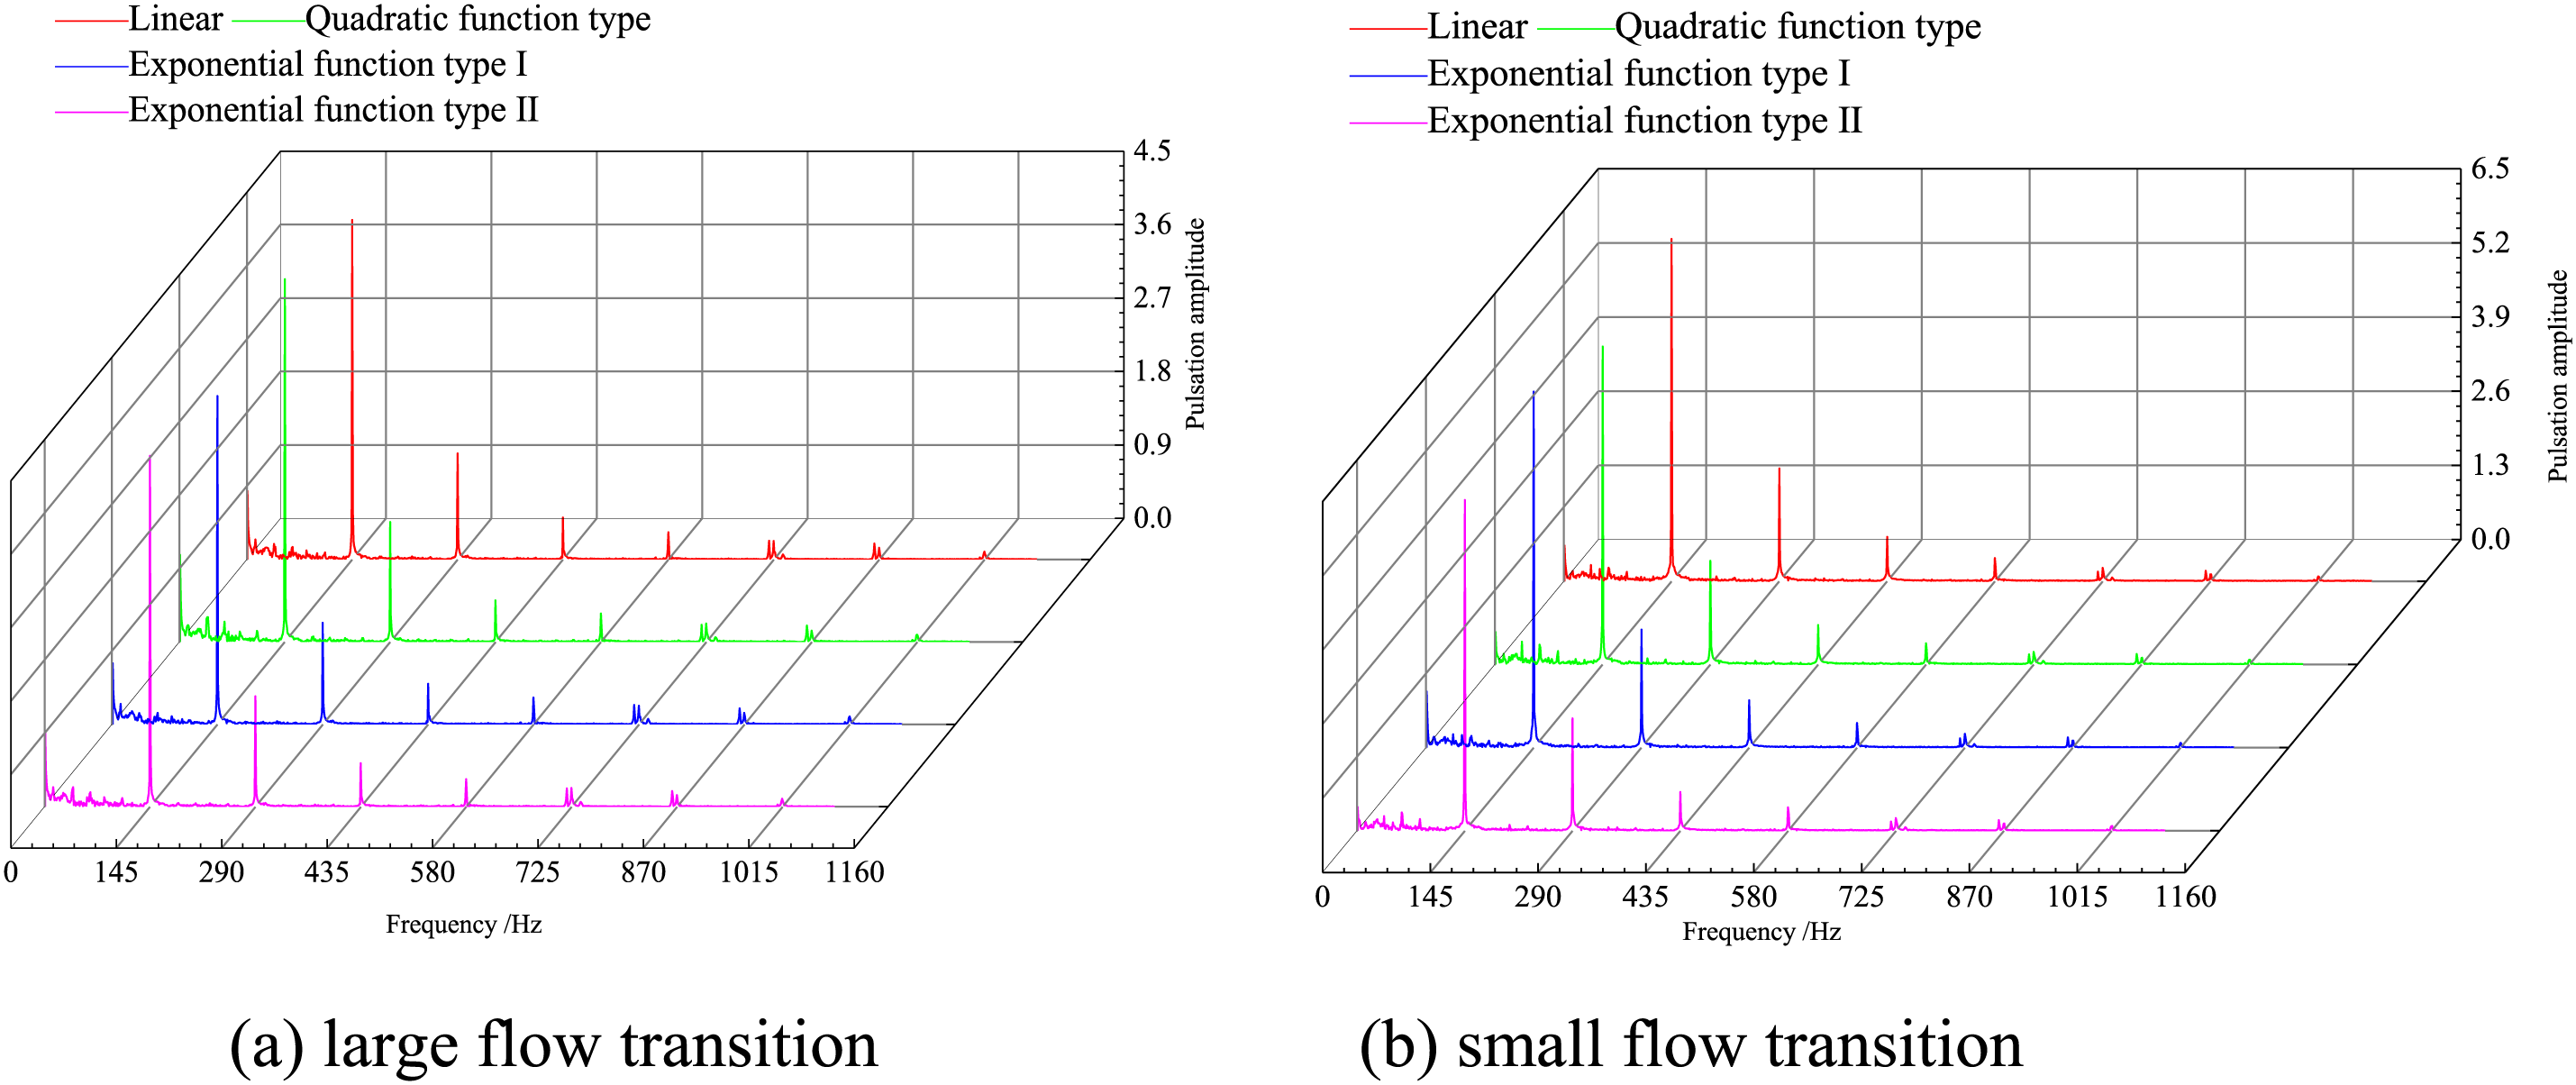
Figure 12: Frequency domain diagram of transient hydraulic efficiency in transition process flow
So in the transition process of variable flow, the hydraulic performance of the hydraulic turbine is not only affected by physical parameters such as pressure and flow, but also by the transition process characteristics, which are significantly different from the transient characteristics under stable working conditions, showing obvious transient characteristics of the transition process.
4.3 Transient Radial Force Characteristic Analysis
The transient radial force is the main cause of hydraulic vibration and noise in hydraulic turbines. In order to study the effect of different transition functions on the radial force of the hydraulic turbine, the data within the whole time period of 1.1 s were selected. Fig. 13 shows the change of radial force with time when different transition functions are used to large flow transition, the horizontal coordinate indicates the whole time period (0∼1.1 s), and the vertical coordinate indicates the radial force. It can be found that the radial force of different transition processes fluctuates up and down regularly with time; the radial force of different transition functions within 0∼0.1 s has basically the same trend of size change, and the radial force of different transition functions changes with time in stable working condition during this time, and changes in the large flow conditions after 0.1 s, the radial force wave peak of different transition function becomes larger with the increase of time, while the radial force wave valley value does not change much with the increase of time. That is, the radial force fluctuation range gradually increases with the increase of time. Comparing the radial force of different transition functions, it can be seen that the radial force wave peak of the radial force using the exponential function I type transition is obviously larger than the remaining three transition functions, and its radial force fluctuation range is larger than the remaining three transition functions, while the radial force wave peak of the radial force using the quadratic function type transition is the smallest compared with the remaining three transition functions, and the function range is the smallest.
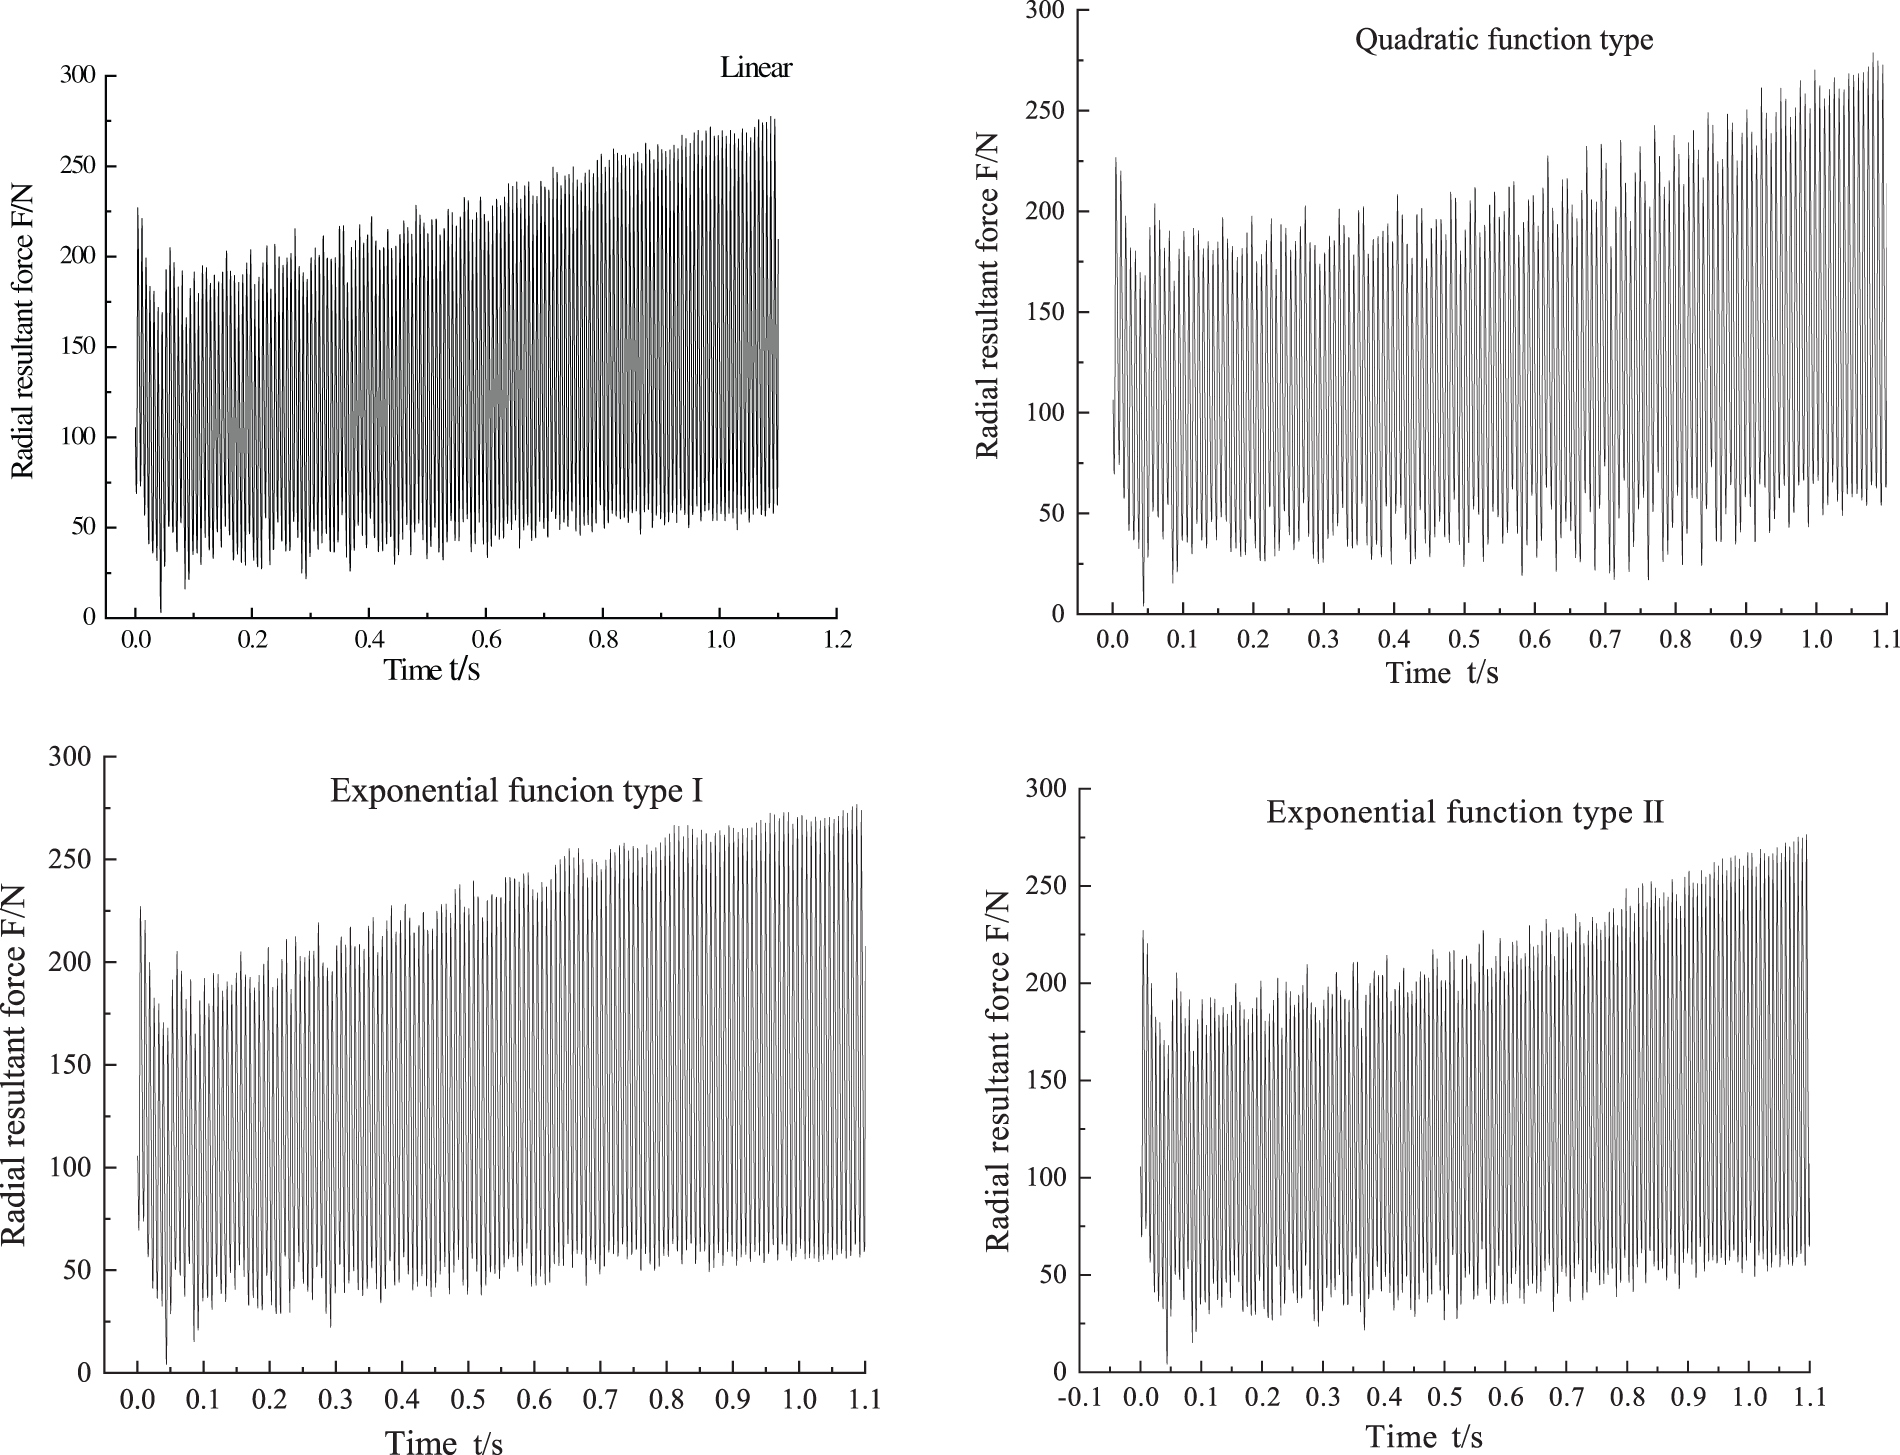
Figure 13: Time domain diagram of transient radial force during large flow transition
Fig. 14 shows the variation of the resultant radial forces with time when different transition functions are used to small flow transition, it can be found that the variation rule of the resultant radial forces is similar to that of transiting to a large flow rate. The change of radial force is basically the same in the four diagrams from 0∼0.1 s. The difference is the change to a small flow rate after 0.1 s: the variation law of linear and exponential function type I is similar, the resultant radial force peak decreases to the minimum value with the increase of time at 0.1∼1.02 s, and the resultant radial force peak increases from the minimum value with the increase of time at 1.02∼1.1 s. The quadratic function type and exponential function type II transition function have similar variation rules. The resultant radial force peak decreases slowly with the increase of time at 0.1∼1.02 s, but decreases sharply with the increase of time at 1.02∼1.1 s. The comparison shows that the fluctuation range of the radial force combine force with linear and exponential function I type transition is smaller, while the fluctuation range of the radial force combined force with quadratic function type and exponential function II type transition is larger.
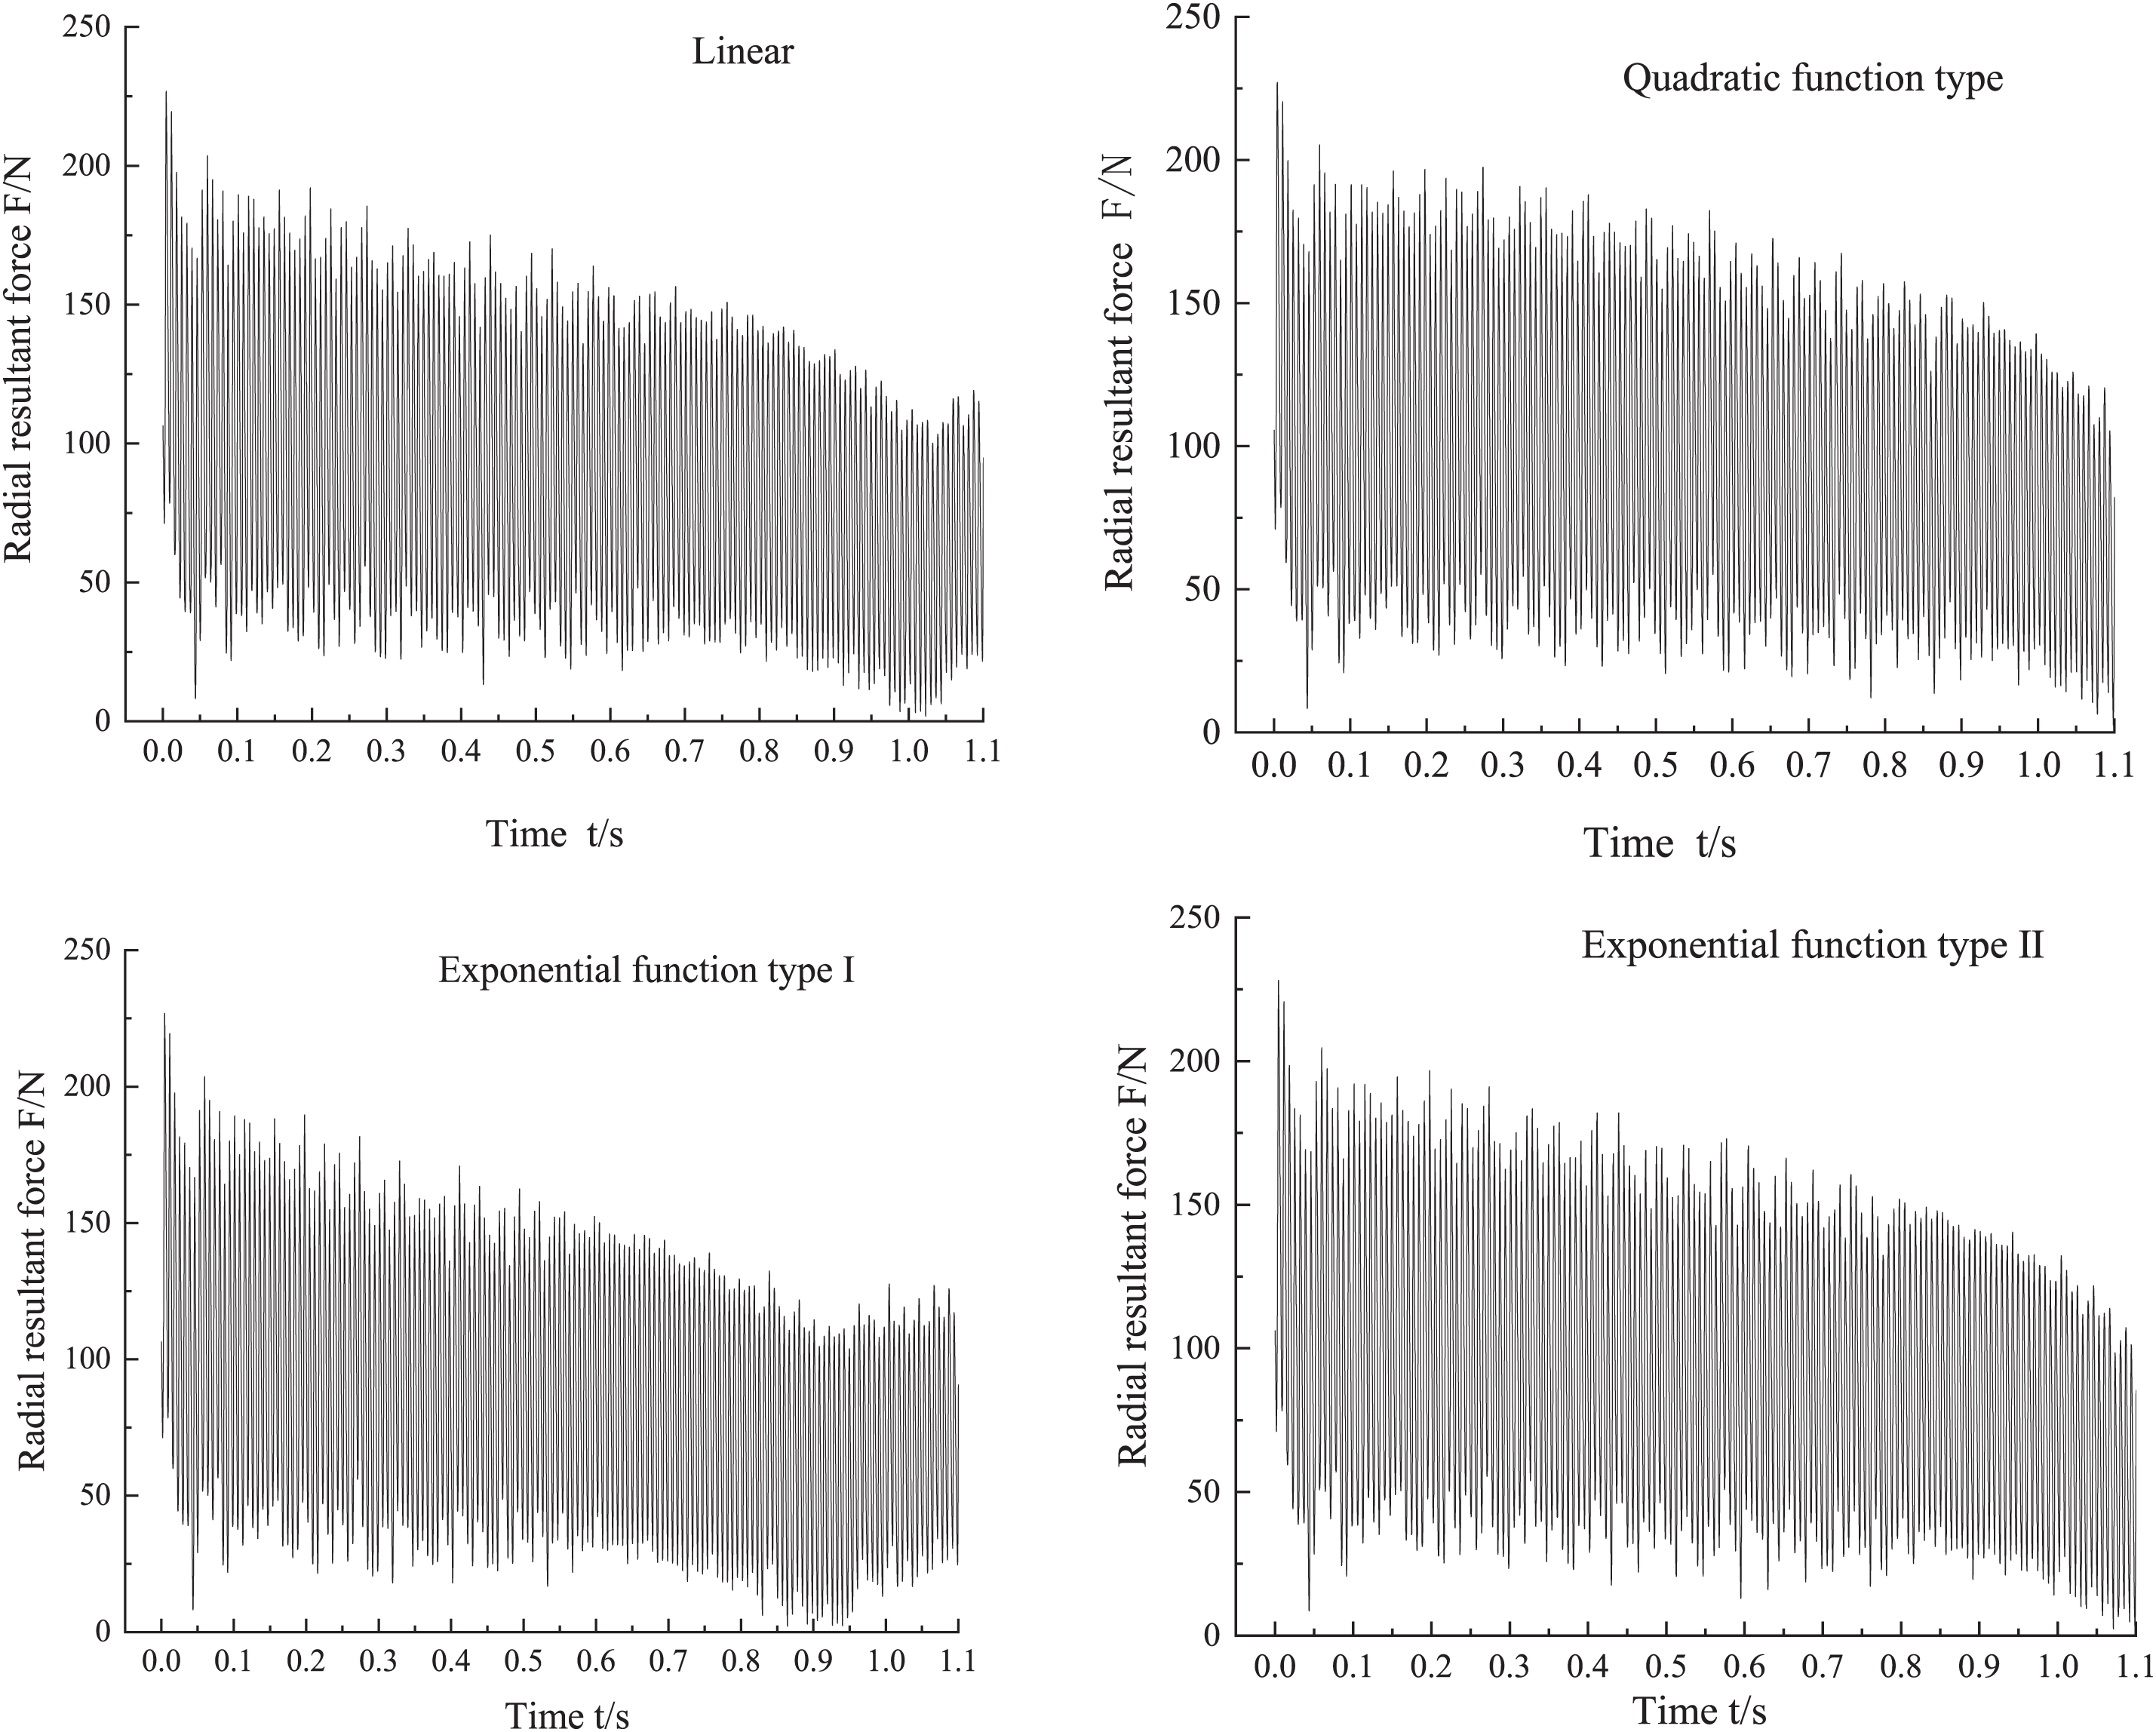
Figure 14: Time domain diagram of transient radial force during small flow transition
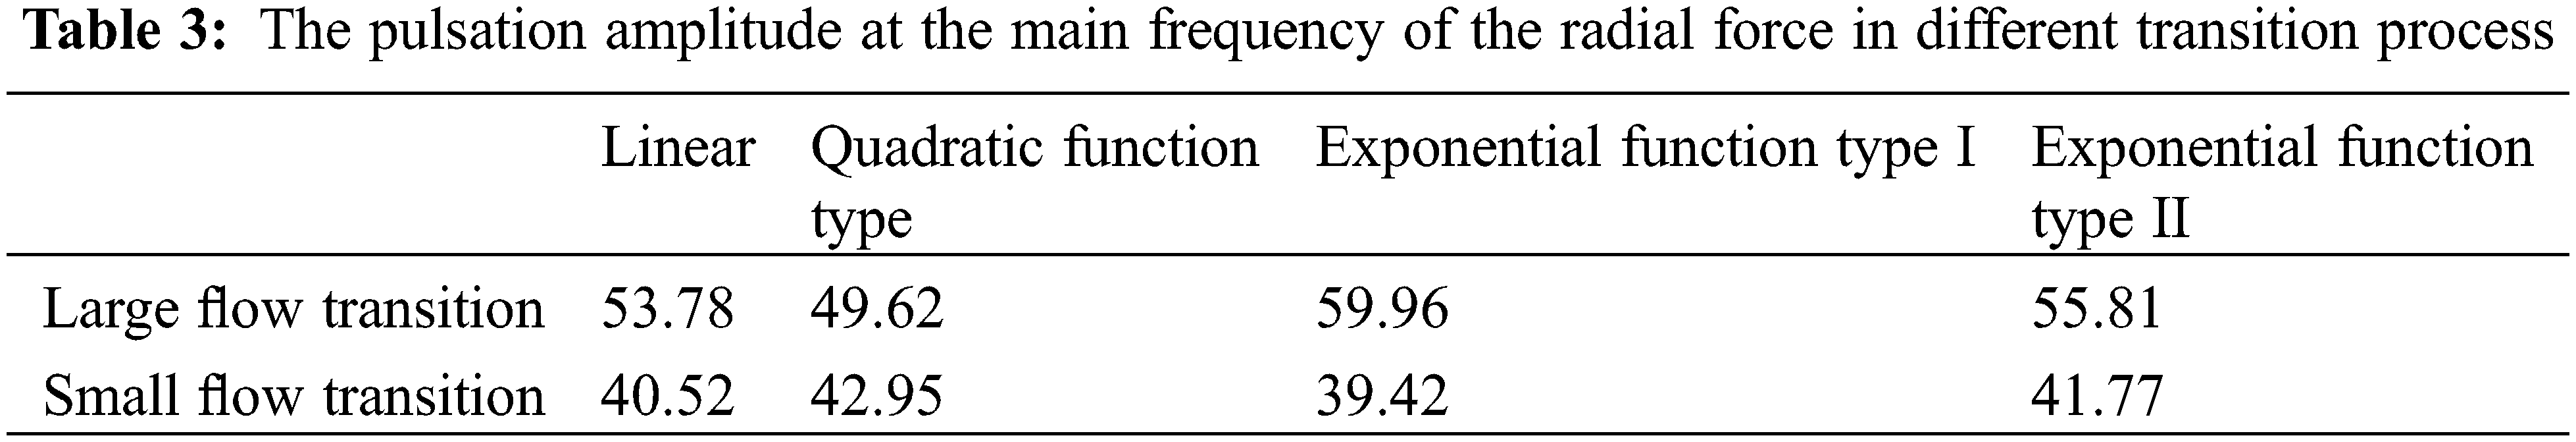
By applying fast Fourier transform (FFT) in the time domain of the transient radial force of the above transition process, the radial force frequency domain diagram of the whole transition process can be obtained, as shown in Fig. 15. Where, the x-coordinate is the ratio of frequency to blade frequency (f/fn), and the y-coordinate is the amplitude of the resultant pulsation of the radial force. It can be found that with different transition functions, the main frequency of radial force are one times blade frequency, and the secondary frequency is two times blade frequency. The radial force pulsation amplitudes of different transition functions at the main frequency were extracted, as shown in Table 3. In the large flow transition process, the fluctuation amplitude at the main frequency is the smallest when the quadratic transition function is used, and the fluctuation amplitude at the main frequency is the largest when the exponential function type I is used. The fluctuation amplitude of the main frequency of the exponential function type I is 20.83% larger than that of the quadratic transition function. During the small flow transition process, the fluctuation amplitude at the main frequency is the smallest when the exponential function type I is used, and the fluctuation amplitude at the main frequency is the largest when the quadratic transition function is used. The fluctuation amplitude of the main frequency of the quadratic transition function is 8.95% larger than that of the exponential function type I.
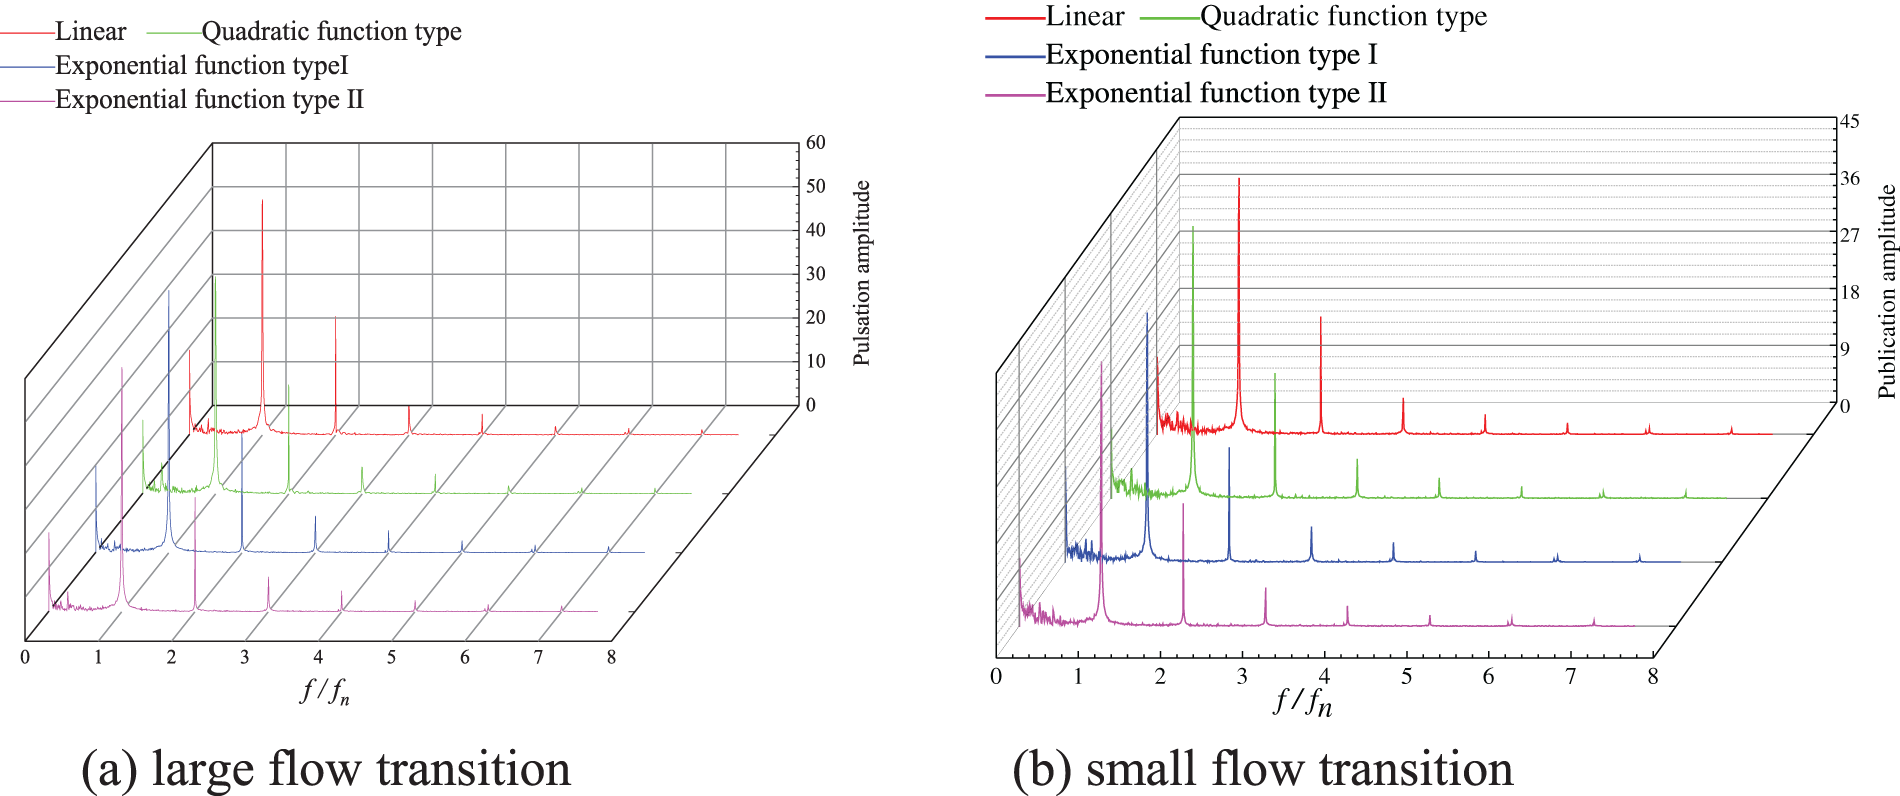
Figure 15: Frequency domain diagram of radial force in different variable flow transition process
By comparing the transient hydraulic performance and radial force characteristics of different transition functions, it is found that: the use of different transition functions has a significant impact on the transient performance of the hydraulic turbine, in the transition process to large flow rate, the use of quadratic function type is better than the other three transition functions, while in the transition process to small flow rate, the use of exponential function type I is better than the other three transition functions.
In this paper, by means of numerical calculation, the performance variation of hydraulic turbine under different functional functions is analyzed, which provides the basic theoretical support for the study of the operating stability of hydraulic turbines, and has certain guiding significance for the actual transition process of hydraulic turbines. The conclusions are as follows:
(1) Different transition functions have different effects on the instantaneous hydraulic performance of the turbine. When the quadratic function is used, the transition to large flow rate is the best, the pulsation amplitude of instantaneous hydraulic efficiency is the largest, and the radial force amplitude is the smallest. The main frequency fluctuation of type I exponential function is 20.83% larger than that of quadratic function. Using type I exponential function, the small flow transition is the best, the main frequency instantaneous hydraulic efficiency pulsation amplitude is the largest, the radial force pulsation amplitude is the smallest, and the main frequency fluctuation amplitude of quadratic function is 8.95% larger than that of type I exponential function.
(2) In the process of transition to large flow, instantaneous head value and instantaneous torque value change with the change of time, and increase with the positive slope curve of approximate primary function. In the process of transition to low flow, the instantaneous head value and the instantaneous torque value change with time and decrease with the negative slope curve of the approximate first function. Additional head occurs when the instantaneous head value increases or decreases. At the same time, the fluctuation of instantaneous radial net force increases when the flow is transferred to a large flow. The fluctuation range of instantaneous hydraulic efficiency decreases. The fluctuation range of instantaneous radial resultant force decreases when the flow rate is low. The fluctuation range of instantaneous hydraulic efficiency increases.
Funding Statement: This work is financially supported by Gansu Province Key Research and Development Plan Projects (20YF3GA019), Gansu Province Science and Technology Project (20JR5RA447, 20JR10RA174, 20JR10RA203), Gansu Province Colleges and Universities Industrial Support Program Projects (2020C-20) and Key Laboratory of Fluid and Power Machinery, Ministry of Education, Xihua University (szjj2019-016, LTDL2020-007).
Conflicts of Interest: The authors declare that they have no conflicts of interest to report regarding the present study.
References
1. Adu, D., Du, J. G., Darko, R. O., Boamah, K. B., A-Boateng, E. (2020). Investigating the state of renewable energy and concept of pump as turbine for energy generation development. Energy Reports, 6(S6), 152–173. [Google Scholar]
2. Angelo, A., Demetrio, A. Z., Angelo, N., Santo, Z. M. (2020). Potential energy exploitation in collective irrigation systems using pumps as turbines: A case study in Calabria (Southern Italy). Journal of Cleaner Production, 257. [Google Scholar]
3. Sanjay, J. V., Rajesh, P. N. (2014). Investigations on pump running in turbine mode: A review of the state-of-the-art. Renewable & Sustainable Energy Reviews, 30, 841–868. [Google Scholar]
4. Jaeger, E. U., Seidel, U. (1999). Pressure fluctuation in Francis turbines. Voith Hydro Internal Report, Idaho. [Google Scholar]
5. Zhang, Y. L. (2013). Transient internal flow and performance of centrifugal pumps during startup period. Zhejiang University, China. [Google Scholar]
6. Afshar, M. H., Rohani, M., Taheri, R. (2010). Simulation of transient flow in pipeline systems due to load rejection and load acceptance by hydroelectric power plants. International Journal of Mechanical Sciences, 52(1), 103–115. [Google Scholar]
7. Dazin, A., Caignaert, G., Bois, G. (2007). Transient behavior of turbomachineries: Applications to radial flow pump startups. Journal of Fluids Engineering, 129(11), 1436–1444. [Google Scholar]
8. Teiichi, T., Naoto, T. (2019). Transient characteristics of a centrifugal pump at rapid startup. IOP Conference Series: Earth and Environmental Science, 240(5). [Google Scholar]
9. Tsukamoto, H., Yoneda, H., Sagara, K. (1995). The response of a centrifugal pump to fluctuating rotational speed. Journal of Fluids Engineering, 117(3), 479–484. [Google Scholar]
10. Wang, X. L., Yuan, S. Q., Zhu, R. S., Fu, Q., Yu, Z. J. (2012). Transient hydraulic characterristics of a centrifugal pump under variable working conditions. Journal of Vibration and Shock, 31(24), 48–53. [Google Scholar]
11. Wang, X. L., Yuan, S. Q., Zhu, R. S., Fu, Q., Yu, Z. J. (2013). Transient hydraulic characteristics of nuclear reactor coolant pump in variableflow transient process. Atomic Energy Science and Technology, 47(7), 1169–1174. [Google Scholar]
12. Wang, Y. Y. (2018). Investigation on transient behavior of reactor coolant pump and system (Master Thesis). Dalian University of Technology, China. [Google Scholar]
13. Wang, X. L., Yuan, S. Q., Zhu, R. S., Fu, Q., Wang, J. G. (2014). Effect of number of blades on reactor coolant pump radial force under variable flow transition conditions. Journal of Vibration and Shock, 33(21), 51–59. [Google Scholar]
14. Su, X. H. (2016). Research on the variable rotation speed and transient process of centrifugal pump as turbine system (Ph.D. Thesis). South China University of Technology, China. [Google Scholar]
15. Wang, X. H., Yang, J. H., Guo, Y. L., Xia, Z. T., Miao, S. C. (2018). Research on slip phenomenon of pumps as turbines. Journal of Mechanical Engineering, 54(24), 189–196. [Google Scholar]
16. Launder, B. E., Spalding, D. B. (1974). The numerical computation of turbulent flows. Computer Methods in Applied Mechanics and Engineering, 3(2), 269–289. [Google Scholar]
17. Zhou, S. Q., Kong, F. Y., Wang, Z. Q., Yi, C. L., Zhang, Y. (2011). Numerical simulation for low specific-speed centrifugal pump with structured grid. Transactions of the Chinese Society of Agricultural Machinery, 42(7), 66–69. [Google Scholar]
18. Zhao, B. J., Yuan, S. Q., Chen, H. L. (2009). Unsteady flow characteristics in double-channel pumps based on sliding mesh. Transactions of the Chinese Society of Agricultural Machinery, 25(6), 115–119+318. [Google Scholar]
19. Wang, L. Q., Wu, D. Z. (2003). Transients during rapid load changes in a mixed flow pump circuit experimental study of the characteristics. General Machinery, (2), 65–68. [Google Scholar]
20. Tsujimoto, Y., Yoshida, Y. (1982). An analysis of unsteady torque on a two-dimensional radial impeller. Journal of Fluids Engineering, 104(2), 228–234. [Google Scholar]
Cite This Article
 Copyright © 2023 The Author(s). Published by Tech Science Press.
This work is licensed under a Creative Commons Attribution 4.0 International License , which permits unrestricted use, distribution, and reproduction in any medium, provided the original work is properly cited.
 Downloads
 Citation Tools