
 Submit a Paper
 Propose a Special lssue
 Open Access
ARTICLE

A Research on the Air Permeability of High Polymer Materials Used to Produce Sports Clothing Fabrics
1 National Sports Culture Institute of Gansu Normal College for Nationalities, Hezuo, 747000, China
2 Lanzhou University of Finance and Economics, Lanzhou, 747000, China
* Corresponding Author: Fawei Li. Email:
(This article belongs to the Special Issue: Advanced Materials, Processing and Testing Technology)
Fluid Dynamics & Materials Processing 2023, 19(5), 1173-1187. https://doi.org/10.32604/fdmp.2022.021140
Received 29 December 2021; Accepted 22 April 2022; Issue published 30 November 2022
 View Full Text
 Download PDF
Abstract
Composite fabrics based on Polytetrafluoroethylene (PTFE) polymer displays several notable properties. They are waterproof, windproof, permeable to moisture and thermally insulating at the same time. In the present study, PTFE fibers are used as raw material to make fiber membranes. The film is formed by crisscrossing interconnected fiber filaments and the related air permeability: tensile creep characteristics and other properties are tested. The results show that the pore size, thickness, and porosity of the film itself can affect the moisture permeability of the film. The water pressure resistance of the selected fabric is 8.5 kPa, and the moisture permeability is 7038 g/(m2·24 h).Keywords
Polytetrafluoroethylene (PTFE) polymer material has become a vital fiber chemical product because of its excellent chemical properties [1]. It has important applications in environmental protection, defense, clothing fabrics, medical and other fields. The preparation methods of PTFE fiber mainly include carrier spinning, paste extrusion, and cutting film cracking methods. Among them, the cutting film cracking method refers to fusing the PTFE powder into a cylindrical blank and then cutting it into a film with a certain thickness [2]. It is then split into filaments by a serrated cutter, sintered, and then stretched and heat-treated to obtain PTFE fibers finally.
The current research on PTFE materials mainly includes PTFE fiber processing and molding methods, PTFE membrane filter materials, and PTFE nonwoven fabrics and fabric preparation [3]. However, the strength of PTFE film is low and cannot be used alone. Therefore, this article will explore carding and hot rolling to prepare PTFE fiber film. The preparation process makes it possess a certain strength and filtering precision, so it is suitable for the field of acid-base corrosive liquid filtering.
2 Preparation of PTFE Fiber and Its Hot-Rolled Fiber Membrane
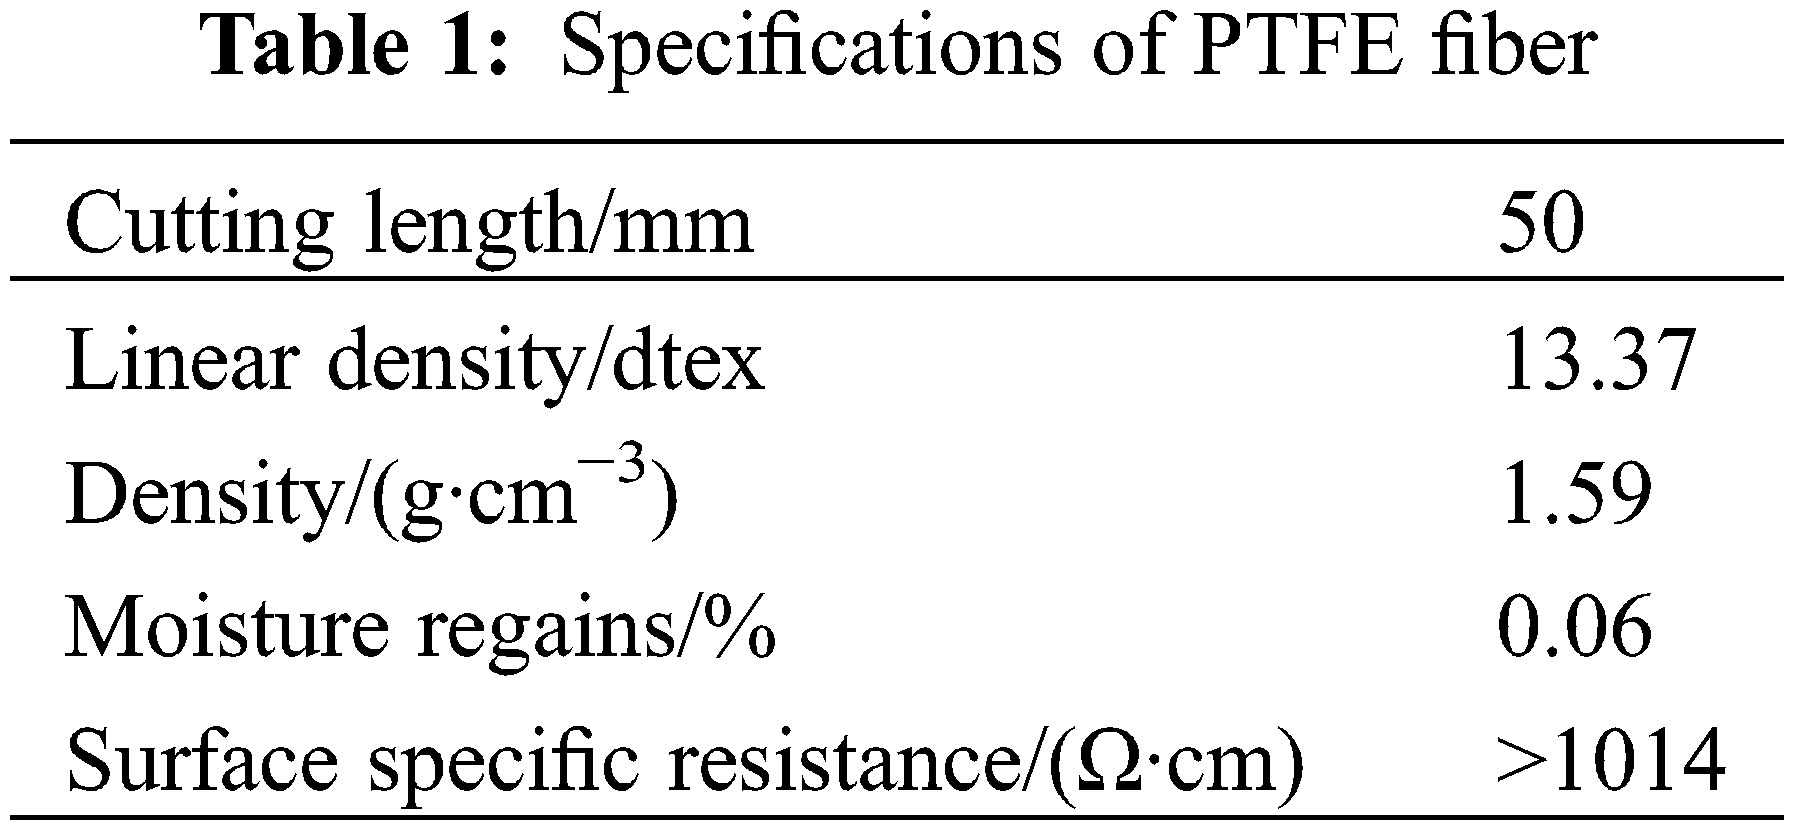
The test uses PTFE fiber as raw material, and its basic parameters are shown in Table 1.
2.2 Preparation of PTFE Hot-Rolled Fiber Membrane
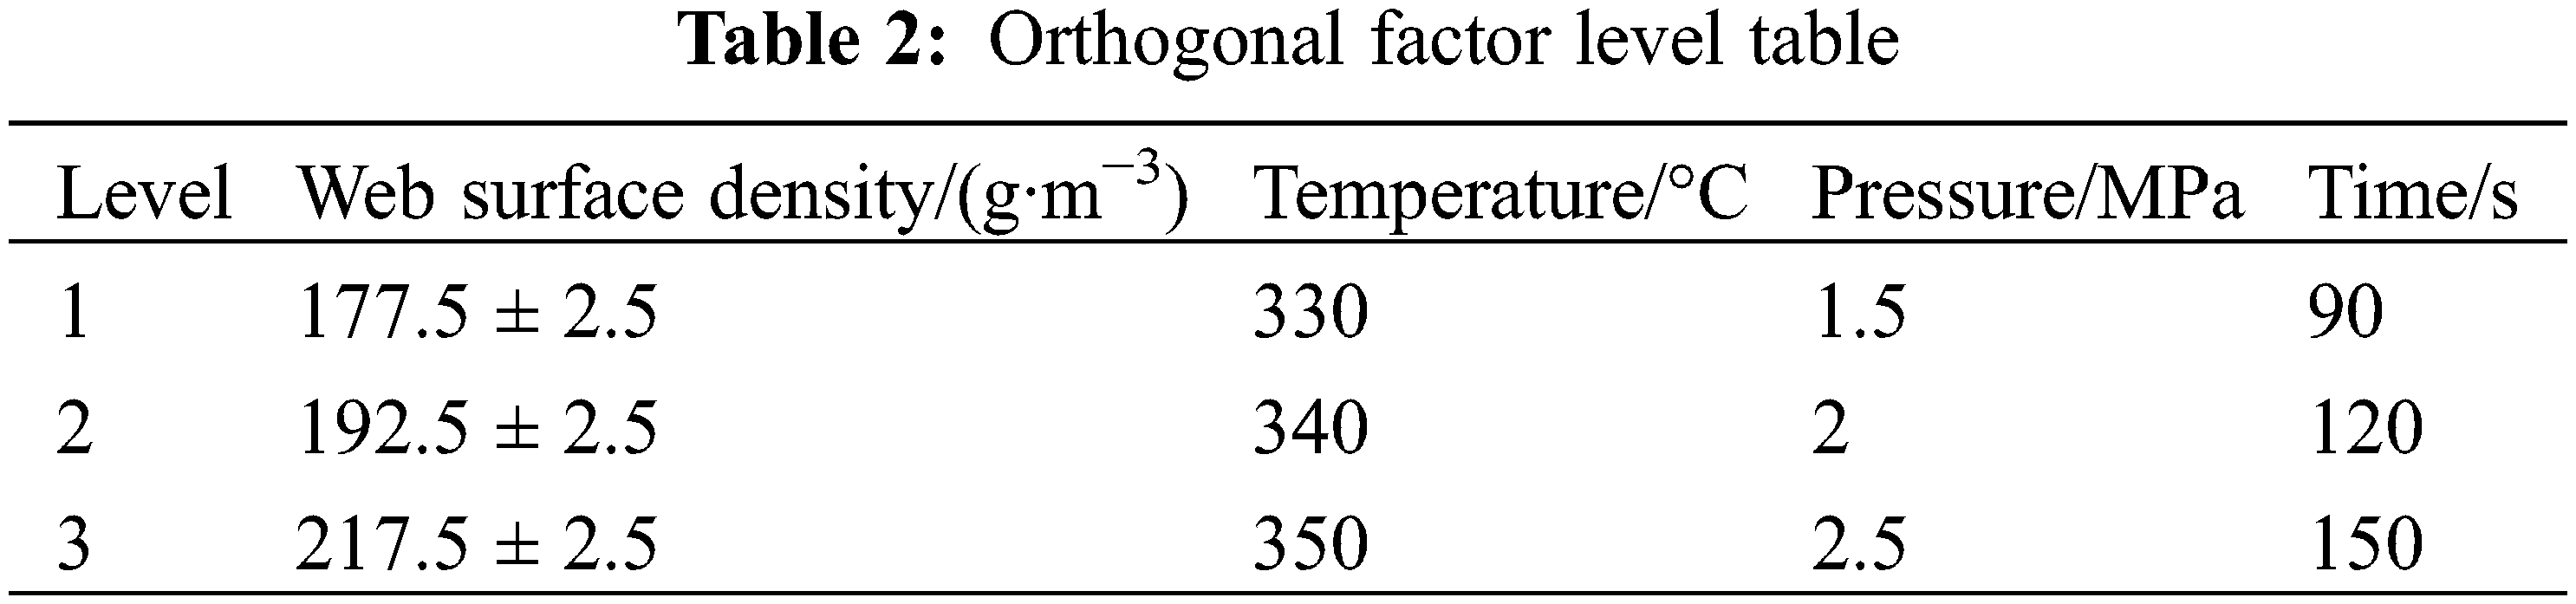
We use a hot rolling process to prepare PTFE fiber membranes. We choose the areal density of the web and the temperature, pressure, and time of the hot rolling process as the investigation factors [4]. The purpose is to analyze the influence of preparation conditions on the performance of PTFE fiber membranes. Choose 3 levels for each factor. We use the L34 orthogonal table to test (Table 2).
3 PTFE Hot Rolled Fiber Membrane Structure and Performance Test
We use the TM3000 scanning electron microscope to observe the PTFE hot-rolled fiber membrane [5]. Before the test, the PTFE hot-rolled fiber membrane sample was on the stage to spray gold.
We refer to GB/T24218.2-2009 and use the YG141N digital fabric thickness meter to test the PTFE hot-rolled fiber membrane [6]. The presser foot area is 100 mm2, and the weight of the presser foot is 100 cN. Repeat the test 15 times and take the average value.
We refer to GB/T5433-1997 and use the YG461E automatic air permeability meter to test the air permeability of the PTFE hot-rolled fiber membrane. The caliber of the instrument is 3 mm. The pressure difference is 200 PA. The sample size is 25 cm × 25 cm. Repeat the test 20 times and take the average value.
We use a PMICFP-1100AI type aperture analyzer. At the same time, the bubble point method was used to test the pore size of 9 samples. The sample is fully infiltrated with a known surface tension wetting agent and then placed in the sample chamber [7]. The gas passes through the pores of the sample in the dry state and the wet state under pressure. The pore size and distribution of the sample are obtained by calculating the pressure and airflow changes when the gas passes through the sample.
Porosity refers to the percentage of the pore volume in the film-like material to the total volume of the material in its natural state. We use FA2004A electronic balance to test the areal density of the PTFE hot-rolled fiber membrane. The calculation of porosity is shown in formula (1).
We refer to GB/T1040.1-2006 and use the YG026N electronic fabric strength tester to test the tensile properties of the samples. The sample width is 1 cm. The clamping distance is 10 cm. The stretching speed is 100 mm/min. Repeat the test 5 times and take the average value [8]. The creep model of fabric material can be divided into empirical and physical models. The expression of the creep strain
Assuming that
W,
3.7 Resistance to Acid and Alkali Corrosion
We use 30% and 60% H2SO4 and NaOH solutions, respectively. The PTFE hot-rolled fiber membrane prepared under the same hot-rolling conditions is soaked for about 24 h at room temperature [10]. We test its breaking strength and strength retention rate. The strength retention rate
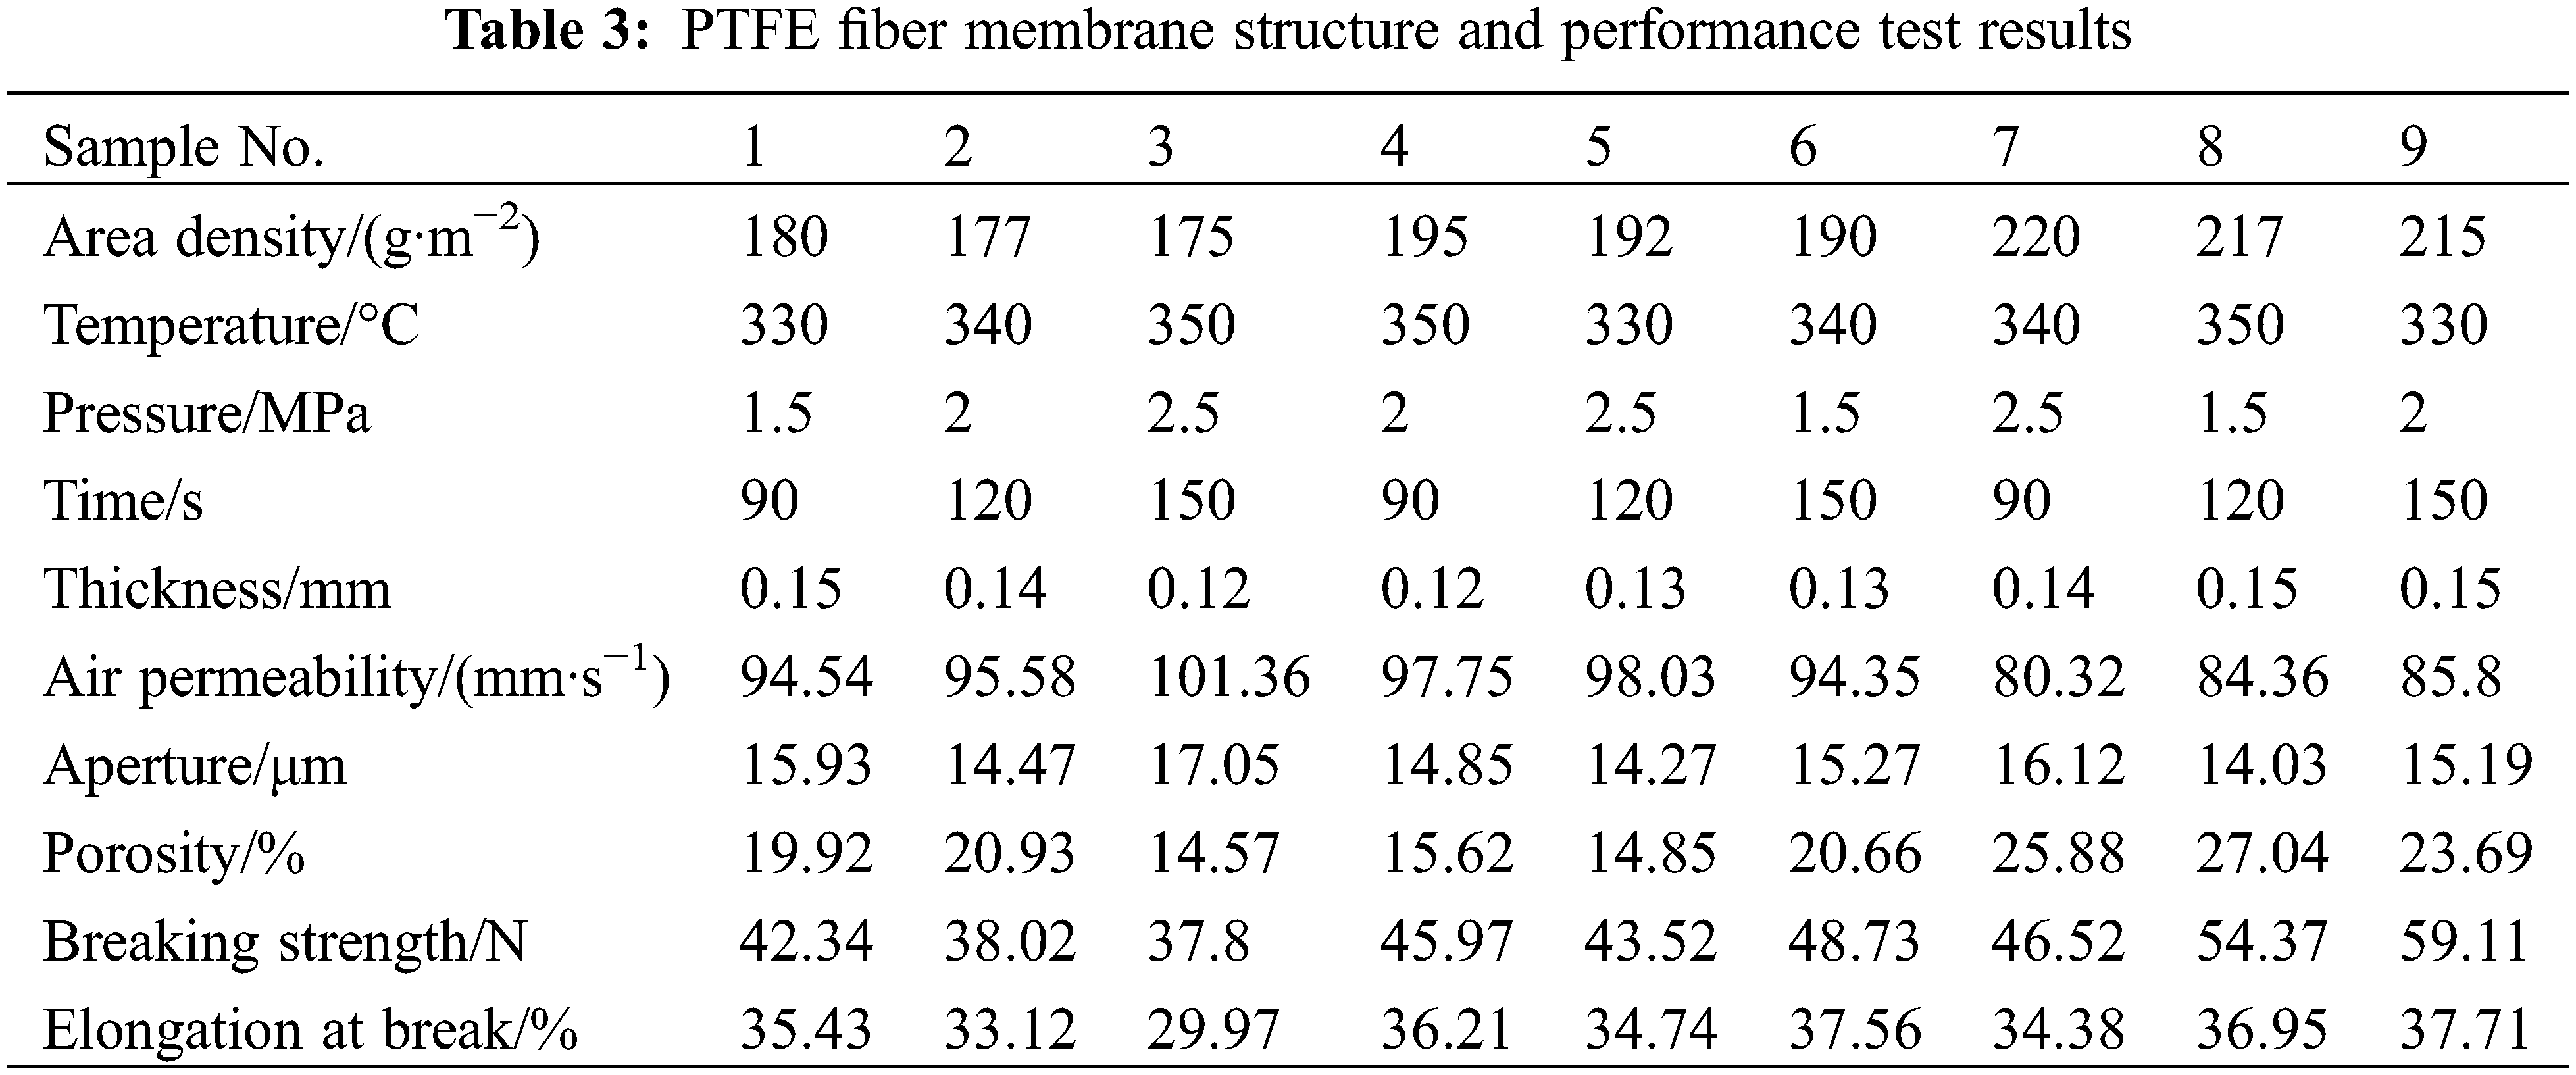
The test results of the structure and performance of 9 kinds of PTFE fiber membranes are shown in Table 3. It can be seen from Table 3 that the thickness of the PTFE fiber membrane is 0.12–0.15 mm. The air permeability is 80–101 mm/s. The pore size is 14–17 μm. The porosity is 14.57%–27.04%. The breaking strength is 38–59 N. The elongation at break is 30%–38%.
4.1 Observation of Apparent Morphology
We used the hot rolling process to prepare 9 PTFE hot rolled fiber membrane samples. Naked eyes observe no obvious difference on the sample’s surface. Therefore, we select sample 1 to observe its surface morphology [11]. The result is shown in Fig. 1.
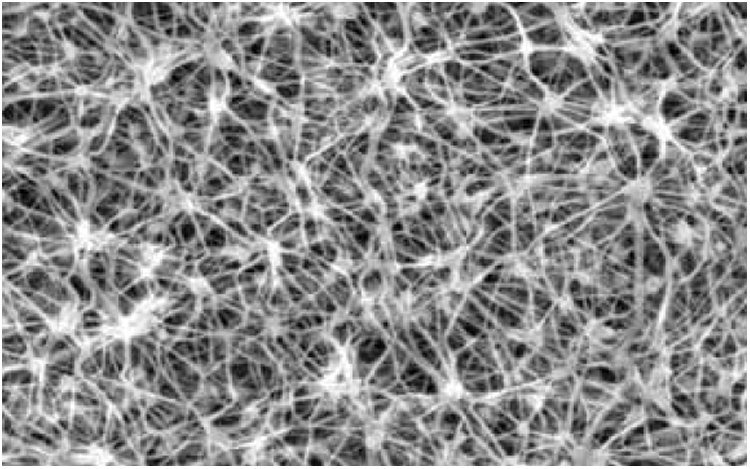
Figure 1: Surface morphology of PTFE fiber membrane
Part of the fibers is squashed and melted under the high temperature and pressure of the hot rolling process to produce thermal bonding. However, there are still a lot of voids between the fibers, and some fiber boundaries are still clear [12]. Most of the melted fibers are located on the surface of the PTFE hot-rolled fiber membrane.
We use range analysis to explore the influence of web density, temperature, pressure, and time on thickness. The results are shown in Table 4.
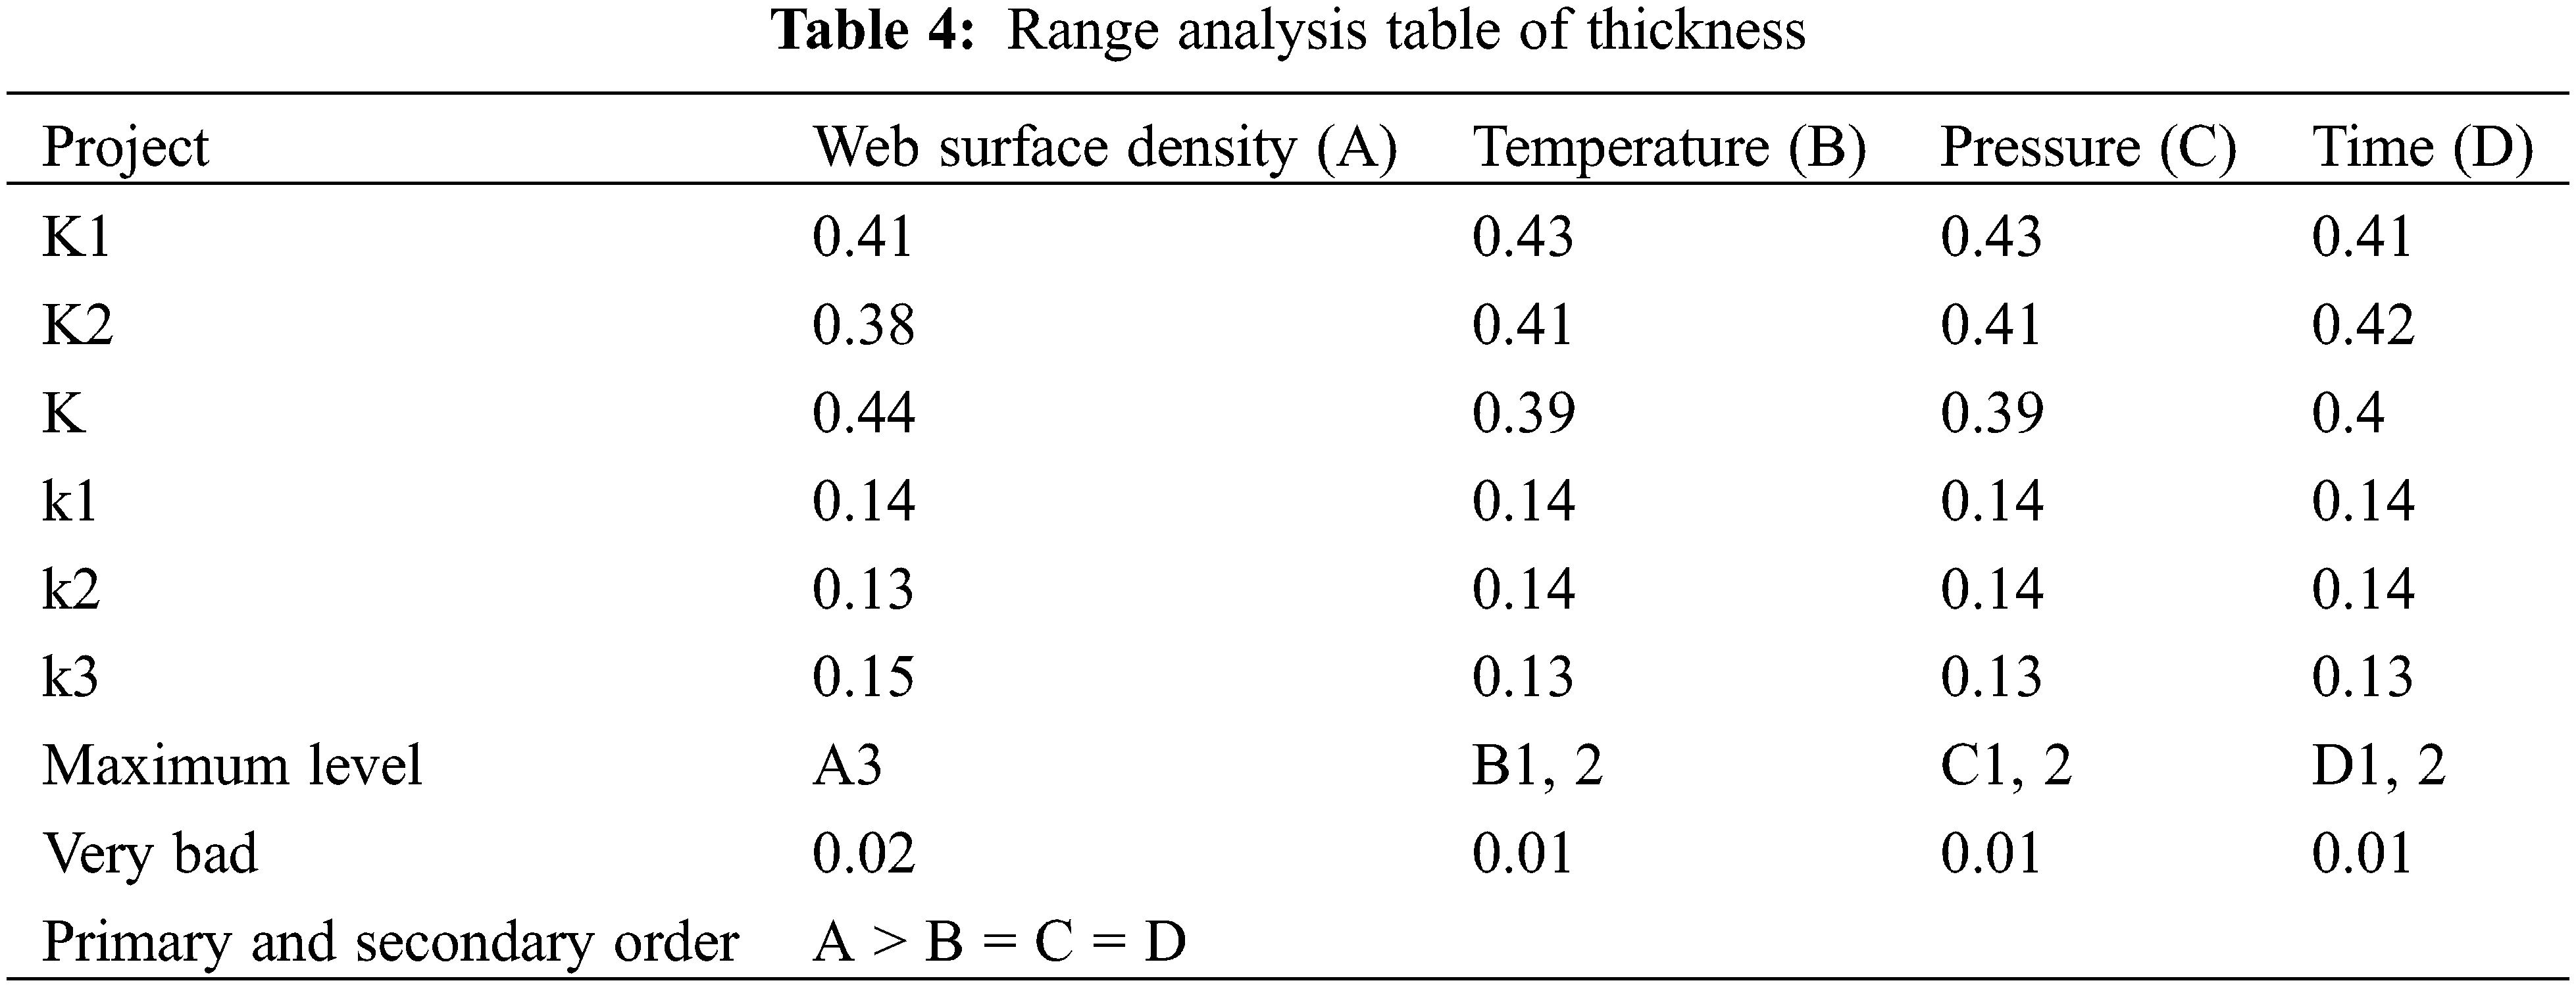
It can be seen from Table 4 that the surface density of the fiber web is the primary factor affecting the thickness of the fiber membrane. The effect of hot rolling temperature, pressure, and time on the thickness of the fiber film has no significant difference [13]. The thickness of the fiber membrane is the largest when the web surface density is (217.5 ± 2.5) g/m2. The thickness of the fiber membrane is the largest when the surface density of the fiber web is at its maximum level. When the web surface density is at the minimum level, the corresponding hot rolling conditions are also at the minimum level, so the degree of fiber melting is low. The thickness of the fiber membrane shows a decreasing trend with the increase of hot rolling temperature and hot rolling pressure. Higher hot rolling temperature and pressure will make the fiber film melt more completely and reduce the thickness.
We explore the effects of web density, temperature, pressure, and time on-air permeability. The results are shown in Table 5.
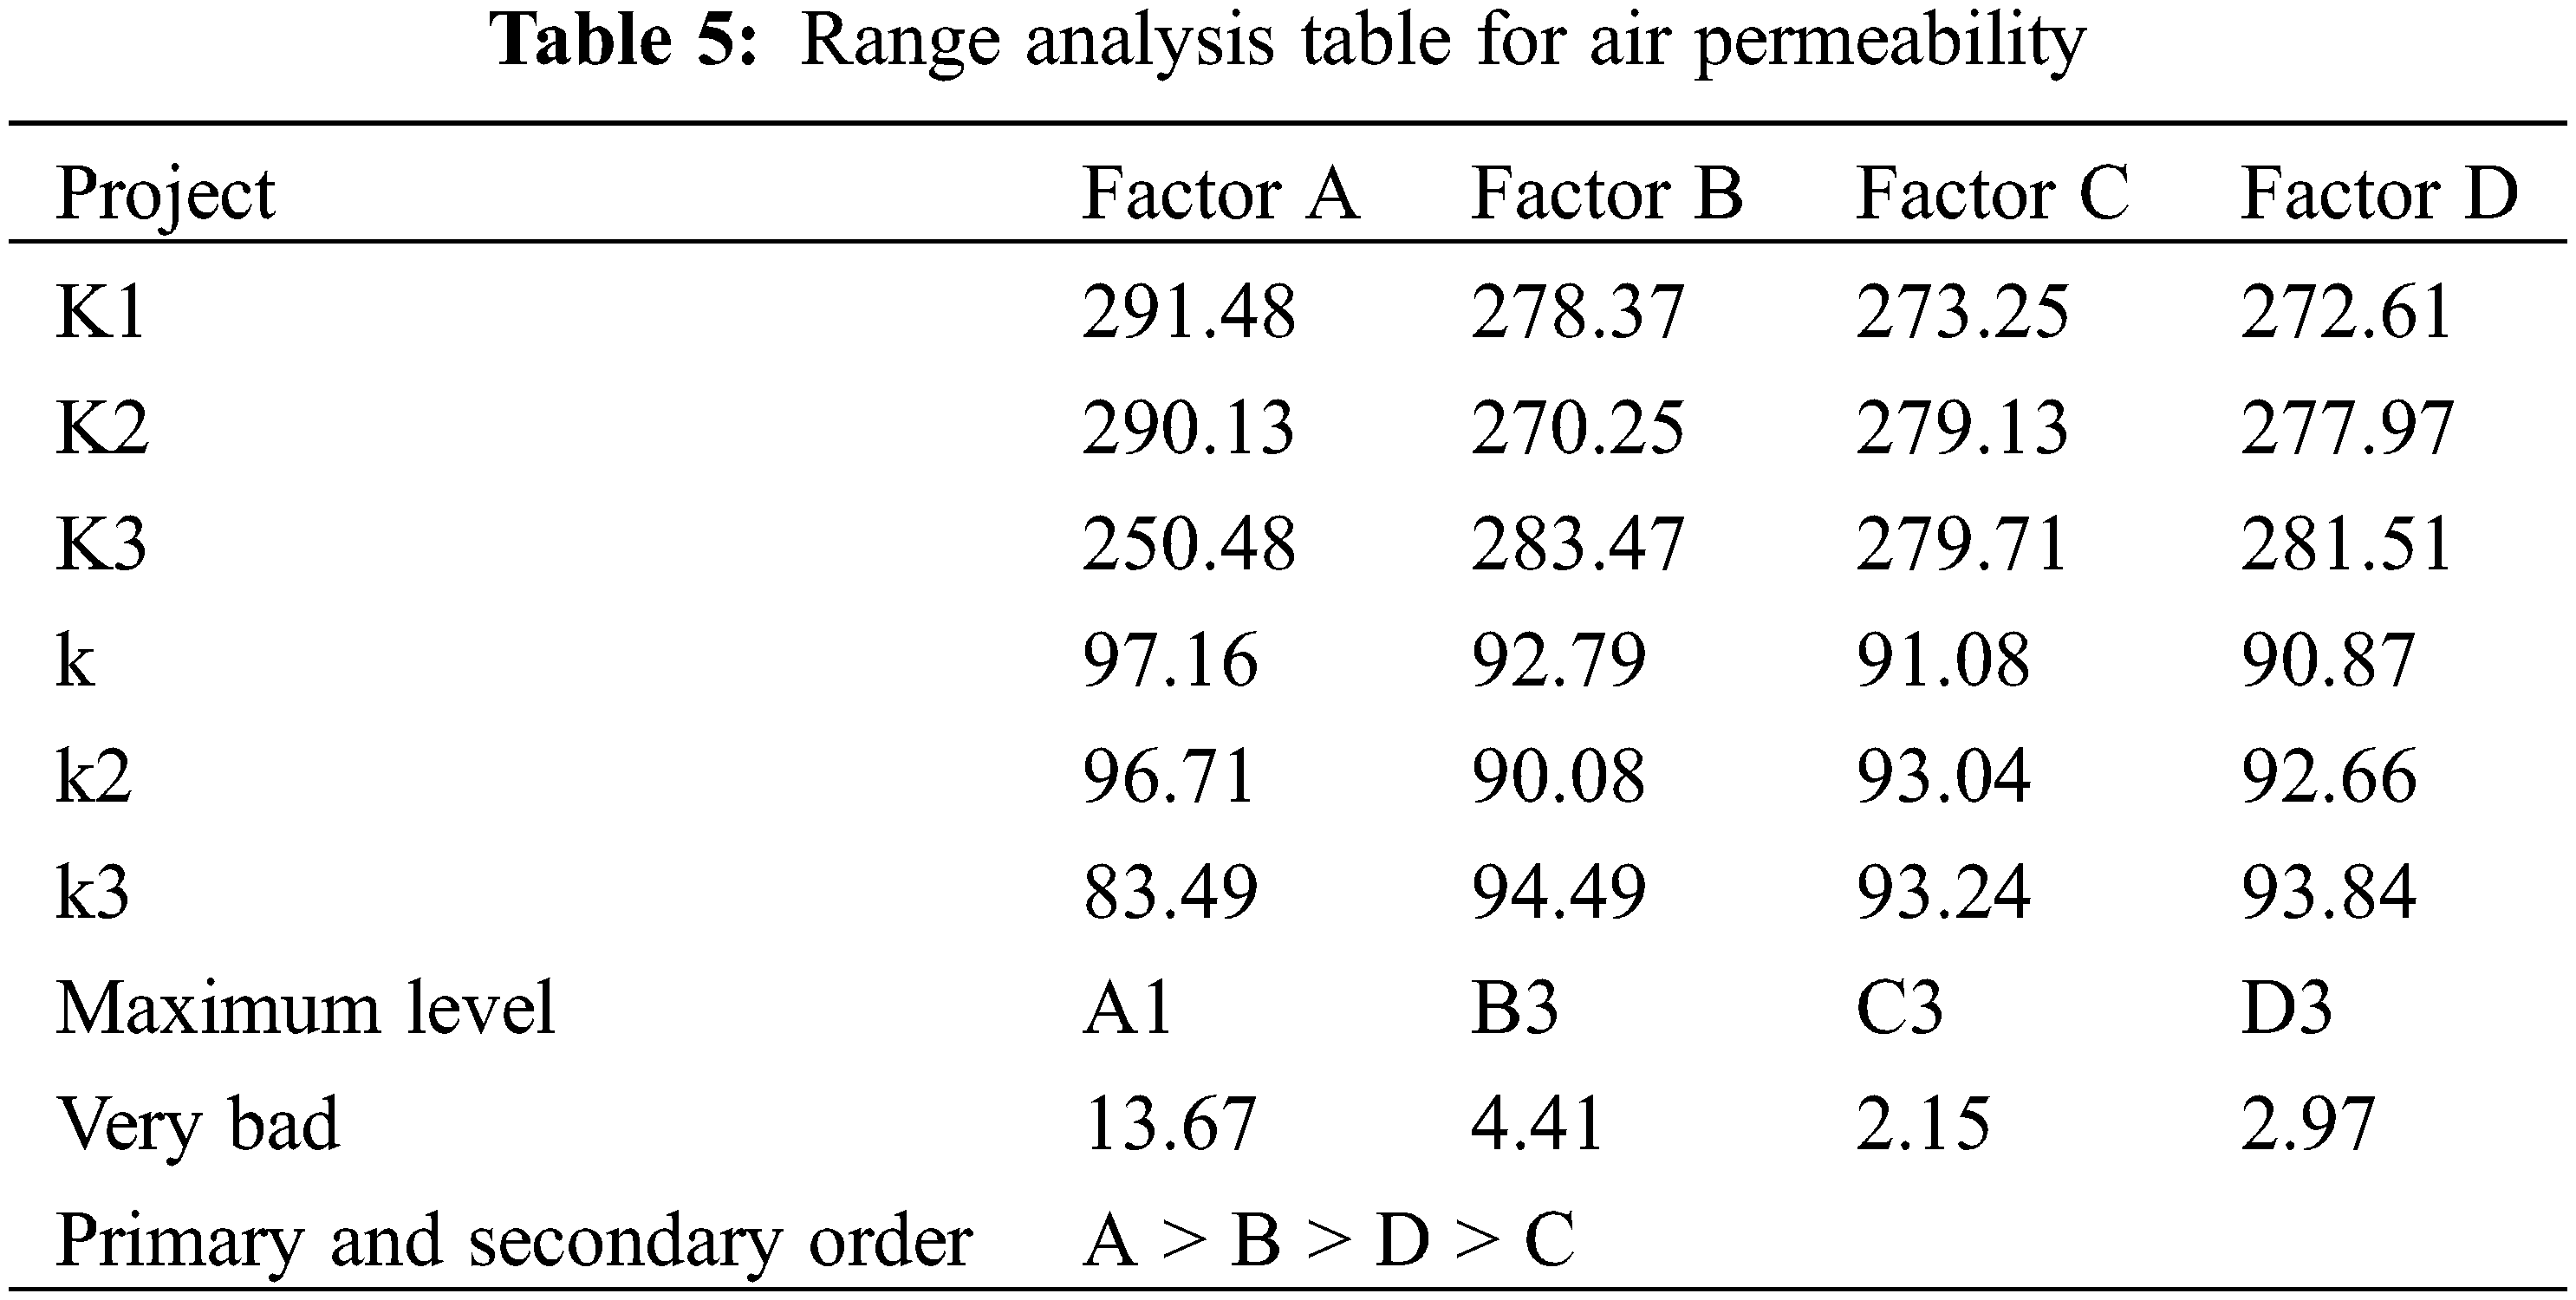
The surface density of the web is the primary factor affecting the air permeability, followed by the hot rolling temperature. The hot rolling pressure and time have a little effect on the air permeability. The air permeability of the fiber membrane shows a decreasing trend with the increase of the surface density of the fiber web. The greater the surface density of the web, the more fiber is filled per unit volume [14]. The smaller the voids between the fibers, the lower the air permeability. Due to the rupture of the fiber membrane, the dispersibility of the PTFE fiber linear density increases, and the voids in the layer where the thicker fibers are located in the fiber membrane increase. This increases the air permeability of the fiber membrane and reduces filtration resistance. The air permeability of the web is the smallest when the temperature is 340°C. The air permeability reaches its maximum value at the maximum temperature level. The difference between the orthogonal test results in this paper and the expected results may be caused by test errors.
We explore the effects of web surface density, temperature, pressure, and time on pore size. The results are shown in Table 6.
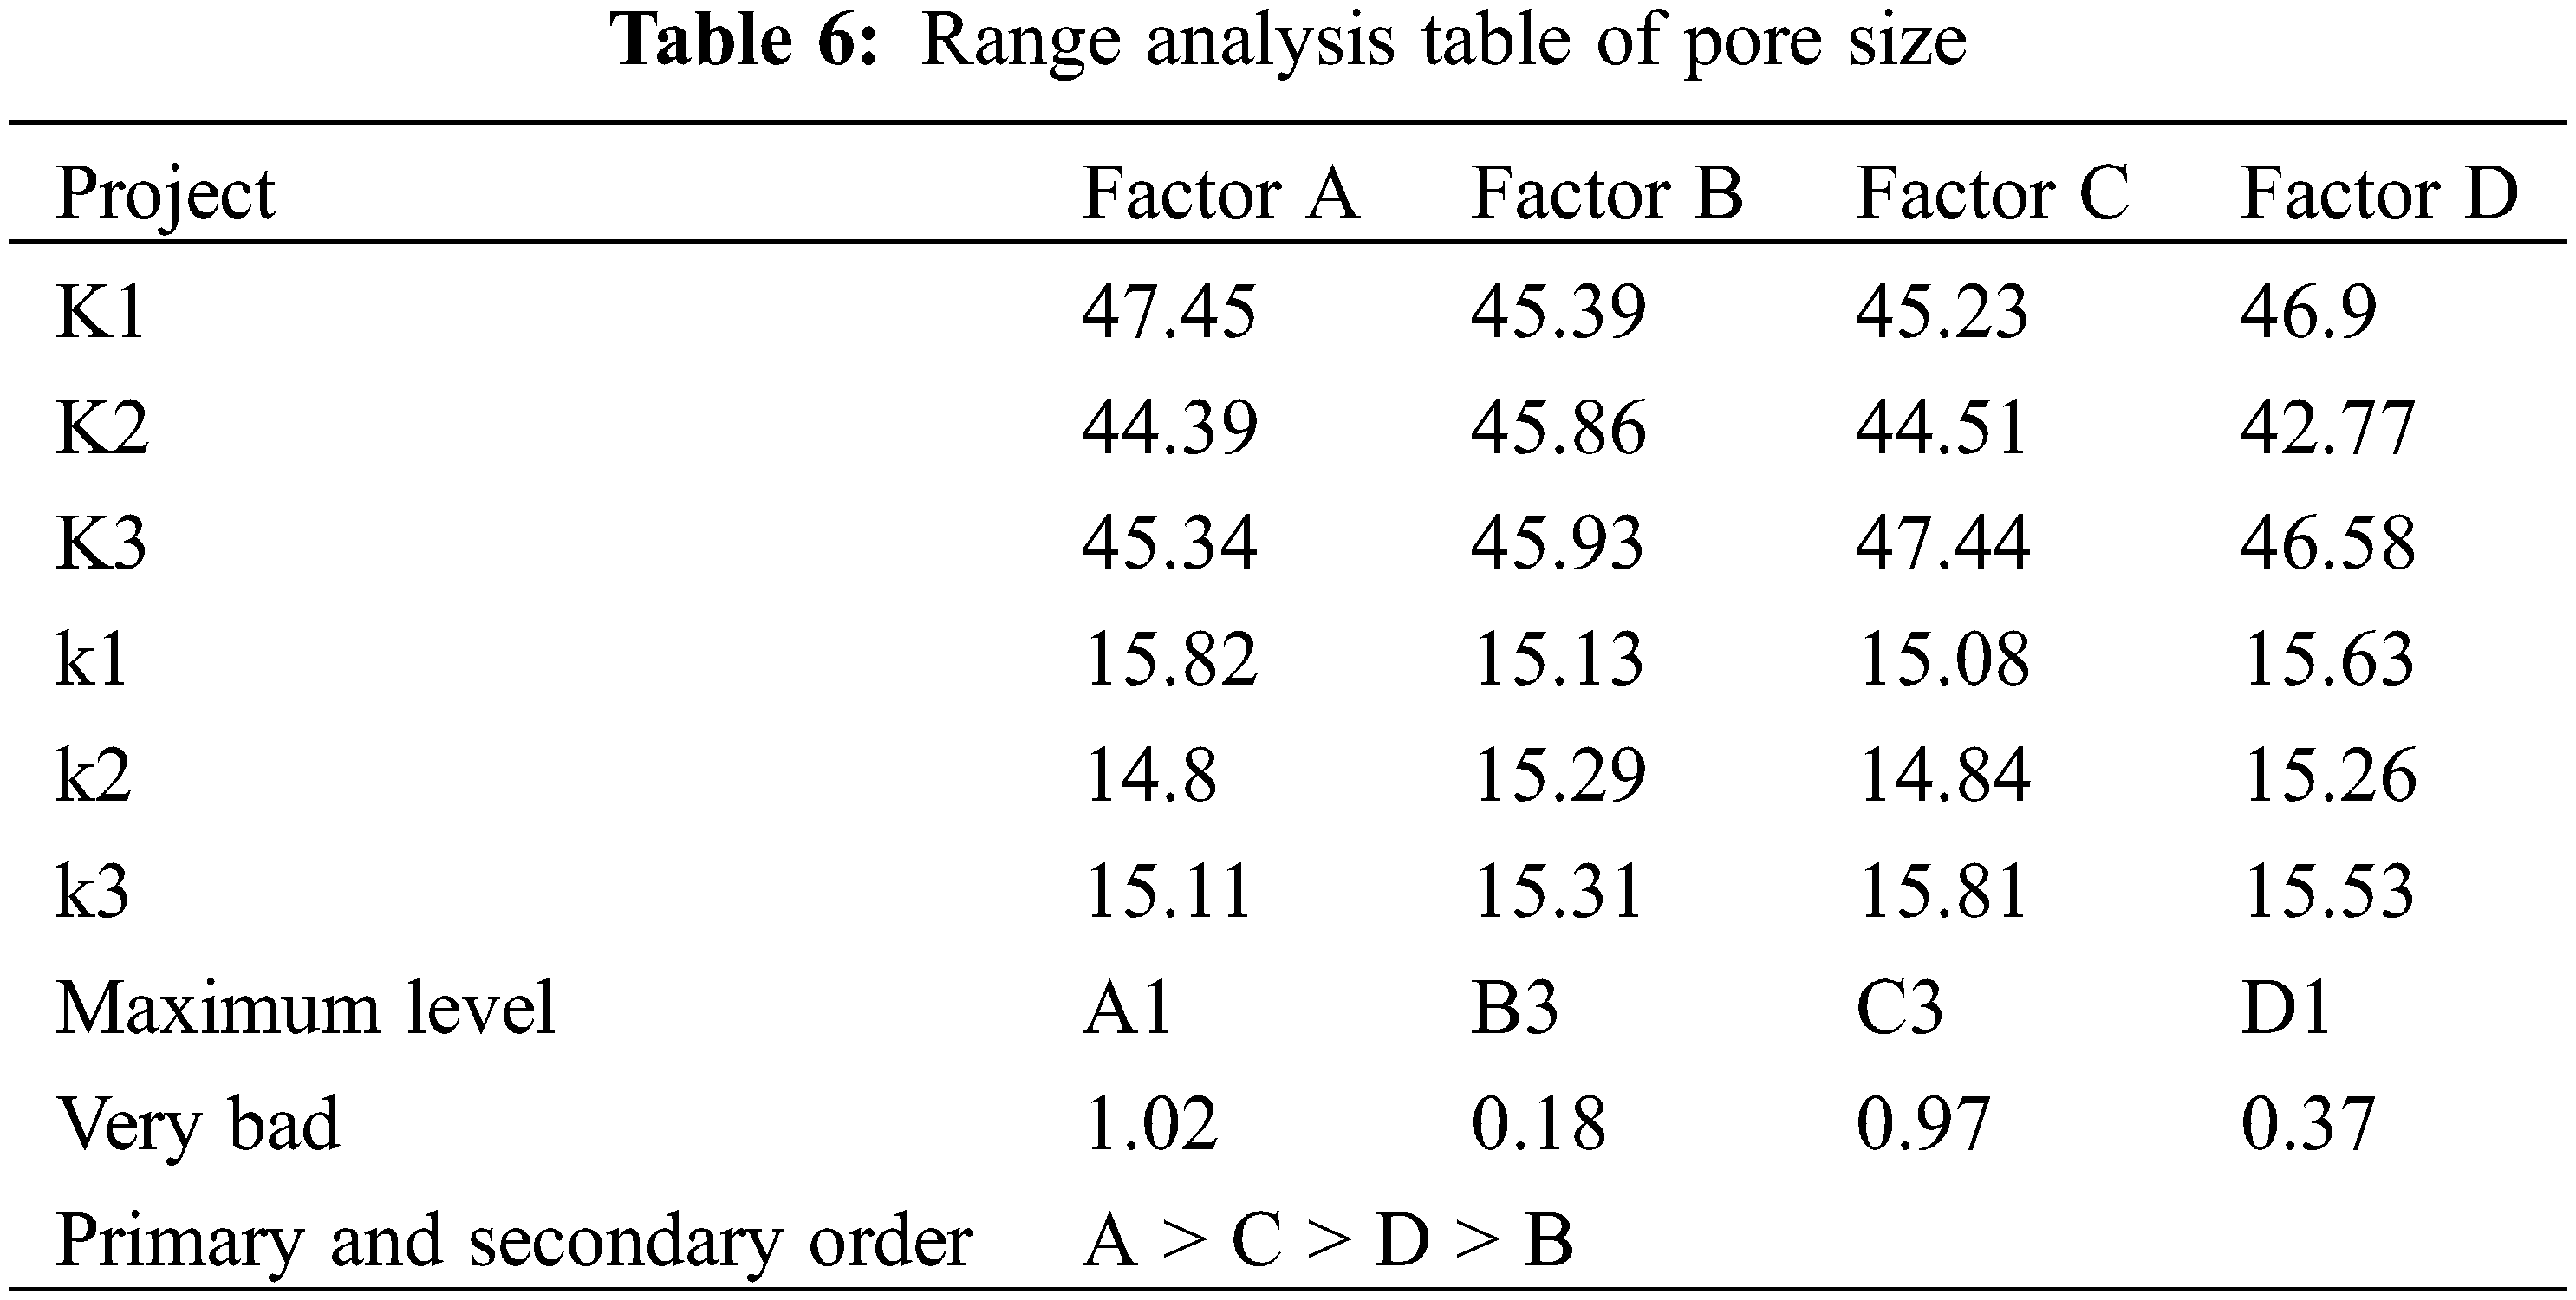
The surface density of the web is the primary factor affecting the hole diameter, followed by the hot rolling pressure. The hot rolling temperature and hot rolling time have a little effect on the hole diameter. As the surface density of the fiber web increases, the pore size of the fiber membrane shows a decreasing trend. The minimum pore size of the fiber membrane appears at the level of (192.5 ± 2.5) g/m2 of the surface density of the fiber web. The largest pore size occurs when the surface density of the web is the smallest. The pore diameter of the fiber membrane shows a slow upward trend with the increase of the hot rolling temperature. The hot rolling temperature has no obvious effect on the pore diameter of the fiber membrane. The minimum pore diameter of the fiber membrane appears under the condition of a hot rolling pressure of 2.0 MPA. The hot rolling pressure greatly influences the change of the pore diameter of the fiber membrane [15]. The minimum pore diameter of the fiber membrane appears when the hot rolling time is 120 s. The hole diameter change trend does not show a certain law with the hot rolling time, so the hot rolling test needs to reasonably control the hot rolling time to reach the minimum hole diameter level. Taking sample 3 as an example, its pore size distribution is shown in Fig. 2. It can be seen from Fig. 2 that the average pore diameter of sample 3 is 13.47 μm.
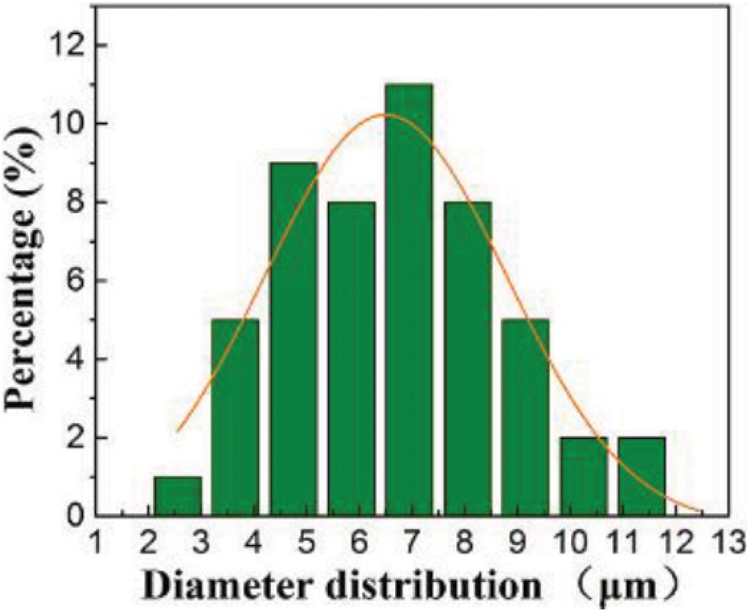
Figure 2: Pore size distribution diagram of sample 3
We choose porosity as a reference index to explore the influence of web surface density, temperature, pressure, and time on porosity. The results are shown in Table 7.
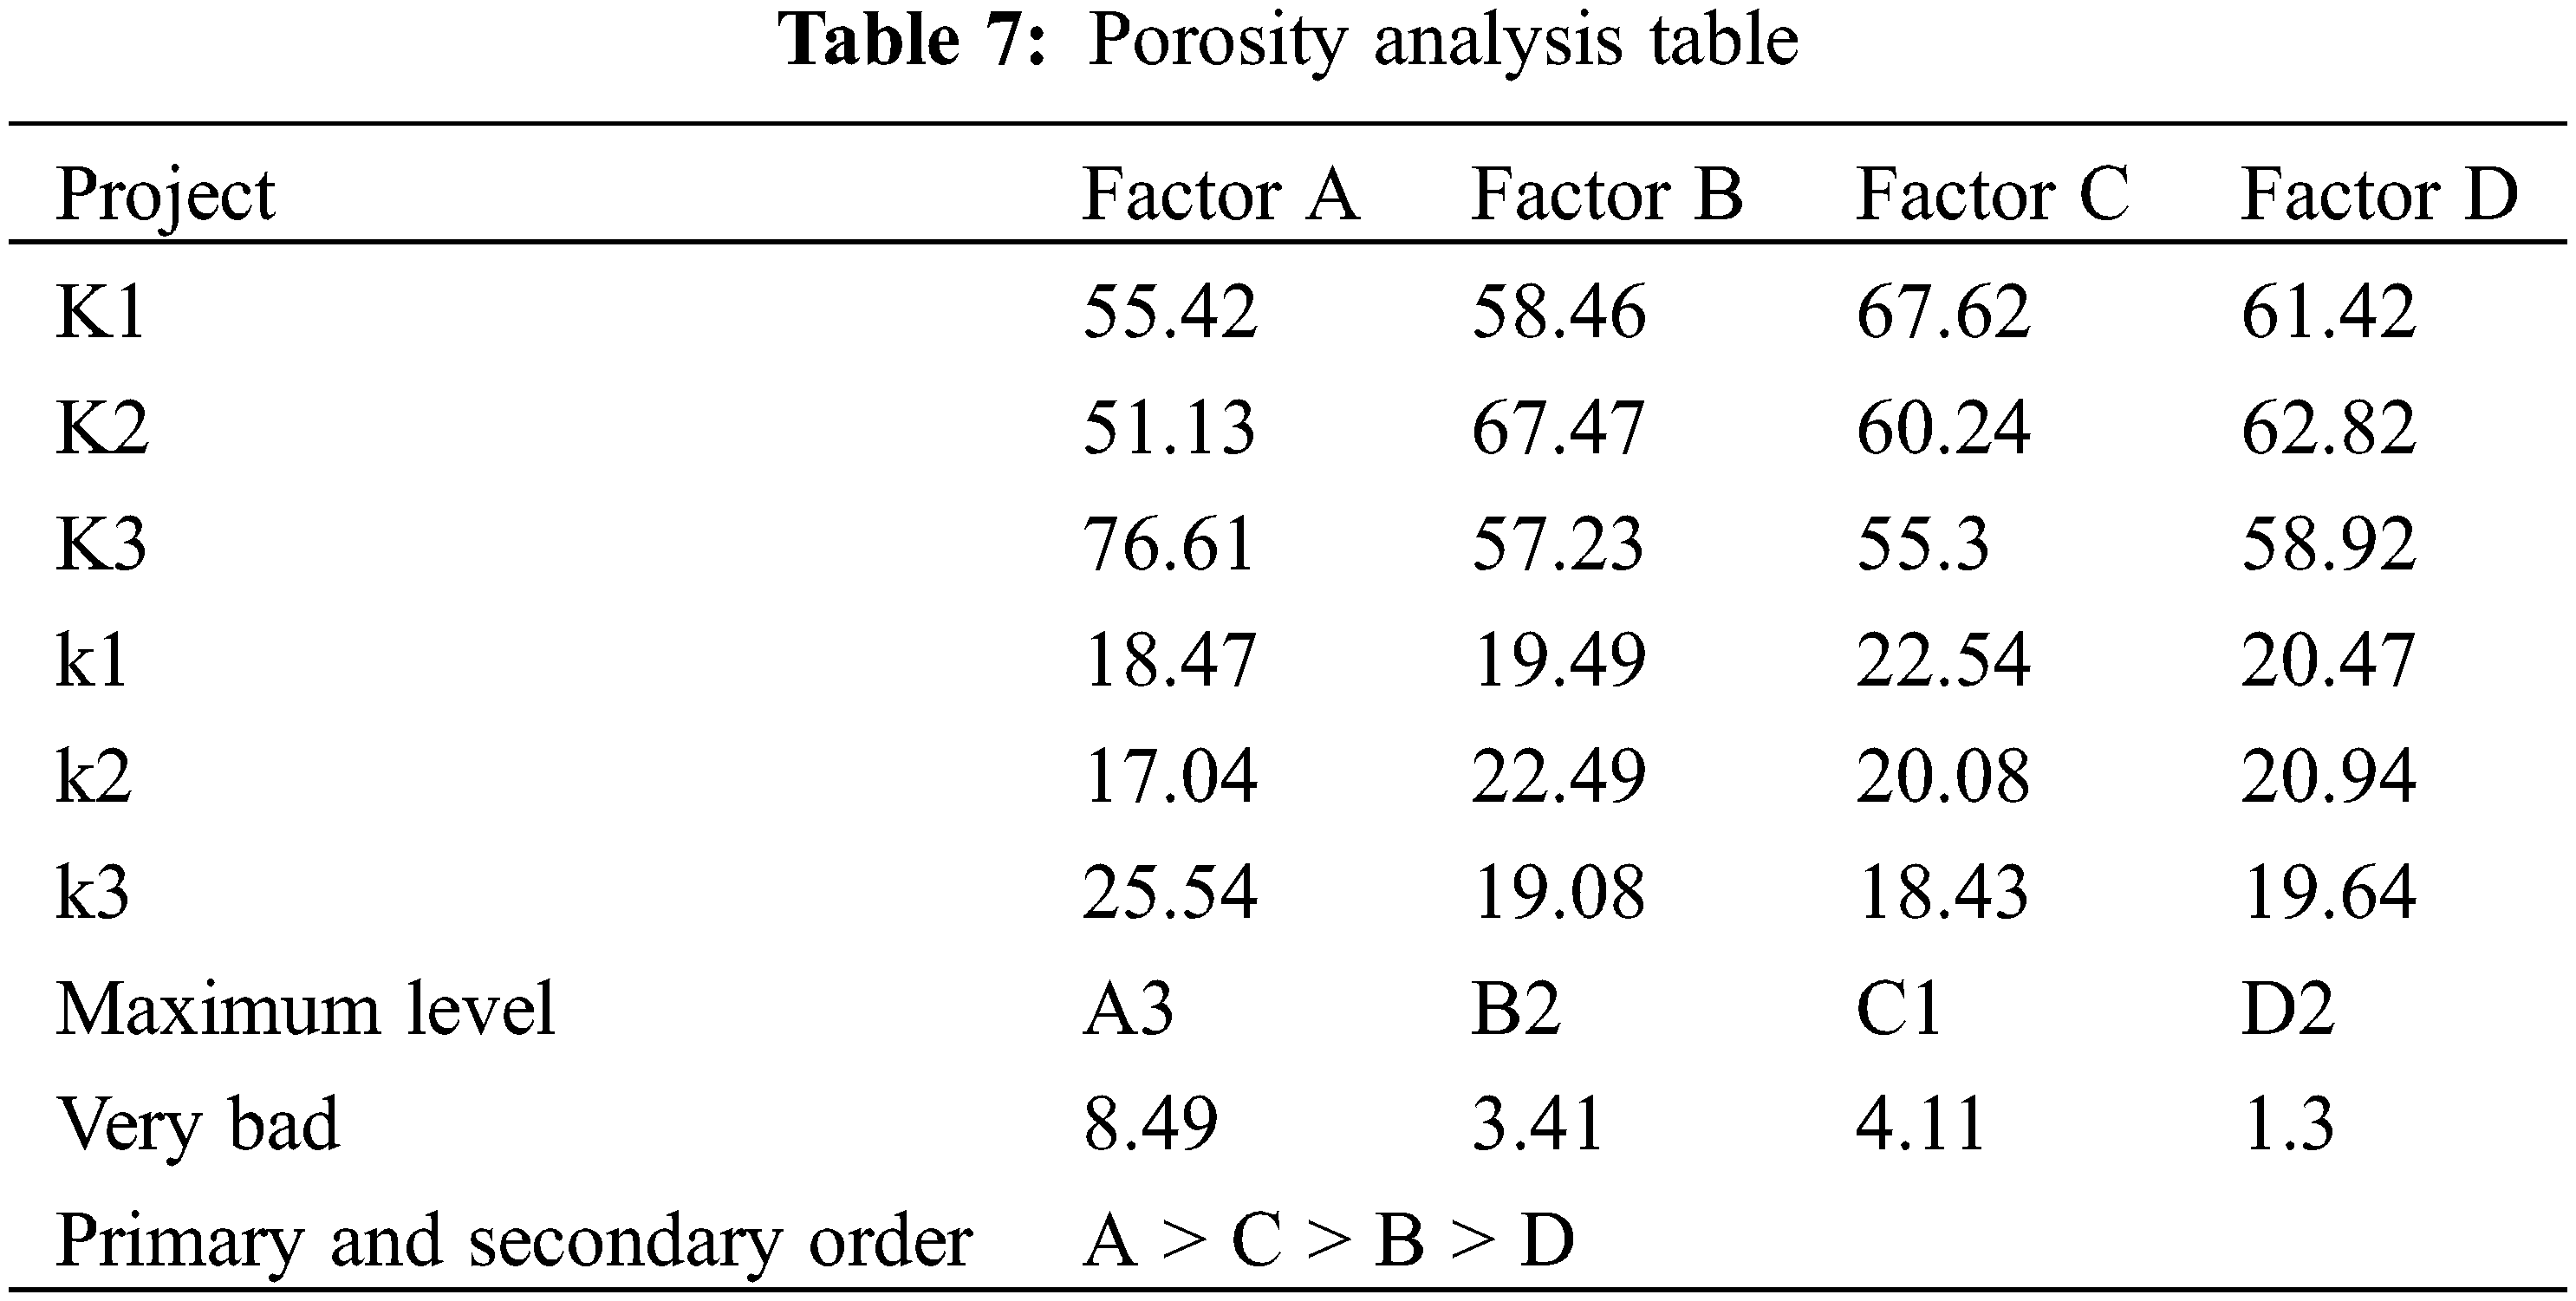
The surface density of the fiber web is also the primary factor affecting the porosity of the fiber membrane, followed by the hot rolling pressure and temperature. The effect of hot rolling time on porosity is still slightly small. As the surface density of the fiber web increases, the porosity of the fiber membrane becomes smaller [16]. Therefore, the filtration performance of the fiber membrane still mainly depends on the areal density of the fiber web and the average degree of dispersion of the areal density. The minimum porosity of the fiber membrane appears when the surface density of the fiber web is (192.5 ± 2.5) g/m2. The minimum porosity of fiber membranes appears at the maximum level of hot rolling temperature and pressure. Under higher temperature and higher pressure, the tighter the inter-fiber bonding in the fiber membrane will decrease the porosity.
We choose breaking strength as a reference index to explore the influence of web surface density, temperature, pressure, and time on tensile properties. The test results are shown in Table 8.
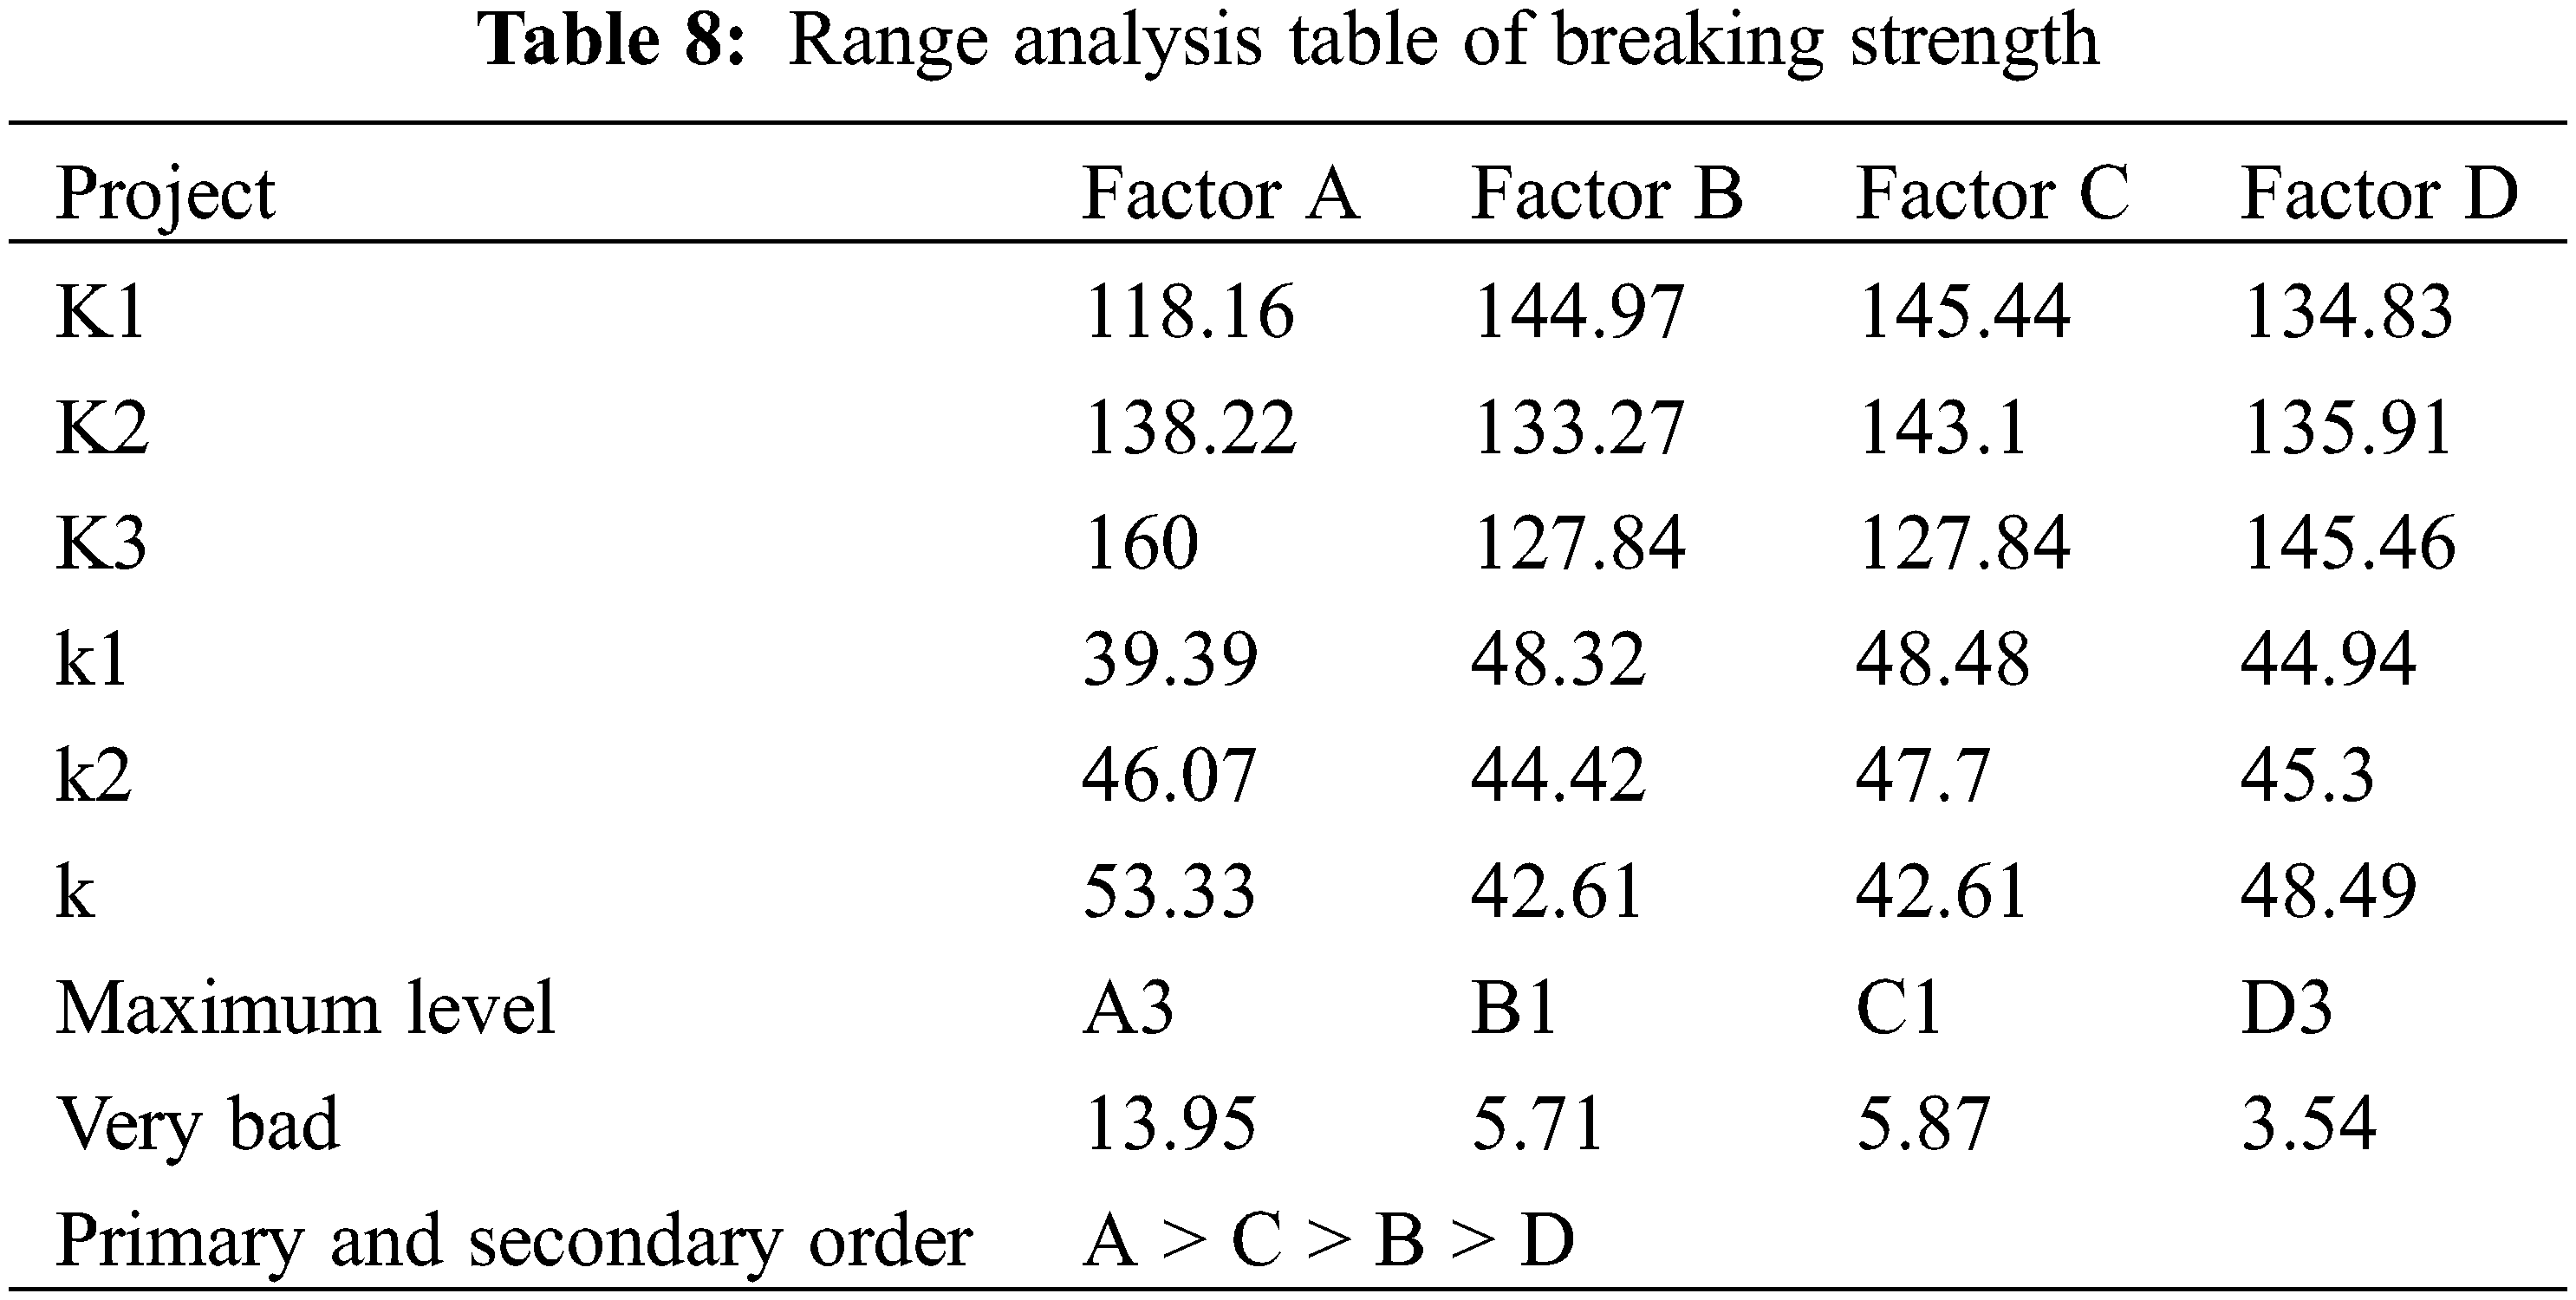
The surface density of the web is also the primary factor affecting the breaking strength, followed by the hot rolling pressure. The effect of hot rolling temperature and time on the tensile properties is still slightly smaller. As the surface density of the web increases, the breaking strength becomes greater. This is because the greater the fiber web’s surface density, the greater the number of fibers per unit volume, and the stronger the entanglement between the fibers. The greater the cohesive force between the fibers at the fracture when the fiber membrane is tensile fractured [17]. The breaking strength of the fiber membrane decreases with the increase of the hot rolling temperature and the higher the hot rolling temperature. The greater the plastic deformation on the surface of the fiber membrane, the worse its flexibility. The fibrous membrane is easier to rupture under the action of external force. Therefore, preparing a lighter and thinner fiber web is the key to obtaining a good-performance PTFE hot-rolled fiber membrane. The hot rolling pressure and time have little effect on the tensile properties of the fiber membrane. The maximum tensile strength appears when the hot rolling pressure is 2.0 MPA and the hot rolling time is 150 s. Therefore, it is still necessary to reasonably control the hot rolling pressure and time in the actual preparation.
4.6.1 Unidirectional Tensile Properties
The sample’s tensile stress and strain curve is shown in Fig. 3. It can be seen from the figure that the tensile strength of the sample decreases as the size of the cut increases [18]. This indicates that the presence of the pre-cut will degrade the tensile strength of the material. This is mainly due to the decrease in the number of yarns that can be carried within the ligament width
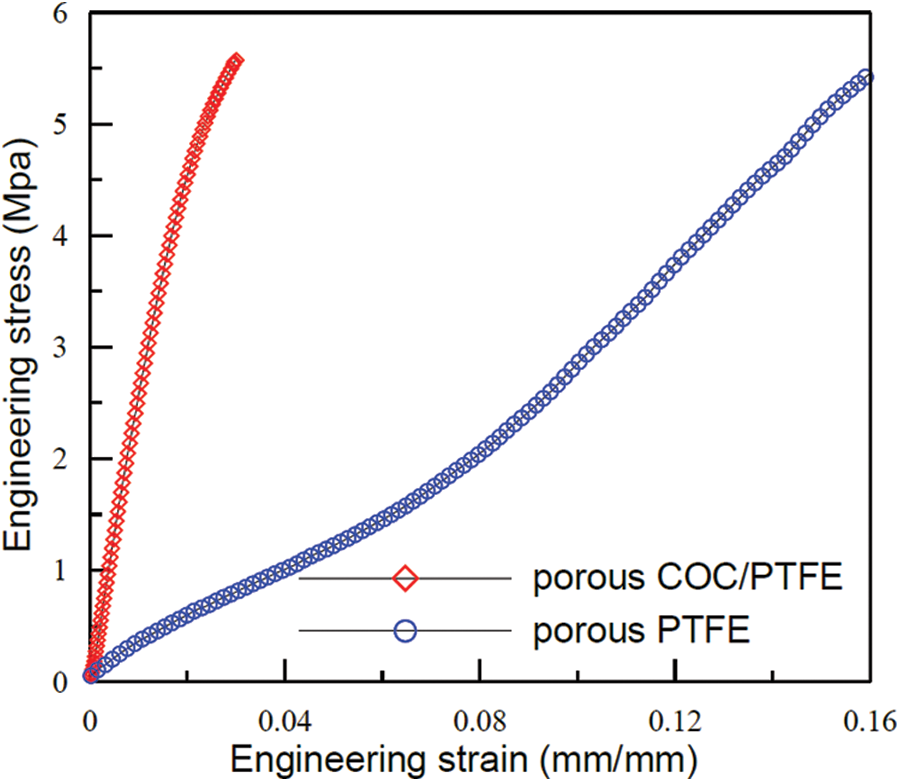
Figure 3: Tensile stress and strain curve of a specimen
Suppose dimension
The stress in zone A can be expressed as
When the net notch stress remains unchanged, it can be considered that the size of the plastic deformation zone at the root of the notch remains unchanged [20]. The relationship between the total strain
The creep strain can be expressed as
In the formula:
The short-term creep curves of the non-destructive and notched specimens under different net notch creep stress conditions are shown in Fig. 4. It can be seen from the figure that the creep curves of the non-destructive and damaged specimens all reflect the characteristics of the initial creep stage and the constant velocity creep stage. Creep deformation is slower under low-stress conditions [21]. As the creep stress increases, the creep deformation accelerates. Fig. 4 also shows that the creep of the notched specimen is smaller than that of the nondestructive specimen under the same creep stress. As the size of the incision increases, the number of creep decreases [22]. We believe that this is mainly due to the difference between the tensile modulus of the non-destructive and notched specimens.
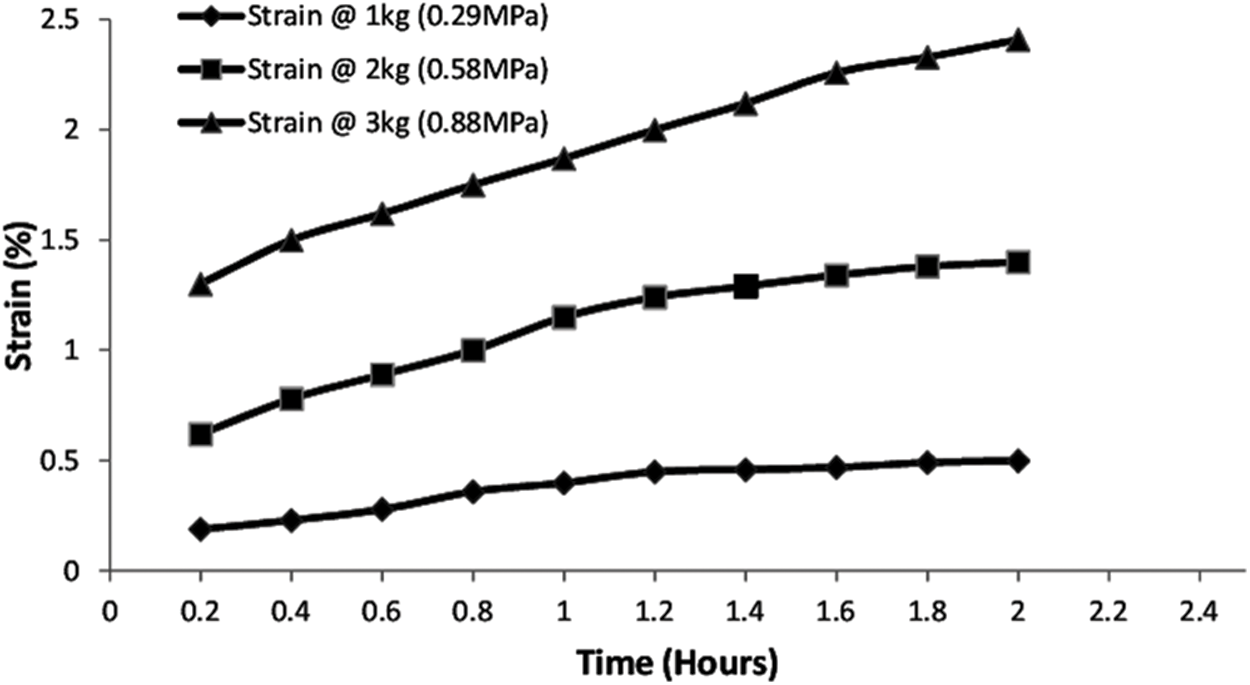
Figure 4: Typical creep curve of the specimen
We use the least square method to fit and analyze the measured data of different notch size specimens under different creep stresses [23]. Fig. 5 shows the fitting diagrams of typical non-destructive specimens and notched specimens. It can be seen from the figure that the fitting coefficient square
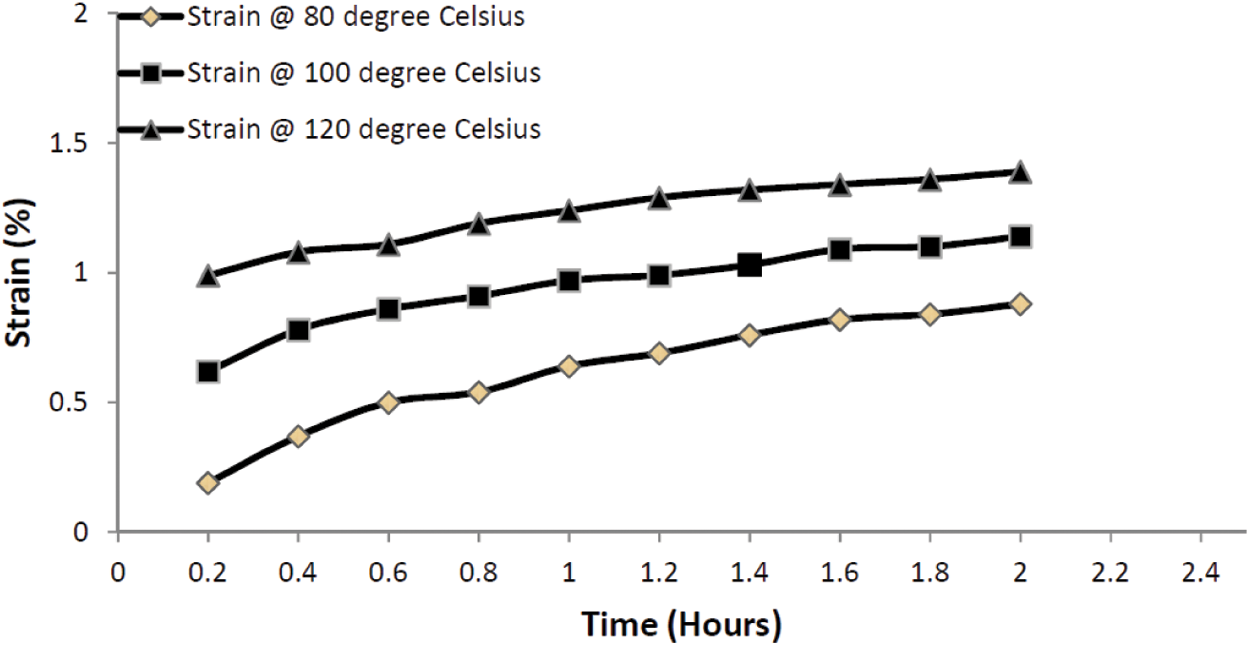
Figure 5: Fitting curve graph of creep data of a typical specimen
When time
This shows that the fitting parameter
Figure 6: Trend of initial creep strain vs. creep stress
Fig. 7 shows that the initial creep strain increases with the creep stress under the same notch size. Under the same creep stress, the initial creep strain of notched specimens is smaller than that of non-destructive specimens. It decreases as the size of the incision increases [25,26]. This is mainly due to the difference in the secant modulus under the notch and the applied stress. Secant modulus is defined as the ratio of tensile stress to its corresponding strain at a certain moment. The secant modulus of the specimen under different stresses is denoted by
Figure 7: The relationship between secant modulus and creep stress of notched specimens
Under the same stress, the secant modulus of the sample increases with the increase of the notch size. It can be seen from formula (9) that under the same creep stress condition, the initial creep amount decreases with the increase of the secant modulus. Under the condition of the same net notch creep stress, the initial creep of the sample decreases with the increase of notch size [27]. The secant modulus change trend shows a coupling relationship between initial creep stress and notch size and secant modulus.
4.6.5 Slow Elastic Deformation
The relationship between the slow elastic deformation reflecting the change of the deformation of the material is shown in Fig. 8.
Figure 8: Fitting parameter C and delay time change trend with creep stress
We usually use the delay time
The delay time
4.7 Resistance to Acid and Alkali Corrosion
PTFE material has good acid and alkali corrosion resistance [29]. This article chooses sample 1. The breaking strength and retention rate after treatment with 30% and 60%
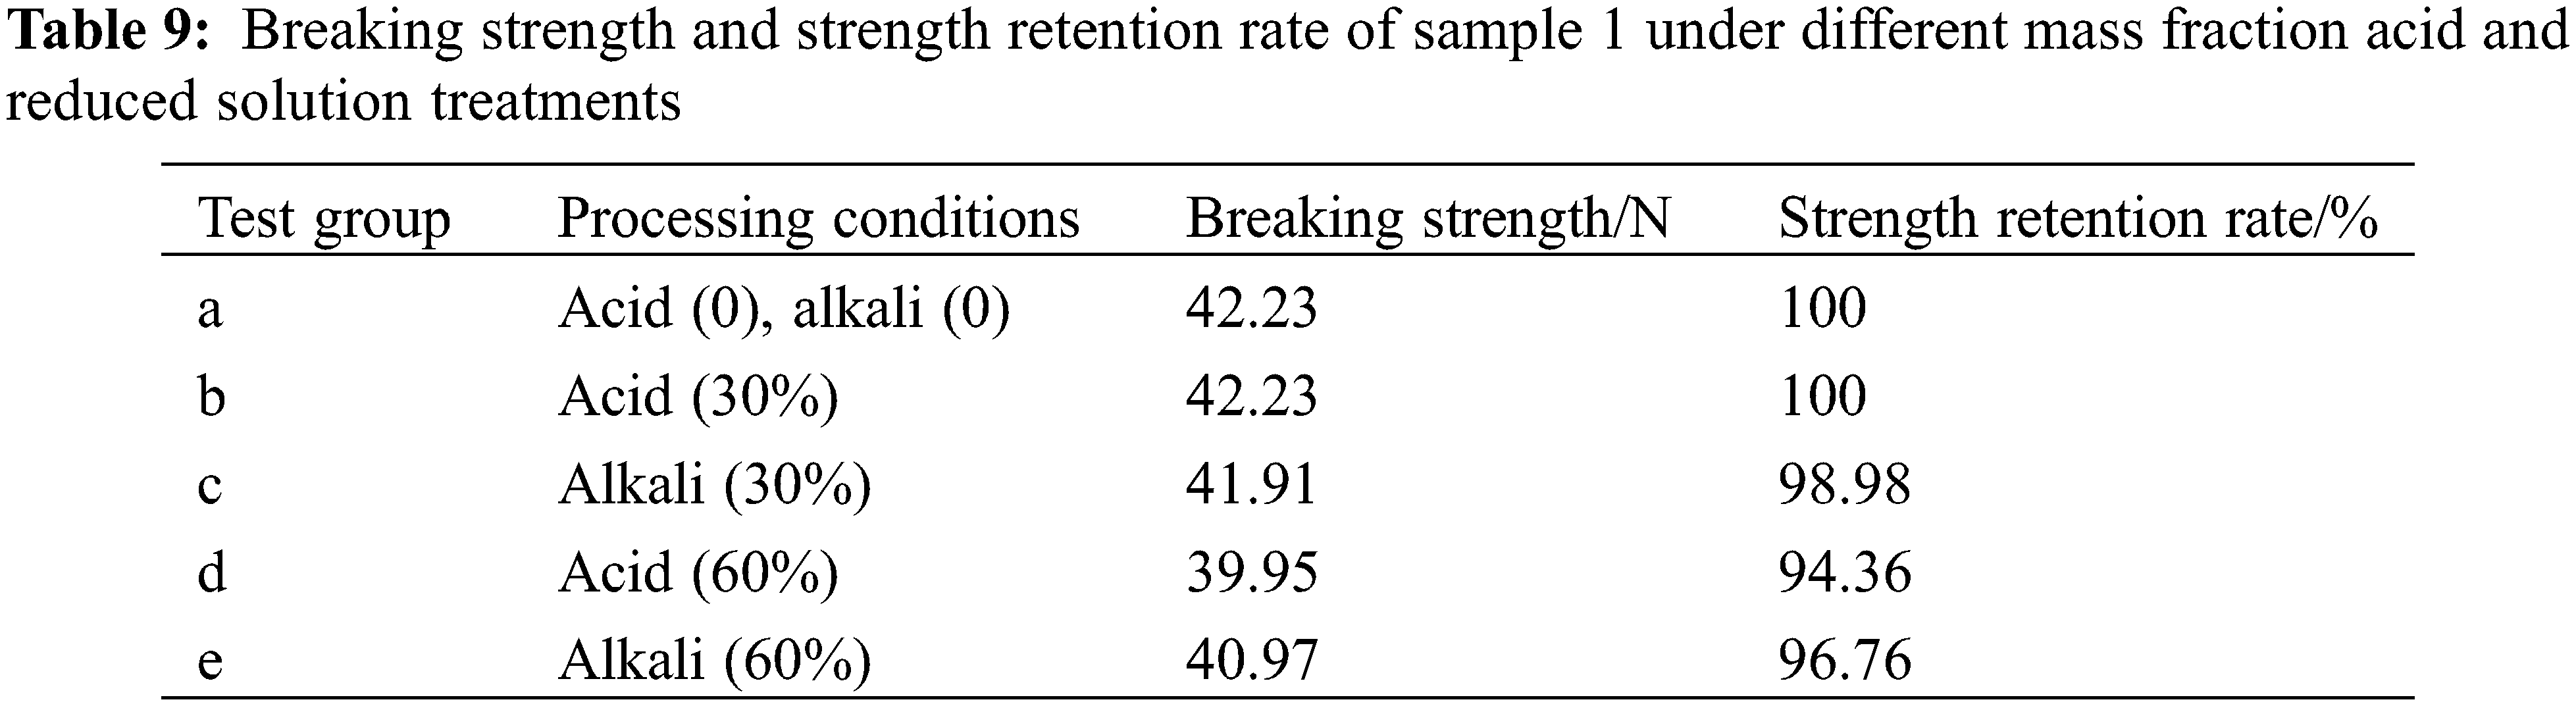
It can be seen from Table 9 that the strength retention rate of the fiber membrane after treatment with 30% and 60%
We use PTFE fiber as raw material. At the same time, we prepared 9 kinds of PTFE hot-rolled fiber membranes by the hot-rolling process. The structure and performance test results show that the thickness of the fiber membrane is 0.12–0.15 mm, the air permeability is 80–101 mm/s, the pore size is 14–17 μm, the porosity is 14.57%–27.04%, the breaking strength is 38–59 N, the elongation at break is 30%–38%. Many fibrous structures still exist, in addition to the phenomenon of fiber melting on the part of the surface. After the fiber membrane is treated with 30% and 60%
Funding Statement: (1) 2022 9th Youth Teaching and Scientific Research Double Backbone Project of Gansu Normal College for Nationalities: From Governance to Good Governance: Research on the Innovative Governance Path of Gansu Urban and Rural Sports Fitness Order. GSMYSGG 2022-10; (2) 2022 Gansu Sports Scientific Research and Decision-Making Consulting Research Project: Research on the Evaluation System of Free and Low-Cost Opening of Public Sports Venues in Gansu Province.
Conflicts of Interest: The authors declare that they have no conflicts of interest to report regarding the present study.
References
1. Mpofu, N. S., Mwasiagi, J. I., Nkiwane, L. C., Njuguna, D. (2019). Use of regression to study the effect of fabric parameters on the adhesion of 3D printed PLA polymer onto woven fabrics. Fashion and Textiles, 6(1), 24. DOI 10.1186/s40691-019-0180-6. [Google Scholar] [CrossRef]
2. Bhuiyan, M. R., Wang, L., Shanks, R. A., Ding, J. (2019). Polyurethane-superabsorbent polymer-coated cotton fabric for thermophysiological wear comfort. Journal of Materials Science, 54(12), 9267–9281. DOI 10.1007/s10853-019-03495-8. [Google Scholar] [CrossRef]
3. Yu, Z., Suryawanshi, A., He, H., Liu, J., Li, Y. et al. (2020). Preparation and characterisation of fire-resistant PNIPAAm/SA/AgNP thermosensitive network hydrogels and laminated cotton fabric used in firefighter protective clothing. Cellulose, 27(9), 5391–5406. DOI 10.1007/s10570-020-03146-1. [Google Scholar] [CrossRef]
4. Dolezal, I., Hes, L., Bal, K. (2019). A non-destructive single plate method for measurement of thermal resistance of polymer sheets and fabrics. Inter Journal of Occupational Safety and Ergonomics, 25(4), 562–567. DOI 10.1080/10803548.2018.1477247. [Google Scholar] [CrossRef]
5. Bhuiyan, M. R., Wang, L., Shaid, A., Shanks, R. A., Ding, J. (2019). Advances and applications of chemical protective clothing system. Journal of Industrial Textiles, 49(1), 97–138. DOI 10.1177/1528083718779426. [Google Scholar] [CrossRef]
6. Kaviani, S., Mohammadi Ghaleni, M., Tavakoli, E., Nejati, S. (2019). Electroactive and conformal coatings of oxidative chemical vapor deposition polymers for oxygen electroreduction. ACS Applied Polymer Materials, 1(3), 552–560. DOI 10.1021/acsapm.8b00240. [Google Scholar] [CrossRef]
7. Kim, H., Kim, H. S., Lee, S. (2020). Thermal insulation property of graphene/polymer coated textile based multi-layer fabric heating element with aramid fabric. Scientific Reports, 10(1), 1–12. DOI 10.1038/s41598-020-74339-8. [Google Scholar] [CrossRef]
8. Agrawal, N., Low, P. S., Tan, J. S. J., Fong, E. W. M., Lai, Y. et al. (2020). Durable easy-cleaning and antibacterial cotton fabrics using fluorine-free silane coupling agents and CuO nanoparticles. Nano Materials Science, 2(3), 281–291. DOI 10.1016/j.nanoms.2019.09.004. [Google Scholar] [CrossRef]
9. Yu, Z., Liu, J., Suryawanshi, A., He, H., Wang, Y. et al. (2021). Thermal insulating and fire-retarding behavior of treated cotton fabrics with a novel high water-retaining hydrogel used in thermal protective clothing. Cellulose, 28(4), 2581–2597. DOI 10.1007/s10570-021-03696-y. [Google Scholar] [CrossRef]
10. Haque, M. (2019). Nano Fabrics in the 21st century: A review. Asian Journal of Nanosciences and Materials, 2(2), 131–148. [Google Scholar]
11. Ahmed, M. T., Morshed, M. N., Farjana, S., An, S. K. (2020). Fabrication of new multifunctional cotton—modal—recycled aramid blended protective textiles through deposition of a 3D-polymer coating: High fire retardant, water repellent and antibacterial properties. New Journal of Chemistry, 44(28), 12122–12133. DOI 10.1039/D0NJ02142C. [Google Scholar] [CrossRef]
12. Peng, L., Su, B., Yu, A., Jiang, X. (2019). Review of clothing for thermal management with advanced materials. Cellulose, 26(11), 6415–6448. DOI 10.1007/s10570-019-02534-6. [Google Scholar] [CrossRef]
13. Memon, A. H., Peerzada, M. H., Brohi, K. M., Memon, S. A., Mangi, S. A. (2020). Performance evaluation of conventional and hybrid woven fabrics for the development of sustainable personal protective clothing. Environmental Science and Pollution Research, 27, 33835–33847. DOI 10.1007/s11356-020-09610-6. [Google Scholar] [CrossRef]
14. Cheng, H. C., Chen, C. R., Hsu, S. H., Cheng, K. B. (2020). The electromagnetic shielding effectiveness of laminated fabrics using electronic printing. Polymer Composites, 41(7), 2568–2577. DOI 10.1002/pc.25555. [Google Scholar] [CrossRef]
15. Lu, Z., Liu, J., Dong, C., Zhang, Z., Wei, D. (2019). Durable multifunctional antibacterial and hydrophobic cotton fabrics modified with linear fluorinated pyridinium polysiloxane. Cellulose, 26(12), 7483–7494. DOI 10.1007/s10570-019-02582-y. [Google Scholar] [CrossRef]
16. Cho, S. H., Lee, J., Lee, M. J., Kim, H. J., Lee, S. M. et al. (2019). Plasmonically engineered textile polymer solar cells for high-performance, wearable photovoltaics. ACS Applied Materials & Interfaces, 11(23), 20864–20872. DOI 10.1021/acsami.9b05048. [Google Scholar] [CrossRef]
17. Ma, N., Lu, Y., He, J., Dai, H. (2019). Application of shape memory materials in protective clothing: A review. The Journal of The Textile Institute, 110(6), 950–958. DOI 10.1080/00405000.2018.1532783. [Google Scholar] [CrossRef]
18. Li, G., Mai, Z., Shu, X., Chen, D., Liu, M. et al. (2019). Superhydrophobic/superoleophilic cotton fabrics treated with hybrid coatings for oil/water separation. Advanced Composites and Hybrid Materials, 2(2), 254–265. DOI 10.1007/s42114-019-00092-w. [Google Scholar] [CrossRef]
19. Song, H., Li, L., Yang, J., Jia, X. (2019). Fabrication of polydopamine-modified carbon fabric/polyimide composites with enhanced mechanical and tribological properties. Polymer Composites, 40(5), 1911–1918. DOI 10.1002/pc.24963. [Google Scholar] [CrossRef]
20. Jhang, J. C., Lin, T. R., Lin, T. A., Chen, Y. S., Lou, C. W. et al. (2020). Adhesion-type composites made of elastic polymer films and high resilience nonwoven fabrics: Manufacturing techniques and property evaluations. Polymer Composites, 41(7), 2768–2776. DOI 10.1002/pc.25574. [Google Scholar] [CrossRef]
21. Aquino, M. S., Holanda, S. M., Santos, T. F., Melo, M. V., Junior, N. D. et al. (2019). Analysis of polymeric knitted fabrics on properties for telecommunications devices application. Fibers and Polymers, 20(11), 2348–2354. DOI 10.1007/s12221-019-8724-3. [Google Scholar] [CrossRef]
22. Kabir, S., Kim, H., Lee, S. (2020). Characterization of 3D printed auxetic sinusoidal patterns/nylon composite fabrics. Fibers and Polymers, 21(6), 1372–1381. DOI 10.1007/s12221-020-9507-6. [Google Scholar] [CrossRef]
23. Daukantienė, V., Danilovas, P. P., Mikalauskaitė, G. (2021). Study of temperature impact on the behavipaper of fibre polymer materials’ and their adhesive bonds. The Journal of The Textile Institute, 112(2), 313–321. DOI 10.1080/00405000.2020.1746011. [Google Scholar] [CrossRef]
24. Yu, X., Li, Y., Wang, X., Si, Y., Yu, J. et al. (2020). Thermoconductive, moisture-permeable, and superhydrophobic nanofibrous membranes with interpenetrated boron nitride network for personal cooling fabrics. ACS Applied Materials & Interfaces, 12(28), 32078–32089. DOI 10.1021/acsami.0c04486. [Google Scholar] [CrossRef]
25. Qiu, K., Elhassan, A., Tian, T., Yin, X., Yu, J. et al. (2020). Highly flexible, efficient, and sandwich-structured infrared radiation heating fabric. ACS Applied Materials & Interfaces, 12(9), 11016–11025. DOI 10.1021/acsami.9b23099. [Google Scholar] [CrossRef]
26. Zangmeister, C. D., Radney, J. G., Vicenzi, E. P., Weaver, J. L. (2020). Filtration efficiencies of nanoscale aerosol by cloth mask materials used to slow the spread of SARS-CoV-2. ACS Nano, 14(7), 9188–9200. DOI 10.1021/acsnano.0c05025. [Google Scholar] [CrossRef]
27. Lee, D. T., Jamir, J. D., Peterson, G. W., Parsons, G. N. (2020). Protective fabrics: Metal-organic framework textiles for rapid photocatalytic sulfur mustard simulant detoxification. Matter, 2(2), 404–415. DOI 10.1016/j.matt.2019.11.005. [Google Scholar] [CrossRef]
28. Jones, M., Gandia, A., John, S., Bismarck, A. (2021). Leather-like material biofabrication using fungi. Nature Sustainability, 4(1), 9–16. DOI 10.1038/s41893-020-00606-1. [Google Scholar] [CrossRef]
29. Wang, Q., Zhu, X., Zhu, P., Jiang, Z. (2019). N-halamine antibacterial cellulose fabrics functionalized with copoly (acrylamide-maleic anhydride). Fibers and Polymers, 20(5), 906–912. DOI 10.1007/s12221-019-8865-4. [Google Scholar] [CrossRef]
30. Kim, J. H., Lee, H., Lee, J. S., Kim, I. S. (2020). Preparation and characterization of Juniperus chinensis extract-loaded polyurethane nanofiber laminate with polyurethane resin on polyethylene terephthalate fabric. Polymer Bulletin, 77(2), 919–928. DOI 10.1007/s00289-019-02771-6. [Google Scholar] [CrossRef]
Cite This Article
 Copyright © 2023 The Author(s). Published by Tech Science Press.
This work is licensed under a Creative Commons Attribution 4.0 International License , which permits unrestricted use, distribution, and reproduction in any medium, provided the original work is properly cited.
 Downloads
 Citation Tools